
Estimating Carbon Sink Strength of Norway Spruce Forests Using Machine Learning

Department of Biogeochemistry and Soil Quality, Division of Environment and Natural Resources, Norwegian Institute of Bioeconomy Research, Høgskoleveien 8, 1433 Ås, Norway
*
Author to whom correspondence should be addressed.
Forests 2022, 13(10), 1721; https://doi.org/10.3390/f13101721
Submission received: 16 September 2022
/
Revised: 13 October 2022
/
Accepted: 17 October 2022
/
Published: 19 October 2022
(This article belongs to the Section Forest Inventory, Modeling and Remote Sensing)
Abstract
:Forests sequester atmospheric carbon dioxide (CO2) which is important for climate mitigation. Net ecosystem production (NEP) varies significantly across forests in different regions depending on the dominant tree species, stand age, and environmental factors. Therefore, it is important to evaluate forest NEP and its potential changes under climate change in different regions to inform forestry policy making. Norway spruce (Picea abies) is the most prevalent species in conifer forests throughout Europe. Here, we focused on Norway spruce forests and used eddy covariance-based observations of CO2 fluxes and other variables from eight sites to build a XGBoost machine learning model for NEP estimation. The NEP values from the study sites varied between −296 (source) and 1253 (sink) g C m−2 yr−1. Overall, among the tested variables, air temperature was the most important factor driving NEP variations, followed by global radiation and stand age, while precipitation had a very limited contribution to the model. The model was used to predict the NEP of mature Norway spruce forests in different regions within Europe. The NEP median value was 494 g C m−2 yr−1 across the study areas, with higher NEP values, up to >800 g C m−2 yr−1, in lower latitude regions. Under the “middle-of-the-road” SSP2-4.5 scenario, the NEP values tended to be greater in almost all the studied regions by 2060 with the estimated median of NEP changes in 2041–2060 to be +45 g C m−2 yr−1. Our results indicate that Norway spruce forests show high productivity in a wide area of Europe with potentially future NEP enhancement. However, due to the limitations of the data, the potential decrease in NEP induced by temperature increases beyond the photosynthesis optima and frequent ecosystem disturbances (e.g., drought, bark beetle infestation, etc.) still needs to be evaluated.
1. Introduction
Forests sequester atmospheric carbon dioxide (CO2) and play an important role in climate change mitigation (e.g., [1]). Globally, net ecosystem production (NEP), which indicates the net CO2 sequestration rate of an ecosystem, varies significantly across forests in different regions depending on the dominant tree species, stand ages, and other environmental factors (including the climate, water availability and soil properties). Forest NEP is determined by two main processes, CO2 uptake through photosynthesis and CO2 emission through ecosystem respiration. These two processes are strongly driven by climate factors. As the energy source, radiation has a significant influence on photosynthesis, and thus, NEP and a non-rectangular hyperbolic equation are normally used to describe the relationships between irradiance and photosynthesis/NEP [2]. Air temperature is an important factor that affects both photosynthesis and ecosystem respiration. While respiration shows an exponential increase with an increase in temperature (as expressed through Q10 models [3]), the relationship between photosynthesis and temperature is usually described by a parabola [4], where the photosynthesis peaks at a certain temperature, beyond which a decline in photosynthesis weakens NEP [5,6,7,8]. Water availability is another factor that affects both photosynthesis and respiration, especially during drought when available water in soil drops below a certain threshold. Drought can cause stomatal closure and metabolism impairment that reduces plant photosynthetic and autotrophic respiratory rates [9]. At the same time, soil drought can also decrease soil heterotrophic respiration [10]. The decline in photosynthesis is usually more significant than that of ecosystem respiration during drought, leading to a reduction in NEP [11,12].
In addition to the impacts of climate, photosynthesis and ecosystem respiration are both known to be dependent on stand age. Photosynthesis under light-saturated conditions shows steep increases with age in young stands until reaching a peak when the stand matures [13,14]. Following the peak, a gradual decline in photosynthesis is often observed as a stand ages. This pattern is largely determined by the dominant species [15]. Regarding respiration, on the one hand, many studies have suggested a monotonic increase in respiration cost as a stand ages e.g., [13,16]. On the other hand, given that the carbon (C) consumed for respiration, especially the autotrophic component, is mainly from photosynthesis [17], many studies have reported a similar nonlinear pattern in respiration as those shown in photosynthesis e.g., [18,19]. Due to the different changing dynamics of photosynthetic and respiration rates with stand age, forest NEP also tends to reach an optimum (as C sink) at certain ages, which is followed by a gradual decline over the years [13,18,20,21,22,23].
Given the large spatial and temporal variations of forest CO2 sequestration potentials, it is important to evaluate forest NEP in different regions as well as potential changes in response to future climate change. To investigate forest NEP, process-based models usually take environmental factors that include temperature, radiation, water availability, forest structure, and soil properties as inputs to simulate flux dynamics [24,25]. However, process models make assumptions regarding the underlying ecosystem processes which may introduce various biases at different sites [26]. Typically, they are parametrized individually at the site level by inverse modeling (leading to parameter optimization), compromising their generalizability. Alternatively, machine learning (ML) models are driven purely by data e.g., [27,28] which avoid assumption-induced biases and site-level specifics. Since no ecosystem processes are specified in the algorithms, ML models are normally hard to interpret but they can achieve excellent performance in predictions. As an example of a highly efficient ML approach, in this study, we used extreme gradient boosting (XGBoost) [29], which has the advantages of (1) enabling parallel processing using all the cores of a machine to increase computational efficiency and (2) providing parameters for regularization of the model to avoid overfitting. Studies with XGBoost have shown significant prediction accuracies and computation efficiencies in many research fields e.g., [30,31,32], potentially providing an excellent way to investigate forest NEP dynamics.
Norway spruce (Picea abies L.) is the most prevalent species that widely dominates conifer forests throughout Europe [33]. Due to its high growth rate and good tolerance to a broad range of environmental conditions [34], Norway spruce has been widely used in afforestation in Europe, making the Norway spruce forest an excellent model forest type for studying greenhouse gas fluxes. In this study, we focused on investigating the NEP of Norway spruce forests using eddy covariance (EC)-based observations and we built a machine learning model to answer the following questions:
- (1).
- How does the NEP of Norway spruce forests respond to variations of climate across Europe?
- (2).
- In what European regions do Norway spruce forests have the greatest CO2 sequestration potential?
- (3).
- How will the NEP of Norway spruce forests respond to a projected future climate?
2. Materials and Methods
2.1. Flux Data from Different Sites
We used EC data that were measured in 2019 at a young Norway spruce (age, 8 years and height, 1 m) plantation in Hoxmark, Norway (NO-Hox, Table 1). The NEP was determined by measuring wind speed and CO2 concentration at 20 Hz using a 3D sonic anemometer (HS-50, Gill Instruments Limited, Hampshire, UK) and a CO2 infrared gas analyzer (LI-7200RS, LI-COR, Inc., Lincoln, MI, USA), respectively, mounted at a height of 1.8 m. The raw data were processed and exported as 30 min averages using the software Eddypro (LI-COR, Inc.) following the standardized protocol of the Integrated Carbon Observation System (ICOS) outlined in Sabbatini et al. [35]. The processed NEP data were further filtered based on a friction velocity (u*) threshold of 0.13 m s−1, as estimated according to Papale et al. [36], and gap-filled using the marginal distribution sampling (MDS) approach [37]. The data processing on the 30-min data were performed using the R package “REddyproc” [38]. In addition to the flux data, we also measured air temperature (Ta), global radiation (Rg), precipitation (PPT), and wind speed (WS) using an automatic weather station type AWS (Seba Hydrometrie GmbH & Co. KG, Kaufbeuren, Germany) and recorded at 10-min intervals.
We also included a flux and meteorological dataset (2002–2014) from a site in Weidenbrunnen, Germany (DE-Bay, Table 1) which was a Norway spruce-dominated forest with a stand age of ~50 years. The processing of the raw EC data was documented in Foken [39]. The processed 30-min NEP was further gap-filled following the same approach as for the NO-Hox data.
In addition, we also downloaded data from 6 other sites that were dominated by Norway spruce (>80% of the composition) from FLUXNET (https://fluxnet.org/ (accessed on 4 June 2020)) [40], including 30-min eddy covariance (EC) flux and the corresponding climate data. The sites were located in Switzerland (CH-Dav), Czech Republic (CZ-BK1), Germany (DE-Lkb, DE-Obe and DE-Tha), and Italy (IT-Ren), and the data period generally covered 1997–2014 (Table 1). The stand age covered a wide range from 2 years to over 250 years. FLUXNET data were processed prior to data downloading [41] and the processing was similar to that performed on the datasets from NO-Hox and DE-Bay. This ensured the reliability of the cross-site comparison and data analysis in this study.

Table 1.
Summary of the study sites.
| Site Name | Country | Code | Latitude | Longitude | Elevation (m) | MAT | MAP | Years | LAI | Age (yr) | Reference |
|---|---|---|---|---|---|---|---|---|---|---|---|
| Davos | Switzerland | CH-Dav | 46.81533 | 9.85591 | 1639 | 3.55 | 850 | 1997–2014 | 3.9 | 240–257 * | [42] |
| Bily Kriz | Czech Republic | CZ-BK1 | 49.50208 | 18.53688 | 875 | 6.85 | 1292 | 2004–2014 | 10 | 23–33 | [43] |
| Lackenberg | Germany | DE-Lkb | 49.09962 | 13.30467 | 1308 | 4.82 | 879 | 2009–2013 | - | 0–4 | [44] |
| Oberbärenburg | Germany | DE-Obe | 50.78666 | 13.72129 | 734 | 6.49 | 1046 | 2008–2014 | 8 | 54–60 | - |
| Tharandt | Germany | DE-Tha | 50.96256 | 13.56515 | 385 | 8.91 | 844 | 1997–2014 | 7.6 | 111–128 | [45] |
| Renon | Italy | IT-Ren | 46.58686 | 11.43369 | 1735 | 4.58 | 904 | 1999–2013 | 5.1 | 180–194 * | [46] |
| Weidenbrunnen | Germany | DE-Bay | 50.14194 | 11.86694 | 775 | 6.46 | 947 | 2002–2014 | 4.8 | 49–61 | [39] |
| Hoxmark | Norway | NO-Hox | 59.66876 | 10.71749 | 91 | 6.79 | 1045 | 2019 | <1 | 8 | This study |
MAT, mean annual temperature (°C) for the study period; MAP, mean annual precipitation (mm) for the study period; LAI, maximum leaf area index documented (m2 m−2); age, the range of the stand age from the start to the end of the study period. * Forest stands with rough age estimates of >180 and >240 yr, respectively, are documented for IT-Ren and CH-Dav.
2.2. XGBoost Model and Effects on NEP
In this study, we aimed to generalize the CO2 fluxes of Norway spruce forests across all the study sites and made predictions, considering (linear or nonlinear) effects from a combination of multiple factors. To achieve this, we developed an extreme gradient boosting (XGBoost) model with the tree-based booster (“gbtree”) for NEP using the R package “xgboost” [29]. In the model, we included air temperature (Ta), global radiation (Rg), precipitation (PPT), and stand age as the core predictors. In addition, other variables were also considered, including canopy height, air CO2 concentration, vapor pressure deficit, evapotranspiration, photosynthetic photon flux density, wind speed (WS), latent heat flux, sensible heat flux, and leaf area index. Moreover, we also included two artificial variables that represent generic seasonal cycles (i.e., sine and cosine functions with a period of 12 months and an amplitude of 1), which have been shown to be important for ecosystem C fluxes [47]. The sine function has a maximum value in March and a minimum value in September, while the cosine function has a maximum value in December and a minimum value in June. However, some of these variables are covarying. Thus, we carried out a correlation analysis to detect these collinearities among the variables using the monthly values (Figure S1). Following the collinearity test, only air CO2 concentration, WS, and the sine seasonal cycle that showed low collinearities with the core variables (r < 0.5), together with the core variables (Ta, Rg, PPT, age), were chosen as predictors in the model. Monthly data from the 8 sites were used to drive the machine learning model. Months with no observed NEP data (i.e., all the 30-min data within the month were gap-filled) were removed. In total, 929 site-months were included in the model. Seven XGBoost model parameters were tuned to achieve the lowest root mean square errors (RMSE) in test datasets that were generated in leave-one-site-out cross-validations (i.e., spatial cross-validation with 8 training/test datasets). A summary that explains each parameter and its tuning range is outlined in Table S2. The model with optimized parameters was then saved for further analysis (Table 2).
We carried out a partial dependence analysis using the R package “pdp” [48] to investigate the partial effects of Ta, age, Rg, PPT, air CO2 concentration, and WS on NEP. Individual conditional expectation (ICE) plots [49] were used to visualize the heterogeneities of these partial relationships across the distributions.
2.3. Norway Spruce Forest NEP in Europe and Its Future Trajectory
Assuming the 8 studied sites represent Norway spruce forests in Europe, we used the XGBoost model to predict the NEP over Norway spruce distribution areas in Europe. The data used as model input were monthly Ta and PPT during 2010–2018 that were acquired from WorldClim [50] with a spatial resolution of 2.5 min that was downscaled from CRU-TS 4.03 [51]. We used the monthly Rg data of 1970–2000 from WorldClim in all the model predictions due to the lack of Rg data after 2000, assuming changes in radiation conditions were not significant over time. For the predictions (both current and future), the CO2 concentration of 400 ppm and the age of 60 yr were taken as model inputs. To investigate the possible NEP changes of Norway spruce under the future climate projection, we also computed NEP predictions using monthly Ta and PPT data for 2021–2040 and 2041–2060 under the scenario of SSP2-4.5. The Ta and PPT data were originally simulated using the model BCC-CSM2-MR (equilibrium climate sensitivity, 3.0 °C) under the Coupled Model Intercomparison Project phase 6 (CMIP6) [52] and were downscaled with WorldClim v2.1 [50]. The “middle-of-the-road” SSP2-4.5 scenario was chosen because it represented a gentle and realistic projection where emission controls were in place while emissions still kept increasing within the century. Data of current Norway spruce distribution in Europe were derived from Caudullo et al. (2017). All the data analyses were carried out in the program R version 4.0.1 [53].
3. Results
3.1. Climate and Annual Carbon Budget of the Study Sites
The selected study sites are mostly in central Europe apart from NO-Hox which is located in northern Europe (Figure 1a). During the study years, the annual mean temperature ranged from 2.4 °C (CH-Dav) to 10.4 °C (DE-Tha) and the annual precipitation varied from 502 mm (DE-Tha) to 1748 mm (CZ-BK1) (Table 1). This climate range covers most regions where Norway spruce currently grows except the areas with cold climate (i.e., mean annual temperature < 2.5 °C) in Russia and warm climate (i.e., mean annual temperature > 11 °C) in southern Europe (Figure 1b).
Most sites acted as a C sink in most years with annual NEP values ranging from 63 g C m−2 yr−1 (CH-Dav) to 1253 g C m−2 yr−1 (DE-Bay) (Figure 2). Among these sites, CZ-BK1 had the greatest NEP median value (813 g C m−2 yr−1) but the NEP value of CZ-BK1 was not significantly different from those of DE-Bay, DE-Tha, IT-Ren, and NO-Hox across the years (p > 0.05). The forest at DE-Lkb acted as a C source with NEP values ranging from −266 to −134 g C m−2 yr−1 over the study years (2009–2013), which was significantly different from NEP values of other sites (p < 0.05). Similarly, the forest at CH-Dav was a C source (NEP values were between −296 and −9 g C m−2 yr−1) in 1997–1999 and 2002–2004.
3.2. XGBoost Model and Effects on NEP
Based on the cross-validation, XGBoost models resulted in test root mean square errors (RMSE) of 44.84 g C m−2 month−1, which accounted for 15% of the flux span (Table 2). Ta had the greatest contribution for constructing the models with an importance score of 0.35, which was followed by Rg (0.29), and age (0.17). CO2 concentration, WS, PPT, and sine seasonality had low contributions to the model with importance scores between 0.02 and 0.08.
An increase in Ta triggered substantial increases in NEP, but only after the monthly Ta passed 0 °C (Figure 3a). Regarding age, NEP values increased sharply as forest stands grew from 1 to 20 years old. After that, NEP stabilized for a long period until after ~200 years old, when stands started to show a gradual decline in NEP (Figure 3b). Rg showed a nonlinear effect on NEP where NEP increased with Rg before it became saturated as Rg passed ~500 MJ m−2 month−1 (Figure 4c). NEP values generally showed a slight increased pattern as PPT increased from 0 to 100 mm month−1 (Figure 4d). As PPT increased beyond 100 mm month−1, NEP hardly displayed any response. NEP values showed a sharp increase before the CO2 concentration reached ~380 ppm and almost constant NEP values were present as the CO2 concentration increased beyond 380 ppm (Figure 4e). WS showed a minor effect on NEP where NEP values declined only when WS increased from 1.5 to 3 m s−1, while NEP values remained constant when WS was out of this range (Figure 4f).
3.3. NEP Predictions of Norway Spruce Forests in Europe
Based on the predictions of the XGBoost model, the NEP of Norway spruce forests in Europe differed in regions with different climates (Figure 4a). Generally, they exhibited greater net CO2 uptake (with NEP values reaching >800 g C m−2 yr−1) in lower latitude regions where higher levels of radiation and temperature were present. The large inland areas between latitudes of 55° N and 65° N showed lower NEP values of ~400 g C m−2 yr−1. The regions with the lowest NEP values (<400 g C m−2 yr−1) were unsurprisingly in the northern edge of the European continent, some mountainous area in mid-Norway, and along the Alps where winters are long and temperatures are low. Overall, the NEP median value for the entire region was 494 g C m−2 yr−1.
With the future Ta and PPT projections, the NEP tends to be greater in most regions (86% of the Norway spruce distribution area) during 2021–2040 under the SSP2-4.5 scenario as compared with the NEP in 2010–2018 (Figure 4b). This trend is more pronounced in mid-Europe and the UK where the increase in NEP could reach up to >60 g C m−2 yr−1. At the same time, a decreasing trend in NEP is also present in a few areas (2%) in Russia with NEP reduction being up to ~30 g C m−2 yr−1. There is also a proportion of the area (12%) that has almost no change in NEP (i.e., changes are between −5 and 5 g C m−2 yr−1). Overall, the median of NEP changes is 23 g C m−2 yr−1. During 2041–2060 (Figure 4c), the NEP shows a similar changing pattern as those during 2021–2040, but generally with greater increases. There is hardly any area that shows a decrease or no change in NEP during 2041–2060 (<1%). The median of NEP changes in 2041–2060 (45 g C m−2 yr−1) is almost two-fold of that in 2021–2040.
4. Discussion
Forest CO2 sequestration is an important ecosystem service for climate change mitigation. In this study, we analyzed the NEP of Norway spruce forests from 8 sites across multiple countries in Europe. As a highly productive forest type, Norway spruce forests have great C sequestration potentials for climate mitigation in a wide area of Europe. Even in the high latitude and inland areas with short growing seasons (~6 months), Norway spruce forests can still sequester up to 500 g C m−2 yr−1, which is greater than those sequestered by mixed wood or other coniferous forests in boreal regions (mostly <250 g C m−2 yr−1) [54,55,56]. Nonetheless, to further evaluate the role of Norway spruce in future climate mitigation, it is important to investigate how their carbon sink potentials are affected by ecosystem disturbances (e.g., drought, bark beetle infestation, storms, etc.) and increasing air pollutions (e.g., tropospheric ozone) in different regions [57,58,59,60,61].
The air temperature was the most important factor that controls the C sink strength of the forest stands (Figure 3a), resulting in a higher annual NEP in the warmer southern and coastal regions than in northern and inland regions of Europe. While the ecosystem CO2 uptake rate is higher under a warmer climate, it has also been found to decline after passing a certain temperature optimum [6,7,8]. Duffy et al. [5] found this optimal temperature to be around 18 °C for C4 plants. In our study, we noticed that the NEP of Norway spruce forests reached a peak at ~15 °C, but no obvious reduction was detected up to 22 °C (Figure 3a). Therefore, we marked regions with temperatures beyond the range of our data in Figure 4 to indicate potential uncertainties in the estimated NEP due to extrapolations in these regions, especially in southern Europe where high temperatures are present. Under future climate change projections, while previous studies have indicated higher productivities in Norway spruce forests e.g., [62], forests may also pass the temperature optimum as early as 2040 and may exhibit a decline in NEP e.g., [5]. Our results predicted an increasing trend in NEP of Norway spruce forests in the majority of areas Europe by 2060. This NEP trend appears to correspond to a predicted winter/spring temperature (i.e., temperatures between 0 and 5 °C) increase (Figure S2), to which Norway spruce trees have a high sensitivity (Figure 3a). However, as the temperature increases, there are large areas that show strong NEP increases (mainly in France, Germany, Poland, and UK) which are beyond our data range and may have large uncertainties. Whether forest NEP of these warm areas is constrained or enhanced by the future warming climate will need to be verified through long-term observations.
Stand age was also an important factor for NEP but with a strong nonlinear relationship (Figure 3b). Following the NEP pattern, we refer to young Norway spruce forests as stands that are <30 years old, mature stands as those between 30 and 200 years old, and old stands as those older than 200 years. After a sharp increase in NEP in the first 25 years, the NEP of Norway spruce forests tends to remain at a high level until ~200 yr, indicating that old forests could also be of high values for CO2 sequestration. Similarly, Stokland [63] found that spruce forests in Norway maintained a constant tree volume increase rate well over 100 yr, calling for, on the one hand, an extended rotation length for forest management. On the other hand, researchers have also recommend shortening the rotation period to reduce the increasing risks of wind and bark beetle damages as trees age e.g., [58]. Old trees can exhibit declines in NEP as a result of strong decreases in photosynthesis [22], which are largely due to declines in stomatal conductance and nitrogen investment for photosynthetic functions [19,64]. While the physiological change in old trees may partially contribute to the NEP decline after ~200 yr, the NEP decline observed in this study is driven by only one site (CH-Dav) as such stands with age of over 200 yr are generally rare. In fact, the carbon sink strength for old forest stands is generally a controversial topic [63,65,66] and our results also have large uncertainties in the CO2 sequestration potential of spruce forests that are older than 200 yr.
In this study, we used PPT to indicate ecosystem water availability and noticed a slight decrease in NEP as monthly PPT dropped from 100 to 0 mm (Figure 3d). While drought constrains both photosynthesis of trees and ecosystem respirations [9,10], the NEP decline suggests a larger drop in CO2 uptake than in emissions [11,12]. Our results also indicate that water availability has a nonlinear influence on CO2 fluxes, and it showed no effect before dropping below a certain threshold where physiological stress is imposed. However, our dataset does not include severe drought events and depending on the drought intensity, other variables (e.g., a drought index) may need to be used in the model to properly represent the drought effect.
In this study, we implemented the XGBoost algorithm to model CO2 fluxes and included only climate variables and stand age, which also largely explained the variances of certain canopy properties (i.e., canopy height and leaf area index) (Figure S1). However, soil properties were not explicitly considered since the data were not available for the study sites. Even so, the models resulted in satisfactory prediction RMSEs in cross-validations that accounted for only 15% of the overall flux ranges, suggesting that the site-specific characteristics may be represented by the climate to a certain degree. Therefore, our predictions from the models can be representative for CO2 fluxes of the Norway spruce forest in large parts of its distribution area. Studies have also used other data-driven methods to estimate NEP in forests, including linear regression models [67], random forest (RF) [68] and artificial neural network (ANN) [27]. The linear regression models have shown that stand age and temperature are the most important factors for determining the NEP of the forest in eastern Asia; however, due to the simplistic structure of linear regression, the models explained only a fraction of the NEP variations (R2 ≤ 0.38 as compared with R2 = 0.80 in our study) [67]. Using the RF model, Reitz et al. [68] achieved a NEP prediction error (RMSE) of 81 g C m−2 month−1 over 15 sites of diverse ecosystems (including forests). Due to the diverse ecosystems included in their model, they found vegetation index, rather than temperature, was the most important predictor in the model. Melesse and Hanley [27] estimated NEP in a single mixed-wood forest using ANN models and, similar to our study, found that temperature and radiation (including energy fluxes) were the best predictors for NEP. Overall, using ML models to estimate NEP is a practical approach for flux upscaling and prediction, and their performance will need to be compared under different ecosystems and environmental conditions.
Given the limitations of this study, our XGBoost model predictions still need to be improved in the following three aspects. Firstly, areas with annual mean temperatures <2.5 (i.e., Russia) or >11 °C (i.e., southern Europe) were not represented by our dataset (Figure 1) and the uncertainties in this region would be greatly improved with relevant datasets added. Secondly, the dataset we used hardly included any disturbance (e.g., drought, bark beetle infestation) and a future with more frequent extreme events could introduce uncertainties into the predictions [69]. Thirdly, there is only one forest site with an age > 200 yr (CH-Dav) in our dataset (Table 1), and thus, the NEP predictions for old forests were inevitably with large uncertainties. Although the productivity declines in old forests are supported by many studies e.g., [13,16], more data from old forests would reduce the uncertainties in this regard. Fourthly, the CO2 fertilization effect was not considered in our predictions (i.e., the CO2 concentration was assumed to be 400 ppm in all predictions), because the relationship between the CO2 concentration and NEP (Figure 3e) reflected the CO2 fertilization effect and also their seasonal covariation where high NEP in the growing season caused a decline in atmospheric CO2 concentrations. Therefore, methodologies to partition these two processes are needed to use EC data to investigate the CO2 fertilization effect. This study also serves as a framework for investigating the C sequestration potentials for forests of different types. Importantly, as more data (e.g., from old stands of >200 yr) become available, the model could be updated which would generate improved predictions with lower uncertainties.
Supplementary Materials
The following supporting information can be downloaded at: https://www.mdpi.com/article/10.3390/f13101721/s1, Table S1: Summary of the eddy covariance instrumentation at the study sites; Table S2: Summary of the parameters in the XGBoost model; Figure S1: Spearman correlation matrix for monthly biotic and abiotic variables; Figure S2: Air temperature changes (ΔTa) in 2021–2040 and 2041–2060 under the SSP2-4.5 scenario as compared to the temperature in 2010–2018.
Author Contributions
Conceptualization, J.Z. and H.L.; methodology, J.Z.; data collection and curation, J.Z., H.L. and H.M.; writing—original draft preparation, J.Z.; writing—review and editing, J.Z. and H.L.; visualization, J.Z.; project administration, H.L.; funding acquisition, H.L. All authors have read and agreed to the published version of the manuscript.
Funding
This research was funded by the Norwegian Research Council under the project “Integrated Carbon Observation System (ICOS)-Norway and Ocean Thematic Centre”, grant no. NFR-245927. The APC was funded by Norwegian Institute of Bioeconomy Research.
Data Availability Statement
Flux data can be downloaded from www.fluxnet.org (accessed on 17 September 2020).
Acknowledgments
The authors are grateful to Christoph Thomas and Wolfgang Babel at the University of Bayreuth for providing the flux data from the site of DE-Bay.
Conflicts of Interest
The authors declare no conflict of interest.
References
- Bastin, J.F.; Finegold, Y.; Garcia, C.; Mollicone, D.; Rezende, M.; Routh, D.; Zohner, C.M.; Crowther, T.W. The global tree restoration potential. Science 2019, 365, 76–79. [Google Scholar] [CrossRef] [PubMed]
- Ögren, E.; Evans, J.R. Photosynthetic Light-Response Curves 1. The Influence of CO2 Partial-Pressure and Leaf Inversion. Planta 1993, 189, 182–190. [Google Scholar] [CrossRef]
- Mahecha, M.D.; Reichstein, M.; Carvalhais, N.; Lasslop, G.; Lange, H.; Seneviratne, S.I.; Vargas, R.; Ammann, C.; Arain, M.A.; Cescatti, A. Global convergence in the temperature sensitivity of respiration at ecosystem level. Science 2010, 329, 838–840. [Google Scholar] [CrossRef] [Green Version]
- Sall, T.; Pettersson, P. A Model of Photosynthetic Acclimation as a Special Case of Reaction Norms. J. Theor. Biol. 1994, 166, 1–8. [Google Scholar] [CrossRef]
- Duffy, K.A.; Schwalm, C.R.; Arcus, V.L.; Koch, G.W.; Liang, L.Y.L.; Schipper, L.A. How close are we to the temperature tipping point of the terrestrial biosphere? Sci. Adv. 2021, 7, eaay1052. [Google Scholar] [CrossRef] [PubMed]
- Bennett, A.C.; Arndt, S.K.; Bennett, L.T.; Knauer, J.; Beringer, J.; Griebel, A.; Hinko-Najera, N.; Liddell, M.J.; Metzen, D.; Pendall, E.; et al. Thermal optima of gross primary productivity are closely aligned with mean air temperatures across Australian wooded ecosystems. Glob. Change Biol. 2021, 27, 4727–4744. [Google Scholar] [CrossRef]
- Huang, M.T.; Piao, S.L.; Ciais, P.; Penuelas, J.; Wang, X.H.; Keenan, T.F.; Peng, S.S.; Berry, J.A.; Wang, K.; Mao, J.F.; et al. Air temperature optima of vegetation productivity across global biomes. Nat. Ecol. Evol. 2019, 3, 772–779. [Google Scholar] [CrossRef]
- Niu, S.L.; Luo, Y.Q.; Fei, S.F.; Yuan, W.P.; Schimel, D.; Law, B.E.; Ammann, C.; Arain, M.A.; Arneth, A.; Aubinet, M.; et al. Thermal optimality of net ecosystem exchange of carbon dioxide and underlying mechanisms. New Phytol. 2012, 194, 775–783. [Google Scholar] [CrossRef] [Green Version]
- Zhao, J.; Hartmann, H.; Trumbore, S.; Ziegler, W.; Zhang, Y. High temperature causes negative whole-plant carbon balance under mild drought. New Phytol. 2013, 200, 330–339. [Google Scholar] [CrossRef]
- Zheng, P.F.; Wang, D.D.; Yu, X.X.; Jia, G.D.; Liu, Z.Q.; Wang, Y.S.; Zhang, Y.G. Effects of drought and rainfall events on soil autotrophic respiration and heterotrophic respiration. Agr. Ecosyst. Environ. 2021, 308, 107267. [Google Scholar] [CrossRef]
- Mensah, C.; Sigut, L.; Fischer, M.; Foltynova, L.; Jocher, G.; Acosta, M.; Kowalska, N.; Kokrda, L.; Pavelka, M.; Marshall, J.D.; et al. Assessing the Contrasting Effects of the Exceptional 2015 Drought on the Carbon Dynamics in Two Norway Spruce Forest Ecosystems. Atmosphere 2021, 12, 988. [Google Scholar] [CrossRef]
- von Buttlar, J.; Zscheischler, J.; Rammig, A.; Sippel, S.; Reichstein, M.; Knohl, A.; Jung, M.; Menzer, O.; Arain, M.A.; Buchmann, N.; et al. Impacts of droughts and extreme-temperature events on gross primary production and ecosystem respiration: A systematic assessment across ecosystems and climate zones. Biogeosciences 2018, 15, 1293–1318. [Google Scholar] [CrossRef] [Green Version]
- Litvak, M.; Miller, S.; Wofsy, S.C.; Goulden, M. Effect of stand age on whole ecosystem CO2 exchange in the Canadian boreal forest. J. Geophys. Res.-Atmos. 2003, 108. [Google Scholar] [CrossRef] [Green Version]
- Musavi, T.; Migliavacca, M.; Reichstein, M.; Kattge, J.; Wirth, C.; Black, T.A.; Janssens, I.; Knohl, A.; Loustau, D.; Roupsard, O.; et al. Stand age and species richness dampen interannual variation of ecosystem-level photosynthetic capacity. Nat. Ecol. Evol. 2017, 1, 48. [Google Scholar] [CrossRef] [Green Version]
- He, L.M.; Chen, J.M.; Pan, Y.D.; Birdsey, R.; Kattge, J. Relationships between net primary productivity and forest stand age in U.S. forests. Glob. Biogeochem. Cycles 2012, 26, GB3009. [Google Scholar] [CrossRef]
- West, P.W. Do increasing respiratory costs explain the decline with age of forest growth rate? J. For. Res. 2020, 31, 693–712. [Google Scholar] [CrossRef] [Green Version]
- Piao, S.L.; Luyssaert, S.; Ciais, P.; Janssens, I.A.; Chen, A.P.; Cao, C.; Fang, J.Y.; Friedlingstein, P.; Luo, Y.Q.; Wang, S.P. Forest annual carbon cost: A global-scale analysis of autotrophic respiration. Ecology 2010, 91, 652–661. [Google Scholar] [CrossRef]
- Pregitzer, K.S.; Euskirchen, E.S. Carbon cycling and storage in world forests: Biome patterns related to forest age. Glob. Chang. Biol. 2004, 10, 2052–2077. [Google Scholar] [CrossRef] [Green Version]
- Drake, J.E.; Davis, S.C.; Raetz, L.M.; DeLucia, E.H. Mechanisms of age-related changes in forest production: The influence of physiological and successional changes. Glob. Chang. Biol. 2011, 17, 1522–1535. [Google Scholar] [CrossRef]
- McMillan, A.M.S.; Winston, G.C.; Goulden, M.L. Age-dependent response of boreal forest to temperature and rainfall variability. Glob. Chang. Biol. 2008, 14, 1904–1916. [Google Scholar] [CrossRef]
- Song, C.H.; Woodcock, C.E. A regional forest ecosystem carbon budget model: Impacts of forest age structure and landuse history. Ecol. Model 2003, 164, 33–47. [Google Scholar] [CrossRef]
- Tang, J.W.; Luyssaert, S.; Richardson, A.D.; Kutsch, W.; Janssens, I.A. Steeper declines in forest photosynthesis than respiration explain age-driven decreases in forest growth. Proc. Natl. Acad. Sci. USA 2014, 111, 8856–8860. [Google Scholar] [CrossRef] [PubMed] [Green Version]
- Zhou, T.; Shi, P.J.; Jia, G.S.; Dai, Y.J.; Zhao, X.; Wei, S.G.; Du, L.; Wu, H.; Luo, Y.Q. Age-dependent forest carbon sink: Estimation via inverse modeling. J. Geophys. Res.-Biogeosci. 2015, 120, 2473–2492. [Google Scholar] [CrossRef] [Green Version]
- Zhao, J.F.; Liu, D.S.; Cao, Y.; Zhang, L.J.; Peng, H.W.; Wang, K.L.; Xie, H.F.; Wang, C.Z. An integrated remote sensing and model approach for assessing forest carbon fluxes in China. Sci. Total Environ. 2022, 811, 152480. [Google Scholar] [CrossRef] [PubMed]
- Verbeeck, H.; Samson, R.; Verdonck, F.; Lemeur, R. Parameter sensitivity and uncertainty of the forest carbon flux model FORUG: A Monte Carlo analysis. Tree Physiol. 2006, 26, 807–817. [Google Scholar] [CrossRef] [Green Version]
- Morales, P.; Sykes, M.T.; Prentice, I.C.; Smith, P.; Smith, B.; Bugmann, H.; Zierl, B.; Friedlingstein, P.; Viovy, N.; Sabate, S.; et al. Comparing and evaluating process-based ecosystem model predictions of carbon and water fluxes in major European forest biomes. Glob. Chang. Biol. 2005, 11, 2211–2233. [Google Scholar] [CrossRef] [PubMed]
- Melesse, A.M.; Hanley, R.S. Artificial neural network application for multi-ecosystem carbon flux simulation. Ecol. Model 2005, 189, 305–314. [Google Scholar] [CrossRef]
- Dou, X.M.; Yang, Y.G. Estimating forest carbon fluxes using four different data-driven techniques based on long-term eddy covariance measurements: Model comparison and evaluation. Sci. Total. Environ. 2018, 627, 78–94. [Google Scholar] [CrossRef]
- Chen, T.; He, T.; Benesty, M.; Khotilovich, V.; Tang, Y.; Cho, H.; Chen, K.; Mitchell, R.; Cano, I.; Zhou, T.; et al. xgboost: Extreme Gradient Boosting. R Package Version 1.1.1.1. 2020. Available online: https://CRAN.R-project.org/package=xgboost (accessed on 17 September 2020).
- Joharestani, M.Z.; Cao, C.X.; Ni, X.L.; Bashir, B.; Talebiesfandarani, S. PM2.5 Prediction Based on Random Forest, XGBoost, and Deep Learning Using Multisource Remote Sensing Data. Atmosphere 2019, 10, 373. [Google Scholar] [CrossRef] [Green Version]
- Li, W.; Yin, Y.B.; Quan, X.W.; Zhang, H. Gene Expression Value Prediction Based on XGBoost Algorithm. Front. Genet. 2019, 10, 1077. [Google Scholar] [CrossRef]
- Liu, J.L.; Wu, J.F.; Liu, S.R.; Li, M.D.; Hu, K.C.; Li, K. Predicting mortality of patients with acute kidney injury in the ICU using XGBoost model. PLoS ONE 2021, 16, e0246306. [Google Scholar] [CrossRef] [PubMed]
- Caudullo, G.; Welk, E.; San-Miguel-Ayanz, J. Chorological maps for the main European woody species. Data Brief 2017, 12, 662–666. [Google Scholar] [CrossRef] [PubMed]
- Niinimaki, S.; Tahvonen, O.; Makela, A.; Linkosalo, T. On the economics of Norway spruce stands and carbon storage. Can. J. For. Res. 2013, 43, 637–648. [Google Scholar] [CrossRef]
- Sabbatini, S.; Mammarella, I.; Arriga, N.; Fratini, G.; Graf, A.; Hortriagl, L.; Ibrom, A.; Longdoz, B.; Mauder, M.; Merbold, L.; et al. Eddy covariance raw data processing for CO2 and energy fluxes calculation at ICOS ecosystem stations. Int. Agrophys. 2018, 32, 495–515. [Google Scholar] [CrossRef]
- Papale, D.; Reichstein, M.; Aubinet, M.; Canfora, E.; Bernhofer, C.; Kutsch, W.; Longdoz, B.; Rambal, S.; Valentini, R.; Vesala, T.; et al. Towards a standardized processing of Net Ecosystem Exchange measured with eddy covariance technique: Algorithms and uncertainty estimation. Biogeosciences 2006, 3, 571–583. [Google Scholar] [CrossRef] [Green Version]
- Reichstein, M.; Falge, E.; Baldocchi, D.; Papale, D.; Aubinet, M.; Berbigier, P.; Bernhofer, C.; Buchmann, N.; Gilmanov, T.; Granier, A.; et al. On the separation of net ecosystem exchange into assimilation and ecosystem respiration: Review and improved algorithm. Glob. Chang. Biol. 2005, 11, 1424–1439. [Google Scholar] [CrossRef]
- Wutzler, T.; Lucas-Moffat, A.; Migliavacca, M.; Knauer, J.; Sickel, K.; Sigut, L.; Menzer, O.; Reichstein, M. Basic and extensible post-processing of eddy covariance flux data with REddyProc. Biogeosciences 2018, 15, 5015–5030. [Google Scholar] [CrossRef] [Green Version]
- Foken, T. Energy and Matter Fluxes of a Spruce Forest Ecosystem; Springer International Publishing: Midtown Manhattan, NY, USA, 2017. [Google Scholar]
- Baldocchi, D.; Falge, E.; Gu, L.; Olson, R.; Hollinger, D.; Running, S.; Anthoni, P.; Bernhofer, C.; Davis, K.; Evans, R. FLUXNET: A new tool to study the temporal and spatial variability of ecosystem-scale carbon dioxide, water vapor, and energy flux densities. Bull. Am. Meteorol. Soc. 2001, 82, 2415–2434. [Google Scholar] [CrossRef]
- Pastorello, G.; Trotta, C.; Canfora, E.; Chu, H.S.; Christianson, D.; Cheah, Y.W.; Poindexter, C.; Chen, J.Q.; Elbashandy, A.; Humphrey, M.; et al. The FLUXNET2015 dataset and the ONEFlux processing pipeline for eddy covariance data. Sci. Data 2020, 7, 225. [Google Scholar] [CrossRef]
- Zielis, S.; Etzold, S.; Zweifel, R.; Eugster, W.; Haeni, M.; Buchmann, N. NEP of a Swiss subalpine forest is significantly driven not only by current but also by previous year’s weather. Biogeosciences 2014, 11, 1627–1635. [Google Scholar] [CrossRef]
- Krupkova, L.; Markova, I.; Havrankova, K.; Pokorny, R.; Urban, O.; Sigut, L.; Pavelka, M.; Cienciala, E.; Marek, M.V. Comparison of different approaches of radiation use efficiency of biomass formation estimation in Mountain Norway spruce. Trees-Struct. Funct. 2017, 31, 325–337. [Google Scholar] [CrossRef]
- Lindauer, M.; Schmid, H.P.; Grote, R.; Mauder, M.; Steinbrecher, R.; Wolpert, B. Net ecosystem exchange over a non-cleared wind-throw-disturbed upland spruce forest-Measurements and simulations. Agric. For. Meteorol. 2014, 197, 219–234. [Google Scholar] [CrossRef]
- Grunwald, T.; Bernhofer, C. A decade of carbon, water and energy flux measurements of an old spruce forest at the Anchor Station Tharandt. Tellus B 2007, 59, 387–396. [Google Scholar] [CrossRef] [Green Version]
- Montagnani, L.; Manca, G.; Canepa, E.; Georgieva, E.; Acosta, M.; Feigenwinter, C.; Janous, D.; Kerschbaumer, G.; Lindroth, A.; Minach, L.; et al. A new mass conservation approach to the study of CO2 advection in an alpine forest. J. Geophys. Res.-Atmos. 2009, 114, D07306. [Google Scholar] [CrossRef] [Green Version]
- Irvin, J.; Zhou, S.R.; McNicol, G.; Lu, F.; Liu, V.; Fluet-Chouinard, E.; Ouyang, Z.T.; Knox, S.H.; Lucas-Moffat, A.; Trotta, C.; et al. Gap-filling eddy covariance methane fluxes: Comparison of machine learning model predictions and uncertainties at FLUXNET-CH4 wetlands. Agric. For. Meteorol. 2021, 308, 108528. [Google Scholar] [CrossRef]
- Greenwell, B.M. pdp: An R Package for Constructing Partial Dependence Plots. R J. 2017, 9, 421–436. [Google Scholar] [CrossRef] [Green Version]
- Goldstein, A.; Kapelner, A.; Bleich, J.; Pitkin, E. Peeking Inside the Black Box: Visualizing Statistical Learning With Plots of Individual Conditional Expectation. J. Comput. Graph. Stat 2015, 24, 44–65. [Google Scholar] [CrossRef] [Green Version]
- Fick, S.E.; Hijmans, R.J. WorldClim 2: New 1-km spatial resolution climate surfaces for global land areas. Int. J. Clim. 2017, 37, 4302–4315. [Google Scholar] [CrossRef]
- Harris, I.; Jones, P.D.; Osborn, T.J.; Lister, D.H. Updated high-resolution grids of monthly climatic observations–the CRU TS3.10 Dataset. Int. J. Clim. 2014, 34, 623–642. [Google Scholar] [CrossRef] [Green Version]
- Eyring, V.; Bony, S.; Meehl, G.A.; Senior, C.A.; Stevens, B.; Stouffer, R.J.; Taylor, K.E. Overview of the Coupled Model Intercomparison Project Phase 6 (CMIP6) experimental design and organization. Geosci. Model Dev. 2016, 9, 1937–1958. [Google Scholar] [CrossRef]
- R Development Core Team. R: A Language and Environment for Statistical Computing; R Foundation for Statistical Computing: Vienna, Austria, 2021; Available online: http://www.R-project.org/ (accessed on 17 September 2020).
- Sun, J.F.; Peng, C.H.; McCaughey, H.; Zhou, X.L.; Thomas, V.; Berninger, F.; St-Onge, B.; Hua, D. Simulating carbon exchange of Canadian boreal forests II. Comparing the carbon budgets of a boreal mixedwood stand to a black spruce forest stand. Ecol. Model 2008, 219, 276–286. [Google Scholar] [CrossRef]
- Chi, J.S.; Nilsson, M.B.; Laudon, H.; Lindroth, A.; Wallerman, J.; Fransson, J.E.S.; Kljun, N.; Lundmark, T.; Lofvenius, M.O.; Peichl, M. The Net Landscape Carbon Balance-Integrating terrestrial and aquatic carbon fluxes in a managed boreal forest landscape in Sweden. Glob. Chang. Biol. 2020, 26, 2353–2367. [Google Scholar] [CrossRef] [PubMed]
- Ueyama, M.; Harazono, Y.; Ohtaki, E.; Miyata, A. Controlling factors on the interannual CO2 budget at a subarctic black spruce forest in interior Alaska. Tellus B 2006, 58, 491–501. [Google Scholar] [CrossRef]
- Juran, S.; Edwards-Jonasova, M.; Cudlin, P.; Zapletal, M.; Sigut, L.; Grace, J.; Urban, O. Prediction of ozone effects on net ecosystem production of Norway spruce forest. Iforest 2018, 11, 743–750. [Google Scholar] [CrossRef] [Green Version]
- Hlasny, T.; Konig, L.; Krokene, P.; Lindner, M.; Montagne-Huck, C.; Muller, J.; Qin, H.; Raffa, K.F.; Schelhaas, M.J.; Svoboda, M.; et al. Bark Beetle Outbreaks in Europe: State of Knowledge and Ways Forward for Management. Curr. Rep. 2021, 7, 138–165. [Google Scholar] [CrossRef]
- Jaime, L.; Batllori, E.; Ferretti, M.; Lloret, F. Climatic and stand drivers of forest resistance to recent bark beetle disturbance in European coniferous forests. Glob. Chang. Biol. 2022, 28, 2830–2841. [Google Scholar] [CrossRef] [PubMed]
- Arend, M.; Link, R.M.; Patthey, R.; Hocha, G.; Schuldt, B.; Kahmen, A. Rapid hydraulic collapse as cause of drought-induced mortality in conifers. Proc. Natl. Acad. Sci. USA 2021, 118, e2025251118. [Google Scholar] [CrossRef]
- Krejza, J.; Cienciala, E.; Svetlik, J.; Bellan, M.; Noyer, E.; Horacek, P.; Stepanek, P.; Marek, M.V. Evidence of climate-induced stress of Norway spruce along elevation gradient preceding the current dieback in Central Europe. Trees-Struct. Funct. 2021, 35, 103–119. [Google Scholar] [CrossRef]
- Reyer, C.; Lasch-Born, P.; Suckow, F.; Gutsch, M.; Murawski, A.; Pilz, T. Projections of regional changes in forest net primary productivity for different tree species in Europe driven by climate change and carbon dioxide. Ann. For. Sci. 2014, 71, 211–225. [Google Scholar] [CrossRef] [Green Version]
- Stokland, J.N. Volume increment and carbon dynamics in boreal forest when extending the rotation length towards biologically old stands. For. Ecol. Manag. 2021, 488, 119017. [Google Scholar] [CrossRef]
- Raim, O.; Kaurilind, E.; Hallik, L.; Merilo, E. Why does needle photosynthesis decline with tree height in Norway spruce? Plant Biol. 2012, 14, 306–314. [Google Scholar] [CrossRef]
- Gundersen, P.; Thybring, E.E.; Nord-Larsen, T.; Vesterdal, L.; Nadelhoffer, K.J.; Johannsen, V.K. Old-growth forest carbon sinks overestimated. Nature 2021, 591, E21–E23. [Google Scholar] [CrossRef]
- Luyssaert, S.; Schulze, E.D.; Knohl, A.; Law, B.E.; Ciais, P.; Grace, J. Reply to: Old-growth forest carbon sinks overestimated. Nature 2021, 591, E24–E25. [Google Scholar] [CrossRef]
- Gao, S.; Zhou, T.; Zhao, X.; Wu, D.H.; Li, Z.; Wu, H.; Du, L.; Luo, H. Age and climate contribution to observed forest carbon sinks in East Asia. Environ. Res. Lett. 2016, 11, 034021. [Google Scholar] [CrossRef]
- Reitz, O.; Graf, A.; Schmidt, M.; Ketzler, G.; Leuchner, M. Upscaling Net Ecosystem Exchange Over Heterogeneous Landscapes With Machine Learning. J. Geophys. Res.-Biogeosci. 2021, 126. [Google Scholar] [CrossRef]
- Curtis, P.S.; Gough, C.M. Forest aging, disturbance and the carbon cycle. New Phytol. 2018, 219, 1188–1193. [Google Scholar] [CrossRef]
Figure 1.
Norway spruce distribution areas (green) with locations of the study sites (a) and climate within the distribution area (Ta vs. PPT, 2010–2018, grey dot clouds) with the climate of the study sites during the study period (b). The grey bars in (b) indicate the frequency distribution of the grey dots.
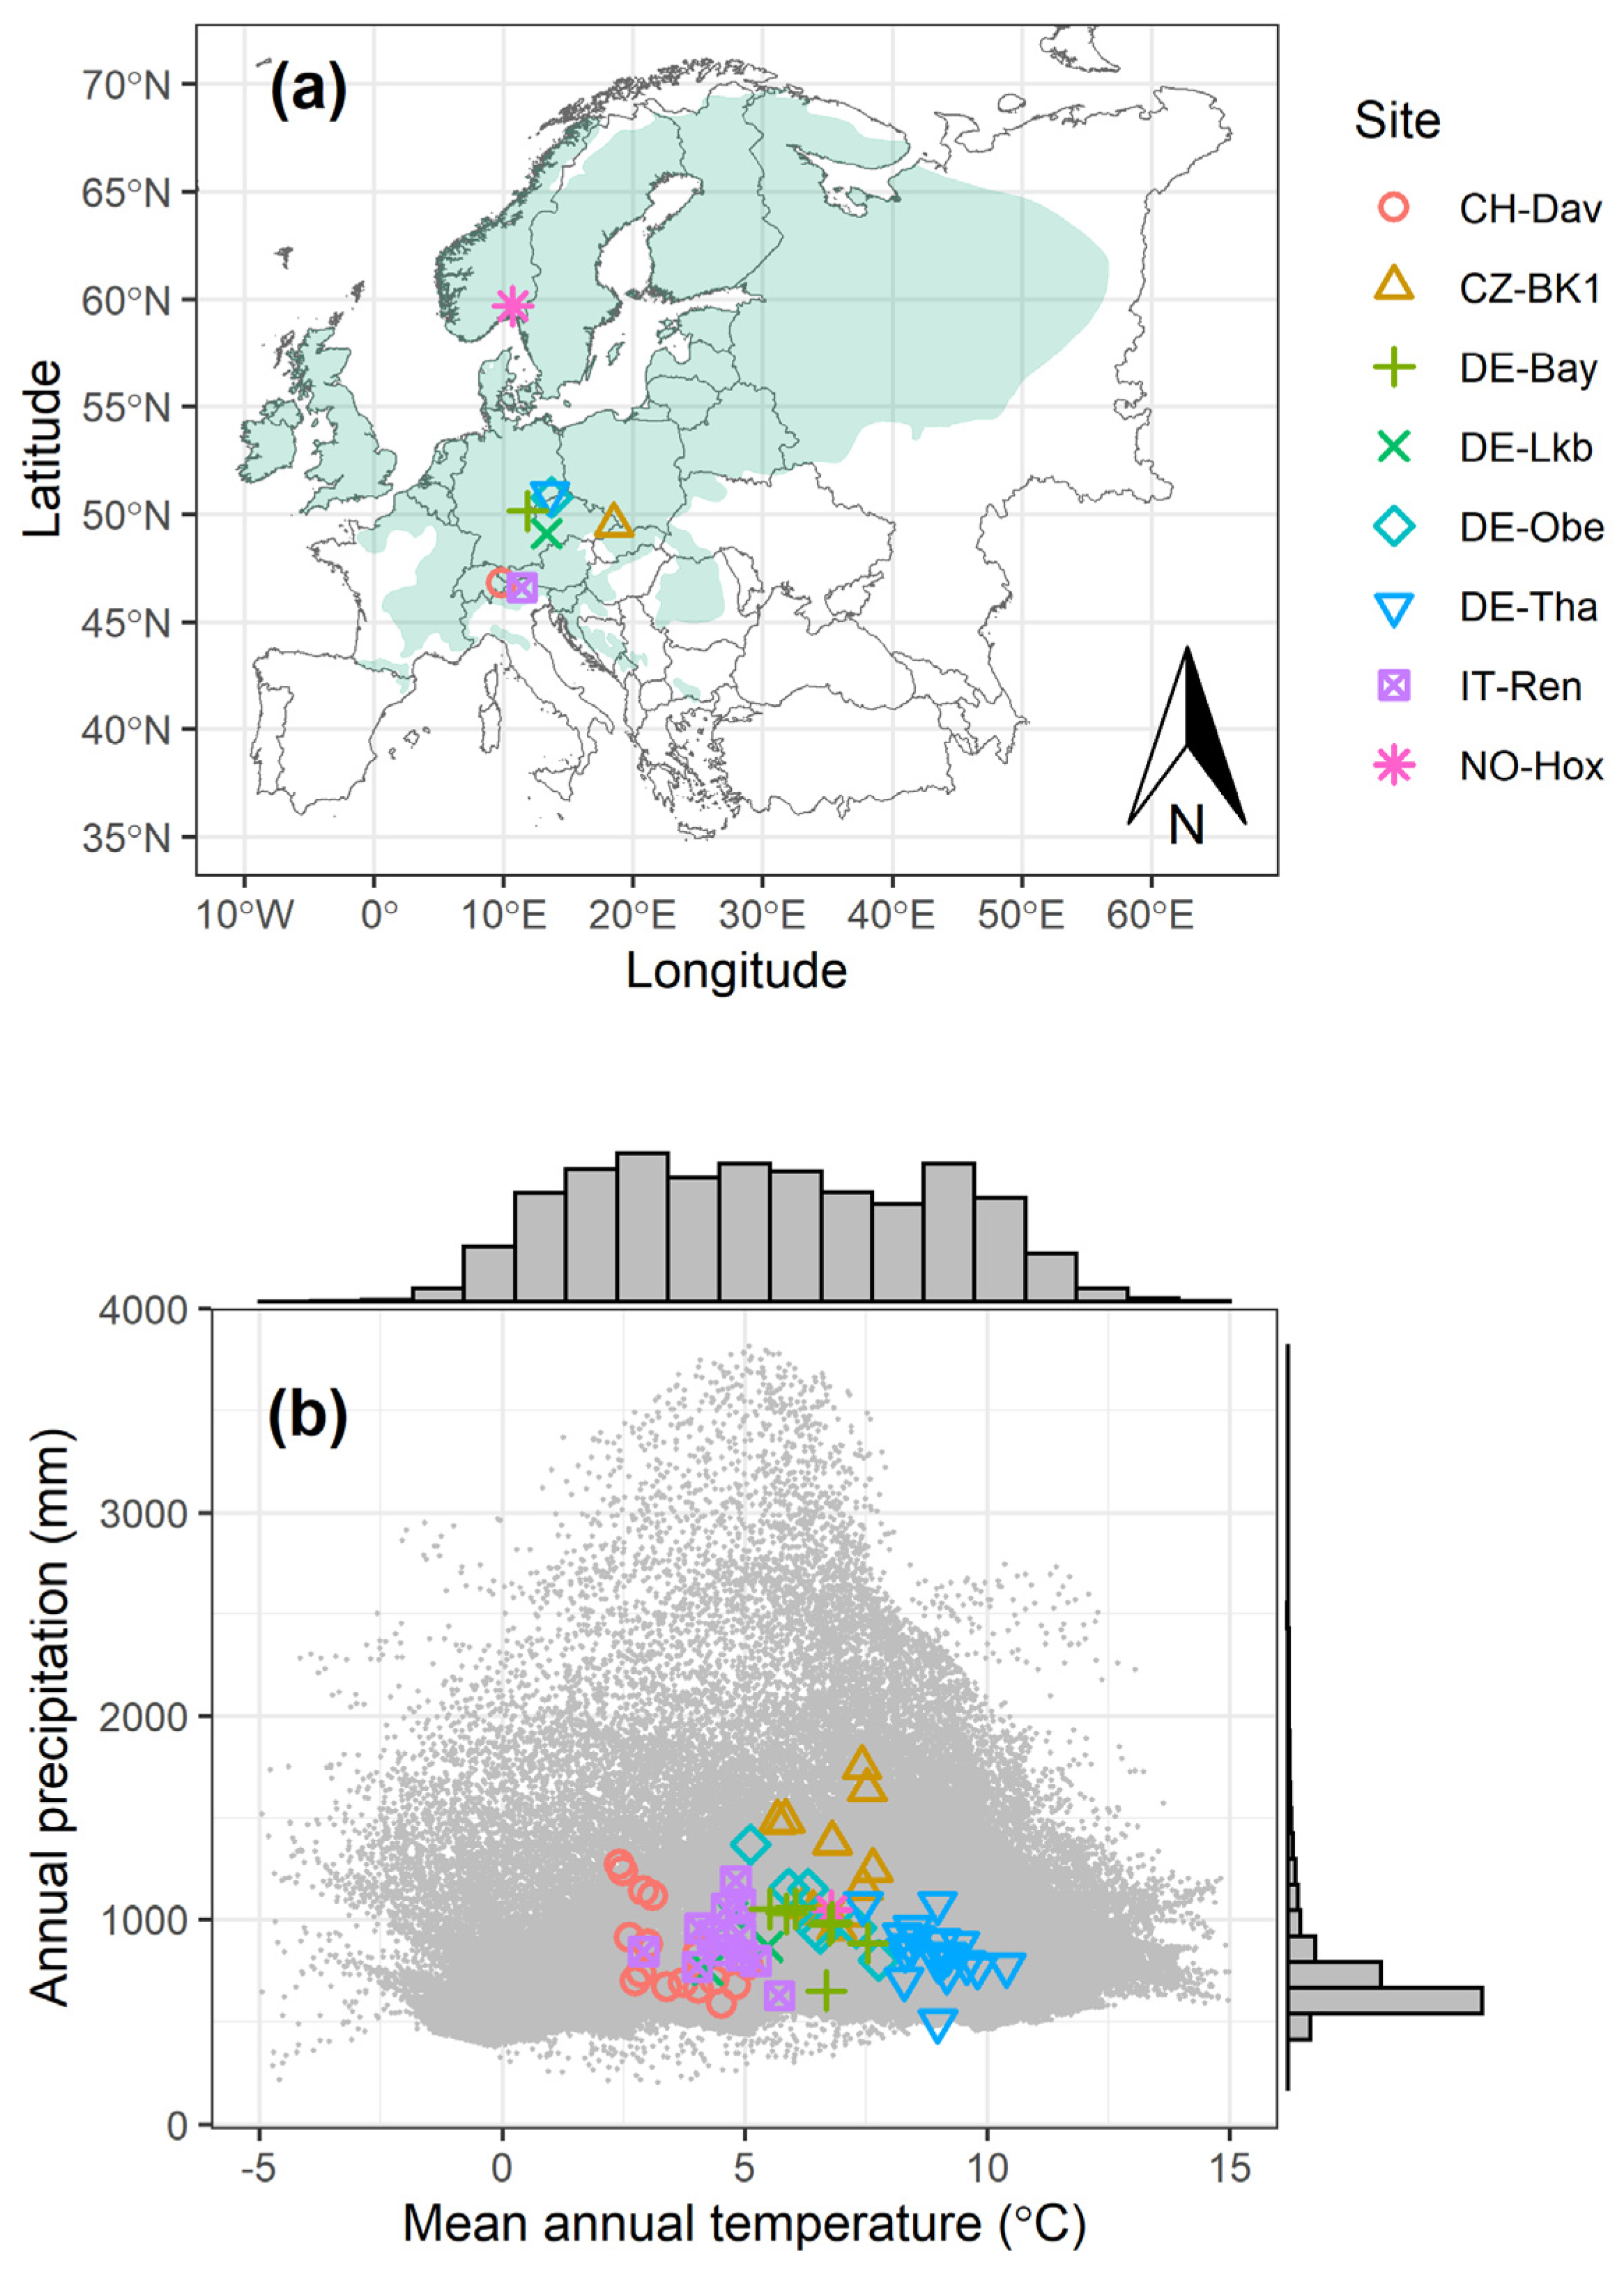
Figure 2.
Annual NEP at each study site. The solid lines in the boxes are medians. The lower and upper hinges are the first and third quartiles, respectively. The upper and lower whiskers represent the largest and smallest values within 1.5 times of the interquartile range (distance between the first and third quartiles) from the hinge. Blue points are annual NEP values. Different letters above the boxes indicate significant differences in NEP among the sites (p < 0.05) based on one-way ANOVA followed by Tukey’s HSD test.

Figure 3.
Partial dependence plots for NEP with respect to changes in: (a) air temperature (Ta); (b) age; (c) global radiation (Rg); (d) precipitation (PPT); (e), CO2 concentration; (f) wind speed (WS). The red curves indicate the average partial relationships. Grey curves are individual conditional expectation (ICE) curves that represent the partial relationship across individual observations in the data.

Figure 4.
NEP predictions for mature Norway spruce forests based on the climate during 2010–2018 (a) and the predicted changes in NEP values during 2021–2040 (b) and 2041–2060 (c) under the SSP2-4.5 scenario as compared with the NEP values in 2010–2018. The frequency distribution of the values in each map is presented in the corresponding inset with the red vertical lines indicating the medians. The predictions were performed in areas of current Norway spruce forest distribution in Europe. Areas with Ta that are beyond the range of the used data are marked with black shadows.

Table 2.
Summary of the XGBoost models for NEP (g C m−2 month−1).
| Parameter | Optimal Value | Flux Range | Train RMSE | Test RMSE | Variable Importance |
|---|---|---|---|---|---|
| 0.1 | [−108, 201] | 28.74 (9%) | 44.84 (15%) | Ta (0.35) | |
| max_depth | 3 | Rg (0.29) | |||
| min_child_weight | 0 | Age (0.17) | |||
| 0 | CO2 (0.08) | ||||
| subsample | 0.1 | WS (0.06) | |||
| colsample_bytree | 0.9 | PPT (0.03) | |||
| nrounds | 22 | Sine seasonality (0.02) |
Optimal values for the parameters were determined by the lowest test root mean square error (RMSE) via leave-one-site-out cross-validation. The mean RMSE for the training and test datasets are presented. Numbers in parentheses indicate ratios (%) of the RMSE to the span of the flux over the entire range. The importance score of each variable indicates its relative contribution in constructing the model. Note that the monthly NEP is present here.
Publisher’s Note: MDPI stays neutral with regard to jurisdictional claims in published maps and institutional affiliations. |
© 2022 by the authors. Licensee MDPI, Basel, Switzerland. This article is an open access article distributed under the terms and conditions of the Creative Commons Attribution (CC BY) license (https://creativecommons.org/licenses/by/4.0/).
Share and Cite
MDPI and ACS Style
Zhao, J.; Lange, H.; Meissner, H. Estimating Carbon Sink Strength of Norway Spruce Forests Using Machine Learning. Forests 2022, 13, 1721. https://doi.org/10.3390/f13101721
AMA Style
Zhao J, Lange H, Meissner H. Estimating Carbon Sink Strength of Norway Spruce Forests Using Machine Learning. Forests. 2022; 13(10):1721. https://doi.org/10.3390/f13101721
Chicago/Turabian StyleZhao, Junbin, Holger Lange, and Helge Meissner. 2022. "Estimating Carbon Sink Strength of Norway Spruce Forests Using Machine Learning" Forests 13, no. 10: 1721. https://doi.org/10.3390/f13101721
Note that from the first issue of 2016, this journal uses article numbers instead of page numbers. See further details here.