Article

Historic Variability of the Water Inflow to the Lazaro Cardenas Dam and Water Allocation in the Irrigation District 017, Comarca Lagunera, Mexico

by
José Villanueva-Díaz
1,*,
Juan Estrada-Ávalos
1,
Aldo Rafael Martínez-Sifuentes
1,
Arian Correa-Díaz
2,
David M. Meko
3,
Luis Ubaldo Castruita-Esparza
4 and
Julián Cerano-Paredes
1
1
Centro Nacional de Investigación Disciplinaria en Relación Agua, Suelo, Planta y Atmósfera, Instituto Nacional de Investigaciones Forestales, Agrícolas y Pecuarias, Km. 6.5 Margen Derecha Canal de Sacramento, Gómez Palacio, Durango 35140, Mexico
2
Centro Nacional de Investigación Disciplinaria en Conservación y Mejoramiento de Ecosistemas Forestales, Instituto Nacional de Investigaciones Forestales, Agrícolas y Pecuarias, Av. Progreso 5, Barrio de Santa Catarina, Delegacion Coyoacán, Mexico City 04010, Mexico
3
Laboratory of Tree-Ring Research, University of Arizona, 1217 E Lowell St., Tucson, AZ 85721, USA
4
Facultad de Ciencias Agrícolas y Forestales, Universidad Autónoma de Chihuahua, Km. 2.5 Carretera Delicias a Rosales, Delicias 33000, Mexico
*
Author to whom correspondence should be addressed.
Forests 2022, 13(12), 2057; https://doi.org/10.3390/f13122057
Submission received: 3 October 2022 / Revised: 16 November 2022 / Accepted: 30 November 2022 / Published: 3 December 2022
(This article belongs to the Section Forest Ecology and Management)

Abstract

:
An assemblage of tree-ring chronologies for the Nazas (NZW) in the Western Sierra Madre (WSM), Mexico was developed to determine water inflow at the Lazaro Cardenas Dam (LCD), the main source of water for surface irrigation in the Irrigation District 017 (DDR 017), Comarca Lagunera. A Principal Component Analysis of the ring-width chronologies was conducted to determine a common climate signal, and a stepwise model based on selected chronologies of the PC1 (CBA, COC) and PC2 (ARN) were used to develop a water inflow reconstruction to the Lazaro Cardenas Dam (LCD) extending from 1753 to 2003 (251 years), resulting in the following significant findings: the warm phase of the El Niño Southern Oscillation (ENSO) in the winter-spring season had a significant influence (SOI; Dec–Feb = −0.24, p < 0.01), but the North American Monsoon System (NAMS) was the most important in determining the water yield in the summer season (r = 0.48, p < 0.01). Water gauge inflow records (77 years) at the LCD used to determine the annual allocation of water for agriculture in the irrigation district 017 was an average of 1676 × 106 m3, where the maximum annual water outflow allowed of 1100 × 106 m3 for safety reasons, the dam infrastructure was released in 74% of the years and increasing to 78% when considering the reconstructed inflow. Prolonged drought episodes lasting more than 10 consecutive years were detected in the reconstructed inflow, information that could be used by decision makers to establish proper irrigation management strategies to ameliorate the economic and social impact when these extreme hydroclimatic events may occur.

1. Introduction

The Western Sierra Madre (WSM) is the most important source of water in northern Mexico, where watersheds that drain towards the Pacific Coastal Plane and the highlands of the Chihuahuan Desert yield the water needed to irrigate extensive areas located on the lowlands of the western and eastern slopes of this mountain range [1,2]. In this respect, the gauge water records in dams constitute an important source of information to determine the agricultural area and the water volumes to be allocated for irrigation in a particular year. There is significant interannual variability for most of the irrigated agricultural districts in northern Mexico. These districts depend mainly on the amount of water stored in reservoirs from the water year-streamflow (October 1st of the previous year to September 30 of the current year), which is released in the growing season for irrigation purposes. A specific case is the Irrigation District 017 (DDR 017), located in the state limits of Durango and Coahuila, Mexico, which is known as “Comarca Lagunera” (Place of Lagoons). During the period of 1995–2014, this region had a mean irrigated area of 48,550 ha year−1, whereas the long-term average (1947–2006) is of 66,718 ha [3].
The annual variability in runoff volumes is influenced by ocean-atmospheric phenomena, such as El Niño Southern Oscillation (ENSO) and the North American Monsoon System (NAMS), both of which perform an important role in determining the amount of seasonal rainfall, the volume of groundwater recharged, and the amount of runoff reaching some of the main streams [4].
These phenomena (ENSO, NAMS) usually are interconnected, and their influence is enhanced when they occur simultaneously [5,6,7,8,9,10,11]. Some of the most intense droughts in Mexico, like those occurred in the 1860’s and 1950’s, took place when some of these circulatory patterns interacted [6]. However, further studies are needed to analyze details of this influence and other atmospheric phenomena, such as the Pacific Decadal Oscillation (PDO), Atlantic Multidecadal Oscillation (AMO), and the Artic Oscillation (AO).
Land-use changes at the upper-forested Nazas Watershed derived from intense logging activities, overgrazing, clearcutting, and human-induced fires to expand the agricultural frontier have altered the hydrologic cycle, decreased water quality, and enhanced soil erosion problems [12]. Global warming as forecasted by models developed by the Intergovernmental Panel on Climate Change [6], where northern Mexico basins are subject to more frequent and intensive droughts [7], can exacerbate these land-use changes. Dominant drier conditions may favor an increase in desertification, and, particularly, shortages in water availability for most of the human settlements established in semiarid regions [8].
The volume of water released from a reservoir depends on several factors; some are intrinsic to the dam design, but most are due to the amount of water stored during a particular water year. In this respect, in order to estimate a proper allocation of water for a sustainable use and to stabilize the irrigated area considering the interannual streamflow variability, it is important to have updated information about historical water inflow records, which are useful for a better understanding of its long-term variability, and to implement proper measurements to ameliorate the impact of extensive droughts detected in long-term streamflow reconstructions [13].
The pressure on ground water resources to fulfill the demand of a population near 1.3 million people on the Comarca Lagunera has been increased in the last decades due to a greater demand in forage production for the dairy industry, human consumption, and other industrial uses [14]. In order to mitigate this problem, the local water administration is in the process of using 200 × 106 m3 of the authorized annual water outflow for irrigation to alleviate the water deficit for human consumption. Nevertheless, this action requires improvement in infrastructure and irrigation techniques in order to minimize the impact of this volume reduction and, at the same time, maintain the agricultural productivity of the region [15].
The extent of streamflow records for most of the basins in Mexico is limited in time and coverage; therefore, an alternative option to extend back in time the hydrological information is to develop dendrohydrological reconstructions from tree rings. This information could be useful to feed algorithms for modelling water allocation in a particular year, and to release an additional ecological volume to maintain the biodiversity of riparian ecosystems and to increase groundwater recharge [16].
Historical water inflow records in the “Lazaro Cardenas” Dam (LCD) have changed through time, as indicated by documented fluctuations in the agricultural area of the DDR 017. A minimum surface irrigated area of near 20,000 ha was recorded in 1952, 1953, 1957, 1958, and 1963, which is a significant decrease in the amount of land irrigated, which can be attributed to the severe droughts recorded in a broad region of northern Mexico [10,17].
The volume of the water allocated per year for most irrigated districts in northern Mexico depends on the water stored on the reservoirs in the water year, but there is a limitation on the amount and extent of the inflow gauge records. Therefore, in order to have a better understanding of the frequency and intensity of extreme hydroclimatic events and their potential impact on the availability of water resources, it is important to develop a more extended record of hydroclimatic information based on streamflow reconstructions.
The objective of this study was to develop a historic dendrohydrological reconstruction of the streamflow yield at the upper NZW, recorded as water inflow in the PLC dam, to determine the amount of water to be allocated in the growing season for agricultural purposes and compare it to the authorized water outflow by the district administrators of the DDR 017.

2. Materials and Methods
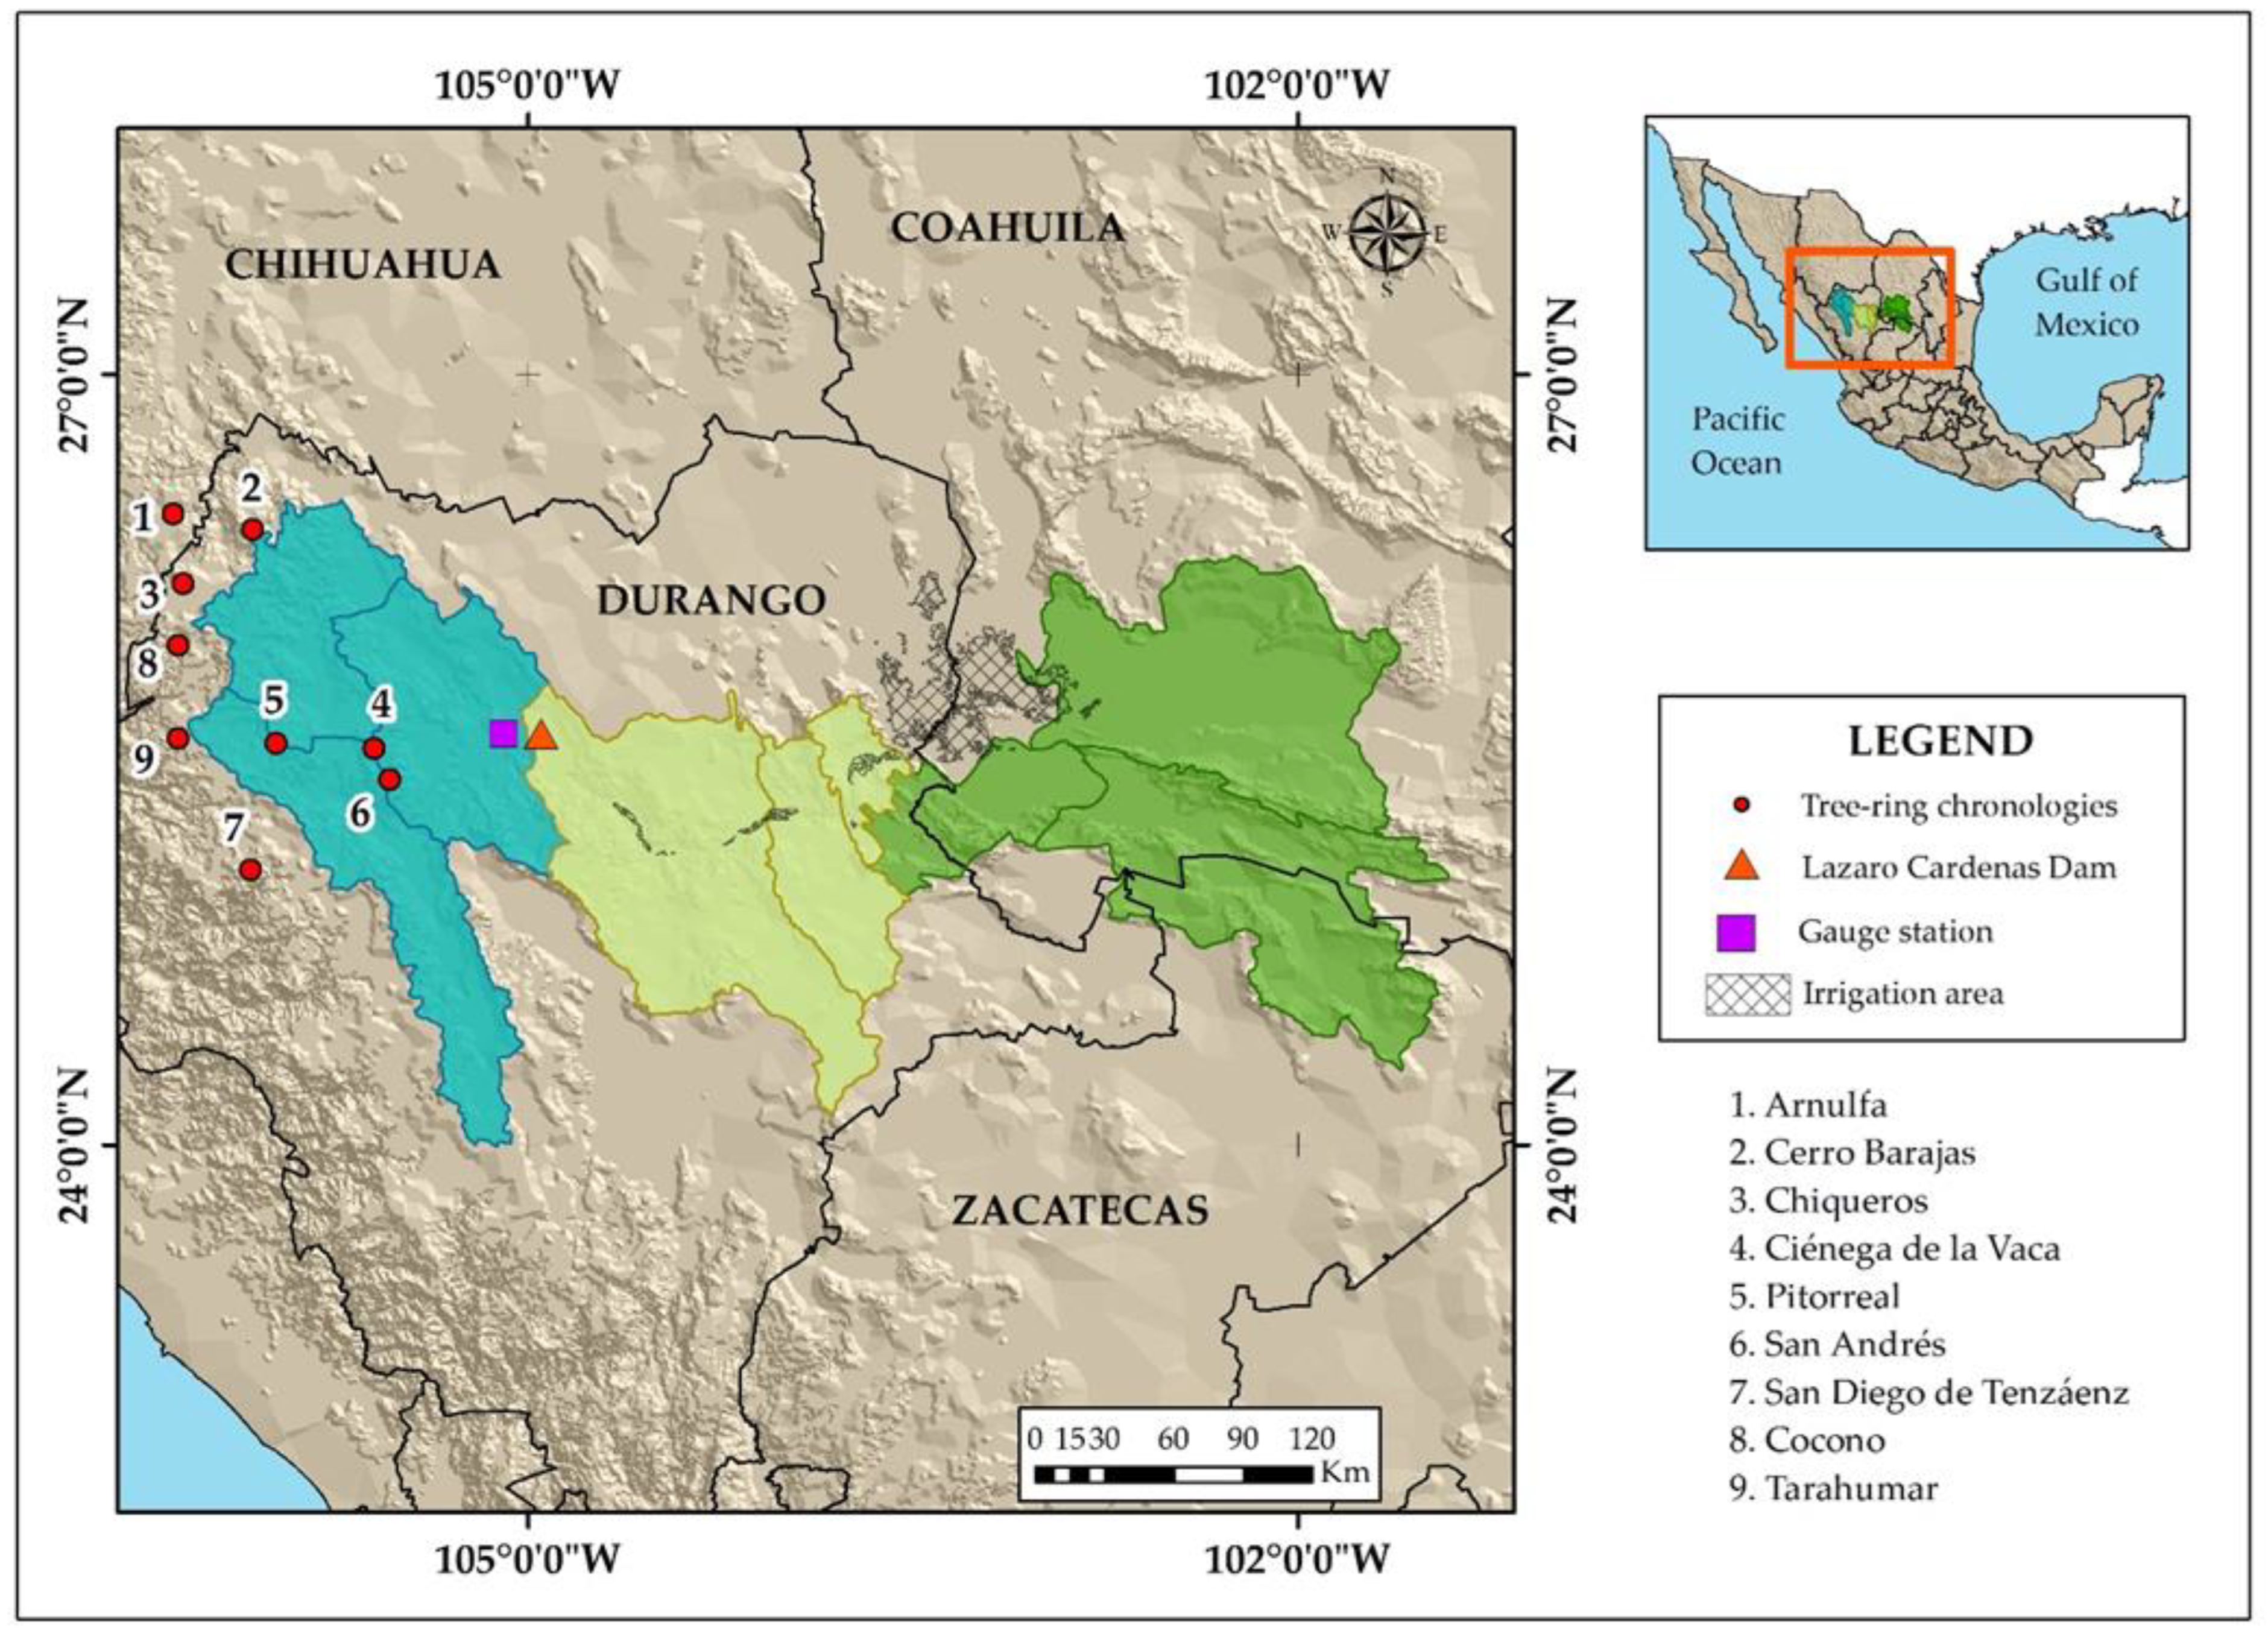
2.1. Study Area

The Nazas watershed (NZW) is part of the RH10 an enclosed basin of the WSM draining toward the Chihuahuan Desert. The NZW runoff is stored in the LCD, from where it is allocated for irrigation of the DDR 017. Over the last 20 years, the irrigated area in this irrigation district covers an average of 48,550 ha year−1, where the allocated annual volume has been 775 × 106 m3. Water is yield is from the upper-forested area of the watershed, which is composed by three main sub-basins: the Sardinas, with an average annual runoff volume yield of 284 × 106 m3; Rio Ramos, with a volume of 205 × 106 m3; and Rio Santiago Papasquiaro and Tepehuanes, with a volume of 286 × 106 m3. The water yielded at these sub-basins represent 92% of the total inflow to the LCD [14].
The NZW has a summer precipitation regime, where 88 to 90% of the annual precipitation falls from May to September, and the remaining (12 to 10 %) occurs in the winter months. The elevation gradient (1000 to 3200 m.a.s.l) influences the amount of precipitation. At lower elevations, characterized by semiarid climate and dominant desert vegetation, annual rainfall is around 200 mm, whereas at higher elevations, with a temperate and subhumid climate and dominated by a mixed-conifer forest and oak-pine communities, annual rainfall reaches over 800 mm [1].
The interannual and multiannual precipitation variability of the NZW has a significant influence of the ENSO warm phase (Niño), particularly in the cold season [17,18,19,20]. The amount of rainfall occurring in this seasonal period significantly affects the size of the earlywood and total ring-width of conifer species present in mixed conifer forests of the WSM, favoring a greater radial growth during the warm phase, and decreasing size in the cold phase [21,22]. On the other hand, intense El Niño events favor drier conditions, decreasing precipitation and diminishing water yield in the summer period [11,23]. Large-scale atmospheric phenomena influencing summer precipitation in this region, which accounts for 90% of the annual water yield, have been less studied. One specific case is the North American Monsoon System (NAMS), a circulation pattern that favors convective rains at higher-elevation portions of the western (winward) and eastern (leeward) slopes of the WSM [24]. In this system, summer rainfall is produced by an interaction between the continental warming, regional topography, and by the arrival of moisture from the Pacific and Atlantic oceans [25,26]. The variability of NAMS on inter-annual bases is more stable than ENSO variability, and this is probably the reason why there are few studies that model and forecast the behavior of this phenomenon [26,27,28].
In the Mexican Monsoon region, a portion of the rainfall occurs during a period where the ring formation is near completion. Therefore, the rainfall occurring at this seasonal period may not be fully integrated into the annual ring. Currently, this period has not been detected in the latewood portion of the annual rings of conifer species growing in the WSM [29]. In addition, the water holding capacity of the soil constitutes another constraint, since the amount of rainfall that often occurs in short periods exceeds the soil infiltration capacity of the dominant shallow soils present at this elevation. Nevertheless, summer rainfall is of great importance for rainfed agriculture, range production, groundwater recharge, and water storage purposes [2].
In the Southwestern United States, in contrast, where the influence of NAMS takes place from mid-June to late September, the latewood growth of conifer trees has been related to the amount of rainfall occurring in the summer season. Thus, research efforts have been focused on separating the climatic influence, or autocorrelation of the earlywood growth on the latewood growth, in order to capture the influence of this phenomenon [30,31,32].

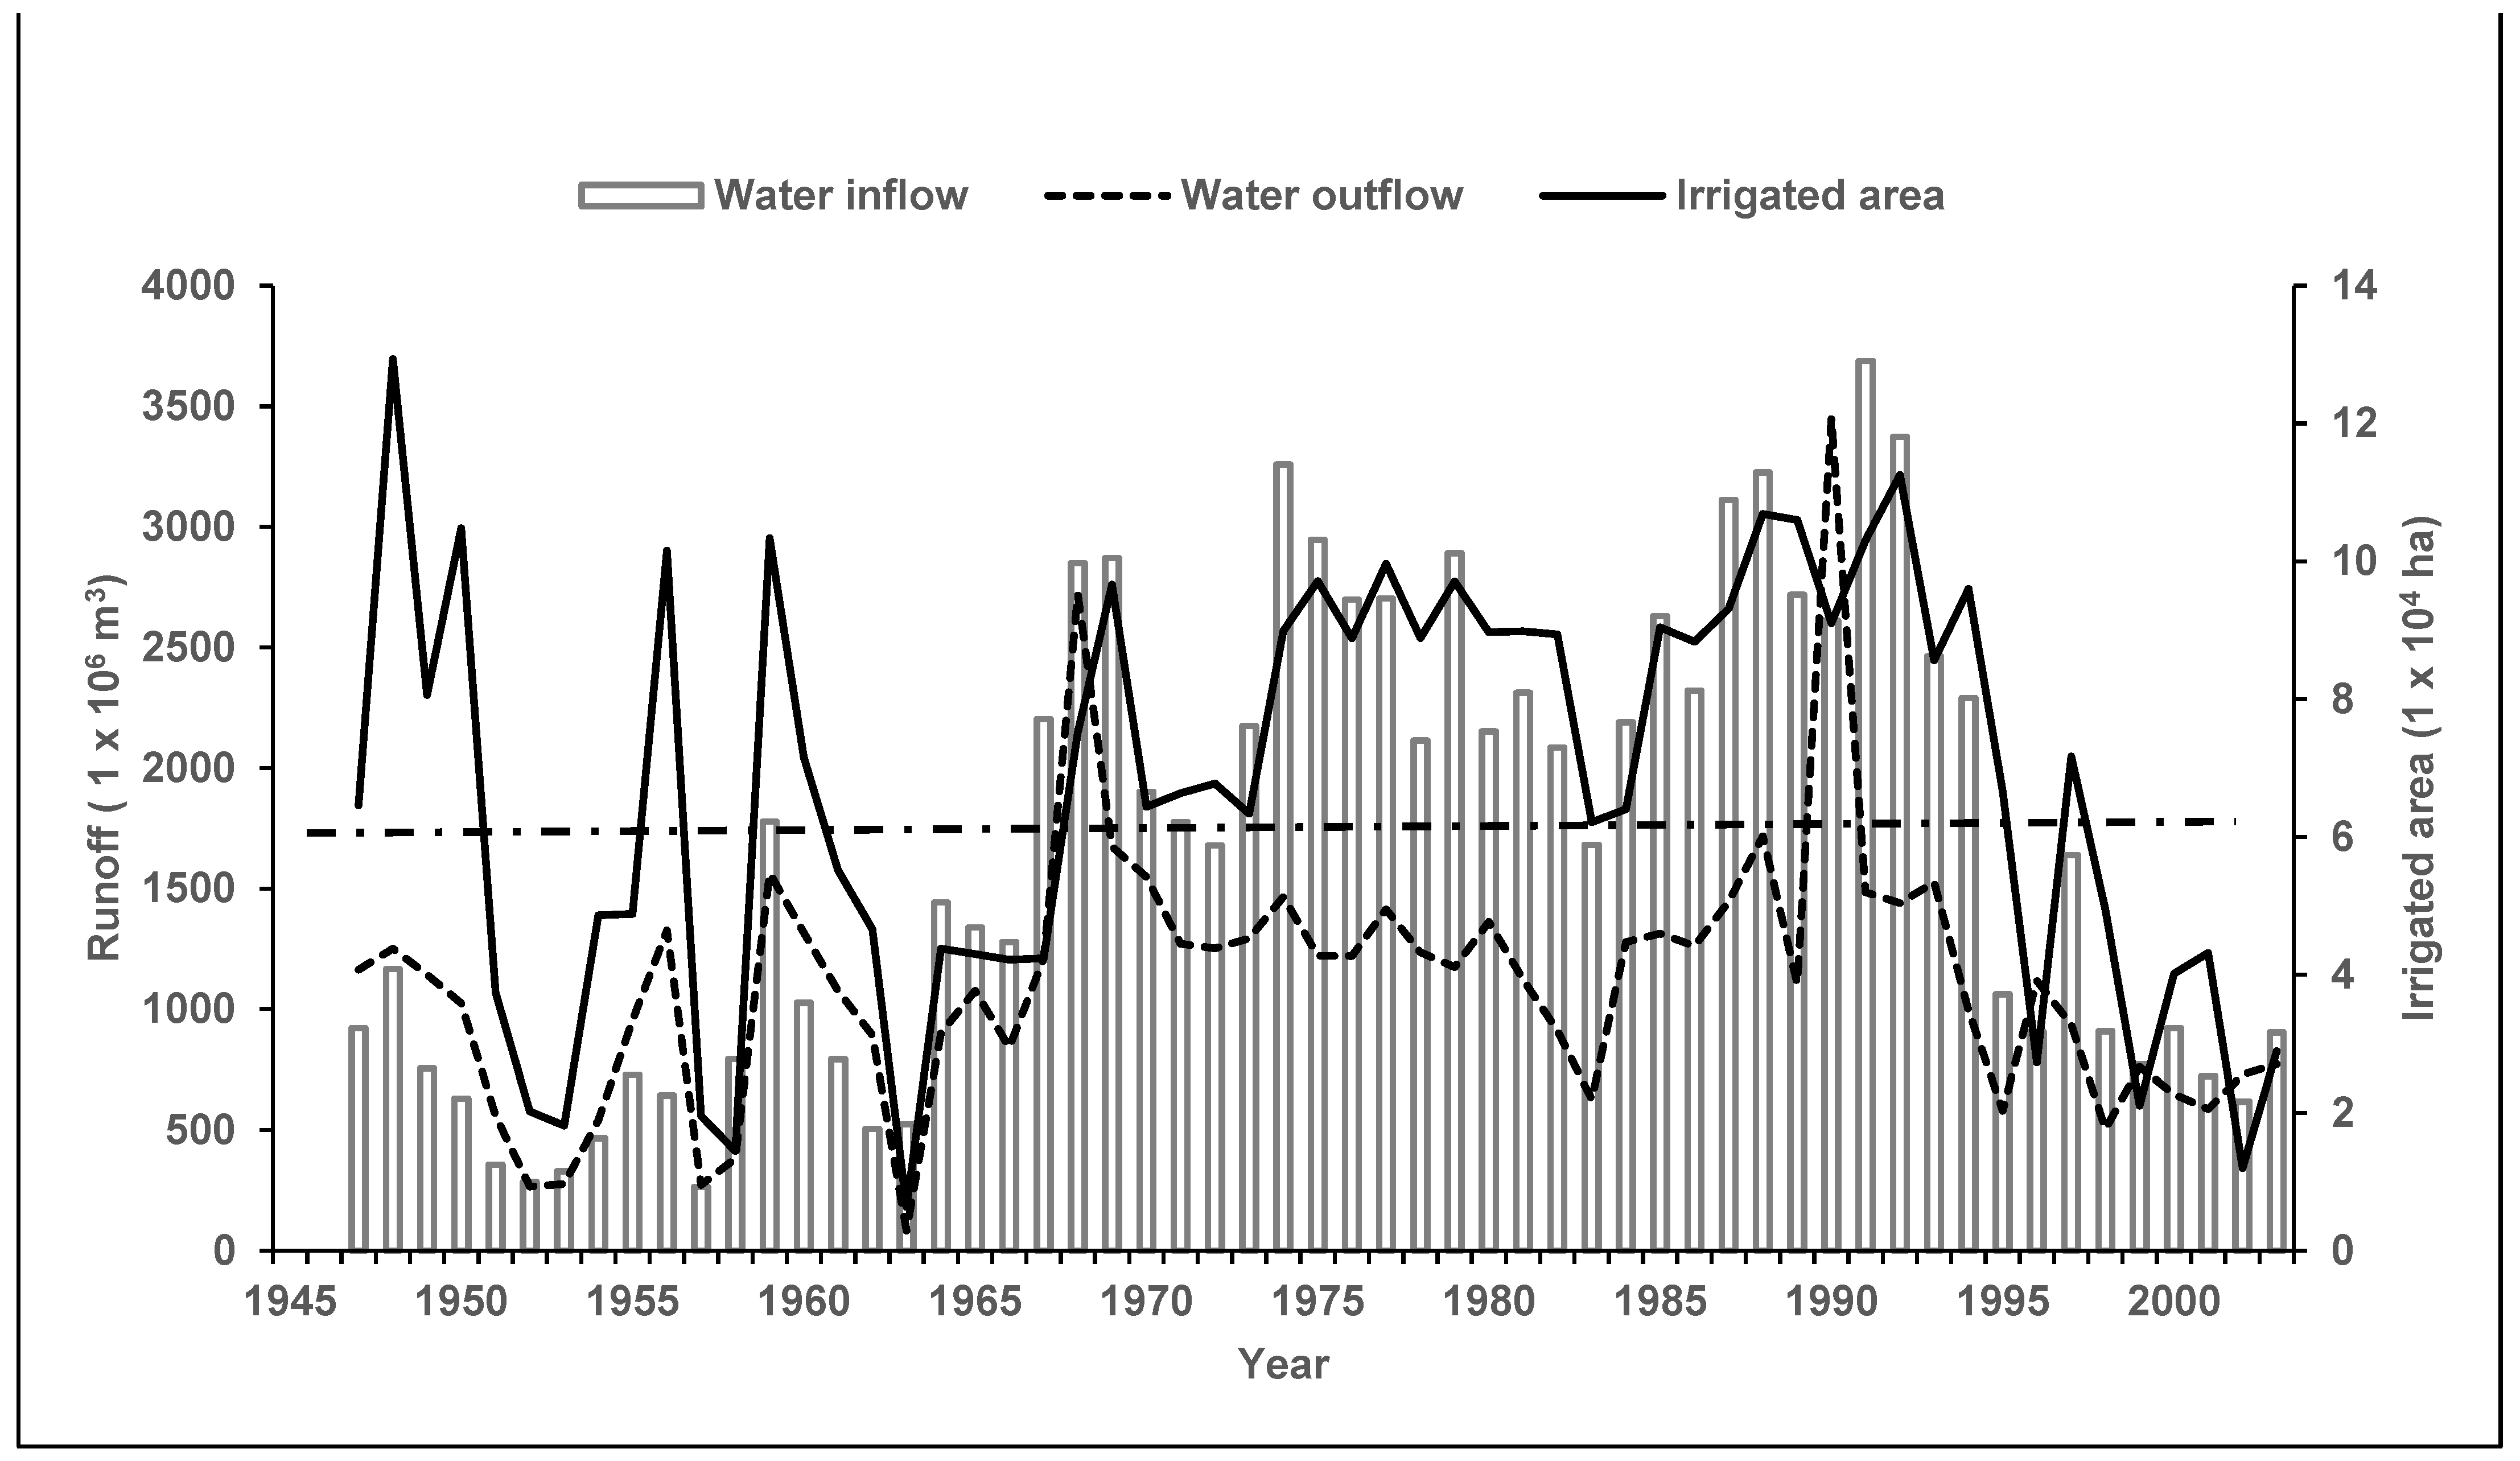
2.2. Hydrometric Records

Weather data for this study was recorded from a single gauge station known as Lazaro Cardenas or Palmito (25°25′42″ N−105°00′53″ W; 1521 m elevation) that records the water inflow to the Lazaro Cardenas Dam. The construction of this dam began in 1936 and ended in 1946 with the objective to store the water yield at the headwater subbasins of the Nazas watershed [33]. The available water inflow and water outflow records at the LCD extended from 1947 to 2006 (Figure 1). The annual water inflow is in average of 1676 × 106 m3 and represents 92% of the water yielded at the upper watershed. In the DDR 017, the water volume entry recorded in the water year constitutes the main source to determine the irrigated agricultural area in the following growing season.
The water volume to be allocated to the DDR 017 of a particular year is based on the volume stored at the LCD on October 1 of the previous year. The allocation of water is based on an algorithm proposed by the Mexican Institute of Water Technology (IMTA) and is based on 80 gauge records of water inflow for a policy of non-deficit water operation. However, the availability of long-term records of inflow is important to improve the algorithm used to define the amount of water outflow to be allocated for irrigation purposes of the DDR 017. The proposal indicates that, if the stored volume by the October 1 is <1650.5 × 106 m3, then the volume to be allocated could be 400 × 106 m3. On the other hand, if the stored volume is >1650.5 × 106 m3 but <2355.2 × 106 m3, then the water outflow is determined by multiplying the stored volume times 0.9933 and subtracting 1296.46 × 106 m3; a volume near 1300 × 106 m3 should remain in the reservoir for safety reasons of the dam infrastructure. According to this algorithm, the maximum volume to be allocated in any case could not exceed 1100 × 106 m3, although in extreme wet years (>2355.2 × 106 m3), some additional volume could be released to the main stream to protect the reservoir infrastructure and to favor ground water recharge.
Pluvial events with extraordinary streamflow (a standard deviation above the mean) have been recorded in the NZW in years 1968, 1974, 1991–1992, 2008, 2010, and 2016 [17]. Some of them are seen in Figure 1 and are reflected in the inflow gauge record of the same year or in the following year.

2.3. Dendrochronological Network

Hydroclimatic reconstructions for large basins usually require the development of an extensive dendrochronological assemblage of tree species sensitive to climatic variations, and when they are integrated into a representative chronology, be able to capture most of the climate variability that characterizes it [34]. The NZW and neighbor watersheds, due to their biodiversity, conifer richness, and oak species diversity constitute a region where, in the last two decades, over 50 tree-ring chronologies have been developed for climate reconstructions, and most of them have been included in the International Tree Ring Data Bank (https://www.ncei.noaa.gov/products/paleoclimatology/tree-ring, accessed on 27 May 2021). This network of tree-ring series is well distributed in the NZW and in other neighbor watersheds, but most of them are far away (over 50 km apart) from the upper-forested area of the Nazas watershed where water is yielded; therefore, in this study, most of those series were discarded for streamflow reconstruction purposes.
The site tree-ring series selected for this study (nine sites) are from two conifer species, Pseudotsuga menziesii (8 chronologies) and Picea chihuahuana (one chronology), both are climate-sensitive species with well-defined annual rings, where earlywood and latewood growth are influenced by different climatic conditions present in the previous or during the year of formation [29,35].
The sites for development the tree-ring series are located at the upper elevations of the NZW and in neighbor watersheds draining toward the Pacific Coastal Plane and to the Chihuahuan Desert (Figure 2). The forest area located at the upper section of the NZW yield over 95% of the runoff used at the lower section of the watershed where the irrigation area is located [14]. Therefore, we focused on those site chronologies as potential predictors for inflow reconstruction purposes.
Standard dendrochronological techniques were used to develop well-dated dendrochronological series. We detrended the ring-width measurements using negative exponential curves and straight lines of a positive or negative slope to eliminate age-related trends. This procedure was conducted in the dplR library package with the R program R Core Team 2013 [Bunn 2008]. The chronology indices were computed by ratio, dividing the ring-width measurements by the values obtained from the fitted curve. The Expressed Population Signal (EPS), Rbar, Coefficient of Efficiency, and Signal-to Noise ratio were obtained from the dplR package [36].

2.4. Development of Reconstruction Model

A correlation matrix was computed for the nine ring-width chronologies to determine potential association between chronologies and to establish if there was a similar response between the ones located in the upper subbasin section of the NZW and those distributed in neighbor watersheds. The amount of variance explained by the chronologies with a common climate signal was obtained by running a Principal Component Analysis (PCA).
Factor scores from the first and second principal component, full pool (e.g., considering all nine sites) and a stepwise regression procedure were tested for inflow reconstruction. The multiple linear regression relied on stepwise procedure, which iteratively adds and removes predictors (e.g., site chronologies) in order to find out the variables in the best performing model with the higher explained variance and lowest Akaike Information Criterion (AIC) [37]. The regression models were summarized by the adjusted R2, and AIC; and assessed for possible multicollinearity of predictors with the variance inflation factors (VIF < 5). Residuals for all models were inspected for normality, trend and autocorrelation. Once we selected the best model, we ran a 1000 bootstrap regression in order to provide a more accurate inference among predictors. In this case, we used a bootstrap with resampling, which results in multiple replicates of the original data. This procedure is recommended when small databases are used and data does not come from a normal distribution [37].
To verify the multiple regression model, the calibration-verification procedure was conducted on the two half subperiods calibrating on one and verifying on the other subperiod and vice versa. Once we selected the best model (highest variance explained and lowest AIC), 60% of the inflow records (34 years) was used for calibration and 40% (33 years) for verification. If both subperiods were significant for the statistical tests (correlation, reduction of error, negative first difference), then the whole period of recorded data was used to build the model for reconstruction purposes.
Given the lack of precipitation records in the upper forested area where water is yielded, we used a reanalysis procedure from NASA’s NLDAS-2 model to estimate monthly precipitation data [38], and to determine the relationship between both monthly precipitation and recorded annual water inflow.

2.5. Ocean-Atmosphere Phenomena

The influence of ocean-atmospheric phenomena (ENSO, PDO, AMO, and NAMS) on the water yield at the upper NZW was analyzed by determining the association with different indices of each phenomenon. The influence of the ENSO was analyzed by three indices, the first one involving reconstructed values of the Southern Oscillation Index (SOI_Rec) from December to February, period 1707–1977 [39]; the second one is the Multivariate ENSO Index (MEI) regarded as the most comprehensive index for monitoring ENSO since it combines analysis of multiple meteorological and oceanographic components [40]; the MEI records were obtained from NOAA (https://psl.noaa.gov/enso/mei.ext/table.ext.html, accessed on 28 May 2021); and the third ENSO index is the Tropical Rainfall Index (TRI) for the period 1894–1995, an estimate of ENSO variation using rainfall anomalies in the central Pacific that is more stable than the Tahiti-Darwin [41]. The indices of the PDO phenomenon, considered as a long-term ocean fluctuation of the Pacific Ocean and characterized by frequencies of 20 to 30 years [42], were obtained from NOAA (https://www.ncei.noaa.gov/pub/data/cmb/ersst/v5/index/ersst.v5.pdo.dat, accessed on 28 May 2021).

2.6. Drought Indices

The reconstructed water inflow was compared against the instrumental and reconstructed June–August Palmer Drought Severity Index (PDSI) [10]. This drought index is based in a hydrological balance for the summer months and constitutes a good measure of the available water for rainfed agriculture, grassland productivity, and filling of the reservoirs, in such a way that the water inflow to the reservoirs and PDSI values may constitute a proxy to analyze water yield fluctuations and potential trends on the watershed.
The fluctuations in water inflow variability into the LCD were also investigated using spectral analysis techniques and were used to determine which potential circulation modes exerted the greatest influence on affecting the streamflow variability. The periods in which the reconstruction shows significant frequencies was determined with a Spectral Wavelet Analysis developed in the library biwavelet in R software [43].

3. Results

3.1. Quality of Tree-Ring Chronologies

The dendrochronological parameters of the tree-ring chronologies distributed on the upper-forested sub-basins and neighbor watersheds involved in assessing their quality are shown in Table 1.
Based on the series intercorrelation, average mean sensitivity, Rbar, coefficient of efficiency, EPS, and SNR values, all of the chronologies are considered suitable for climate reconstruction purposes [44].

3.2. Tree-Ring Chronologies Association and Common Climatic Response

The correlation matrix shows that the association between chronologies for the common period 1773–2002 was significant (p < 0.01) for all the comparisons. Higher correlations, however, were found when comparing chronologies developed from the same species, i.e., Psedutosuga menziessi. The association was lower between the Arnulfa (ARN) chronology developed from Picea chihuahuana and the rest of P. menziesii chronologies. Results of the Principal Component Analysis indicated the presence of two principal components with the highest variance. The first principal component (PC1) loaded most of the chronologies explaining 67% of the variance, indicating that most of the chronologies are responding to a common climatic factor (Figure 3).
The ring-width chronologies explaining greater variance in PC1 were COC, CHI, PIT, and CBA, whereas in PC2 was ARN (Figure 4).

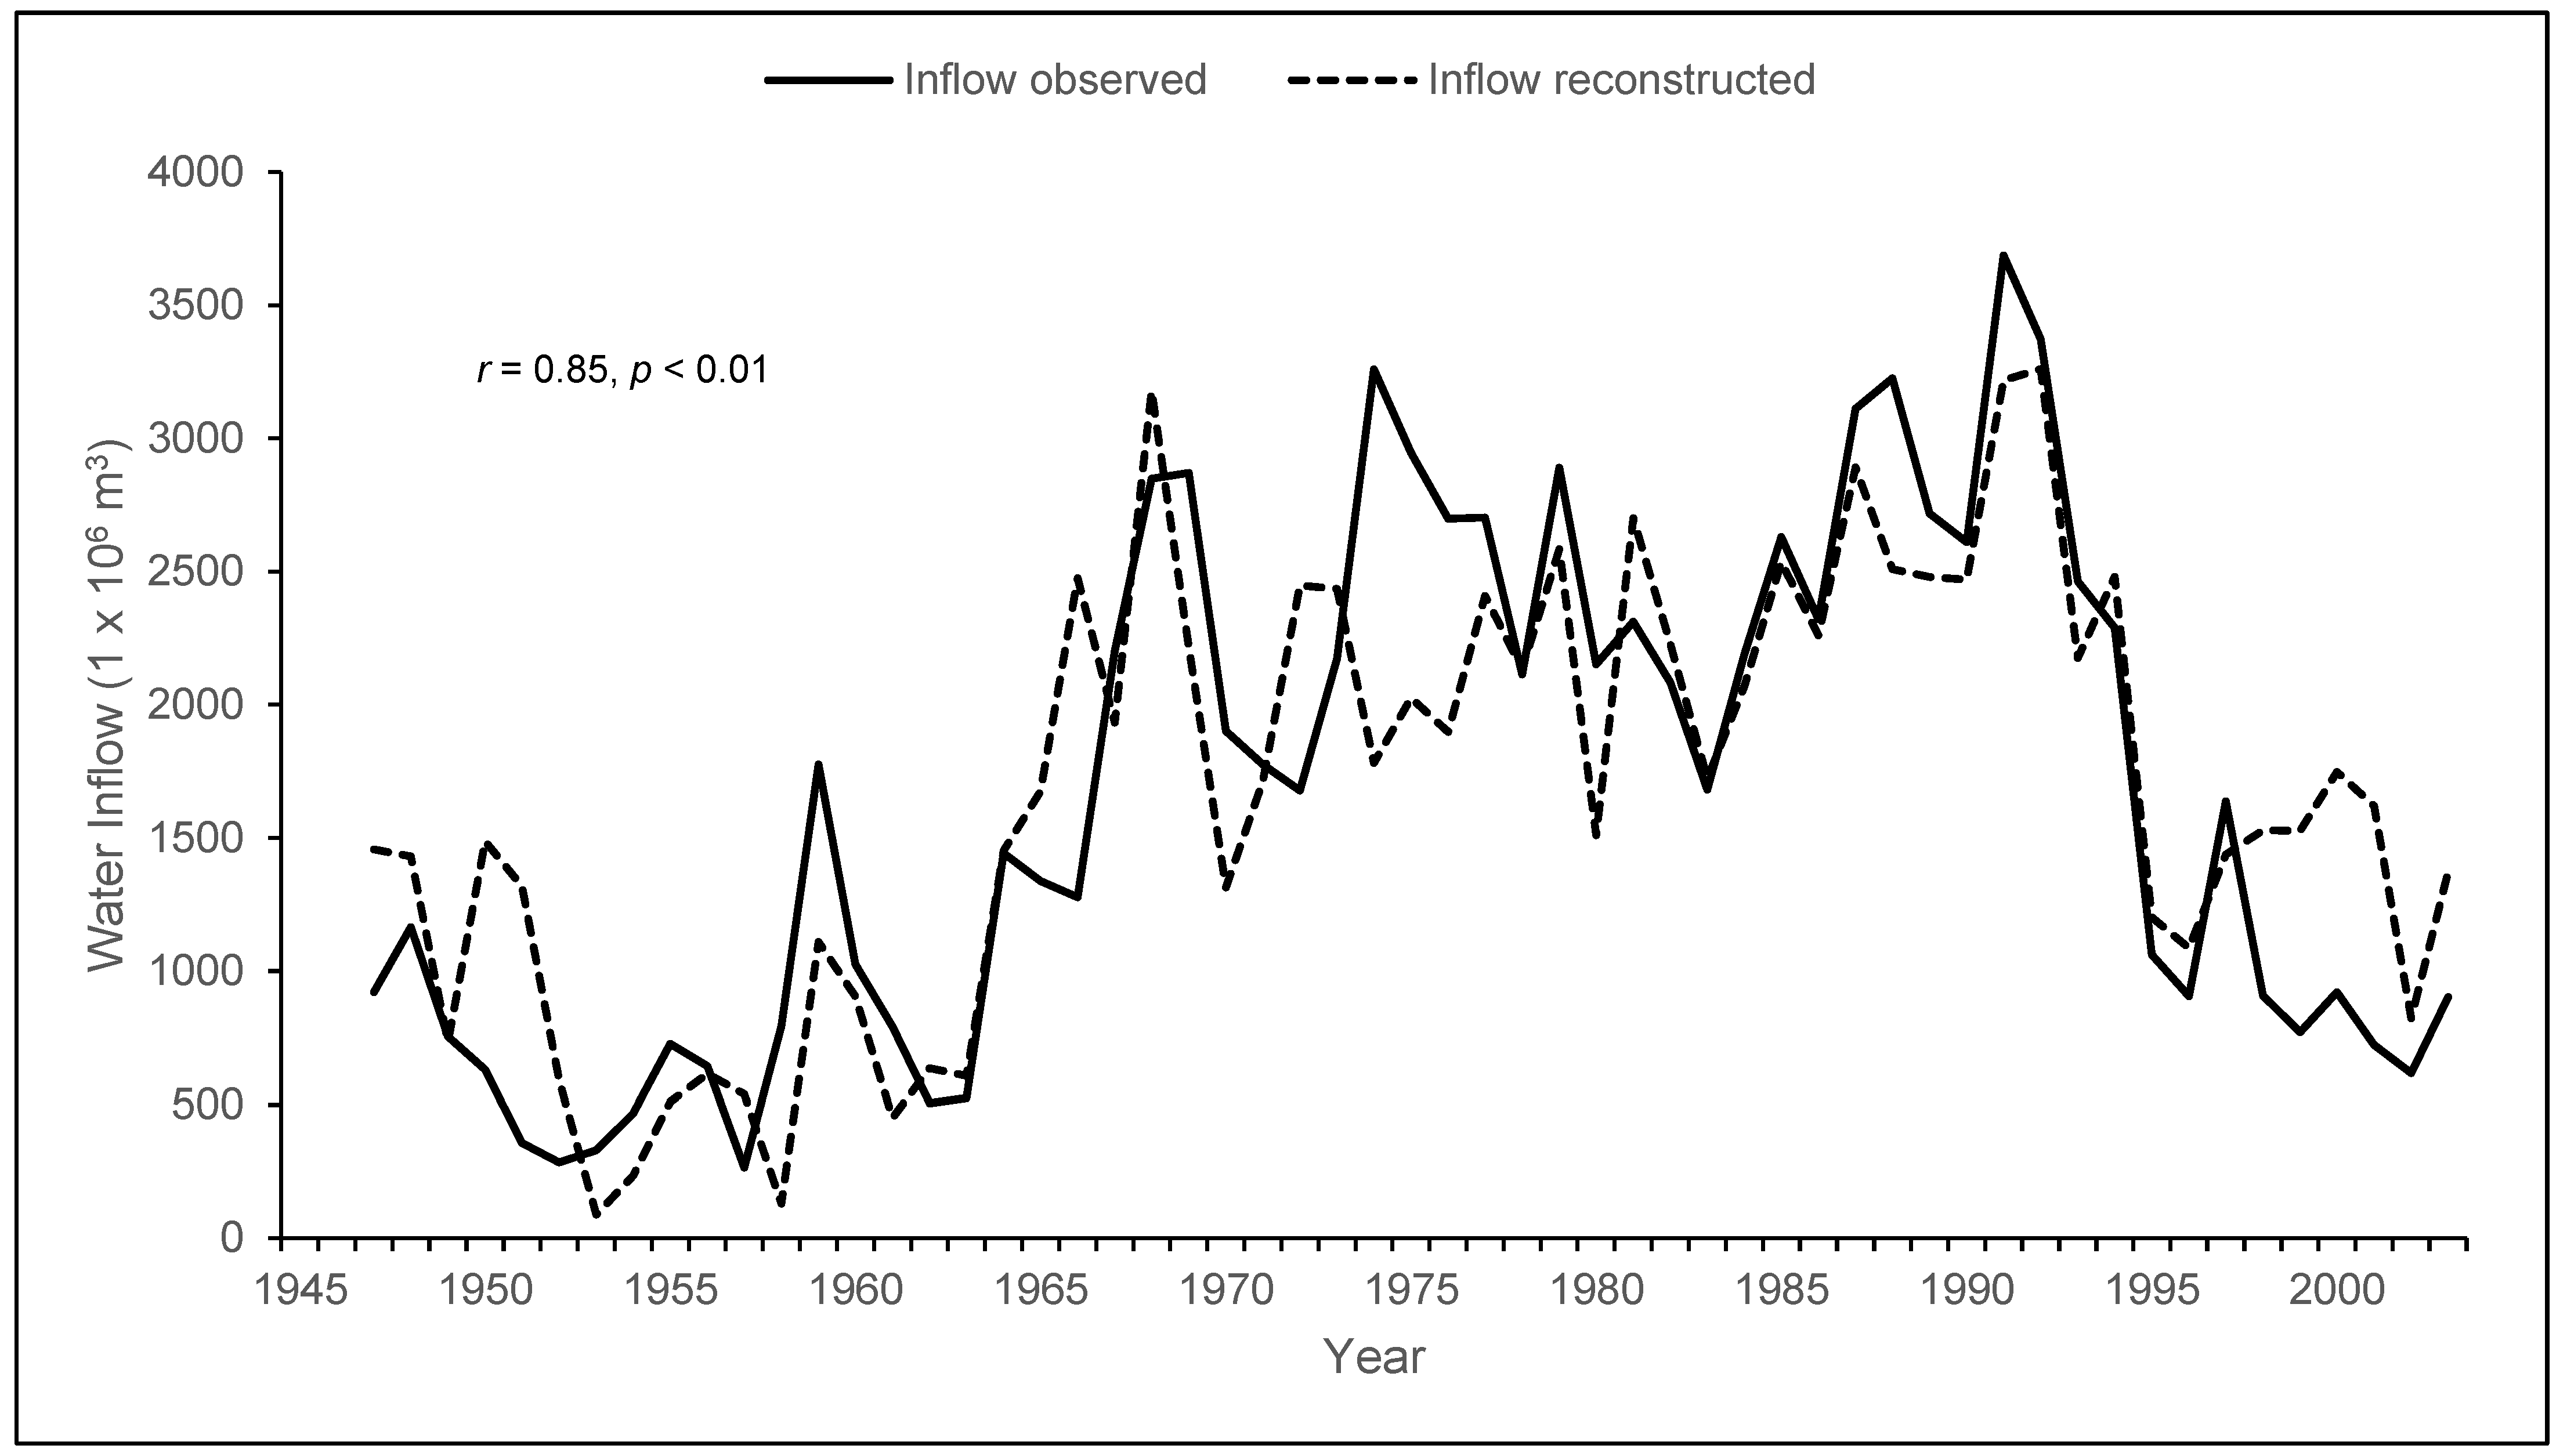
3.3. Relationship between Dendrochronological Series and Water Inflow to the Lazaro Cardenas Dam

To assess the relationship between the tree-ring chronologiers and common variance captured by PC1 and PC2 eigenvectors and water inflow into the LCD, a Pearson correlation analysis was applied for the period 1947–2003. Correlation values were significant for the PC eigenvalues (PC1, PC2), and for the single chronologies (Table 2).
The PC1 factor scores and the ARN chronology showed the highest correlation (0.75, 0.82, repectively) with water inflow records, conversely, poor associations (0.24, 0.15, and 0.29) were found for PIT, SAN and SDT, respectively, and were discarded from further analysis.
The regression models accounted for between 66% and 70% of the variance of flow, for the pooled and stepwise models, respectively. However, not all sites were significant for the full pool model, for instance, only three sites were relevant. In concordance with these results, the stepwise procedure selected the same three sites as the most relevant explaining the water inflow (ARN, CBA, and COC). The statistics for the tested models are presented in Table 3; however, the best reconstruction model was obtained with the stepwise procedure since it showed the highest adjusted R2 and lowest AIC (Table 3).These results are confirmed with the 1000 bootstrap regression runs providing an accurate inference about predictors (complemental material). Based on these results, we decided to use the ARN, CBA, and COC chronologies for developing a reconstruction model for the water inflow to the LCD.
The residual analysis indicated normality (p = 0.71) and homoscedastic error variance (p = 0.49) for the stepwise model. Furthermore, all sites included in the selected model showed a VIF lower than five (VIF < 5) which assures the no collinearity between response variables. For calibration purposes, we used subperiods 1947–1980, while the verification was from 1981–2003, and the total period 1948–2003 (Table 4).
All the statistical tests for the calibration-verification procedure were significant (Table 5).
Given that the total period and the half subperiods of recorded data were significant for the correlation analysis, we used the whole period (1948–2003) to develop a reconstruction model of the water inflow to the LCD. The dependent variable in this model was the annual water inflow to the LCD, whereas the independent variables were the annual ring-width index values of the ARN, CBA, and COC tree ring sites.
The regression equation was:
Y i = 1156.8 + 3431.1 X 1 i + 952.2 X 2 i 1344.2 X 3 i
where:
  • Yi = Annual inflow, X1i, X2i, X3i = Ring-width index (standard version) for the ARN, CBA and COC sites, respectively
A graphical comparison between the water inflow records and the reconstructed inflow shows a good agreement between both variables with a correlation value of 0.85 (p < 0.01, n = 56). Most of the reconstructed data was in agreement with the observed inflow, but some specific years showed great differences, i.e., 1951, 1966, and 1974 (Figure 5).

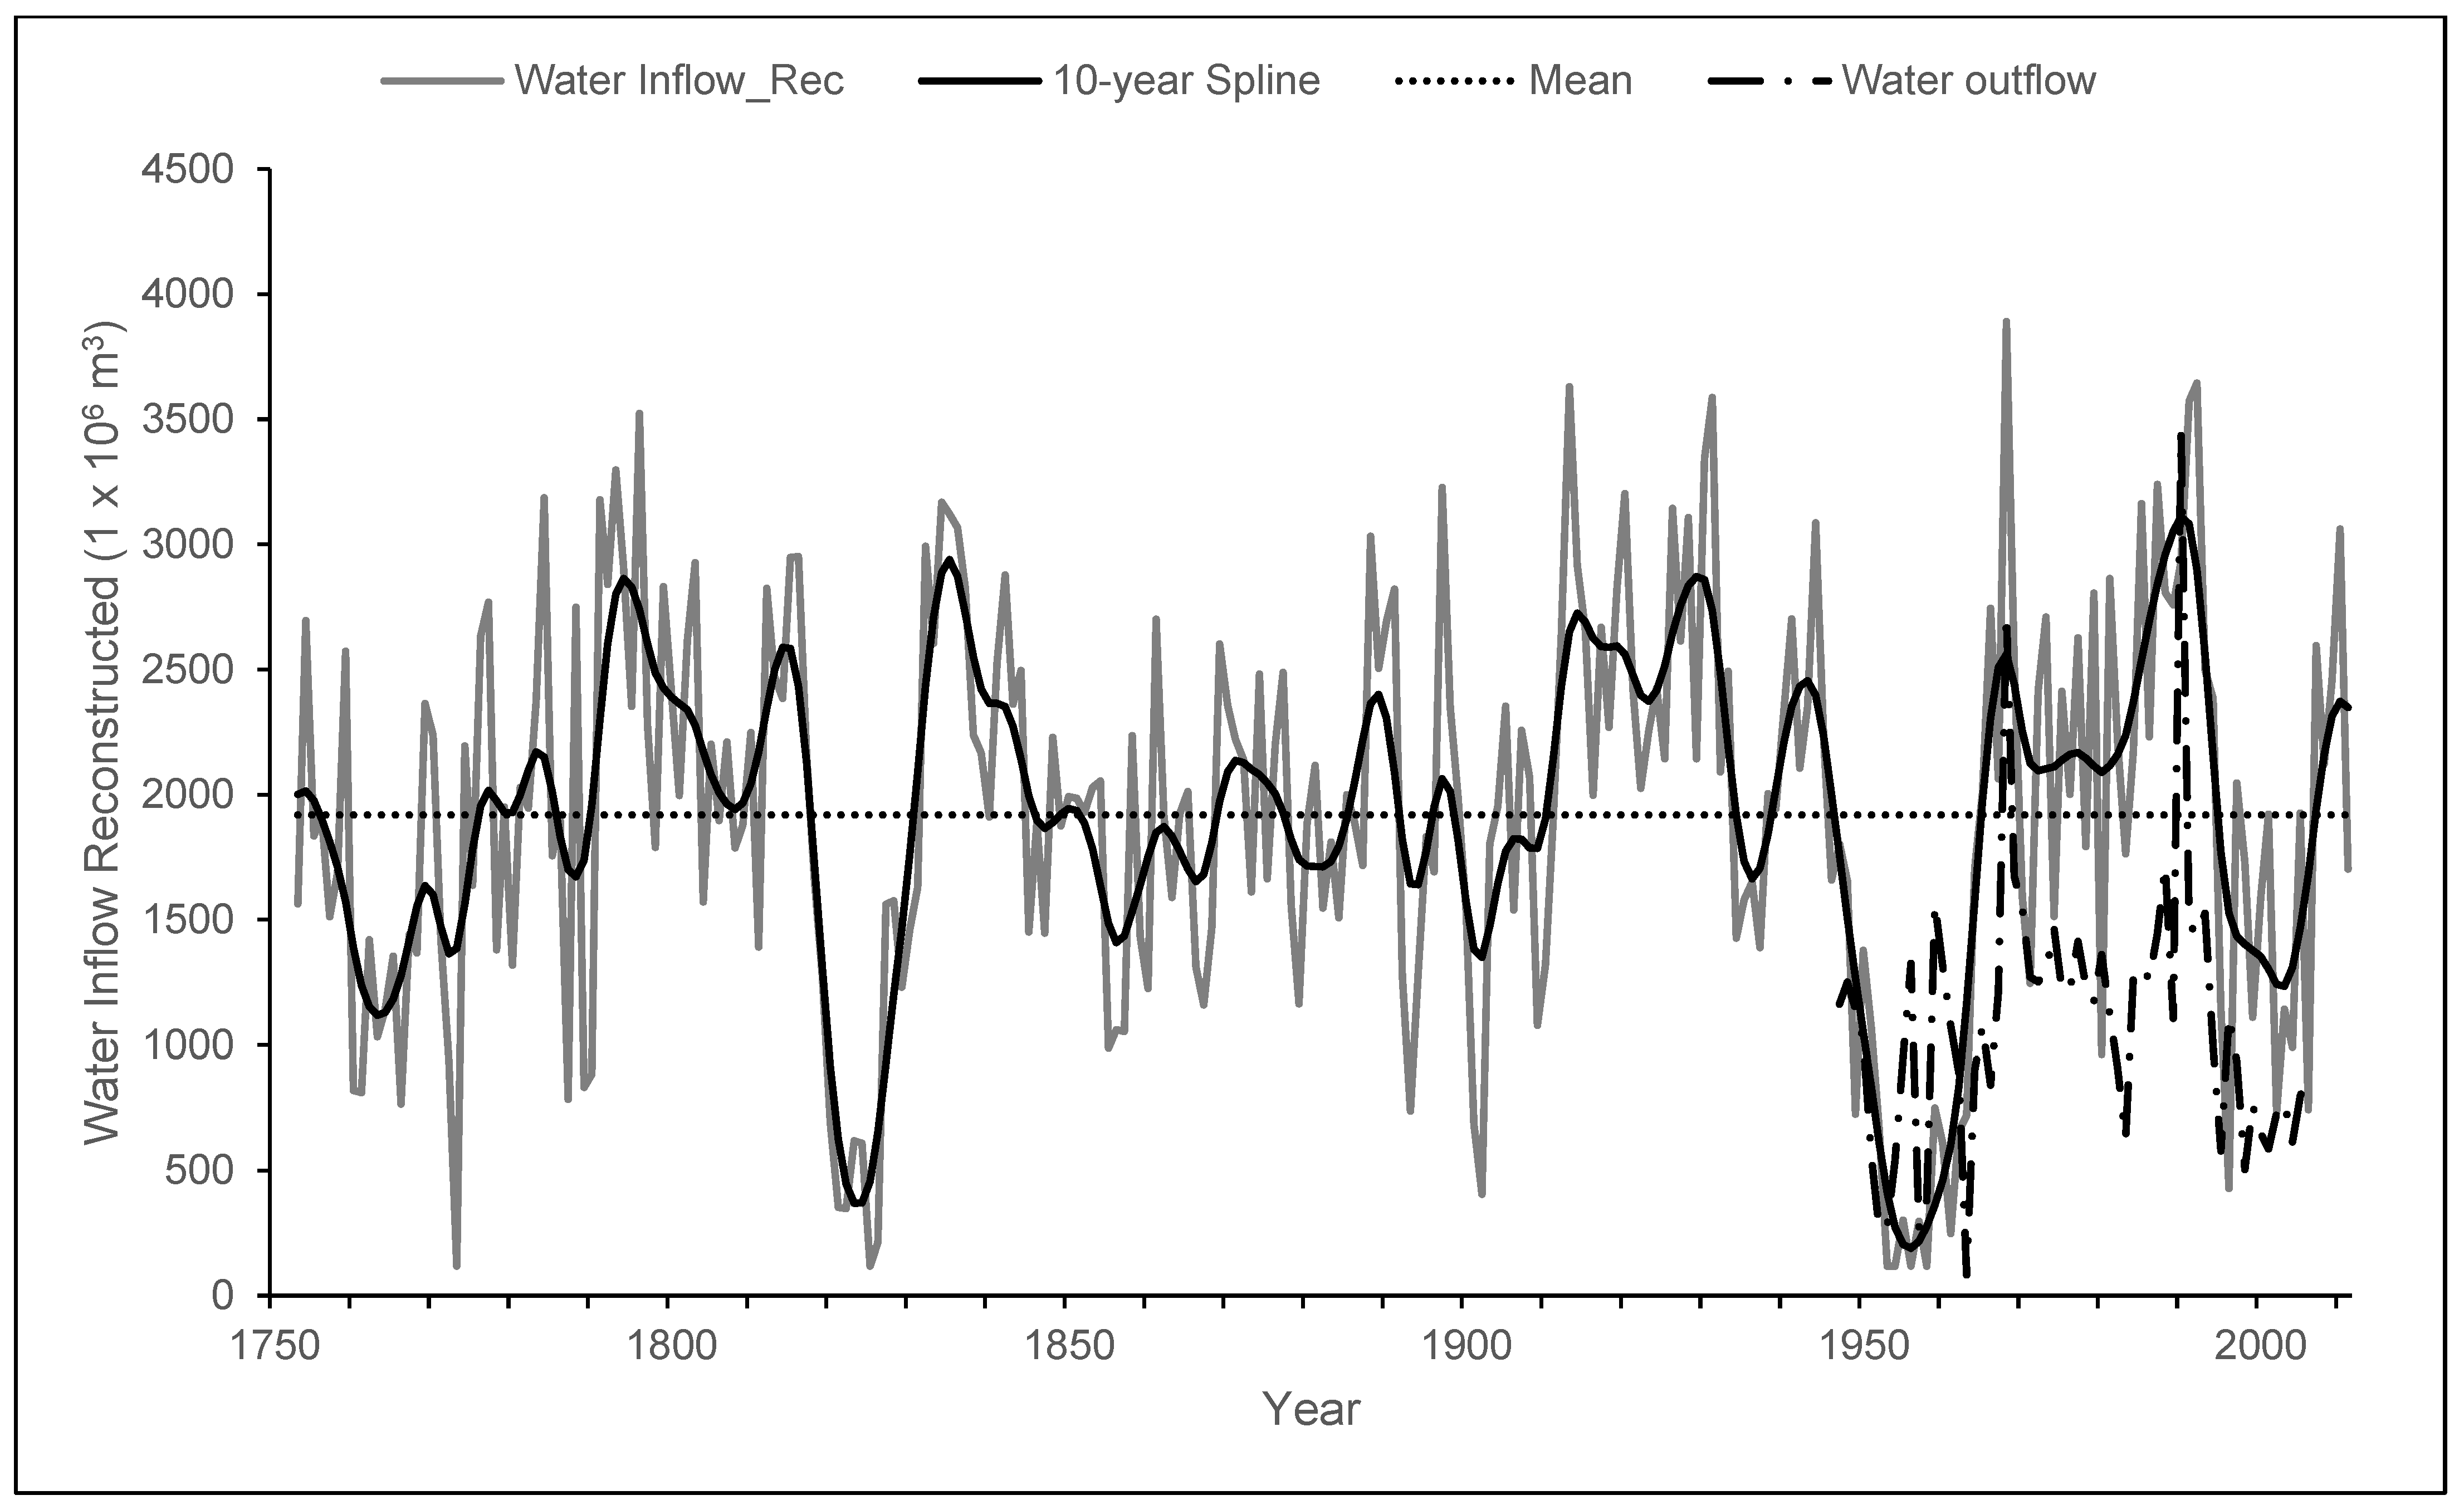
3.4. Water Inflow Reconstruction

Given that most of the statistics were significant for the verification analysis, the stepwise model developed with the gauged records 1947–2003 was used to reconstruct the water yield at the upper NZW on the total length of the chronology (Figure 6). This information allows a more solid analysis of the water inflow to the LCD and the water outflow for irrigation purposes.
The reconstruction shows the presence of extreme hydroclimatic events affecting the amount of runoff reaching the LCD. Thus, extreme low inflow events (Mean − 1.0 S.D.) occurred from 1771 to 1773, followed by minimum inflow volumes in 1787 and 1789. The period from 1821 to 1826 had a mean inflow of 578 × 106 m3; however, the most extended period with extreme low inflow occurred from 1951 to 1963 (12 years) with an average of 595 × 106 m3. On the other hand, high inflow events (Mean + 1.0 S.D.) were recorded in years 1754, 1759, 1791–1803, 1944, 1968, and 1990–1992. However, when we obtained descriptive statistics for 50-years subperiods, we found that the greater mean inflow occurred for the 1903–1952 subperiod and the minimum for the 1853–2002 subperiod, although the means were not statistically different. (Table 6).
When an inflow analysis was conducted for 50-year subperiods, we did not find significant differences in the mean (Table 6).
Based on the reconstructed water inflow to the LCD, and considering the algorithm proposed by the research hydrologists of IMTA to define the annual water allocation for irrigation in the Comarca Lagunera region, the dominant water outflow was <1100 × 106 m3 with a probability of occurrence of 78% (36% + 42%). A close result was obtained with the recorded outflow when a water outflow <1100 × 106 m3 was released in 74% (49% + 25%) of the years (Table 7).

3.5. Influence of Atmospheric Circulation Patterns

The reconstructed water inflow shows the influence of several ocean-atmosphere phenomena affecting its high-and low frequency variability. The ENSO phenomenon, throughout its diverse indices (SOI, MEI, TRI) and based on a Pearson correlation analysis, had a significant influence on the water inflow variability (−0.24, 0.25, and 0.28, respectively). Given that water inflow corresponds to the annual runoff reaching the LCD, the effect of this phenomenon at the annual level is lower as when is compared at the seasonal level, e.g., ENSO exerts a greater influence on the precipitation variability of the winter-spring season. Other phenomena such as AMO, NAMS, and PDO also affect the water inflow behavior of the Nazas watershed (Table 8).

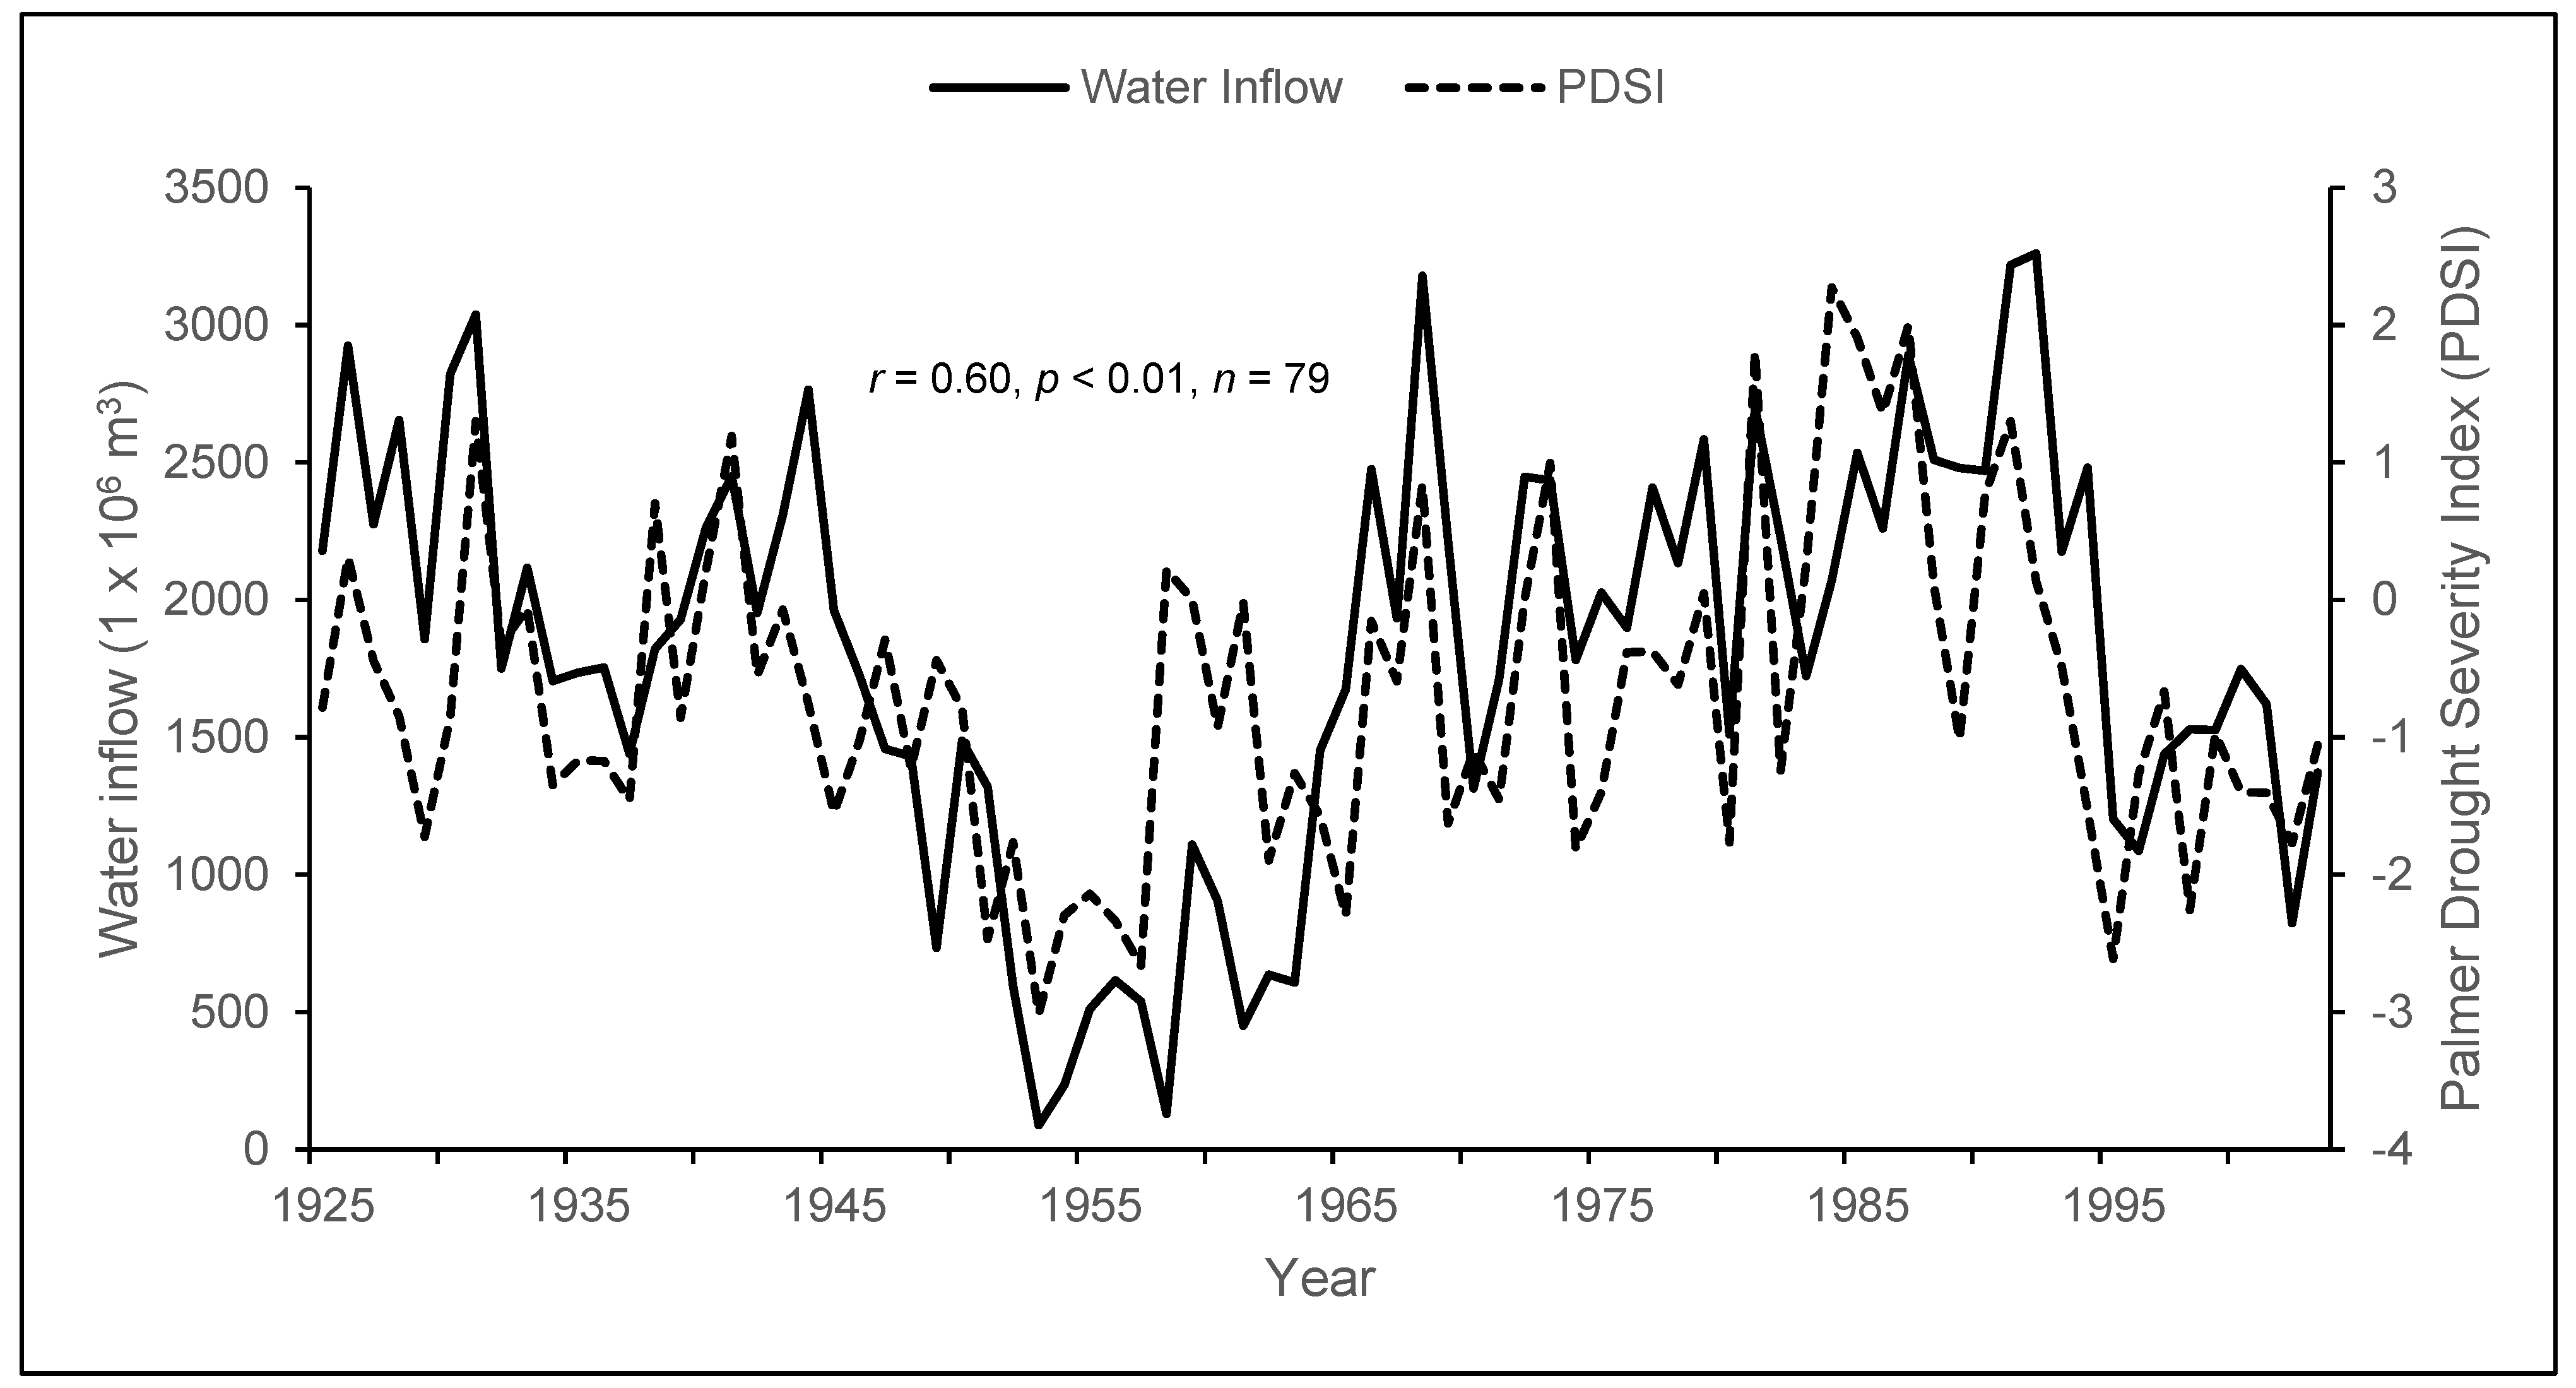
3.6. Influence of Drough Indices

The North American Monsoon System (NAMS) is the most important phenomenon affecting summer precipitation along the WSM and the one that most explains the interannual variability of the runoff volumes reaching the LCD. This finding is corroborated by a significant relationship with this phenomenon (r = 0.48, p < 0.01). On the other hand, given that the PDSI for the summer season (June–August) represents a hydrological balance for that period it constitutes a good indicator of the NAMS influence on this region [10]. The association between the inflow reconstruction and the instrumental June–August PDSI was of 0.60 (p < 0.01), resulting in greater or reduced runoff volumes reaching the reservoirs in the NZW (Figure 7).
The association between the monthly precipitation data obtained by the NLDAS-2 model and the reconstructed streamflow data indicated that the accumulated precipitation from July to October had a correlation value of 0.42 (p < 0.05, 1981–2003), explaining 18% of the annual water inflow to the LCD.

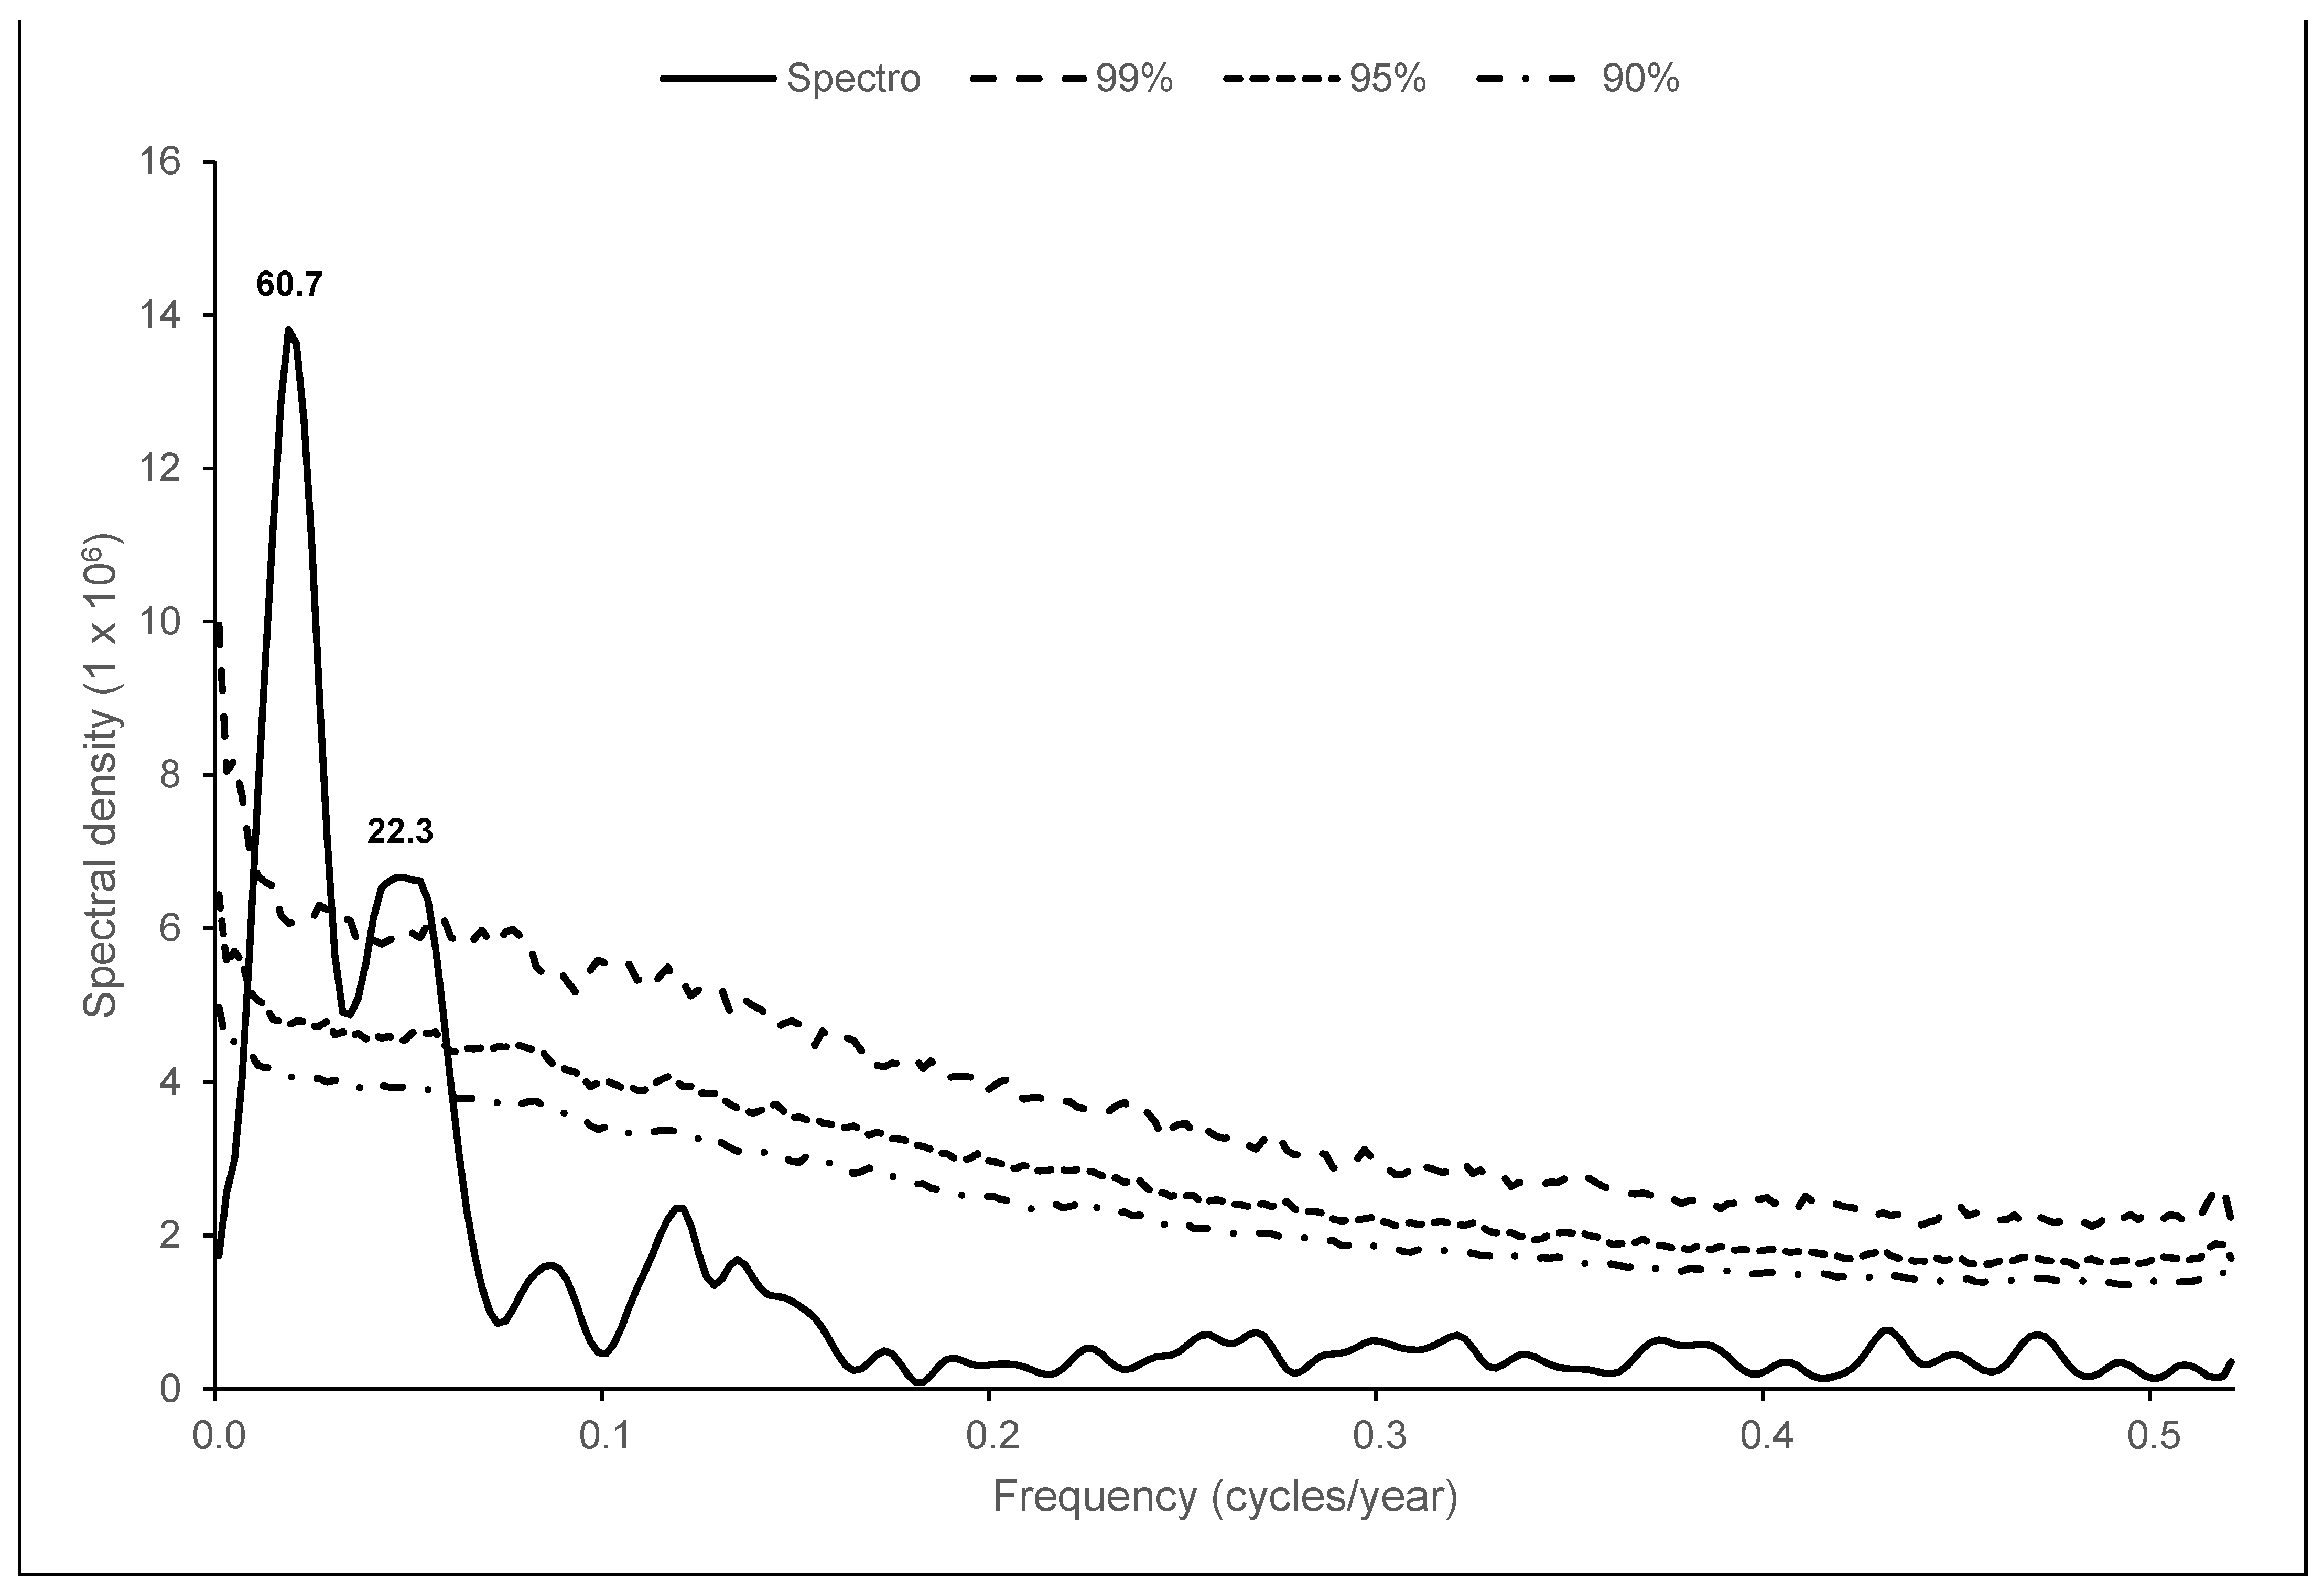
3.7. Dominant Frequencies in the Water Inflow Reconstruction

The reconstructed water inflow for the last 251 years shows significant wavelengths influenced by dominant interannual climatic conditions at 21.2 and 64.98 years, which may be attributed to the influence of atmospheric circulatory modes (Figure 8).
According to the Wavelet Power Analysis, significant wavelengths < 10 years were present along the streamflow reconstruction period (i.e., 1770s, 1780s, 1790s, 1850s, 1900s, 1930s, and 1960s), but the most significant wavelength was at 65 years, particularly from Spectry densityaround 1890 to 1910. The 21-year wavelength appears from 1810 to around 1830 (Figure 9).

4. Discussion

The assemblage of tree-ring chronologies developed at the headwaters of the NZW and contiguous watersheds draining toward the western and eastern slopes of the WSM represent one of the most complete dendrochronological networks ever developed for a watershed in northern Mexico. However, a limitation for extracting the climatic signal of these time series and to extend climatic information back in time is the limited availability of weather and gauged streamflow records needed to establish a proper relationship between the dendrochronological series and the hydroclimatic information [21].
Even though the chronologies developed in the subbasins of the NZW showed a significant response with the water inflow records to the LCD, a higher correlation was observed when combining different chronologies present in and outside of the upper-forested subbasins of the NZW. The greatest response, however, was obtained when using a stepwise regression procedure to derive a mixed model involving three of the chronologies (Arnulfa, Cerro Barajas, and Cocono) located at the headwaters of the NZW. High-elevation sites (2800 to 3000 m asl) on the western slopes of the WSM receive an annual precipitation around a 1000 mm, coming mostly on the summer months when NAMS has its greater impact on this region. In contrast, on the leeward side of the WSM, there is a decrease in precipitation due to a lower moisture content of dominant winds, which drop their moisture content on the windward side of the WSM. This condition affects forest productivity and runoff volumes draining toward the LCD that are lower in comparison to the ones recorded on the western slopes of the WSM [1].
The annual radial growth of tree species growing outside the limits of a particular watershed is often involved in dendrochronological studies to explain the behavior of climate and streamflow variability in locations far away from the place where the trees grew [50]. This response is explained by the fact that climatic factors (precipitation, evapotranspiration) limiting water availability for tree growth are the same variables controlling streamflow [51]. Streamflow reconstructions in the Colorado River basin developed by Woodhouse et al. [51] included tree-ring chronologies distributed all over the basin, but far away from gauge stations, and explained between 72 to 81% of the interannual streamflow variability. Similar studies have been conducted in basins of Canada [52], Argentina [53], Mexico [21,29,54], and other parts of the world [55,56].
In this study, of the nine chronologies involved, those with a better response with the water inflow records were Pseudotsuga menziesii and Picea chihuahuana located at the headwaters of the NZW. The development of a network of chronologies for streamflow reconstruction purposes is suitable in cases where the water yield produced in the whole watershed has a significant contribution to the streamflow volumes recorded at a gauge located at some point on the main stream. However, in semiarid watersheds where water yield come from specific locations, developing a few climate-sensitive chronologies may capture most of the climate variability required to explain hydrological records and to model their past behavior.
Given the high-climate sensitivity of P. chihuahuana to water yield in the NZW, by improving the number of chronologies of this species, we could develop a better statistically supported model to extend back in time inflow reconstructions in this watershed and to improve the results provided in this study.
The interannual and multiannual precipitation variability in basins located along he WSM is significantly influenced by ENSO, which favors a greater winter-spring rainfall in the warm phase (El Niño) and produces droughts in the cold phase (La Niña) [17,18,19,21,23,32].
Rainfall occurring in the winter-spring season favors conifers’ earlywood growth and total ring-width in northern Mexico increasing biomass production [57]. However, cool season precipitation and streamflow represent less than 20% of the total annual precipitation and less than 10 % of the annual streamflow volume in the NZW. Intense Niño years, however, may produce extraordinary streamflow volumes in the winter-spring season as in years of 1958, 1968, 2008, 2010, and 1991–1992, when additional streamflow of the LCD was released for structural safety reasons and to prevent social and economic damages to settlements located downstream of the reservoir [58].
The Influence of intense ENSO events in the summer season is weak, except when this phenomenon is in phase with the PDO, thus wet conditions in summer are favored when the PDO is in its negative phase, and vice versa [5,7,59]. In this study, we did not find a significant association with ENSO indices and summer water inflow records to the LCD, except with the mean July–October PDO (r = 0.30, p < 0.05) (Table 8).
In the irrigation area of the Comarca Lagunera, the presence of warm El Niño events during the cool season allows for an increase in irrigated area. In contrast, the extreme dry period of the 1950s reduced the agriculture area to less than 20,000 ha year−1 [3]. After the 1950s drought, there was a period when a greater water allocation was delivered to irrigate an area of near 100,000 ha, particularly in the years 1974, 1988–1989, and 1991–1992 (Figure 1).
The NAMS is the most important ocean-atmosphere phenomenon affecting summer precipitation along the WSM in the states of Durango, Chihuahua, and Sonora, Mexico, known as the Monsoon Core Region [4,26,32]. The water yield from watersheds on this region is incorporated into streams with intermittent or perennial flows, and stored in reservoirs for agriculture, power generation, or industrial use. Alternatively, some of the streams drain freely to the ocean, creating riparian corridors of high biodiversity that demand high water volume for their ecological stability [16].
The significant relationship between the accumulated precipitation from July 5 to September 15 in the Monsoon Core Region (r = 0.48, p < 0.0005, n = 48) (Table 8) and reconstructed water inflow to the LCD, support the high association between the runoff volumes and accumulated precipitation. This relationship is confirmed by the significant association found between reconstructed June–August PDSI values and water inflow records (r = 0.60, p < 0.01, n = 79) (Figure 7), indicating that the hydrological balance in this period constitutes a significant parameter of the annual volume of streamflow that could be recorded in the LCD as inflow.
Although the inflow reconstruction was statistically well supported, some particular years showed significant differences between gauged and reconstructed water inflow; thus, 1974 had a recorded inflow of 3259 × 106 m3, whereas the reconstructed values was 1781 × 106 m3, a difference of 1478 × 106 m3 (83%). In contrast, other years showed greater reconstructed values than the recorded inflow, such as 1966 with a reconstructed inflow of 2475 × 106 m3 and a recorded value of 1277 × 106 m3, a difference of 1197 × 106 m3 (93.8%) (Figure 5).
The lack of agreement between recorded and reconstructed inflow for specific years may be explained by heavy rains exceeding the soil infiltration capacity, when rainfall occurs in a period of tree inactivity, or at the end of the growing season [46]. In the second case, when reconstructed inflow is greater than the recorded, previous soil moisture conditions or rainfall occurring right in the growing season, even if is not of great magnitude, it may be sufficient to influence a greater radial growth, conditions that may distort the relationship between both variables [46].
According to the Power Spectrum Analysis, significant peaks on the water inflow reconstruction were detected at cycles of 21 and 65 years, similar results to the ones detected in a streamflow reconstruction for the Nazas watershed, and which correspond to the 50-to-100-year wavelengths reported for north-central Mexico by Stahle et al. [60]. Dominant wavelengths of 20 to 30 years may be related to the PDO influence [48], given that a low but significant correlation was found between reconstructed water inflow records and PDO indices for the NZW.
Wavelet Power Spectral Analysis showed significant periods less than 10 years along the reconstructed period, falling in the ENSO domain (Figure 9). The ENSO influence on streamflow reconstructions has often been reported for other streamflow reconstructions worldwide. Thus, significant peaks of 3, 6, 22, 47, 115, 200, 260, and 300 years were found for a streamflow reconstruction of the Yellow River in China [61]. Frequencies of 22, 110, and 115 years were reported for streamflow reconstruction in North America [62].
The influence of ENSO (SOI, TRI, MEI) on the reconstructed annual inflow volume had correlation values in the range of 0.24 to 0.28 (p < 0.01), particularly in the cool season; this significant but low correlation is due to the fact that most of the annual inflow in this and neighbor watersheds is yielded in the summer season as influenced by NAMS characterized by low interannual variability, and, therefore, it is difficult to model their behavior [27]. In comparison, rainfall and streamflow variability is greater in the winter-spring season as modulated by ENSO conditions that has some potential to be forecasted [63]. In this study, long-term streamflow reconstructions are relevant for a better understanding of the impact of atmospheric circulation modes, to analyze their influence on the interannual and multiannual climate variability, to determine potential trends of water availability, and to use that information for establishing sustainable management strategies of water resources.
Inflow volumes <2355.2 × 106 m3 implying outflow volumes <1100 × 106 m3 have dominated the allocated water outflow for irrigation in the DDR 01. This volume, however, is more persistent when considering the water inflow reconstruction, which provides a more extended record. These findings suggest the need for developing a management plan strategy for drought periods as long as 12 consecutive years with water yields <595 × 106 m3. These extended dry periods have already been documented in this water inflow reconstruction and may re-occur in the next few decades. Based on this information, it is important to analyze in detail the influence of the NAMS, the main circulatory phenomenon affecting the summer water yield in watersheds located in the WSM.
Climate change models from the IPCC suggest an increase in aridity for northern Mexico in the next few decades [6], conditions that may already be in the process of reducing the water availability for irrigation and other uses [64] The models suggest drier than normal conditions in dry years and increases in overland flow in wetter years, which may be enhanced by deforestation and other land-use changes taking place on this region [1,12]. Conservation strategies focused on the upper forested subbasins where water is yield in the NZW and based on the payment of environmental services to the owners of those areas should be important to implement to ameliorate the potential impacts forecasted by climate change models.

5. Conclusions

Developing an assemblage of tree-ring chronologies outside the limits of a particular watershed is important to capture the regional climate signal and to establish a significant relationship with gauge streamflow records for hydroclimatic reconstructions. In this study, selected ring-width series from trees located at the upper-forested section of the NZW and neighbor watersheds had a common climatic signal and were used to analyze the historical water inflow to the LCD.
The water inflow reconstruction represents a significant contribution to understand the interannual and long-term variability of the runoff reaching the LCD, the main reservoir that captures the streamflow yield at the upper NZW used for irrigation in the DDR017.
Ocean-atmospheric phenomena had a significant influence on the amount of rainfall and streamflow yield at the upper-forested NZW. The warm phase of ENSO increased precipitation and runoff in the cool season, particularly for some of the wettest years detected in the recorded and reconstructed data. Winter-spring precipitation is around 10% of the annual rainfall, but significantly correlates with the annual radial increase in conifer species in this watershed.
The influence of ENSO in summer precipitation was non-significant, but in extreme ENSO events, its influence was extended to the summer season, producing extreme droughts or pluvials. In the WSM, where the main moisture source comes from NAMS, summer precipitation represents over 90% of the annual rainfall and 92% of the runoff in watersheds. Other ocean-atmospheric phenomena, e.g., AMO and the PDO, may have a synergic effect on summer rainfall when they are in phase with ENSO.
Historical water allocation based on gauge records had a dominant range of <1100 × 106 m3 in 74% of the years examined (water inflow < 2355 × 106 m3), and this percentage increased to 78% of the years examined when considering the reconstructed water inflow for the last 251 years. Water administrators of the DDR 017 should take proper measures to anticipate and ameliorate droughts lasting over 10 consecutive years to plan for suitable water management strategies that could prevent the social and economic calamities that these events provoke.

Author Contributions

Conceptualization, J.V.-D. and J.E.-Á.; methodology, J.V.-D., A.R.M.-S. and J.E.-Á.; formal analysis, J.V.-D., A.C.-D., D.M.M., A.R.M.-S. and L.U.C.-E.; writing—original draft preparation, J.V.-D., A.R.M.-S., J.E.-Á. and A.C.-D.; writing—review and editing, J.V.-D., A.R.M.-S., J.C.-P., J.E.-Á. and L.U.C.-E.; funding acquisition, J.V.-D. All authors have read and agreed to the published version of the manuscript.

Funding

This study was funded by the Mexican Agency of Science and Technology; project SEP-CONACYT CB 2016-1, No. 283134.

Institutional Review Board Statement

Not applicable.

Informed Consent Statement

Not applicable.

Data Availability Statement

Not applicable.

Conflicts of Interest

The authors declare no conflict of interest.

References

  1. Descroix, L.; Nouvelot, J.F.; Vauclin, M. Evaluation of an antecedent precipitation index to model runoff yield in the Western Sierra Madre (North-west Mexico). J. Hydrol. 2002, 263, 114–130. [Google Scholar] [CrossRef]
  2. Sandoval, S.; Escobar-Flores, J.G.; Sánchez-Ortiz, E. Inventario de cuerpos de agua de la Sierra Madre Occidental (México) usando SIG y percepción remota. Investig. Geográficas 2020, 102, e59975. [Google Scholar] [CrossRef]
  3. CONAGUA. Estadísticas de los Distritos de Riego, año Agrícola 2013–2014; Comisión Nacional del Agua: Semarnat, México, 2015. Available online: http://www.conagua.gob.mx/conagua07/publicaciones/publicaciones/sgih-6-15.pdf (accessed on 15 April 2021).
  4. Gochis, D.J.; Brito-Castillo, L.; Shuttleworth, W.J. Hydroclimatology of the North America Monsoon region in northwest Mexico. J. Hydrol 2006, 316, 53–70. [Google Scholar] [CrossRef]
  5. Pavia, E.G.; Graef, F.; Reyes, J. PDO-ENSO effects in the climate of Mexico. J. Clim. 2006, 19, 6433–6438. [Google Scholar] [CrossRef]
  6. Seager, R.; Ting, M.; Davis, M.; Cane, M.; Nike, N.; Nakumara, J.; Lie, C.; Cook, E.; Stahle, D.W. Mexican drought: An observational modeling and tree ring study of variability and climate change. Atmosfera 2009, 22, 1–31. [Google Scholar]
  7. Mendez, M.; Magaña, V. Regional aspects of prolonged meteorological droughts over Mexico and Central America. Am. Meteorol. Soc. 2010, 23, 1175–1188. [Google Scholar] [CrossRef] [Green Version]
  8. Feng, S.; Hu, Q.; Oglesby, P.J. Influence of Atlantic sea Surface temperature on persistent drought in the North America. Clim. Dyn. 2011, 37, 569–586. [Google Scholar] [CrossRef] [Green Version]
  9. Meko, D.M.; Touchan, R.; Villanueva, D.J.; Griffin, D.; Woodhouse, C.A.; Castro, C.L.; Leavitt, S.W. Sierra San Pedro Martir, Baja California cool-season precipitation reconstructed from earlywood width of Abies concolor tree rings. J. Geophys. Res. Biogeosci. 2013, 118, 1660–1673. [Google Scholar] [CrossRef]
  10. Stahle, D.W.; Cook, E.R.; Burnette, D.J.; Villanueva, J.; Cerano, J.; Burns, J.N.; Griffin, D.; Cook, B.J.; Acuña, R.; Torbenson, M.C.A.; et al. The Mexican drought atlas: Tree-ring reconstructions of the soil moisture balance during the late pre-Hispanic, colonial, and modern eras. Quat. Sci. Rev. 2016, 149, 34–60. [Google Scholar] [CrossRef] [Green Version]
  11. Stahle, D.W.; Cook, E.R.; Burnette, D.J.; Torbenson, M.C.A.; Howard, I.M.; Griffin, D.; Villanueva Diaz, J.; Cook, B.I.; Williams, P.A.; Watson, E.; et al. Dynamics, variability and change in seasonal precipitation reconstruction for North America. J. Clim. 2020, 33, 3173–3195. [Google Scholar] [CrossRef]
  12. González-Barrios, J.L.; Descroix, L.; Viramontes, D.; Polenard, J.; Plenecassagne, A.; Macías, L.; Boyer, C.; Bollery, A.; Jasso-Ibarra, R. Condiciones que favorecen la erosion y el escurrimiento en manto. In La Sierra Madre Occidental; una fuente de agua amenazada; Descorix, L., González-Barrios, J.L., Estrada-Ávalos, J., Eds.; INIFAP-IRD: Gómez Palacio, Mexico, 2004; pp. 161–178. [Google Scholar]
  13. Woodhouse, C.A.; Stahle, D.W.; Villanueva Díaz, J. Rio Grande and Rio Conchos water supply variability over past 500 years. Clim. Res. 2012, 51, 125–136. [Google Scholar] [CrossRef]
  14. Estrada-Ávalos, J.; Villanueva-Diaz, J.; Trucios-Casiano, R. La cuenca del río Nazas en el norte de México: Retos y perspectivas de sus recursos naturales. In Servicios ecosistémicos hídricos: Estudios de caso en America Latina y el Caribe; Lara, A., Laterra, P., Manson, R., Barrantes, G., Eds.; Red Pro Agua CYTED: Valdivia, Chile, 2013; pp. 213–236. [Google Scholar]
  15. CONAGUA. Agua saludable para la laguna: Captación, potabilización, conducción y almacenamiento de agua potable; Comisión Nacional del Agua: Ciudad de Mexico, Mexico, 2021.
  16. De la lanza, G.; Carbajal, P.J.L.; Salinas, R.S.A.; Barrios, O.J.E. Medición del caudal ecológico del río Acaponeta, Nayarit, comparando distintos intervalos de tiempo. Investig. Geográficas 2012, 78, 62–74. [Google Scholar] [CrossRef]
  17. Villanueva, D.J.; Luckman, B.H.; Stahle, D.W.; Therrell, M.D.; Cleaveland, M.K.; Cerano-Paredes, J.; Gutierrez-Garcia, G.; Estrada-Avalos, J.; Jasso-Ibarra, R. Hydroclimatic variability of the upper Nazas basin: Water management implications for the irrigated area of the Comarca Lagunera. Dendrochronologia 2005, 22, 215–223. [Google Scholar] [CrossRef]
  18. Cleaveland, M.K.; Stahle, D.W.; Therrell, M.D.; Villanueva-Diaz, J.; Burns, B.T. Tree-ring reconstructed precipitation and tropical teleconnections in Durango, Mexico. Clim. Change 2003, 59, 369–388. [Google Scholar] [CrossRef]
  19. Cerano-Paredes, J.; Villanueva-Diaz, J.; Valdéz-Cepeda, R.D.; Arreola-Ávila, J.G.; Constante-García, V. El Niño Oscilación del Sur y sus efectos en la precipitación en la parte alta de la cuenca del río Nazas. Rev. Chapingo Ser. Cienc. For. Del Ambiente 2011, 17, 207–215. [Google Scholar] [CrossRef]
  20. Escobar-Pedraza, J.J.; González-Barrios, J.L.; Sánchez-Cohen, I.; Muño-Villallalobos, A.A.; Villa-Castorena, M. Análisis de la lluvia y su relación con cambio climático: Estudio de caso en estación hidrométrica sardinas (San Bernardo, Durango). Rev. Chapingo Ser. Zonas Áridas 2012, 11, 75–84. [Google Scholar]
  21. Villanueva, J.; Gómez, A.; Cerano, J.; Rosales, S.; Estrada, J.; Castruita, L.U.; Martínez, A.R. La variabilidad del caudal del río Acaponeta inferida mediante series de anillos de crecimiento en coníferas. Tecnol. Cienc. Del Agua 2017, 8, 55–74. [Google Scholar] [CrossRef]
  22. Torbenson, M.C.A.; Stahle, D.W.; Howard, I.M.; Burnette, D.I.; Griffin, D.; Villanueva-Diaz, J.; Cook, B.I. Drought relief reversal over North America from 1500 to 2016. Earth Interact. 2021, 25, 94–107. [Google Scholar] [CrossRef]
  23. Magaña-Rueda, V.; Pérez, J.L.; Vázquez, J.L.; Carrizosa, E.; Pérez, J. El Niño y el clima, en Magaña Rueda, V. (Ed.), Los impactos del niño en México, Secretaria de Educación Pública; Consejo Nacional de Ciencia y Tecnología: Mexico City, Mexico, 1999.
  24. Douglas, M.W.; Maddox, R.A.; Howard, K.; Reyes, S. The Mexican monsoon. Am. Metorolog. Soc. 1993, 6, 1665–1677. [Google Scholar] [CrossRef]
  25. Adams, D.K.; Comrie, A.C. The North American Monsoon. Bull. Am. Meteorol. Soc. 1997, 78, 2197–2231. [Google Scholar] [CrossRef]
  26. Higgins, R.W.; Shi, W. Intercomparison of the principal modes of interannual and interseassonal variability of the North American Monsoon System. J. Climate 2001, 14, 403–417. [Google Scholar] [CrossRef]
  27. Nicholas, R.E.; Battisti, D.S. Drought recurrence and seasonal rainfall prediction in the Río Yaqui Basin, Mexico. J. Appl. Meteorol. Climatol. 2008, 47, 991–1005. [Google Scholar] [CrossRef]
  28. Garcia-Franco, J.I.; Gray, L.J.; Osprey, S. The American monsoon system in HadGEM3 and UKESM1. Weather. Clim. Dyanamics 2020, 1, 39–371. [Google Scholar] [CrossRef]
  29. Villanueva-Díaz, J.; Castruita-Esparza, L.U.; Martínez-Sifuentes, A.R.; Loera-Chaparro, R.; Estrada-Ávalos, J. Chihuahua southwestern hydroclimatic variability inferred with coniferous growth rings. Cienc. For. Del Ambiente Chapingo 2020, 26, 373–389. [Google Scholar] [CrossRef]
  30. Meko, D.M.; Baisan, C.H. Pilot study of latewood-width of conifers as indicator of variability of summer rainfall in the North American Monsoon región. Int. J. Climatol. 2001, 21, 797–7008. [Google Scholar] [CrossRef]
  31. Stahle, D.W.; Cleaveland, M.K.; Grissino-Mayer, H.D.; Griffin, R.D.; Fye, F.K.; Therrell, M.D.; Burnett, D.J.; Meko, D.M.; Villanueva-Diaz, J. Cool- and warm-season precipitation reconstruction over western New Mexico. J. Clim. 2009, 22, 3729–3750. [Google Scholar] [CrossRef]
  32. Griffin, D.; Meko, D.M.; Touchan, R.; Leavitt, S.W.; Woodhouse, C. Latewood chronology development for summer-moisture reconstructions in the US Southwest. Tree-Ring Res. 2011, 67, 87–101. [Google Scholar] [CrossRef] [Green Version]
  33. CONAGUA. Estadísticas del agua en México; Comisión Nacional del Agua: Ciudad de México, Mexico, 2018.
  34. Woodhouse, C.A.; Gray, S.T.; Meko, D.M. Updated streamflow reconstructions for the Upper Colorado River basin. Water Resour. Res. 2006, 42, W05415. [Google Scholar] [CrossRef]
  35. Martínez-Sifuentes, A.R.; Villanueva-Díaz, J.; Estrada-Ávalos, J.; Trucíos-Caciano, R.; Carlón-Allende, T.; Castruita-Esparza, L.U. Two Centuries of Drought History in the Center of Chihuahua, Mexico. Forests 2022, 13, 921. [Google Scholar] [CrossRef]
  36. Bunn, A.G. A dendrochronology program library in r (dplr). Dendrochronologia 2008, 26, 115–124. [Google Scholar] [CrossRef]
  37. Faraway, J.J. Extending the Linear Model with R: Generalized Linear, Mixed Effects and Nonparametric Regression Models; CRC Press Taylor & Francis Group: London, UK, 2016. [Google Scholar]
  38. Xia, Y.; Mitchell, K.; Ek, M.; Shefeld, J.; Cosgrove, B.; Wood, E.; Luo, L.; Alonge, C.; Wei, H.; Meng, J.; et al. Continental-scale water and energy flux analysis and validation for the North American Land Data Assimilation System project phase 2 (NLDAS-2): 1. intercomparison and application of model products. J. Geophys. Res. 2012, 117, D03110. [Google Scholar] [CrossRef]
  39. Stahle, D.W.; Dárrigo, R.D.; Krusic, P.J.; Cleaveland, M.K.; Cook, E.R.; Allan, R.J.; Cole, J.E.; Dunbar, R.B.; Therrell, M.D.; Guy, D.A.; et al. Experimental dendroclimatic reconstruction of the Southern Oscillation. Bull. Am. Meteor. Soc. 1998, 70, 2137–2152. [Google Scholar] [CrossRef]
  40. Wolter, K.; Timlin, M.S. Monitoring ENSO in COADS with a seasonally adjusted principal component index. In Proceedings of the 17th Climate Diagnostics Workshop, Norman Oklahoma, NOAA/NMC/CAC, NSSL, Oklahoma Climate Survey CIMMS—School of Meteorology of the University of Oklahoma, Norman, OK, USA, 19–23 October 1992. [Google Scholar]
  41. Wright, P.B. Persistence of rainfall anomalies in the Central Pacific. Nature 1979, 277, 371–374. [Google Scholar] [CrossRef]
  42. Mantua, N.J.; Hare, S.R.; Zhang, Y.; Wallace, J.M.; Francis, R.C. A Pacific interdecadal climate oscillation with impacts on salmon production. Bull. Am. Meteorol. Soc. 1977, 78, 1069–1079. [Google Scholar] [CrossRef]
  43. Tarik, C.G.; Aslak, G.; Viliam, S. R Package “Biwavelet”: Conduct Univariate and Bivariate Wavelet Analyses. 2017. Available online: https://github.com/tgouhier/biwavelet (accessed on 16 May 2022).
  44. Speer, J. Fundamentals of Tree-Ring Research; University of Arizona Press: Tucson, AZ, USA, 2010. [Google Scholar]
  45. Draper, N.R.; Smith, H. Applied Regression Analysis, 2nd ed.; Wiley: New York, NY, USA, 1981. [Google Scholar]
  46. Fritts, H. Tree Rings and Climate; Academic Press: London, UK; New York, NY, USA, 1976. [Google Scholar]
  47. Fritts, H.C.; Joel, G.; Gordon, G.A.; Schweingruber, F. Methods of Calibration, Verification, and Reconstruction; Springer: Dordrecht, The Netherlands, 1990. [Google Scholar]
  48. van Oldenborgh, G.J.; te Raa, L.A.; Dijkstra, H.A.; Philip, S.Y. Frequency- or amplitude-dependent effects of the Atlantic meridional overturning on the tropical Pacific Ocean. Ocean. Sci. 2009, 5, 293–301. [Google Scholar] [CrossRef] [Green Version]
  49. Guztler, D.S. An index of interanual precipitation variability in the core of the North American Monsoon Region. J. Clim. 2004, 17, 4473–4480. [Google Scholar]
  50. Meko, D.M.; Stockton, C.W.; Bogges, W.R. The tree-ring record of severe sustained drought. Water Resour. Bull. 1995, 31, 789–801. [Google Scholar] [CrossRef]
  51. Woodhouse, C.; Lukas, J.L. Multi-century tree-ring reconstructions of Colorado streamflow for water resource planning. Clim. Change 2006, 78, 293–315. [Google Scholar] [CrossRef]
  52. Case, R.A.; McDonald, G.M. Tree ring reconstruction of streamflow for three Canadian prairie rivers. J. Am. Water Resour. Asoc. 2003, 39, 703–716. [Google Scholar] [CrossRef]
  53. Ferrero, M.E.; Villalba, R.; de Membiela, M.; Hidalgo, L.F.; Luckman, B.H. Tree-ring based reconstruction of rio Bermejo streamflow in sutropical South America. J. Hydrol. 2015, 525, 572–584. [Google Scholar] [CrossRef]
  54. Martínez-Sifuentes, A.R.; Villanueva-Díaz, J.; Carlón-Allende, T.; Estrada-Avalos, J. 243 years of reconstructed streamflow volume and identification of extreme hydroclimatic events in the Conchos River Basin, Chihuahua, Mexico. Trees 2020, 34, 1347–1361. [Google Scholar] [CrossRef]
  55. D’Arrigo, R.; Nerilie, A.; Ummenhofer, C.; Palmer, J.; Mudelsee, M. Reconstructed streamflow for Citarum River, Java, Indonesia: Linkages to tropical climate dynamics. Clim. Dyn. 2011, 36, 451–462. [Google Scholar] [CrossRef]
  56. Genç, S.; Güner, H.T. Precipitation and Streamflow Reconstructions from Tree Rings for the Lower Kızılırmak River Basin, Turkey. Forests 2022, 13, 501. [Google Scholar] [CrossRef]
  57. Castruita-Esparza, L.U.; Correa-Díaz, A.; Gómez-Guerrero, A.; Villanueva-Díaz, J.; Ramírez-Guzmán, M.E.; Velázquez-Martínez, A.; Ángeles-Pérez, G. Basal area increment series of dominant Pseudotsuga menziesii (Mirb.) Franco show periodicity according to global climate patterns. Rev. Chapingo Ser. Cienc. For. Del Ambiente 2016, 22, 379–397. [Google Scholar] [CrossRef] [Green Version]
  58. Cerano-Paredes, J.; Villanueva-Díaz, J.; Valdéz-Cepeda, R.D.; Arreola-Ávila, J.G.; Constante-García, V. Effect of the El Niño Southern Oscillation on Precipitation in the Upper Nazas River Watershed; Revista Chapingo, Serie Ciencias Forestales y del Ambiente 2011; Special Publication: Texcoco, Mexico, 2011; Volume XVII, pp. 207–215. [Google Scholar]
  59. Englehart, P.J.; Douglas, A.V. Mexico’s summer rainfall patterns: An analysis of regional modes and changes in their teleconnectivity. Atmosfera 2002, 15, 147–1614. [Google Scholar]
  60. Stahle, D.W.; Villanueva-Diaz, J.; Burnette, D.J.; Cerano-Paredes, J.; Heim, R.R., Jr.; Fye, F.K.; Acuna-Soto, R.; Therrell, M.D.; Cleaveland, M.K.; Stahle, D.K. Major Mesoamerican droughts of the past millennium. Geophys. Res. Lett. 2011, 38, L05703. [Google Scholar] [CrossRef]
  61. Liu, Y.; Song, H.; An, Z.; Sun, C.; Trouet, V.; Cai, O.; Liu, R.; Leavitt, S.; Song, Y.; Li, Q.; et al. Recent anthropogenic curtailing of Yellow River runoff and sediment load is unprecedented over the past 500 y. Proc. Natl. Acad. Sci. USA 2020, 117, 18251–18257. [Google Scholar] [CrossRef]
  62. Hertweijer, C.; Seager, R.; Cook, E.R.; Emile-Geay, J. North American Droughts of the Last Millennium from a Gridded Network of Tree-Ring Data. J. Clim. 2007, 20, 1353–1376. [Google Scholar] [CrossRef] [Green Version]
  63. Ren, H.; Scaife, A.; Dunstone, N.; Tian, B.; Liu, Y.; Ineson, S.; Lee, J.; Smith, D.; Liu, C.; Thompson, V.; et al. Seasonal predictability of winter ENSO types in operational dynamical model predictions. Clim. Dyn. 2019, 52, 3869–3890. [Google Scholar] [CrossRef]
  64. World Bank Group. Climate Change Knowledge Portal for Development Practitioners and Policy Makers. 2021. Available online: https://climateknowledgeportal.worldbank.org/country/mexico/climate-data-projections (accessed on 7 July 2022).
Figure 1. Water inflow (bars) and outflow (broken line) records, and irrigated area (continuous solid line) for the Lazaro Cardenas dam that stores the water yield at the Nazas Watershed headwater. The dashed and dotted horizontal line refers to the long-term average of water inflow for the period 1947–2006.
Forests 13 02057 g001
Figure 2. Tree-ring chronology network developed in the Nazas and neighbor watersheds with drainage toward the western and eastern slopes of the Western Sierra Madre. The upper forested subbasins of the Nazas watershed is in blue, the middle part is in light green and the lower portion of the watershed where irrigation takes place is in green.
Forests 13 02057 g002
Figure 3. Correlation matrix of ring-width chronologies developed in the upper-forested subbasins of the Nazas and neighbor watersheds. All correlation values were significant (p < 0.01) (left side). A Principal Component Analysis of the ring-width chronologies showed that most of the chronologies were loaded in the PC1 explaining 67% of the common variance (right side).
Forests 13 02057 g003
Figure 4. Plot of selected ring-width chronologies explaining most of the variance on the PC1 (CBA, CHI, PIT, COC, TAR) and PC2 (ARN).
Forests 13 02057 g004
Figure 5. Comparison between the recorded annual water inflow to the LCD and reconstructed water inflow.
Forests 13 02057 g005
Figure 6. Reconstructed water inflow to the Lazaro Cardenas dam, 1753–2003 period, and recorded outflow (1947–2006).
Forests 13 02057 g006
Figure 7. Relationship between the reconstructed water inflow to the LCD and reconstructed June–August PDSI values for the Nazas watershed [14].
Forests 13 02057 g007
Figure 8. A Power spectral analysis showing significant frequencies (p < 0.01) present on the water inflow reconstruction at wavelengths of 22.3 (p < 0.05) and 64.98 years (p < 0.01).
Forests 13 02057 g008
Figure 9. Wavelet Power Spectrum Analysis of the water inflow. Areas surrounded by thick black contours indicate the 95% significance level using the red noise model, and the cone of influence is in reddish (smooth curve). Significant wavelengths <10 and around 21 and 65 years were present along the inflow reconstruction period.
Forests 13 02057 g009
Table 1. Dendrochronological parameters of tree-ring series located on the upper forested Nazas subbasins and neighbor watersheds.
Site Chronology1 SPTime PeriodNo. Trees2 SI3 AMS4 Rbar 5 CE6 EPS7 SNR
Arnulfa (ARN)Pc1753–2011340.620.200.491.200.9518.49
Cerro Barajas (CBA)Pm1510–2009470.700.300.523.350.9416.32
Chiqueros (CHI)Pm1418–2005480.700.240.471.320.9517.06
Pitoreal (PIT)Pm1693–2003440.760.320.581.610.9730.05
Cienega de la Vaca (CVA)Pm1763–2003230.710.360.561.420.9313.98
San Andres (SAN)Pm1709–2004430.750.410.581.520.9622.09
San Diego de Tenzaenz (SDT)Pm1777–2004430.640.240.451.540.9416.94
Cocono (COC)Pm1460–2003690.700.280.511.440.9624.20
Tarahumar (TAR)Pm1724–2003440.700.280.511.790.9519.89
1 Species: Pc = Picea chihuahuana, Pm = Pseudtosuga menziesii; 2 Series intercorrelation (SI) a measure of the strength of the signal common to all sampled trees at the site; 3 Average mean sensitivity (AMS) a measure of the relative change in ring-width from 1 year to the next in a given series; 4 Rbar examines the signal strength throughout the chronology by overlapping 50-year subperiods in a 100-year window; 5 Coefficient of efficiency (CE) a measure of the model efficiency, a greater value means a better performance; 6 Expressed Population Signal (EPS) quantifies how well a chronology based on a finite number of trees represents a hypothetical true chronology; an EPS value greater than 0.85 is usually acceptable to determine the reliable part of the chronology; 7 Signal-to-noise ratio (SNR) a measure of the common signal intensity; a positive SNR value indicates the potential of a tree-ring series to develop dendroclimatic reconstructions.
Table 2. Pearson correlations from the comparison between the dendrochronological series located on the continental divide of the NZW and inflow recorded at the LCD.
Inflow
(1 × 10⁶ m3)
PeriodRing-Width Chronologies, Standard Version
PC1PC2ARNCBACHICVAPITSANSDTCOCTAR
LCD1947–20030.75 **−0.44 **0.82 **0.52 **0.41 **0.46 **0.240.150.220.29 *0.31 *
* p < 0.05, ** p <0.01, LCD: Lazaro Cardenas Dam; PC1: Principal Component 1, PC2: Principal Component 2.
Table 3. Regression models to determine the best model for water inflow reconstruction purposes.
ModelR2R2Adj 1AIClogLikF-StatisticResidual Standard Error
PC model (PC1 + PC2)0.680.66889.1−440.255.97561.3
Pooled model (all 9 sites)0.720.68895.3−435.215.91546.1
Stepwise model0.730.70883.6−436.244.68528.6
1 R2 adjusted according to degrees of freedom [45].
Table 4. Calibration periods and regression statistics comparing the stepwise model (ARN + CBA + COC) and the inflow water volumes to the LCD.
PeriodR2Adj 1Coefficient (mm)Standard Error (mm)Regression (Prob.)
ARNCBACOCARNCBACOC
1947–19800.612807.4 **1511.0 *−1758.9 *704.6760.6663.30.000 **
1981–20030.814771.8 **716.6 *−1599.7 **537.8509.7553.50.000 **
1947–20030.703431.1 **466.6−1344.2399.0470.9466.60.000 **
* Values are significant (p < 0.05). ** Significant, p < 0.01; 1 R2 adjusted according to degrees of freedom [45].
Table 5. Verification statistics for recorded water inflow gauge records to the LCD.
Period1 r2 RE3 ST4 RMSE
1981–20030.91 *0.78 *24 *428.29 *
1947–19800.80 *0.63 *34 *564.12
1 r = Pearson correlation coefficient (a measure of the relationship between two random quantitative variables and is independent of the measured scale). 2 RE = Reduction of Error there is no specific procedure to perform a statistic test for this parameter, but any positive result is an indication that the reconstruction contributes to unique paleoclimatic information [46]. 3 ST = Sign test relates the number of agreements and disagreements between the observed and reconstructed values and applies a statistic for the association known as t-test [47]. 4 Root mean squared error * Values are significant (p < 0.05).
Table 6. Descriptive statistics for 50-year subperiods of water inflow reconstruction to the Lazaro Cardenas Dam.
SubperiodMean
(1 × 10⁶ m3)
Standard
Error
Median
(1 × 10⁶ m3)
Standard Deviation
(1 × 10⁶ m3)
Minimum Volume
(1 × 10⁶ m3)
Maximum Volume
(1 × 10⁶ m3)
1753–18021818.292.51812.3653.8227.03029.5
1803–18521829.086.61847.6612.0139.72817.6
1853–19021744.462.01744.4438.7837.92624.5
1903–19522039.276.92047.6543.7592.23039.7
1953–20021739.5119.21764.6843.188.13260.3
Table 7. Annual water inflow to plan for irrigated area in the Comarca Lagunera region based on gauged and estimated records at the LCD.
PeriodWater Inflow (<1650.5 × 106 m3)>1650.5 × 106 m3 but <2355.2 × 106 m3>2355.2 × 106 m3
Number of Years%Number of Years%Number of Years%
1947–2006 (recorded)284914251526
1753–2003 (reconstructed)9136105425522
Table 8. Correlation values between different indices of ocean-atmosphere phenomena, drought indices, and reconstructed water inflow to the LCD.
IndexSeasonal PeriodPeriod (Years)Pearson Correlation Coefficient
(p-Value)
1 SOI Rec.Dec–Feb1753–1977 (225)−0.24 (0.0003)
2 MEIJan–Dec1871–2003 (133)0.25 (0.0004)
3 TRIOct–Mar1894–1995 (102)0.28 (0.0039)
4 PDOJul–Oct1948–2003 (56)0.30 (0.0250)
5 AMOOct–Mar1857–2003 (155)−0.43 (0.0000)
6 NAMS5 Jul–15 Sep1951–1998 (48)0.48 (0.0005)
7 PDSIJun–Aug1901–2003 (103)0.54 (0.0000)
1 SOI Reconstructed December–February [39]. 2 MEI multivariate ENSO index [40]. 3 TRI October–March [41]. 4 PDO July–October [42]. 5 AMO October–March [48]. 6 Daily precipitation for 5 July–15 September estimated by the integration of precipitation records of climatic stations located in the NAMS core region [49]. 7 PDSI instrumental [10].
Publisher’s Note: MDPI stays neutral with regard to jurisdictional claims in published maps and institutional affiliations.

