Article

Biochar-Based Fertilizer Decreased Soil N2O Emission and Increased Soil CH4 Uptake in a Subtropical Typical Bamboo Plantation

1
State Key Laboratory of Subtropical Silviculture, Zhejiang A&F University, Hangzhou 311300, China
2
Key Laboratory of Carbon Cycling in Forest Ecosystems and Carbon Sequestration of Zhejiang Province, Zhejiang A&F University, Hangzhou 311300, China
3
School of Environmental and Resources Science, Zhejiang A&F University, Hangzhou 311300, China
*
Author to whom correspondence should be addressed.
Forests 2022, 13(12), 2181; https://doi.org/10.3390/f13122181
Submission received: 20 September 2022 / Revised: 16 December 2022 / Accepted: 16 December 2022 / Published: 19 December 2022

Abstract

:
Soil is a crucial contributor to greenhouse gas (GHG) emissions from terrestrial ecosystems to the atmosphere. The reduction of GHG emissions in plantation management is crucial to combating and mitigating global climate change. A 12-month field trial was conducted to explore the effects of different fertilization treatments (control, without fertilizer (CK); biochar-based fertilizer treatment (BFT); chemical fertilizer treatment (CFT); and mixture of 50% BFT and 50% CFT (MFT)) on the soil GHG emissions of a typical bamboo (Pleioblastus amarus (Keng) Keng f.) plantation. The results demonstrated that compared with the CK, BFT reduced the annual cumulative soil N2O emission by 16.3% (p < 0.01), while CFT and MFT significantly increased it by 31.0% and 23.3% (p < 0.01), respectively. Meanwhile, BFT and MFT increased the annual cumulative soil CH4 uptake by 5.8% (p < 0.01) and 7.5% (p < 0.01), respectively, while there was no statistically significant difference between CFT and the control. In addition, BFT, CFT, and MFT significantly increased the annual cumulative soil CO2 emission by 9.4% (p < 0.05), 13.0% (p < 0.01), and 26.5% (p < 0.01). The global warming potential (GWP) of BFT did not change significantly, while CFT and MFT increased the GWP by 13.7% (p < 0.05) and 28.6% (p < 0.05), respectively, compared with the control. Structural equation modeling revealed different treatments affected soil N2O and CH4 emission by changing soil labile carbon and labile nitrogen pools. This study suggests utilizing BFT new ideas and strategies for mitigating GHG emissions from soils in subtropical Pleioblastus amarus plantations.

1. Introduction

Since the Industrial Revolution, the planet’s population has been expanding quickly. The development of the world’s major economies and the increased demands for human activities for natural resources have led to relatively high emissions of greenhouse gases (GHG), including methane (CH4), carbon dioxide (CO2), and nitrous oxide (N2O). The relationship between humans and nature has experienced great tension under extreme weather events with high intensity and frequency [1]. Forests play a vital and unique position in lowering the concentration of CO2 in the atmosphere and slowing down global warming. Forest ecosystems have a huge capacity to absorb and store CO2. The annual carbon sequestration of world forests accounts for about 2/3 of the total terrestrial carbon sequestration, which profoundly affects the source and sink dynamics of CO2 in the atmosphere [2,3,4]. Therefore, forest management technology can serve as one of the critical scientific approaches to mitigate global climate warming.
The bamboo forest serves an essential and constructive role in the world’s forest resources, known as the “second forest” [5]. Nowadays, when the global forest area continues to decline, the bamboo forest area keeps increasing by about 3% per year on average, which suggests the bamboo forest is a potential expanding carbon sink [6]. Pleioblastus amarus (Keng) Keng f. is a lignified tree of the Poaceae and Bamboo genus, which has a great utilization value and is a crucial species for garden landscaping in east Asia. Pleioblastus amarus has become an excellent multi-purpose, economical bamboo species in southern China due to its strong adaptability, cold resistance, and barren resistance [7]. Pleioblastus amarus not only grows fast and has high economic value, but studies have also illustrated the carbon sequestration capacity of the Pleioblastus amarus plantation ecosystem was stronger than that of the Moso bamboo [8].
Regarding the ecological function and carbon sink capacity of Pleioblastus amarus plantations, Shen et al. [8] illustrated the carbon density, spatial distribution pattern, and carbon storage of the Sichuan Pleioblastus amarus plantation ecosystem were estimated by the biomass method. The results showed the carbon storage of the aboveground part is 2.19 times that of the underground part. He et al. [9] found rational management can effectively improve the carbon sink function of the Pleioblastus amarus plantation. Shen [10] also found the Pleioblastus amarus forest plays a greater role in carbon sequestration in coping with climate change in Sichuan. In plantation operation activities, farmers manage to improve the yield of Pleioblastus amarus by intensive management measures, such as removing underlayers vegetation, tilling soil, and applying chemical fertilizer. However, the above measures, especially the input of traditional fertilizers, usually increase soil GHG emissions from plantations [11,12], reduce active organic carbon storage, and change the chemical composition of soil organic carbon [13]. A recent paper reported from 2007 to 2016, 54% of total soil N2O emission were caused by the application of nitrogen fertilizer [14]. Therefore, finding a management measure to reduce the soil GHG emissions and further improve the carbon sequestration of the Pleioblastus amarus plantation ecosystems is of great significance.
Because of its unique chemical structure, biochar has higher chemical stability and adsorption than other organic matters. Many have suggested biochar input into soil significantly affects soil physicochemical properties [15,16], increases the soil carbon pool [17,18], and reduces soil GHG emissions [19]. The study in a subtropical Chinese bamboo plantation for two consecutive years showed applying only a small amount of biochar can significantly reduce the total soil CO2 emission and positively promoted soil organic carbon sequestration [20]. Xu et al. [21] revealed the input of different gradients of biochar could significantly improve the carbon sequestration capacity in the Moso bamboo forest and reduce the soil N2O emission. Similarly, in a two-year field survey, Song et al. [22] demonstrated using biochar reduced soil N2O emission by decreasing soil total denitrification and nitrification rates and by reducing NH4+-N and NO3-N concentrations. However, some studies reported different views on the impact of biochar application on GHG in forest soil. Hawthorne et al. [23] found CO2 and N2O emissions would increase following application of biochar at relatively high rates in forest soils. Lin et al. [24] indicated there was no significant difference in N2O emission and CH4 uptake of soil by applying different kinds of biochar in a subtropical forest of China. The reasons for the above different results may be due to the different types and application rates of biochar. In conclusion, it is necessary to study the impact mechanism of biochar application on soil GHG emission. However, the relatively low mineral nutrient content of biochar is frequently inadequate as a single supplement to support plantations’ rapid growth [25,26].
Biochar-based fertilizer is a new type of material utilizing biomass charcoal as a carrier and mixed with a certain proportion of chemical fertilizers according to demand of soil for nutrient elements [27]. The ratio of each nutrient can be adjusted according to soil fertility levels in different regions. Recent studies revealed adding biochar as a base fertilizer improved soil fertility, increased the utilization ratio of fertilizers, reduced fertilizer loss [28,29], improved soil fertilizer retention capacity, and achieved a long-term balance of water and fertilizers [30]. At the same time, it achieved long-term, slow-release effects on water and fertilizer and improved soil ecological environment [31,32]. Compared with the traditional way biochar is applied to the soil in tons as a soil conditioner, the consumption of biochar-based fertilizer can save costs and practically mix chemical fertilizers and biochar dependent on the demand for the soil nutrient in the region. Studying the benefit of biochar-based fertilizers on soil GHG emissions has far-reaching significance for mitigating global climate warming, improving soil environment and fertility, and enhancing crop yields. However, in the past, most of the studies on the effectiveness of biochar on greenhouse gas emissions of soils were focused on farmlands and grasslands, while there were few reports on forest ecosystems [33]. Research on how biochar-based fertilizers can affect soil GHG emissions from Pleioblastus amarus ecosystems was rare.
The purpose of this study is to study the effects of applying biochar-based fertilizer and chemical fertilizer on soil GHG emission of the Pleioblastus amarus plantation compared to that without fertilizer. We will analyze the relationship between soil GHG and environmental factors, such as soil carbon pool, nitrogen pool, soil temperature, and soil moisture. The following two hypotheses will be tested. First, the addition of biochar-based fertilizers can reduce soil GHG emissions, whereas the application of chemical fertilizers can increase soil GHG emissions. Second, the decrease in soil GHG emissions following application of biochar-based fertilizers can result from the changes in soil labile carbon and labile nitrogen pools. This proposed study is anticipated to contribute to the possible management methods to mitigate the impact of soil GHG emissions in Pleioblastus amarus plantations.

2. Materials and Methods

2.1. Study Area

Our field experiment was conducted in Yuhang (30°11′12.29″ N, 119°51′06.58″ E), Zhejiang Province, China (Figure 1). With an annual average temperature of 15.3–16.2 °C, an annual sunlight duration of 1834 h, and an annual frost-free period of 230–260 days, the climate is classified as a subtropical monsoon climate. The study area’s terrain is made up of hills and low mountains, and the altitude of the experimental region is 144 m above sea level, and the slope is about 30°. The main soil type in the experimental area is classified as slightly acidic laterite in the Chinese soil classification system [34].
Through the field investigations, a typical Pleioblastus amarus plantation was chosen to launch this field test in March 2021. The planting density of Pleioblastus amarus is about 13,000 culms ha−1, and the average breast height diameter is 2.5 cm. Before applying the treatments to the experimental plots, samples (0–20 cm) of soil surface were collected to examine their physical and chemical characteristics. These results were: silt 31.50%, sand 46.70%, clay 19.60%, soil bulk density 1.14 g cm−3, available K 64.5 mg kg−1, pH value 4.77, available P 8.3 mg kg−1, total N 1.96 g kg−1, and the organic C 18.1 g kg−1.

2.2. Experimental Design

In April 2021, a Pleioblastus amarus pure plantation site with a similar growth history, site conditions, and slope was selected at the Yuhang Pleioblastus amarus demonstration base. Four treatments with four repetitions each were employed in a fully randomized block design. The size of each experimental plot is 10 m × 10 m. A 3-m wide buffer zone was set up for each plot to eliminate the interference of the underground root whip of Pleioblastus amarus on the adjacent plots.
Four treatments were set up in this experiment: (1) control (CK, without any fertilizer application); (2) biochar-based fertilizer treatment (BFT, the application rate of biochar-based fertilizer was 133.33 g m−2, the N, P2O5, and K2O contents in the biochar-based fertilizer were 150 g kg−1, 150 g kg−1, and 100 g kg−1, respectively); (3) chemical fertilizer treatment (CFT, 20 g N m−2, 20 g P2O5 m−2, and 13.3 g K2O m−2 were applied in CFT to achieve the BFT level of nutrients, and the fertilizers in the CFT were provided by conventional chemical fertilizers); and (4) 50% BFT and 50% CFT mixed (MFT, 50% of N, P and K came from BFT (66.5 g m−2), and 50% of nutrition came from CFT).
In April 2021, the experimental plots were treated with fertilizers, then tilled to 20 cm depth. After fertilization, a static PVC chamber was placed at the diagonal midpoint of each plot to collect soil GHG samples. The gas sampling was carried out on the first month’s first, seventh, and fourteenth days. In the following months, the gas sampling were to be conducted on sunny days, and the GHG samples were collected once a month. For the purpose of collecting soil samples from each plot, the three-point sampling approach was used, and the sampling soil layer was the surface soil (0–20 cm).

2.3. Production of Biochar-Based Fertilizer

The biochar-based fertilizer used in this experiment was produced and sponsored by Qinfeng Zhongcheng Biomass New Materials Nanjing Co., Ltd., Nanjing, China. The raw material of biochar-based fertilizer was wheat straw biochar, which was made by anoxic pyrolysis at 500 °C for 3 h. According to the formula, the biochar and chemical fertilizer were mixed and crushed, stirred evenly, and dried. Finally, the biochar-based fertilizer was made after cooling and screening treatment. The C contents in the biochar-based fertilizer were 200 g kg−1. The properties of biochar used to make biochar-based fertilizers are described in Table 1.

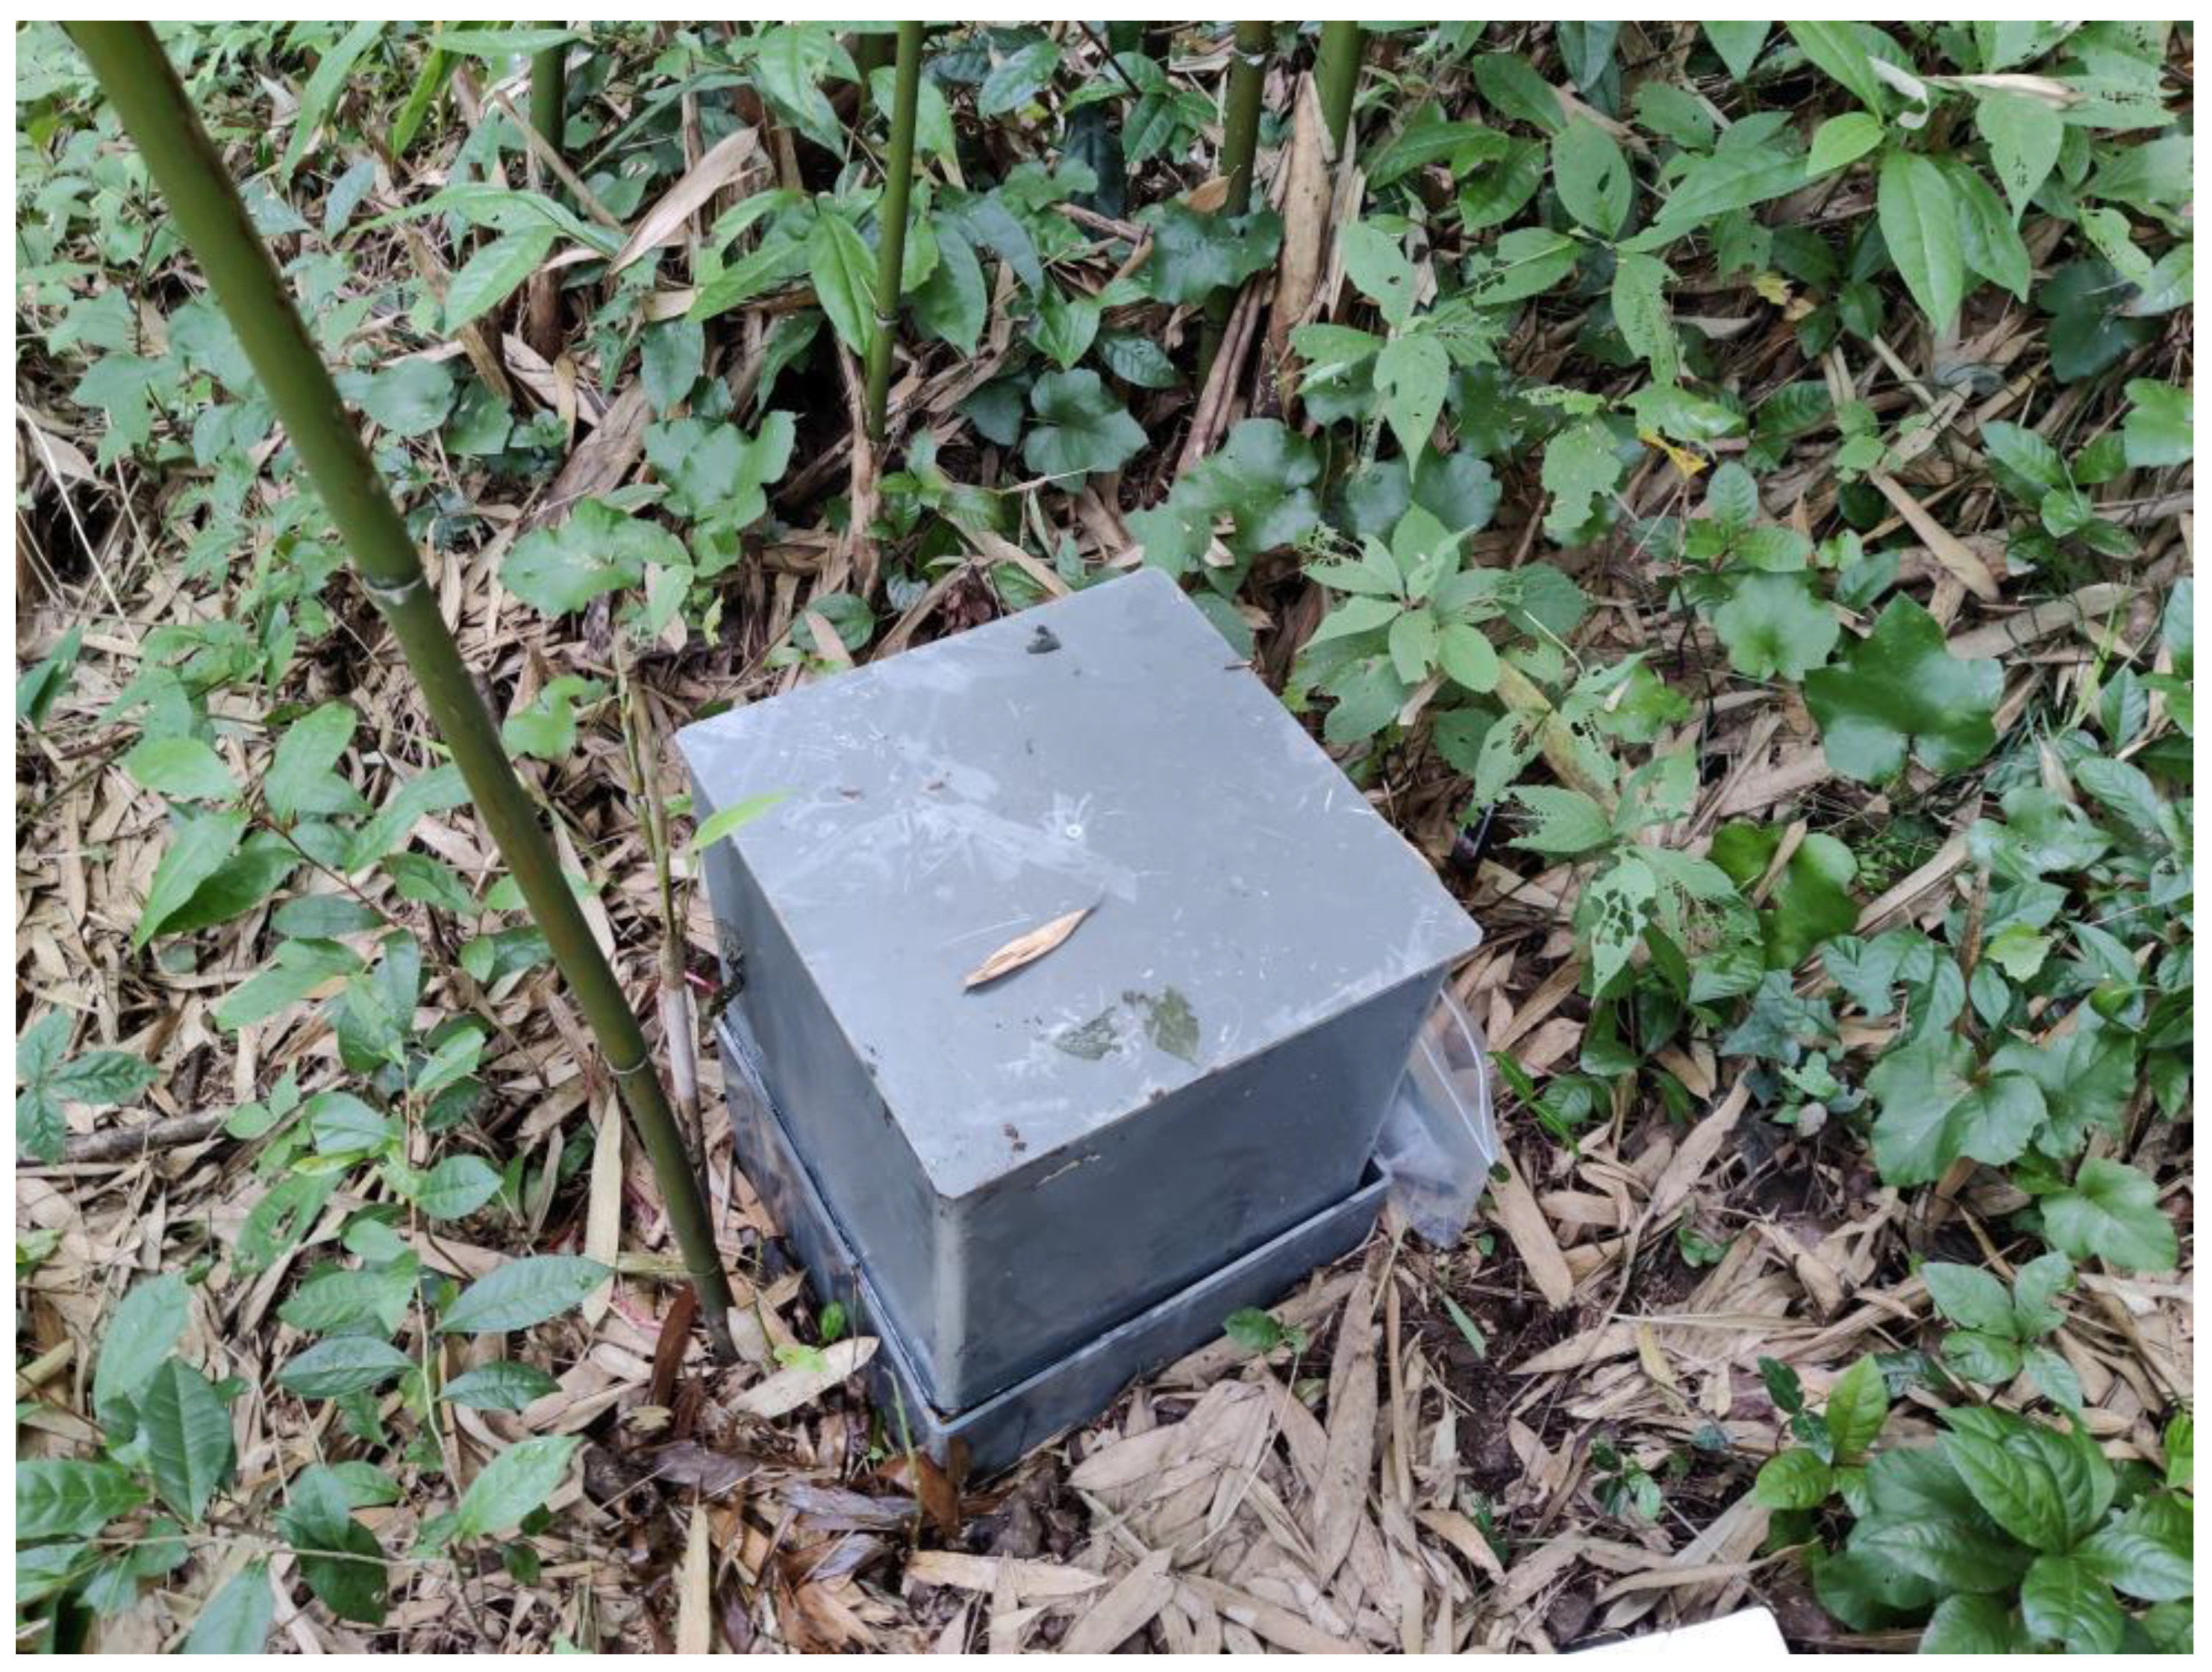
2.4. Measuring Soil GHG Emissions

The soil N2O, CH4, and CO2 fluxes from the plots for the experiment were evaluated by closed static chamber and gas chromatography analysis technology [20]. The static chamber for collecting GHG consists of a base box (length 0.3 m, width 0.3 m, and depth 0.1 m) and a cover box (length 0.3 m, width 0.3 m, and depth 0.3 m) with a U-shaped slot (width 5 cm, depth 5 cm). The immovable chambers were uniformly constructed of polyvinyl chloride (PVC) panels (Figure 2).
On days without rain, samples of soil GHG were taken between 9:00 and 11:00 in the morning. Before collecting gas, weeds inside the base box were clipped along the roots, and then the groove of the base box was stuffed with 2 cm high distilled water to form a seal between the base and the lid. A fan was placed to mix the air in the box evenly, and then, the gas samples were obtained using a 100 mL syringe with a tee tube attached. The samples were taken at 0, 10, 20, and 30 min after the static box lid was closed. Finally, the collected gas was injected into a 100 mL gas collection bag for storage, and soil temperature and soil moisture at 5 cm depth were measured simultaneously.
The gas samples were returned to the lab for measurement of GHG flux using a gas chromatograph (GC-2014, Shimadzu Corporation, Kyoto, Japan). The measurement time and sample collection time should not exceed two days. We measured the gas samples collected in the experiment according to the standard curve made by the concentration value of GHG under standard references (N2O: 5.0 × 10⁻⁶ mol/mol, CH4: 20.4 × 10⁻⁶ mol/mol, CO2: 302 × 10−6 mol/mol), which was provided by Shanghai Weichuang Standard Gas Analysis Technology Co., Ltd., Shanghai, China.
Formula (1) was applied to calculate soil CO2, N2O, and CH4 emissions.
F = ρ V A P P 0 T 0 T d C t d t
where F is the emission rate of soil GHG (mg N2O m−2 h−1, mg CH4 m−2 h−1, mg CO2 m−2 h−1), ρ is the density of GHG under ideal conditions (N2O: 1.964 × 10³ g m−3, CH4: 7.163 × 10² g m−3, CO2: 1.98 × 10³ g m−3 ), A denotes the area of the chamber’s bottom portion (m2), V denotes the chamber’s volume (m3), and (dCt)/dt is the slope of the concentration of the GHG in the sampling box per unit time (ppm h−1). P0 and T0 represent the standard circumstances’ absolute air pressure and temperature. Furthermore, P and T denote the chamber’s atmospheric air pressure and air temperature when sampling, respectively.
Formula (2) was applied to calculate the annual cumulative GHG flux.
M = F i ( t i + 1 t i ) × 24 × 10 5
where M denotes the annual cumulative emission of GHG (Mg N2O ha−1 yr−1, Mg CH4 ha−1 yr−1, Mg CO2 ha−1 yr−1), F denotes the flux of soil GHG (mg m−2 h−1), i and t denote the sampling number and sampling time, respectively.
To estimate the combined effect of fertilization treatments on soil GHG emissions, Formula (3) was used to determine the global warming potential (GWP):
GWP = M C O 2 + 298 M N 2 O 25 M C H 4
where GWP denotes the total global warming potential of GHG emission (CO2-eq Mg ha−1 yr−1), M N 2 O , M C H 4 , and M C O 2 are the annual cumulative N2O emission, CH4 uptake, and CO2 emission (Mg ha−1 yr−1), respectively. The radioactive forcing potentials for CH4 and N2O expressed as CO2 equivalent on a 100-year period are represented by coefficients 25 and 298, respectively [35].

2.5. Measuring the Physicochemical Properties of Soil

Soil physicochemical properties of the experimental plots were analyzed using standard methods [36]. The soil corer used a predetermined volume to determine the bulk density of soil. The soil pH value was analyzed by mixing the soil sample with water in a ratio of 1:2.5 using a pH meter (FE28, Mettler Toledo, Shanghai, China). The soil moisture content was determined by drying the fresh samples at 105 °C for 24 h. We used an elemental analyzer (Flash EA1112, Thermo Finnigan, Italy) to analyze soil organic C (SOC) concentrations. Soil total N was determined using an elemental analyzer (Flash EA1112, Thermo Finnigan, Italy). Soil available phosphorus concentration was measured by the approach offered by Bray and Kurtz [37]. Soil available potassium concentration was measured by a flame photometer (FP6410, Shanghai Co., Ltd., Shanghai, China) after soil was extracted with ammonium acetate solution.
When collecting GHG samples every month, soil samples from three places near the static chamber (0–20 cm depth) per treatment were randomly collected and mixed. The soil physicochemical properties were measured after sieving (<2 mm) in the laboratory. The sieved soil samples were divided into two parts: one part was stored in the refrigerator within the following three days for analyzing microbial biomass C (MBC), water-soluble organic C (WSOC), water-soluble organic N (WSON), microbial biomass N (MBN), NO3-N, and NH4+-N concentrations, and either part for measuring soil pH, available P and available K.
The methods outlined by Vance et al. [38] were used to examine the soil MBN and MBC concentrations using a Total Organic Carbon Analyzer (TOC-L CPN, Shimadzu Corporation, Kyoto, Japan). The soil WSOC and WSON concentrations were measured based on the approaches described in Singh et al. [39]. The concentrations of NH4+-N and NO3-N were analyzed using a double-beam spectrophotometer (UV-8000PC, Shanghai, China) according to the method of Zhang et al. [12].

2.6. Statistical Analyses

All data used for the analysis were the average of four replicates. Microsoft Excel 2013 and SPSS 19.0 software were used for statistical analyses. One-way ANOVA with the least significant difference (LSD) was applied to determine the significance of the annual cumulative soil GHG emission and annual average values of soil physical and chemical properties under CK, BFT, CFT, and MFT treatments. In the pre-processing, the data should be tested for normality and homogeneity, and if necessary, it would be logarithmically transformed. Origin 2018 software was used to make graphs, and a stepwise regression analysis was utilized to analyze the connection between soil GHG emissions and soil properties, such as pH, temperature, MBN, MBC, WSON, WSOC, NO3-N, NH4+-N concentrations, and moisture content.
Structural equation modeling (SEM) was used to reveal the mechanisms involving GHG emissions under different fertilization measures. According to the results of stepwise regression analysis, we selected factors from soil carbon pool and nitrogen pool related to individual GHG flux as the inputs factors of the model.
The AMOS 21.0 software was used to explore the impact mechanism on soil GHG emissions using soil labile carbon pool and labile nitrogen pool with BFT and CFT. In the SEM, we used maximum likelihood (χ2) goodness of fit test, goodness of fit index (GFI), normed fit index (NFI), and comparative fit index (CFI) to test goodness of fit. The standard basis of the best model used in this study is: (1) not significant χ2 test statistics (p > 0.05), (2) GFI, NFI, and CFI > 0.90.

3. Results

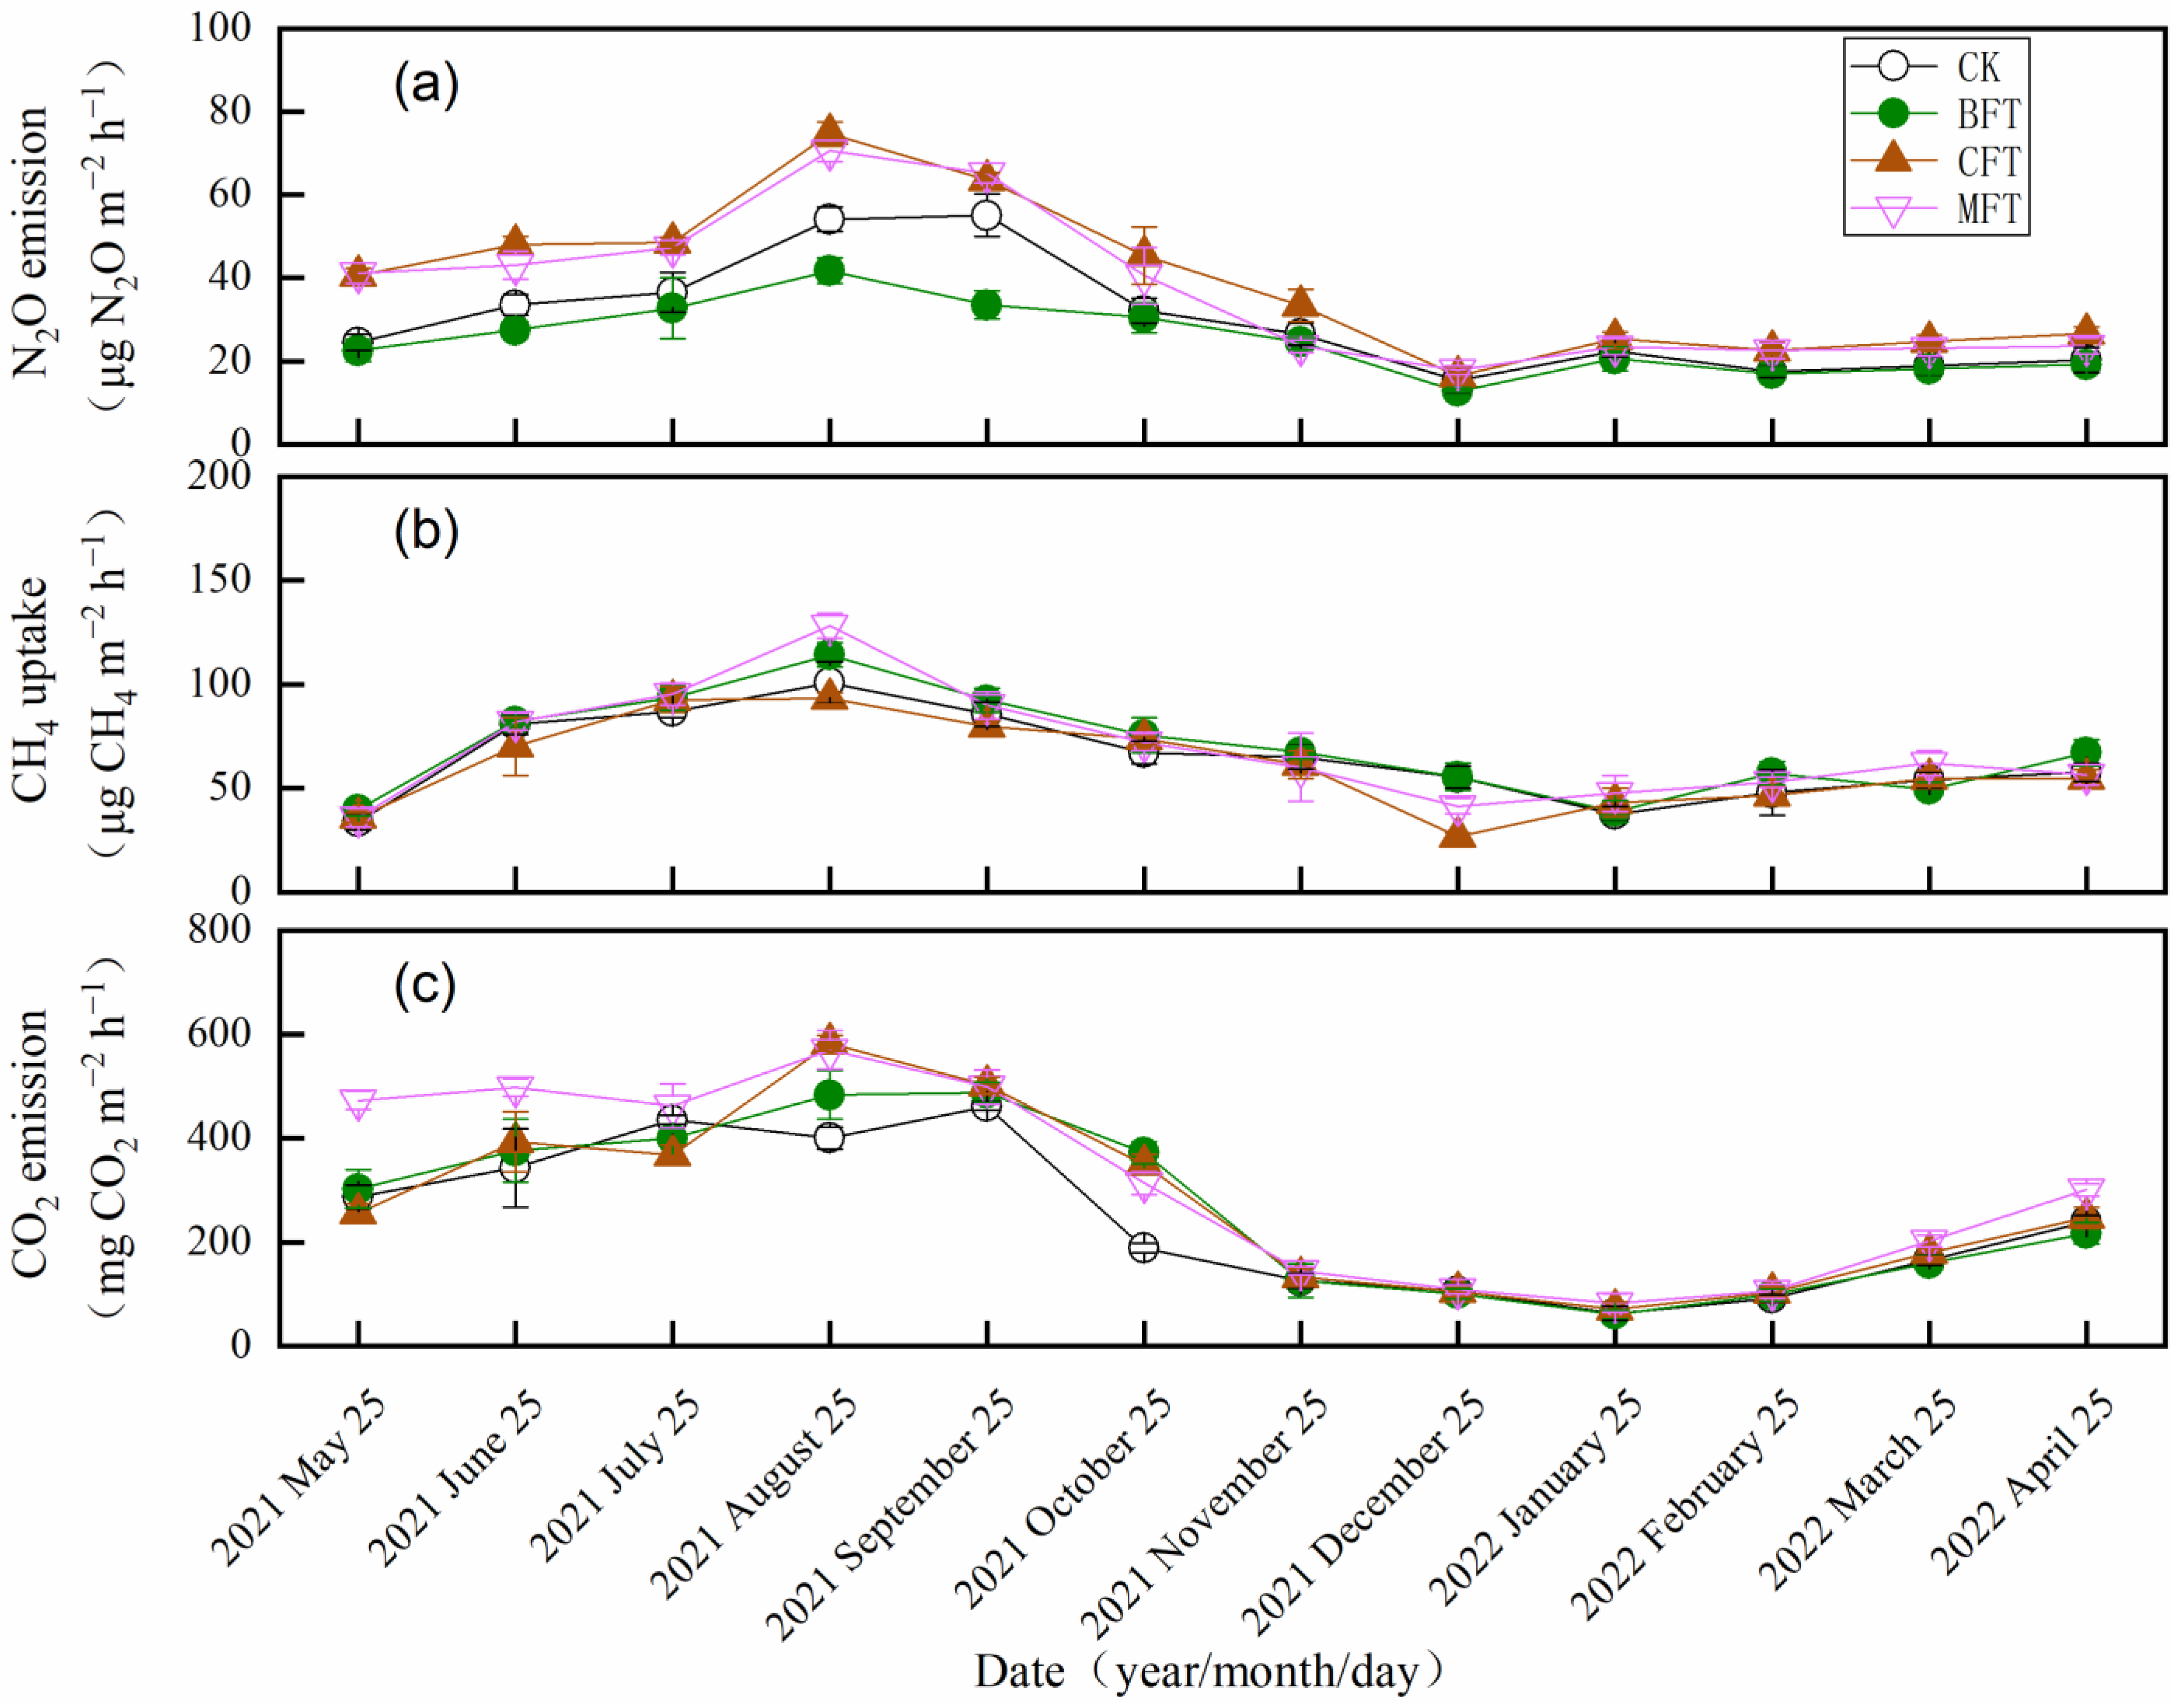
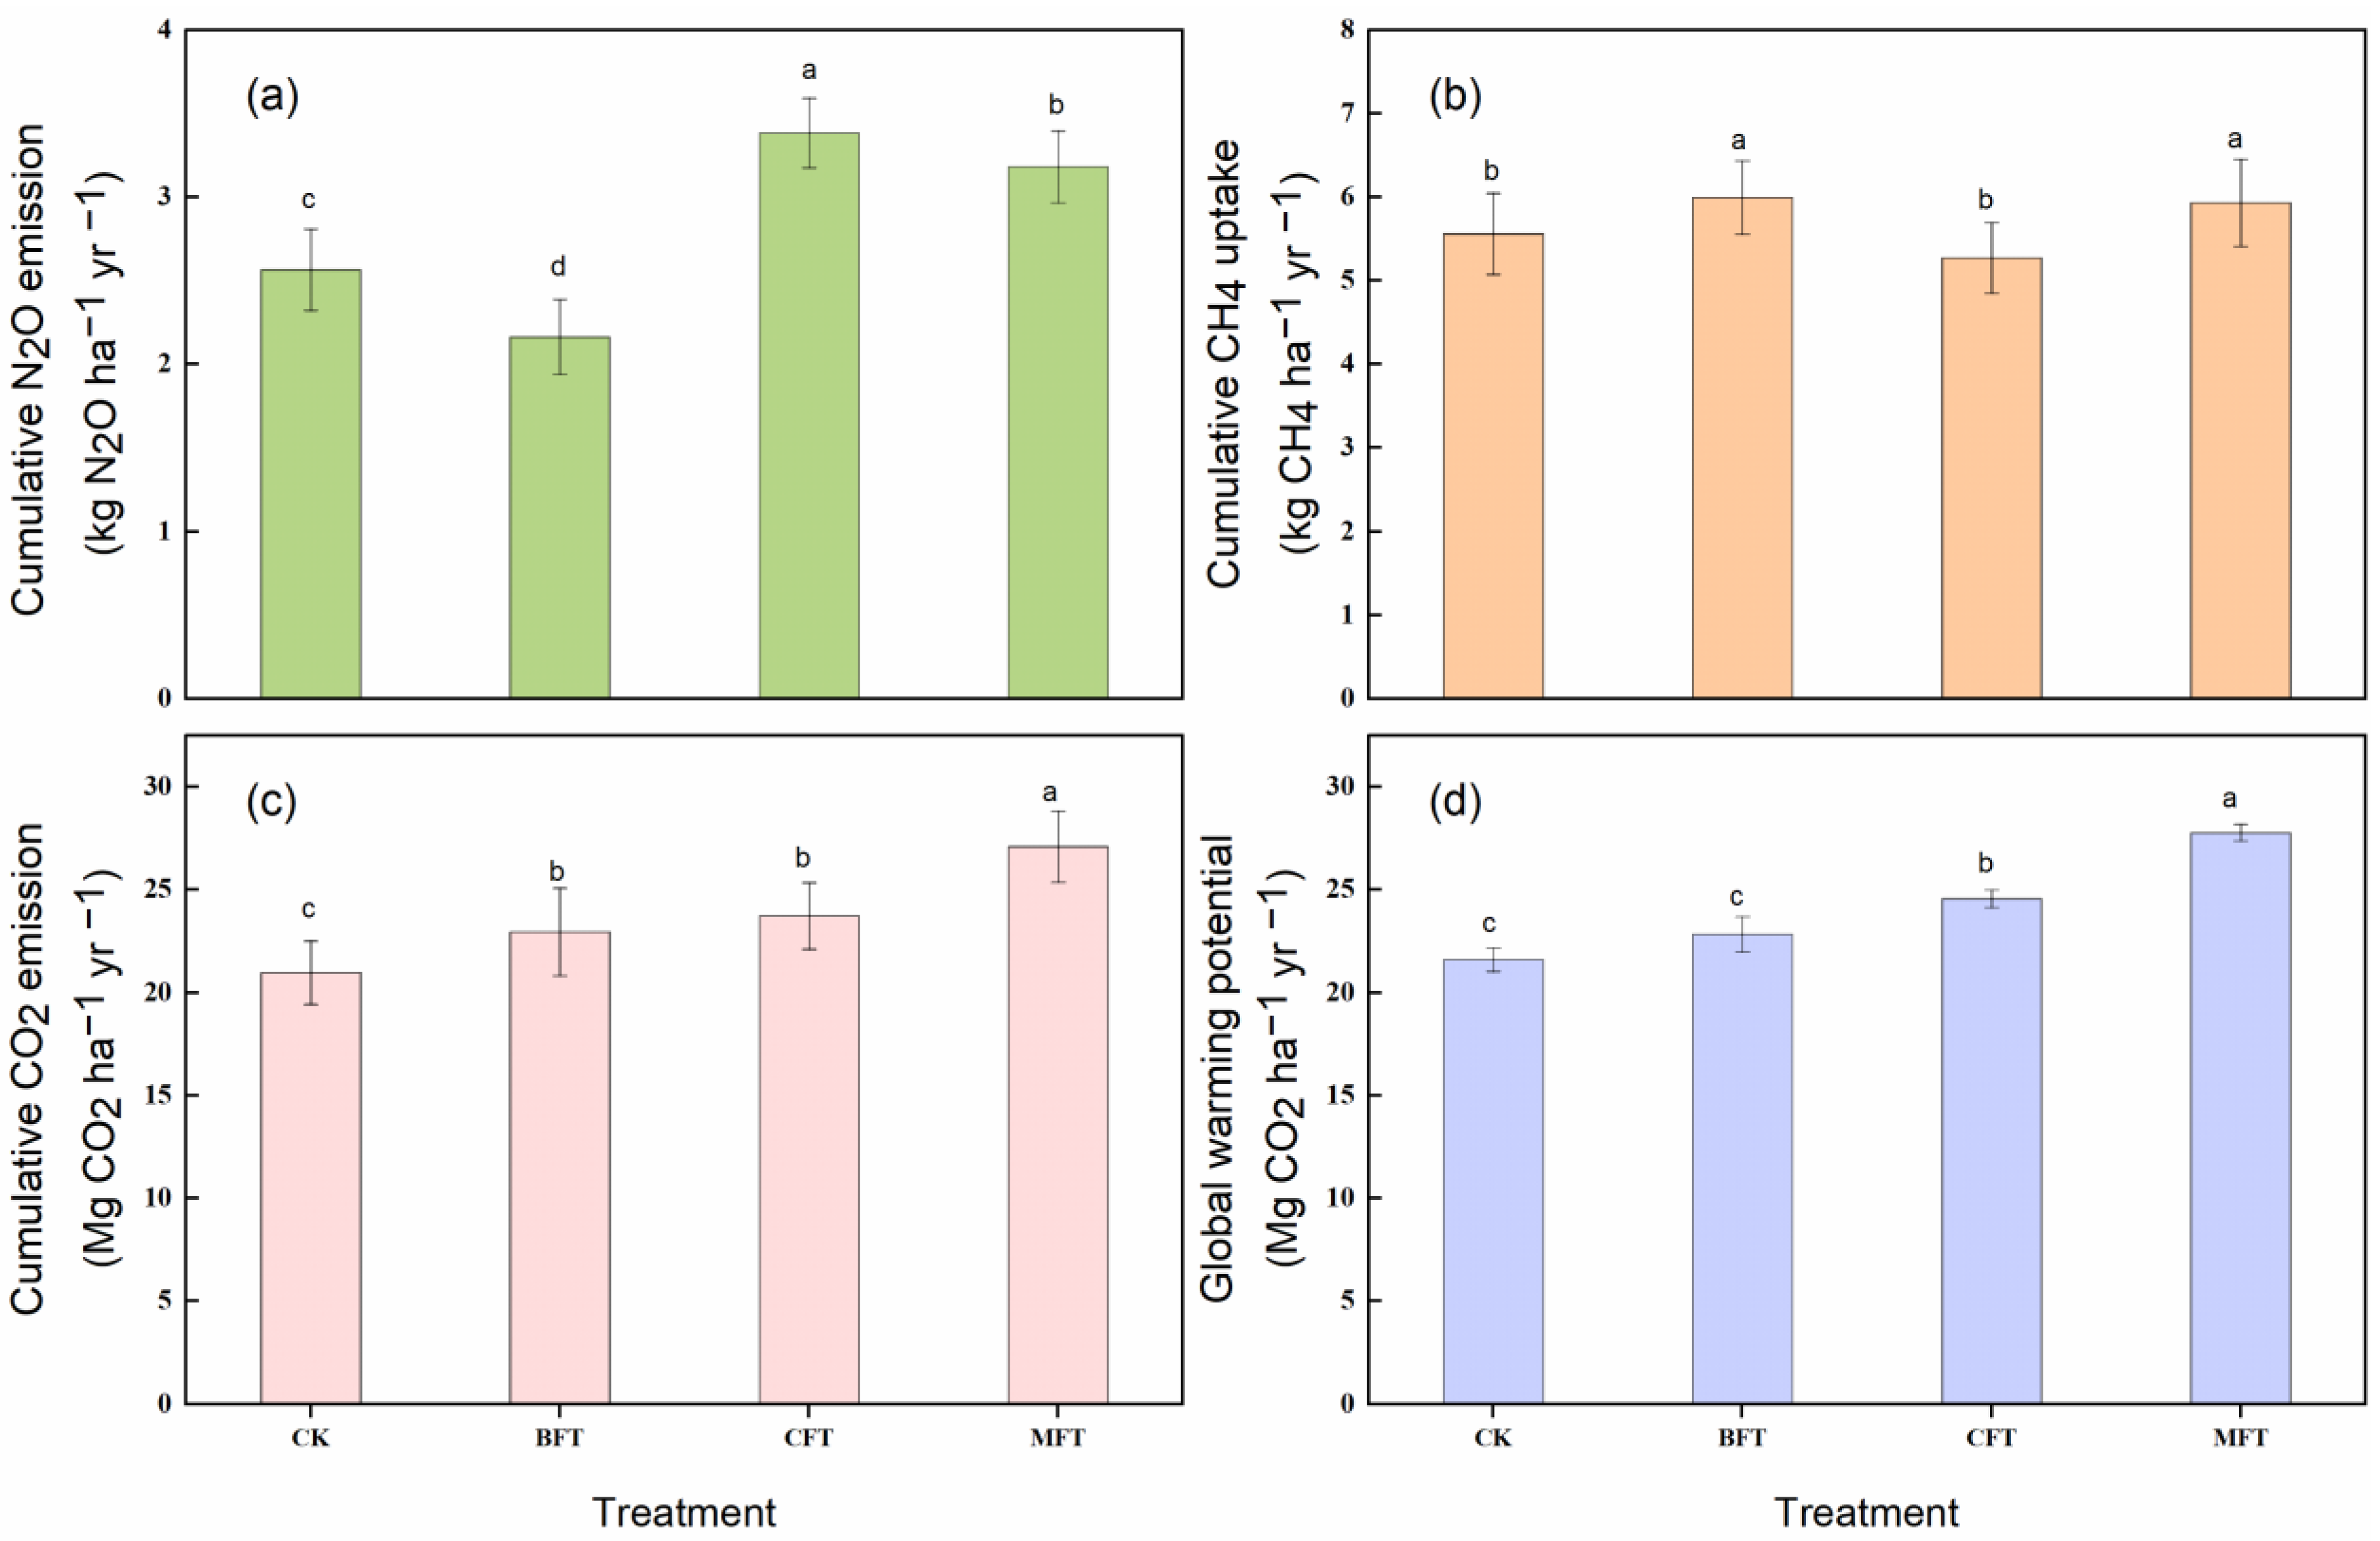
3.1. Soil GHG Emissions

In the 12-month experiment, there were distinct seasonal changes in soil GHG emissions and soil temperature at 5 cm depth, which were basically consistent with the dynamics of air temperature. The minimum soil GHG emission appeared in winter, and the peak appeared in summer among all treatments (Figure 3).
The soil N2O emission ranged from 15.40 to 55.06 µg m−2 h−1 in CK, from 12.73 to 41.73 µg m−2 h−1 in BFT, from 16.39 to 74.66 µg m−2 h−1 in CFT, and from 17.81 to 70.59 µg m−2 h−1 in MFT, respectively (Figure 3a). The annual cumulative soil N2O emission under CK, BFT, CFT, and MFT were 2.58 ± 0.13, 2.16 ± 0.10, 3.38 ± 0.05, and 3.18 ± 0.07 kg ha−1 yr−1, respectively (Figure 4a). Compared with the control, BFT reduced the annual cumulative emission of soil N2O by 16.3% (p < 0.01), while CFT and MFT dramatically enhanced the emission by 31.0% and 23.3% (p < 0.01), respectively, on a yearly cumulative basis (Figure 4a).
Soil CH4 uptake ranged from 33.91 to 100.76 μg m−2 h−1, from 38.81 to 114.13 μg m−2 h−1, from 26.75 to 93.33 μg m−2 h−1, and from 35.87 to 128.20 μg m−2 h−1, respectively, under the CK, BFT, CFT, and MFT. The annual cumulative soil CH4 uptake were 5.50 ± 0.14, 5.82 ± 0.16, 5.46 ± 0.05 and 5.91 ± 0.11 kg ha−1 yr−1, respectively, for the treatments CK, BFT, CFT, and MFT (Figure 4b). CFT had no significant effect compared with the CK, while BFT and MFT significantly increased the annual cumulative soil CH4 uptake by 5.8% (p < 0.01) and 7.5% (p < 0.01), respectively (Figure 4b).
In the CK, BFT, CFT, and MFT, the soil CO2 emission ranged from 63.25 to 461.58 mg m−2 h−1, from 61.66 to 487.67 mg m−2 h−1, from 71.21 to 583.02 mg m−2 h−1, from 82.84 to 569.89 mg m−2 h−1, respectively (Figure 3c). Under the treatments of CK, BFT, CFT, and MFT, the annual cumulative soil CO2 emission were 20.96 ± 0.60, 22.93 ± 1.31, 23.68 ± 0.42, and 26.52 ± 1.04 Mg ha−1 yr−1, respectively (Figure 4c). Compared with the CK, the BFT, CFT, and MFT significantly increased the cumulative CO2 emission by 9.4% (p < 0.05), 13.0% (p < 0.01), and 26.5% (p < 0.01), respectively (Figure 4c). In summary, the GWP values under CK, BFT, CFT, and MFT were 21.59 ± 0.57, 22.82 ± 0.85, 24.55 ± 0.43, 27.76 ± 0.40 CO2-eq Mg ha−1 yr−1, respectively. In contrast, the GWP of BFT did not change significantly, while CFT and MFT increased it by 13.7% and 28.6% (p < 0.05), respectively (Figure 4d).

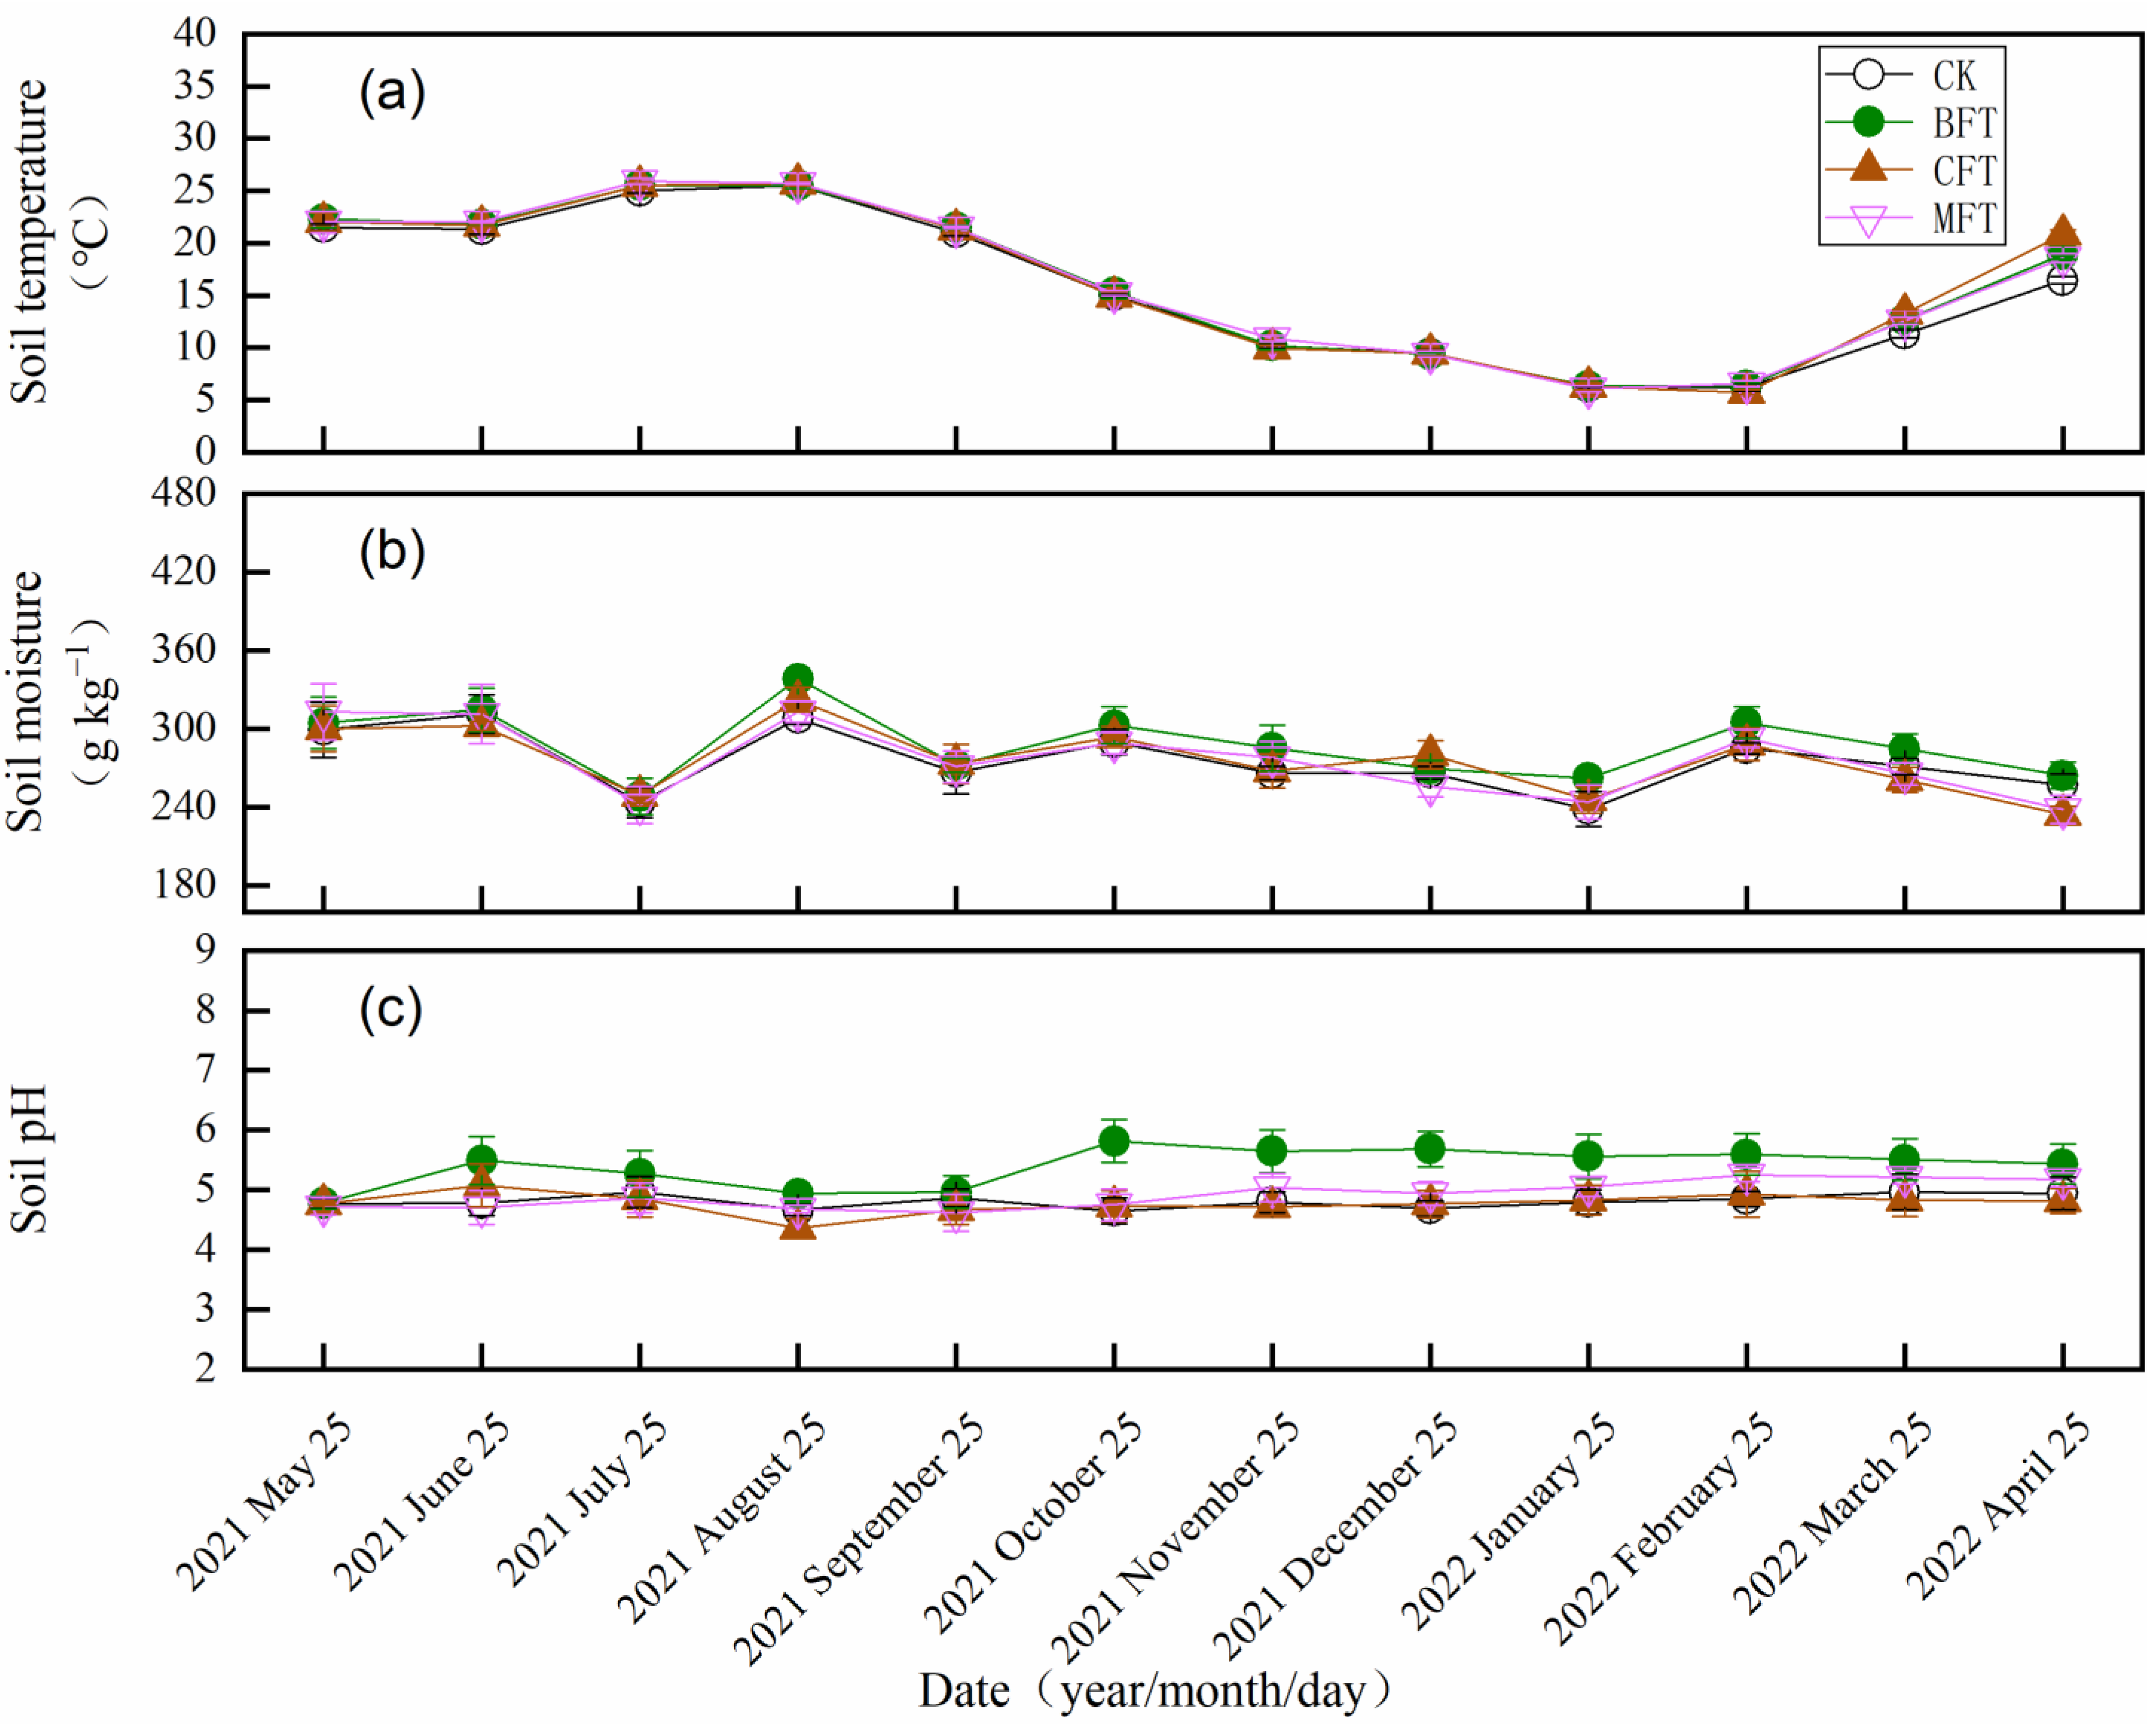
3.2. Soil Environmental Factors

The temperature of the soil at 5 cm depth showed a distinct seasonal variation (Figure 5a). The soil temperature peaked in July–August and dropped to the lowest value during the period of January–February. Fertilizer applications had no discernible effects on the soil temperature and soil moisture at 5 cm depth (Figure 5). In contrast, when compared to the control, BFT treatment considerably enhanced the soil pH (Figure 5c).
For soil carbon (C) pool, both soil MBC and WSOC concentrations exhibited a seasonal variation (Figure 6). Compared with CK, there were significant differences among different treatments. BFT, CFT, and MFT significantly increased the annual mean soil MBC concentration by 14.9% (p < 0.01), 6.4% (p < 0.05), and 9.9% (p < 0.01), respectively (Figure 6a). Similarly, BFT, CFT, and MFT increased the annual mean soil WSOC concentration by 10.7% (p < 0.01), 5.1% (p < 0.05), and 4.3% (p < 0.01), respectively (Figure 6b).
As for the soil nitrogen (N) pool, the soil NO3-N and NH4+-N concentrations showed distinct seasonal variations. Compared with CK, BFT decreased the annual mean soil NO3-N concentration by 13.4%, while CFT and MFT increased the concentration by 20.7% and 13.7%, respectively (Figure 7a). BFT decreased the annual mean soil NH4+-N concentration by 9.4%, while CFT and MFT increased it by15.4% and 28.1%, respectively (Figure 7b). However, compared with CK, BFT reduced the annual mean WSON concentration by 6.4%, while the WSON concentration increased by 15.0% and 3.9%, respectively, following CFT and MFT (Figure 7d).

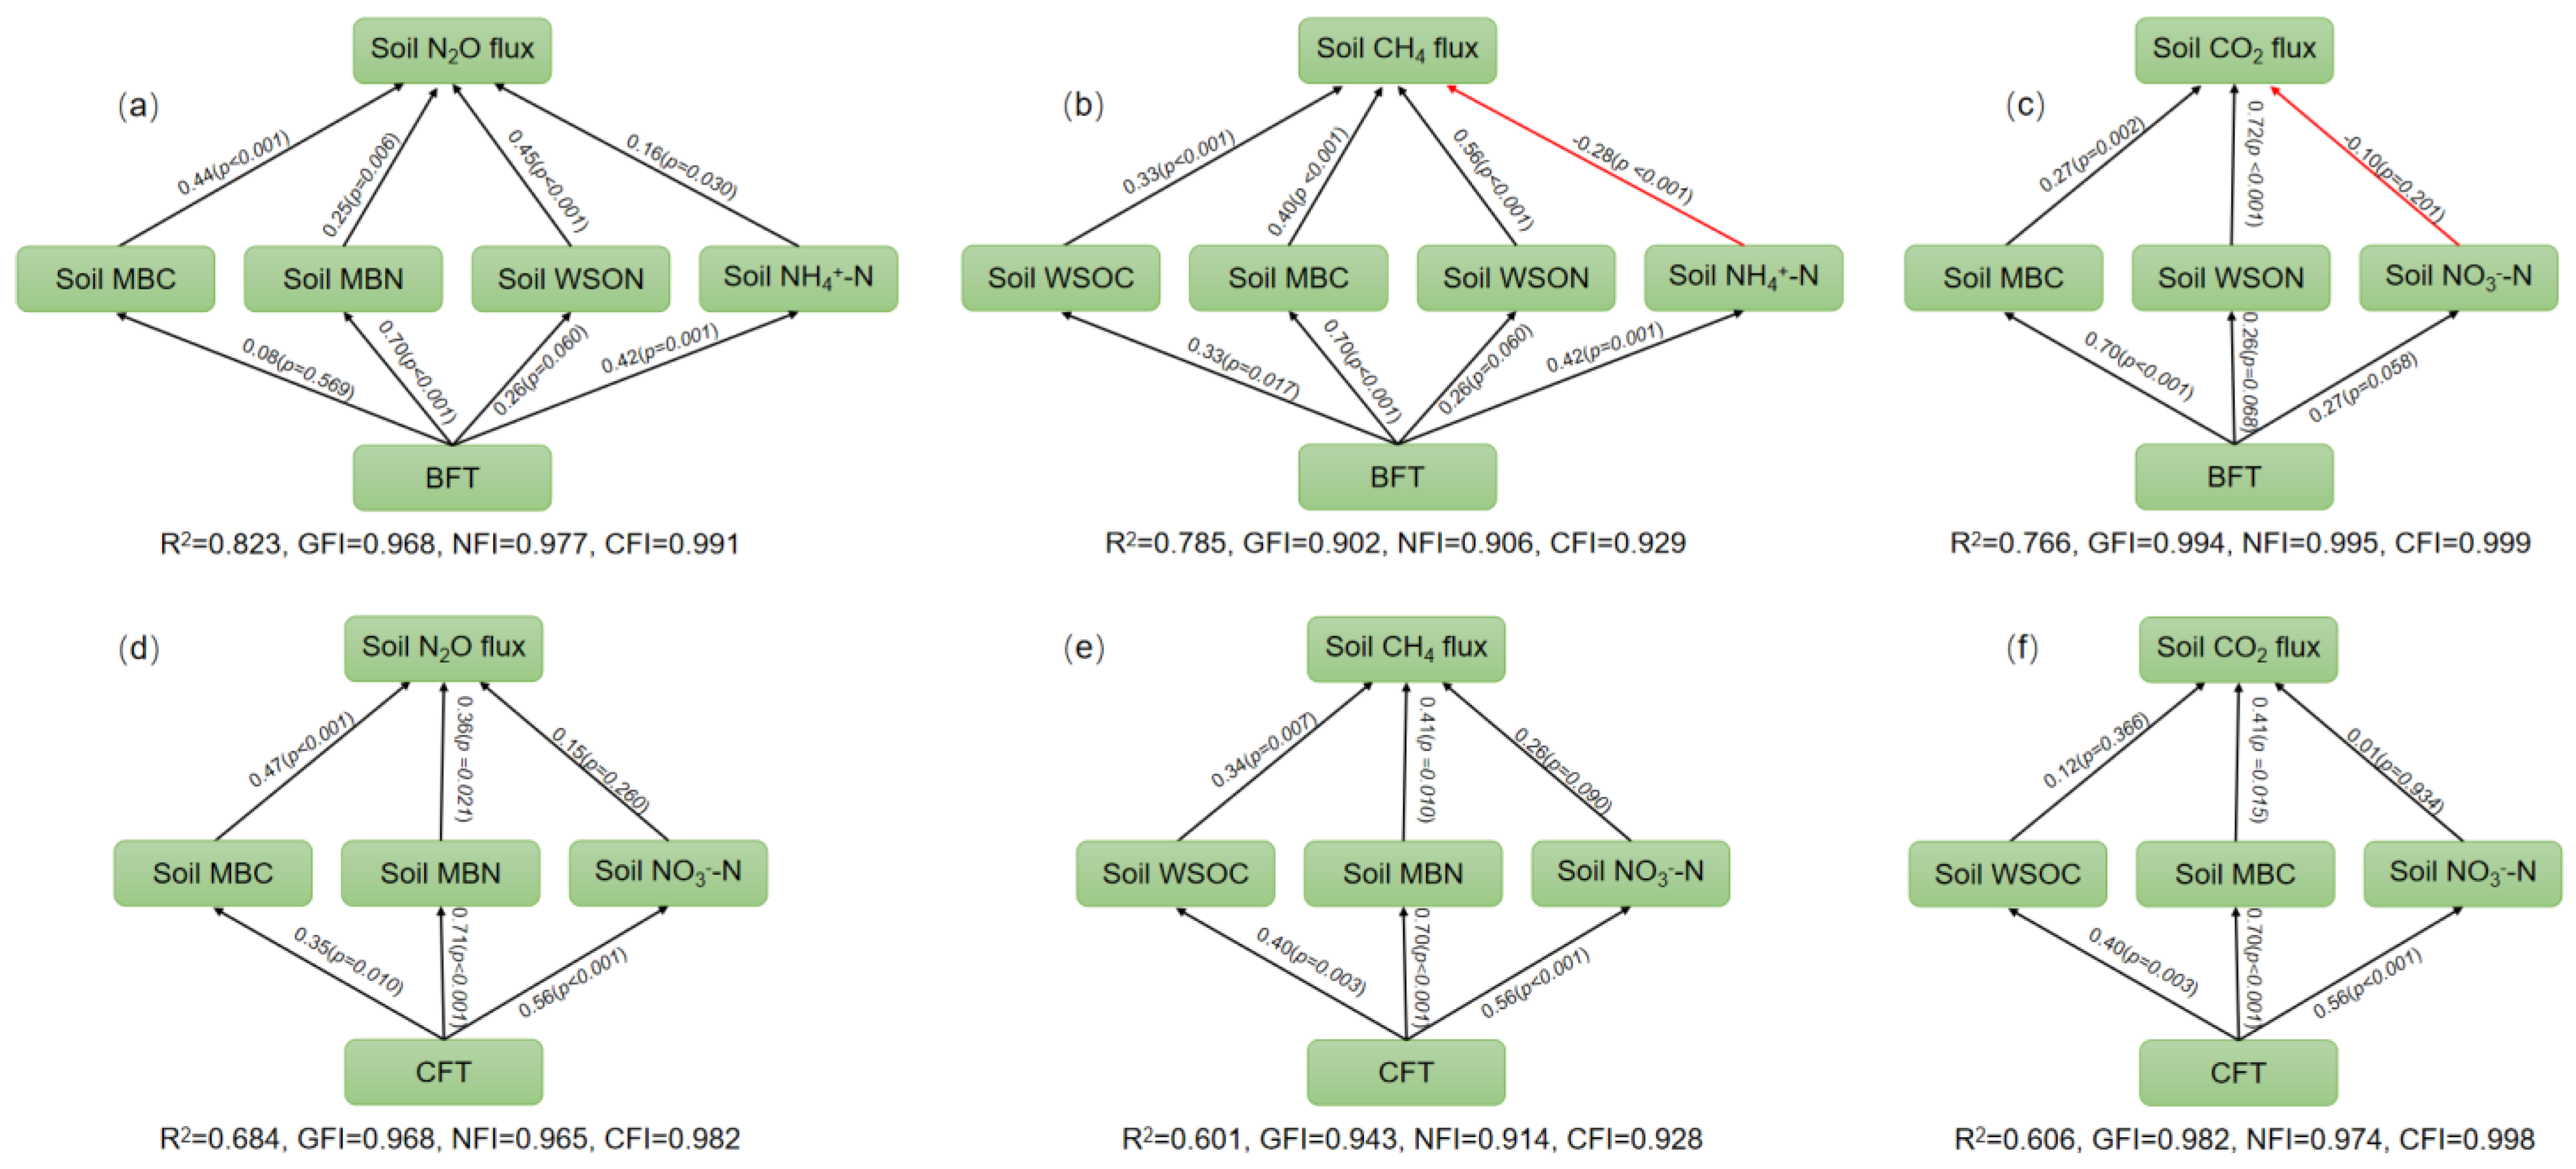
3.3. Relationship between Soil Environmental Factors and GHG Emissions

There were significantly positive correlations between soil WSON concentration, MBN concentration, and soil N2O emissions (Table 2). In contrast, regardless of the treatments, soil N2O emission was not significantly related to soil moisture and WSOC concentration. All treatments showed a positive correlation between soil CH4 absorption and soil WSOC concentration (Table 3). In BFT, soil CH4 uptake was positively linked with soil MBC, WSOC, and WSON concentrations. Regardless of the treatments, the soil CO2 flux was significantly and positively correlated with soil temperature at 5 cm depth (Table 4). In addition, under CFT and MFT treatment, there was a positive correlation between soil CO2 emission and soil moisture.
The main soil factors affecting soil GHG emission were predicted and explained by SEM. Upon biochar-based fertilizer and chemical fertilizer treatments, soil carbon and nitrogen pool can drive soil GHG emission (Figure 8). The SEM results showed soil MBC concentration and WSON concentration were the main factors driving soil N2O emission in biochar-based fertilizer treatment (Figure 8a). However, the concentration of soil MBC concentration and MBN concentration were important factors controlling N2O emission in CFT treatment (Figure 8d). In addition, soil CH4 uptake was driven by soil MBC concentration and WSON concentration in BFT (Figure 8b). However, the effect of soil MBN concentration on soil CH4 flux is positively significant in CFT (Figure 8e). The SEM indicated soil MBC concentration drove soil CO2 emission in biochar-based fertilizer treatment and chemical fertilizer treatment (Figure 8c,f).

4. Discussion

4.1. Effects of Fertilization on Soil N2O Emission

Our findings demonstrated the application of biochar-based fertilizer dramatically decreased annual cumulative soil N2O emission throughout the one-year trial period, which supported our first hypothesis (Figure 3a and Figure 4a). In addition, this also supports the observation in Yang et al. [40], which reported biochar decreased N2O flux by 35.90% in an experiment with farmland soil in the Sonnen Plain. Similarly, Song et al. [21] found biochar treatment considerably decreased soil N2O emission via decreasing soil labile N concentration, and the reduction rate was positively correlated with the biochar application rate in a subtropical Moso bamboo forest. Thus, our analysis also provided additional and substantial evidence the application of biochar-based fertilizer can reduce soil N2O emission from managed lands. The following explanations may account for the impact mechanism of reduction in N2O emissions in the BFT-treated Pleioblastus amarus plantation soil.
Firstly, biochar contains a large amount of carbon and nutrients and has a rich pore structure, which has a good fixation effect on carbon and nitrogen. Applying biochar-based fertilizers promotes soil aeration and porosity, thereby increasing the oxygen concentration in the soil, which in turn inhibits soil denitrification processes and anaerobic microbial activity [41,42,43,44]. Moreover, our results demonstrated BFT treatment reduced soil NH4+-N and NO3-N concentrations when compared to CK (Figure 7). Previously, it was thought that one of the most important ways of reducing soil N2O emissions was to restrict the supply of mineral nitrogen to denitrifying bacteria [45]. Our experimental results also support the above statement, as BFT treatment considerably lowered soil WSON concentration. Moreover, soil WSON concentration was positively correlated with N2O emission in our investigation and study (Table 2). In addition, we found N2O emissions were affected by soil WSON concentration in SEM (Figure 8a). Therefore, one key method to lower soil N2O emissions may be the involvement of biochar-based fertilizers in restricting mineral N. The annual cumulative N2O emission significantly increased after CFT and MFT compared to the control (Figure 4a), which was mainly due to the significant increase in soil NO3-N and NH4+-N concentrations. Since half of the nitrogen in MFT comes from CFT, it may be concluded this caused the higher soil N2O emission in the MFT treatment. Different fertilizer treatments could alter soil N2O emission through changing soil labile carbon and labile nitrogen pools, according to the results of stepwise regression models and SEM (Figure 8a,d, Table 2).
Secondly, the soil C pool is also an important factor affecting N2O emissions. MBC and WSOC, as unstable parts of SOC carbon components, take part in a number of biochemical soil microbial activities that are correlated with soil N2O emissions [46,47]. According to this study, BFT treatment increased MBC concentration and WSOC concentration while dramatically reducing soil N2O emission (Figure 6). This indicated that using BFT did not reduce soil N2O emission by changing the concentration of active organic carbon components. Furthermore, soil N2O emission was not correlated with WSOC concentration. Therefore, we can rule out the possibility fertilization treatments increased soil N2O emission by increasing WSOC concentration. At the same time, this result also confirmed our second hypothesis.
Finally, we observed the pH of BFT-treated soil was increased (Figure 5c), which could promote N2O to N2 conversion throughout soil denitrification, therefore lowering emissions of soil N2O [41]. Additionally, we found there is no significant linear relationship between N2O emission and soil moisture at 5 cm depth (Table 2). This supports the view of [48], who found regardless of fertilization, soil N2O flux and soil moisture were not significantly associated in Moso bamboo forests in Hangzhou, China. Xu et al. [42] also revealed no correlation between soil N2O emission and soil moisture with silicate fertilizer application in Phyllostachys Pubescens. Different studies had various conclusions about the association between soil moisture and soil N2O emission. Vargas et al. [49] concluded N2O emission increased linearly with soil moisture regardless of the application of sugarcane crop residues on the soil.

4.2. Effects of Fertilization on Soil CH4 Uptake

The BFT rose the annual cumulative soil CH4 uptake and the annual mean value (Figure 4b). Our findings were consistent with previous findings. For example, Lv et al. [50] found the application of biochar increased significantly (p < 0.05) CH4 uptake in subtropical plantations through a two-year experimental study in Hangzhou, China. In addition, Fang et al. [51] showed one year after applying different amounts of biochar to Moso bamboo forests, the annual soil cumulative CH4 uptake increased significantly. Adding biochar-based fertilizer to Pleioblastus amarus plantation soil for one year increased the annual cumulative soil CH4 uptake. According to the experimental data and SEM analysis (Figure 8), the possible reasons are as follows.
First, because of its special biological structure, biochar can absorb and diffuse more CH4 into the soil, thereby promoting the growth of CH4-nutrient microorganisms. Under the conditions of good aeration, methanogen activity in the soil declines while the activity of methanotrophs increases, thereby promoting methane absorption in the soil [52]. Second, biochar treatment increases soil porosity, and soil water content decreases the anaerobic soil environment and increases CH4 oxidation. Soil methanotrophs use soil oxygen to oxidize CH4 to CO2 in the soil [53]. Third, we found that compared with CK, CFT treatment had no significant effect, while BFT treatment increased the soil CH4 uptake. In addition, the BFT, MBC, and WSOC concentrations in the soil were closely correlated with the soil CH4 uptake (Table 3), and the BFT treatment increased the annual mean soil MBC and WSOC concentrations (Figure 6). Similarly, the SEM results showed the CH4 uptake was affected by the soil MBC concentration in biochar-based fertilizer treatment (Figure 8b). This indicated BFT treatment promoted soil CH4 uptake by increasing the concentrations of soil MBC and WSOC. This result was also confirmed by Liu et al. [54], who found soil MBC concentration increased when straw charcoal was applied.
However, some studies revealed the utilization of biochar either has no impact on soil CH4 uptake or increases soil CH4 emission. For example, in the growing choy sum and amaranth experiment, Jia et al. [55] discovered the use of maize straw biochar modifier had no discernible impact on CH4 emission. The differences in these results may be caused by differences in study subjects, fertilization methods, land types, experimental designs, soil pH, and regional climates. Therefore, we need specific experimental studies to focus on the processes and internal mechanisms involving the impact of biochar on soil CH4 uptake and translocation.

4.3. Effects of Fertilization on Soil CO2 Emission

Some previous studies revealed soil CO2 emissions decreased or had no effect following the input of biochar [17,56]. In contrast, this study demonstrated BFT, CFT, and MFT all substantially increased the annual cumulative CO2 emissions compared with the control. Applying biochar-based fertilizers increased the annual cumulative emission (Figure 4c), which partially refuted our first hypothesis. Our results also complied with some other studies.
For example, Troy et al. [57] and Kalu et al. [58] established that incorporating biochar to soil increased CO2 emission. Using biochar-based fertilizer in the Pleioblastus amarus plantation increased the annual cumulative soil CO2 emissions, which may be caused by the following reasons.
Firstly, using fertilizers incorporated with biochar may raise the enzyme activity of the soil, which promotes the accumulation of active organic carbon and decomposition of soil organic carbon, which in turn affects soil CO2 emissions [59]. Secondly, biochar as a soil amendment can increase soil pH [60]. Our experimental data found the application of biochar- based fertilizer increases soil moisture and soil pH (Figure 5). Appropriate water conditions and pH provide a suitable living environment for soil microorganisms, and the changes of microorganisms in biological activities result in increased CO2 emission [56]. Thirdly, significantly favorable correlations were discovered between soil temperature, WSOC concentration, and soil CO2 emission (Table 4). In addition, the SEM results showed there is a positive correlation between soil MBC concentration and soil CO2 emission in biochar-based fertilizer and chemical fertilizer treatments (Figure 8c,f). Biochar, as a stable organic carbon, was input into the soil of the Pleioblastus amarus plantation, which increased the contents of soil MBC, and thus, increased the soil CO2 emission. Finally, the utilization of biochar-based fertilizers in the plantation soil greatly improved the soil environment. Moreover, the input of biochar reduced the loss of nutrients, and more nutrients were retained in the soil. As a result, plants can absorb more nutrients from the soil to promote vegetation growth, vegetation roots’ respiration is also enhanced, and more CO2 is emitted.

5. Conclusions

The addition of BFT greatly decreased the soil N2O emission of the Pleioblastus amarus plantation, while applying CFT or MFT with nitrogen, phosphorus, and potassium nutrients significantly increased the N2O emission. Similarly, BFT treatment significantly increased soil CH4 uptake, but MFT treatment significantly decreased the uptake. Conversely, fertilization constantly increases soil CO2 emissions regardless of treatments. However, the soil CO2 emission of biochar-based fertilizer treatment was lower than that of the chemical fertilizer treatment. In addition, this study reported soil temperature at 5 cm, MBC, WSOC, and WSON concentrations were the important factors regulating soil GHG emissions. The SEM results showed soil WSON concentration drives soil N2O emission, and soil CH4 uptake and CO2 emission are affected by soil MBC concentration.
The production process and technique of biochar-based fertilizers are mature, and the price is relatively low. Therefore, considering the economic cost and the yields of the Pleioblastus amarus plantation, our findings suggest utilizing biochar-based fertilizers instead of traditional chemical fertilizers can be promoted as an environment-friendly soil management measure by reducing GHG emissions. Meanwhile, an essential part of the process of soil GHG emissions is played by the fungal and bacterial species in the soil from the Pleioblastus amarus plantation. Therefore, in future studies, a longer trial period is needed to better understand how soil microbial communities engaged in C and N cycling react to the administration of biochar-based fertilizers in Pleioblastus amarus plantation soil.

Author Contributions

Conceptualization, Y.S., L.X., G.Z. and Y.Z.; data curation, E.W.; formal analysis, E.W. and N.Y.; investigation, E.W., N.Y., S.L., X.T., L.W. and G.W.; funding acquisition, Y.S. and L.X.; writing—original draft preparation, E.W. All authors have read and agreed to the published version of the manuscript.

Funding

This research was funded by the National Natural Science Foundation of China (Grant number: U1809208; 31870618; 32001315); Scientific Research Development Fund of Zhejiang A&F University (Grant number: 2020FR008); the Key Research and Development Program of Zhejiang Province (Grant number: 2021C02005; 2022C03039).

Data Availability Statement

Not applicable.

Acknowledgments

This study was supported by the Natural Resources Defense Council (NRDC). We would like to thank the editor and anonymous reviewers for their contribution to the peer review of our study.

Conflicts of Interest

The authors declare no conflict of interest.

References

  1. Vrrousek, P.M. Beyond Global Warming: Ecology and Global Change. Ecology 1994, 75, 1861–1876. [Google Scholar]
  2. Wardle, D.A.; Bardgett, R.D.; Callaway, R.M.; Van Der Putten, W.H. Terrestrial Ecosystem Responses to Species Gains and Losses. Science 2011, 332, 1273–1277. [Google Scholar] [CrossRef] [PubMed] [Green Version]
  3. Keenan, T.F.; Gray, J.; Friedl, M.A.; Toomey, M.; Bohrer, G.; Hollinger, D.Y.; Munger, J.W.; O’Keefe, J.; Schmid, H.P.; Wing, I.S. Net Carbon Uptake Has Increased through Warming-Induced Changes in Temperate Forest Phenology. Nat. Clim. Chang. 2014, 4, 598–604. [Google Scholar] [CrossRef]
  4. Fu, W.J.; Fu, Z.J.; Ge, H.L.; Ji, B.Y.; Jiang, P.K.; Li, Y.F.; Wu, J.S.; Zhao, K.L. Spatial Variation of Biomass Carbon Density in a Subtropical Region of Southeastern China. Forests 2015, 6, 1966–1981. [Google Scholar] [CrossRef] [Green Version]
  5. Dou, Y.; Yu, X.J. Development and Comparison of Bamboo Industry in the World. World Agric. 2008, 7, 18–21. [Google Scholar]
  6. Zhou, G.; Jiang, P.; Xu, Q. Carbon Sequestration and Transformation in Bamboo Forest Ecosystems, 1st ed.; Science Press: Beijing, China, 2010; pp. 2–3. [Google Scholar]
  7. Wu, H. Analysis on Fertilization Test of Pleioblastus amarus in Different Growth Periods. Green Sci. Technol. 2021, 23, 164–166. [Google Scholar]
  8. Shen, G.C.; Zhang, X.D.; Zhang, L.; Gao, S.H.; Zhang, R.; Zhu, W.S.; Tang, S.Q. Estimating the Carbon Stock and Carbon Sequestration of the Pleioblastus amarus Forest Ecosystem in Southern of Sichuan. Sci. Silvae Sin. 2013, 49, 78–84. [Google Scholar]
  9. He, Y.P.; Fei, S.M.; Jiang, J.M.; Chen, X.M.; Yu, Y.; Zhu, W.S.; Tang, S.Q. The Spatial Distribution of Organic Carbon in Phyllostachyspubescens and Pleioblastus amarus in Changning City. Sichuan For. Sci. Technol. 2007, 28, 10–14. [Google Scholar]
  10. Shen, G.C. Estimating the Carbon Sequestration of Phyllostachys Edulis and Pleioblastus amarus Plantations Based on Net Ecosystem Productivity. Master’s Thesis, Chinese Academy of Forestry, Beijing, China, 2012. [Google Scholar]
  11. Xiong, Y.M.; Xia, H.P.; Li, Z.A.; Cai, X.A.; Fu, S.L. Impacts of Litter and Understory Removal on Soil Properties in a Subtropical Acacia Mangium Plantation in China. Plant Soil 2008, 304, 179–188. [Google Scholar]
  12. Zhang, M.; Fan, C.H.; Li, Q.L.; Li, B.; Zhu, Y.Y.; Xiong, Z.Q. A 2-Yr Field Assessment of the Effects of Chemical and Biological Nitrification Inhibitors on Nitrous Oxide Emissions and Nitrogen Use Efficiency in an Intensively Managed Vegetable Cropping System. Agric. Ecosyst. Environ. 2015, 201, 43–50. [Google Scholar] [CrossRef]
  13. Li, Y.F.; Zhang, J.J.; Chang, S.X.; Jiang, P.K.; Zhou, G.M.; Fu, S.L.; Yan, E.R.; Wu, J.S.; Lin, L. Long-Term Intensive Management Effects on Soil Organic Carbon Pools and Chemical Composition in Moso Bamboo (Phyllostachys Pubescens) Forests in Subtropical China. For. Ecol. Manag. 2013, 303, 121–130. [Google Scholar] [CrossRef]
  14. Tian, H.Q.; Yang, J.; Xu, R.T.; Lu, C.Q.; Canadell, J.G.; Davidson, E.A.; Jackson, R.B.; Arneth, A.; Chang, J.F.; Ciais, P.; et al. Global soil nitrous oxide emissions since the preindustrial era estimated by an ensemble of terrestrial biosphere models: Magnitude, attribution, and uncertainty. Glob. Chang. Biol. 2019, 25, 640–659. [Google Scholar] [CrossRef] [PubMed] [Green Version]
  15. Jones, D.L.; Murphy, D.V.; Khalid, M.; Ahmad, W.; Edwards-Jones, G.; DeLuca, T.H. Short-Term Biochar-Induced Increase in Soil CO2 Release Is Both Biotically and Abiotically Mediated. Soil Biol. Biochem. 2011, 43, 1723–1731. [Google Scholar] [CrossRef]
  16. Wu, Y.; Xu, G.; Lv, C.Y.; Shao, H.B. Effects of Biochar Amendment on Soil Physical and Chemical Properties: Current Status and Knowledge Gaps. Adv. Earth Sci. 2014, 29, 68–79. [Google Scholar]
  17. Wu, M.X.; Feng, Q.B.; Sun, X.; Wang, H.L.; Gielen, G.; Wu, W.X. Rice (Oryza Sativa L.) Plantation Affects the Stability of Biochar in Paddy Soil. Sci. Rep. 2015, 5, 10001. [Google Scholar] [CrossRef] [Green Version]
  18. Sohi, S.P.; Krull, E.; Lopez-Capel, E.; Bol, R. A Review of Biochar and Its Use and Function in Soil. Adv. Agron. 2010, 105, 47–82. [Google Scholar]
  19. Li, Y.F.; Hu, S.D.; Chen, J.H.; Müller, K.; Li, Y.C.; Fu, W.J.; Lin, Z.W.; Wang, H.L. Effects of Biochar Application in Forest Ecosystems on Soil Properties and Greenhouse Gas Emissions: A Review. J. Soils Sediments 2018, 18, 546–563. [Google Scholar] [CrossRef]
  20. Ge, X.G.; Cao, Y.H.; Zhou, B.Z.; Wang, X.M.; Yang, Z.Y.; Li, M.H. Biochar Addition Increases Subsurface Soil Microbial Biomass but Has Limited Effects on Soil CO2 Emissions in Subtropical Moso Bamboo Plantations. Appl. Soil Ecol. 2019, 142, 155–165. [Google Scholar] [CrossRef]
  21. Xu, L.; Fang, H.Y.; Deng, X.; Ying, J.Y.; Lv, W.J.; Shi, Y.J.; Zhou, G.M.; Zhou, Y.F. Biochar Application Increased Ecosystem Carbon Sequestration Capacity in a Moso Bamboo Forest. For. Ecol. Manag. 2020, 475, 118447. [Google Scholar] [CrossRef]
  22. Song, Y.Z.; Li, Y.F.; Cai, Y.J.; Fu, S.L.; Luo, Y.; Wang, H.L.; Liang, C.F.; Lin, Z.W.; Hu, S.D.; Li, Y.C.; et al. Biochar Decreases Soil N2O Emissions in Moso Bamboo Plantations through Decreasing Labile N Concentrations, N-Cycling Enzyme Activities and Nitrification/Denitrification Rates. Geoderma 2019, 348, 135–145. [Google Scholar] [CrossRef]
  23. Hawthorne, I.; Johnson, M.S.; Jassal, R.S.; Black, T.A.; Grant, N.J.; Smukler, S.M. Application of Biochar and Nitrogen Influences Fluxes of CO2, CH4 and N2O in a Forest Soil. J. Environ. Manag. 2017, 192, 203–214. [Google Scholar] [CrossRef]
  24. Lin, Z.B.; Liu, Q.; Liu, G.; Annette, L.C.; Bei, Q.C.; Liu, B.J.; Wang, X.J.; Ma, J.; Zhu, J.G.; Xie, Z.B. Effects of Different Biochars on Pinus elliottii Growth, N Use Efficiency, Soil N2O and CH4 Emissions and C Storage in a Subtropical Area of China. Pedosphere 2017, 27, 248–261. [Google Scholar] [CrossRef]
  25. Liu, H.; Ding, Y.; Zhang, Q.; Liu, X.; Xu, J.; Li, Y.; Di, H. Heterotrophic Nitrification and Denitrification Are the Main Sources of Nitrous Oxide in Two Paddy Soils. Plant Soil 2019, 445, 39–53. [Google Scholar] [CrossRef]
  26. Liu, Q.; Liu, B.J.; Zhang, Y.H.; Hu, T.; Lin, Z.; Liu, G.; Wang, X.; Ma, J.; Wang, H.; Jin, H. Biochar Application as a Tool to Decrease Soil Nitrogen Losses (NH3 Volatilization, N2O Emissions, and N Leaching) from Croplands: Options and Mitigation Strength in a Global Perspective. Glob. Chang. Biol. 2019, 25, 2077–2093. [Google Scholar] [CrossRef] [PubMed]
  27. Zhang, S.B.; Li, Y.F.; Singh, B.P.; Wang, H.L.; Cai, X.Q.; Chen, J.H.; Qin, H.; Li, Y.C.; Chang, S.X. Contrasting Short-Term Responses of Soil Heterotrophic and Autotrophic Respiration to Biochar-Based and Chemical Fertilizers in a Subtropical Moso Bamboo Plantation. Appl. Soil Ecol. 2021, 157, 103758. [Google Scholar] [CrossRef]
  28. Nguyen, T.T.N.; Xu, C.Y.; Tahmasbian, I.; Che, R.X.; Xu, Z.H.; Zhou, X.H.; Wallace, H.M.; Bai, S.H. Effects of Biochar on Soil Available Inorganic Nitrogen: A Review and Meta-Analysis. Geoderma 2017, 288, 79–96. [Google Scholar] [CrossRef] [Green Version]
  29. Chen, W.; Meng, J.; Han, X.; Lan, Y.; Zhang, W. Past, Present, and Future of Biochar. Biochar 2019, 1, 75–87. [Google Scholar] [CrossRef] [Green Version]
  30. Sim, D.H.H.; Tan, I.A.W.; Lim, L.L.P.; Hameed, B.H. Encapsulated Biochar-based Sustained Release Fertilizer for Precision Agriculture: A Review. J. Clean. Prod. 2021, 303, 127018. [Google Scholar] [CrossRef]
  31. Yi, S.; Chang, N.Y.; Imhoff, P.T. Predicting Water Retention of Biochar-amended Soil from Independent Measurements of Biochar and Soil Properties. Adv. Water Resour. 2020, 142, 103638. [Google Scholar] [CrossRef]
  32. Lin, Q.; Tan, X.F.; Almatrafi, E.; Yang, Y.; Wang, W.J.; Luo, H.Z.; Qin, F.Z.; Zhou, C.Y.; Zeng, G.M.; Zhang, C. Effects of Biochar-based Materials on the Bioavailability of Soil Organic Pollutants and Their Biological Impacts. Sci. Total Environ. 2022, 826, 153956. [Google Scholar] [CrossRef]
  33. Knoblauch, C.; Maarifat, A.A.; Pfeiffer, E.M.; Haefele, S.M. Degradability of Black Carbon and Its Impact on Trace Gas Fluxes and Carbon Turnover in Paddy Soils. Soil Biol. Biochem. 2011, 43, 1768–1778. [Google Scholar] [CrossRef]
  34. Xu, L.; Shi, Y.J.; Zhou, G.M.; Xu, X.J.; Liu, E.B.; Zhou, Y.F.; Zhang, F.; Li, C.; Fang, H.Y.; Chen, L. Structural Development and Carbon Dynamics of Moso Bamboo Forests in Zhejiang Province, China. For. Ecol. Manag. 2018, 409, 479–488. [Google Scholar] [CrossRef]
  35. Wang, S.W.; Ma, S.; Shan, J.; Xia, Y.Q.; Lin, J.H.; Yan, X.Y. A 2-Year Study on the Effect of Biochar on Methane and Nitrous Oxide Emissions in an Intensive Rice–Wheat Cropping System. Biochar 2019, 1, 177–186. [Google Scholar] [CrossRef] [Green Version]
  36. Lv, R.K. Soil Agrochemical Analysis Methods, 3rd ed.; China Agricultural Science and Technology Press: Beijing, China, 2000; pp. 1–638. [Google Scholar]
  37. Bray, R.H.; Kurtz, L.T. Determination of Total, Organic and Available Forms of Phosphorus in Soils. Soil Sci. 1945, 59, 39–45. [Google Scholar] [CrossRef]
  38. Vance, E.D.; Brookes, P.C.; Jenkinson, D.S. An Extraction Method for Measuring Soil Microbial Biomass C. Soil Eiol. Biochem. 1987, 19, 703–707. [Google Scholar] [CrossRef]
  39. Singh, B.P.; Hatton, B.J.; Singh, B.; Cowie, A.L.; Kathuria, A. Influence of Biochars on Nitrous Oxide Emission and Nitrogen Leaching from Two Contrasting Soils. J. Environ. Qual. 2010, 39, 1224–1235. [Google Scholar] [CrossRef]
  40. Yang, X.C.; Liu, D.P.; Fu, Q.; Li, T.X.; Hou, R.J.; Li, Q.L.; Li, M.; Meng, F.X. Characteristics of Greenhouse Gas Emissions from Farmland Soils Based on a Structural Equation Model: Regulation Mechanism of Biochar. Environ. Res. 2022, 206, 112303. [Google Scholar] [CrossRef]
  41. Li, Y.C.; Li, Y.F.; Chang, S.X.; Yang, Y.; Fu, S.; Jiang, P.; Luo, Y.; Yang, M.; Chen, Z.; Hu, S. Biochar Reduces Soil Heterotrophic Respiration in a Subtropical Plantation through Increasing Soil Organic Carbon Recalcitrancy and Decreasing Carbon-Degrading Microbial Activity. Soil Biol. Biochem. 2018, 122, 173–185. [Google Scholar] [CrossRef]
  42. Xu, L.; Deng, X.; Ying, J.Y.; Zhou, G.M.; Shi, Y.J. Silicate Fertilizer Application Reduces Soil Greenhouse Gas Emissions in a Moso Bamboo Forest. Sci. Total Environ. 2020, 747, 141380. [Google Scholar] [CrossRef]
  43. Tang, Z.M.; Liu, X.R.; Li, G.C.; Liu, X.W. Mechanism of Biochar on Nitrification and Denitrification to N2O Emissions Based on Isotope Characteristic Values. Environ. Res. 2022, 212, 113219. [Google Scholar] [CrossRef]
  44. Zhong, L.; Li, G.Y.; Qing, J.W.; Li, J.L.; Xue, J.M.; Yan, B.B.; Chen, G.Y.; Kang, X.M.; Rui, Y.C. Biochar Can Reduce N2O Production Potential from Rhizosphere of Fertilized Agricultural Soils by Suppressing Bacterial Denitrification. Eur. J. Soil Biol. 2022, 109, 103391. [Google Scholar] [CrossRef]
  45. Zwieten, L.V.; Singh, B.P.; Kimber, S.W.L.; Murphy, D.V.; Macdonald, L.M.; Rust, J.; Morris, S. An Incubation Study Investigating the Mechanisms that Impact N2O Flux from Soil Following Biochar Application. Agric. Ecosyst. Environ. 2014, 191, 53–62. [Google Scholar] [CrossRef]
  46. Zhang, J.J.; Li, Y.F.; Chang, S.X.; Jiang, P.K.; Zhou, G.M.; Liu, J.; Wu, J.S.; Shen, Z.M. Understory Vegetation Management Affected Greenhouse Gas Emissions and Labile Organic Carbon Pools in an Intensively Managed Chinese Chestnut Plantation. Plant Soil 2014, 376, 363–375. [Google Scholar] [CrossRef]
  47. Fracetto, F.J.C.; Fracetto, G.G.M.; Bertini, S.C.B.; Cerri, C.C.; Feigl, B.J.; Neto, M.S. Effect of Agricultural Management on N2O Emissions in the Brazilian Sugarcane Yield. Soil Biol. Biochem. 2017, 109, 205–213. [Google Scholar] [CrossRef]
  48. Zhou, J.S.; Qu, T.H.; Li, Y.F.; Van, Z.L.; Wang, H.; Chen, J.; Song, X.; Lin, Z.; Zhang, X.; Luo, Y.; et al. Biochar-based Fertilizer Decreased While Chemical Fertilizer Increased Soil N2O Emissions in a Subtropical Moso Bamboo Plantation. Catena 2021, 202, 105257. [Google Scholar] [CrossRef]
  49. Vargas, V.P.; Cantarella, H.; Martins, A.A.; Soares, J.R.; Carmo, J.B.; Andrade, C.A. Sugarcane Crop Residue Increases N2O and CO2 Emissions under High Soil Moisture Conditions. Sugar Technol. 2014, 16, 174–179. [Google Scholar] [CrossRef]
  50. Lu, X.H.; Li, Y.F.; Wang, H.L.; Singh, B.P.; Hu, S.D.; Luo, Y.; Li, J.W.; Xiao, Y.H.; Cai, X.Q.; Li, Y.C. Responses of Soil Greenhouse Gas Emissions to Different Application Rates of Biochar in a Subtropical Chinese Chestnut Plantation. Agric. For. Meteorol. 2019, 271, 168–179. [Google Scholar] [CrossRef]
  51. Fang, H.Y. Effects of Biochar Application on Carbon Sequestration and Greenhouse Gases Emission in Moso Bamboo Forests. Master’s Thesis, Zhejiang A&F University, Hangzhou, China, 2019. [Google Scholar]
  52. Sonoki, T.; Furukawa, T.; Jindo, K.; Suto, K.; Aoyama, M.; Sánchez-Monedero, M.Á. Influence of Biochar Addition on Methane Metabolism during Thermophilic Phase of Composting. J. Basic Microbiol. 2013, 53, 617–621. [Google Scholar] [CrossRef]
  53. Powers, J.S.; Schlesinger, W.H. Relationships among Soil Carbon Distributions and Biophysical Factors at Nested Spatial Scales in Rain Forests of Northeastern Costa Rica. Geoderma 2002, 109, 165–190. [Google Scholar] [CrossRef]
  54. Liu, Y.X.; Yang, M.; Wu, Y.M.; Wang, H.L.; Chen, Y.X.; Wu, W.X. Reducing CH4 and CO2 Emissions from Waterlogged Paddy Soil with Biochar. J. Soils Sediments 2011, 11, 930–939. [Google Scholar] [CrossRef]
  55. Jia, J.X.; Li, B.; Chen, Z.Z.; Xie, Z.B.; Xiong, Z.Q. Effects of Biochar Application on Vegetable Production and Emissions of N2O and CH4. Soil Sci. Plant Nutr. 2012, 58, 503–509. [Google Scholar] [CrossRef] [Green Version]
  56. Wang, J.Y.; Zhang, M.; Xiong, Z.Q.; Liu, P.L.; Pan, G.X. Effects of Biochar Addition on N2O and CO2 Emissions from Two Paddy Soils. Biol. Fertil. Soils 2011, 47, 887–896. [Google Scholar] [CrossRef]
  57. Troy, S.M.; Lawlor, P.G.; O’Flynn, C.J.; Healy, M.G. Impact of Biochar Addition to Soil on Greenhouse Gas Emissions Following Pig Manure Application. Soil Biol. Biochem. 2013, 60, 173–181. [Google Scholar] [CrossRef] [Green Version]
  58. Kalu, S.; Kulmala, L.; Zrim, J.; Peltokangas, K.; Tammeorg, P.; Rasa, K.; Kitzler, B.; Pihlatie, M.; Karhu, K. Potential of Biochar to Reduce Greenhouse Gas Emissions and Increase Nitrogen Use Efficiency in Boreal Arable Soils in the Long-Term. Front. Environ. Sci. 2022, 10, 1–16. [Google Scholar] [CrossRef]
  59. Epron, D.; Ngao, J.; Granier, A. Interannual Variation of Soil Respiration in a Beech Forest Ecosystem over a Six-Year Study. Ann. For. Sci. 2004, 61, 499–505. [Google Scholar] [CrossRef] [Green Version]
  60. Obia, A.; Cornelissen, G.; Mulder, J.; Dörsch, P. Effect of Soil PH Increase by Biochar on NO, N2O and N2 Production during Denitrification in Acid Soils. PLoS ONE 2015, 10, e0138781. [Google Scholar] [CrossRef]
Figure 1. Location of the study area and the scheme of the experimental approach.
Forests 13 02181 g001
Figure 2. The static chamber for GHG flux measurement.
Forests 13 02181 g002
Figure 3. Effects of various fertilization strategies on soil (a) N2O emission (b) CH4 uptake (c) CO2 emission in the Pleioblastus amarus (Keng) Keng f. plantation. The standard deviation is indicated by vertical bars.
Forests 13 02181 g003
Figure 4. Effects of various fertilization treatments on annual cumulative soil: (a) N2O emission, (b) CH4 uptake, (c) CO2 emission, and (d) global warming potential in the Pleioblastus amarus plantation. The standard deviation is indicated by vertical bars. The letters above the bars denote significance in CK, CFT, CFT, and MFT).
Forests 13 02181 g004
Figure 5. Effects of various fertilization strategies on soil (a) temperature, (b) moisture, (c) pH in the Pleioblastus amarus plantation. The standard deviation is indicated by vertical bars.
Forests 13 02181 g005
Figure 6. Effects of various fertilization strategies on soil (a) microbial biomass C (MBC) and soil (b) water-soluble organic C (WSOC) concentration in the Pleioblastus amarus plantation. The standard deviation is indicated by vertical bars.
Forests 13 02181 g006
Figure 7. Effects of various fertilization strategies on (a) soil NO3-N, soil (b) NH4+- N, soil (c) microbial biomass N (MBN), and soil (d) water-soluble organic N (WSON) concentration in the Pleioblastus amarus plantation. The standard deviation is indicated by vertical bars.
Forests 13 02181 g007
Figure 8. Structural equation modeling illustrating the impacts of soil MBC, WSOC, NO3-N, NH4+-N, WSON, and MBN concentration on (a,d) soil N2O emission, (b,e) CH4 uptake, and (c,f) CO2 emission after applying biochar-based fertilizer treatment (BFT) and chemical fertilizer treatment (CFT). The numbers next to the arrows denote the correlation coefficient and statistical significance. R2 denotes the percentage of variance revealed by SEM, GFI denotes the goodness of fit index, NFI denotes the normed fit index, and CFTI denotes the comparative fit index. Black and red lines denote positive and negative relationships, respectively.
Forests 13 02181 g008
Table 1. The properties of biochar.
PropertiesSurface Area
(m2 g−1)
pHN
(g kg−1)
K
(g kg−1)
P
(g kg−1)
biochar11.49.075.68.60.64
Table 2. Model for stepwise regression analysis between N2O flux (μg m−2 h−1) and soil temperature (T, °C), soil moisture (M, g kg−1), microbial biomass C (MBC, mg kg−1), water-soluble organic C (WSOC, mg kg−1), microbial biomass N (MBN, mg kg−1), water-soluble organic N (WSON, mg kg−1), NO3-N, and NH4+-N under CK, BFT, CFT, and MFF treatments. (The coefficient in the model is standardized.) R2 denotes the percentage of variance revealed by Model.
GHGTreatmentModeldfR2p
N2OCKY = 0.827WSON480.678**
Y = 0.614WSON + 0.342MBN
Y = 0.777MBC
Y = 0.547MBC + 0.486WSON
Y = 0.467MBC + 0.401WSON +0.199MBN
Y = 0.438MBC + 0.470WSON +0.252MBN + 0.164NH4+-N
Y = 0.729T
Y = 0.556T + 0.415MBC
Y = 0.544T + 0.369MBC + 0.207M
Y = 0.607T + 0.408MBC + 0.202M + 0.181NO3-N
480.745**
BFT480.595**
480.777**
480.793**
480.807**
CFT480.521**
480.659**
480.694**
480.714**
Y = 0.638T + 0.250MBC + 0.109M + 0.363NO3-N +0.379MBN480.769**
Y = 0.649T + 0.248MBC + 0.393NO3-N +0.436MBN480.764**
MFTY = 0.857WSON480.729**
Y = 0.710WSON +0.331MBC480.814**
Y = 0.681WSON +0.223MBC + 0.199MBN480.836**
** indicate significance at p < 0.001.
Table 3. Model for stepwise regression analysis between CH4 flux (μg m−2 h−1) and soil temperature (T, °C), soil moisture (M, g kg−1), microbial biomass C (MBC, mg kg−1), water-soluble organic C (WSOC, mg kg−1), microbial biomass N (MBN, mg kg−1), water-soluble organic N (WSON, mg kg−1), NO3-N, and NH4+-N under CK, BFT, CFT, and MFF treatments. (The coefficient in the model is standardized.) R2 denotes the percentage of variance revealed by Model.
GHGTreatmentModeldfR2p
CH4CKY = 0.596WSOC
Y = 0.476WSOC + 0.375WSON
Y = 0.722MBC
Y = 0.464MBC + 0.417WSON
Y = 0.327MBC + 0.481WSON + 0.344WSOC
Y = 0.399MBC + 0.587WSON + 0.325WSOC − 0.278NH4+-N
Y = 0.523MBC + 0.646WSON + 0.255WSOC − 0.391NH4+-N − 0.227M
Y = 0.538T
480.341**
480.458**
BFT480.511**
480.611**
480.716**
480.766**
480.796**
CFT480.274**
Y = 0.529T + 0.402WSOC480.427**
Y = 0.658T + 0.386WSOC + 0.297NO3-N480.490**
Y = 0.630T + 0.326WSOC + 0.103NO3-N +0.350MBN 480.557**
MFTY = 0.570WSON480.310**
Y = 0.561WSON + 0.495WSOC480.550**
Y = 0.836WSON + 0.487WSOC + 0.120NH4+-N480.648**
** indicate significance at p < 0.001.
Table 4. Model for stepwise regression analysis between CO2 flux (mg m−2 h−1) and soil temperature (T, °C), soil moisture (M, g kg−1), microbial biomass C (MBC, mg kg−1), water-soluble organic C (WSOC, mg kg−1), microbial biomass N (MBN, mg kg−1), water-soluble organic N (WSON, mg kg−1), NO3-N, and NH4+-N under CK, BFT, CFT, and MFF treatments. (The coefficient in the model is standardized.) R2 denotes the percentage of variance revealed by Model.
GHGTreatmentModeldfR2p
CO2CKY = 0.942T
Y = 1.028T−0.200NO3-N
Y = 0.982T−0.198NO3-N +0.116WSOC
Y = 0.920T
Y = 0.772T + 0.272MBC
Y = 0.637T + 0.216MBC + 0.209WSON
Y = 0.667T + 0.206MBC + 0.266WSON−0.160NO3-N
Y = 0.900T
480.885**
480.916**
480.927**
BFT480.844**
480.895**
480.907**
480.927**
CFT480.806**
Y = 0.868T + 0.212M480.847**
Y = 0.862T + 0.224M + 0.177WSOC480.877**
Y = 0.941T + 0.226M + 0.166WSOC + 0.182NO3-N480.904**
Y = 0.934T + 0.149M + 0.122WSOC + 0.317NO3-N +0.230MBC480.930**
MFTY = 0.966T480.932**
Y = 0.934T + 0.135M480.948**
Y = 0.984T + 0.136M + 0.085NO3-N480.952**
Y = 0.951T + 0.127M + 0.103NO3-N +0.083NH4+-N480.956**
** indicate significance at p < 0.001.
Publisher’s Note: MDPI stays neutral with regard to jurisdictional claims in published maps and institutional affiliations.

