
Population Genetics and Development of a Core Collection from Elite Germplasms of Xanthoceras sorbifolium Based on Genome-Wide SNPs

1
College of Forestry, Gansu Agriculture University, Lanzhou 753200, China
2
State Key Laboratory of Seedling Bioengineering, Ningxia Forestry Institute, Yinchuan 750001, China
*
Author to whom correspondence should be addressed.
Forests 2022, 13(2), 338; https://doi.org/10.3390/f13020338
Submission received: 30 December 2021
/
Revised: 13 February 2022
/
Accepted: 16 February 2022
/
Published: 18 February 2022
(This article belongs to the Special Issue Advances in Woody Oil Species: Past, Present and Future)
Abstract
:Xanthoceras sorbifolium is one of the most important species of woody oil. In this study, whole genome re-sequencing of 119 X. sorbifolium germplasms was conducted and, after filtering, 105,685,557 high-quality SNPs were identified, which were used to perform population genetics and core collection development analyses. The results from the phylogenetic, population structure, and principal component analyses showed a high level of agreement, with 119 germplasms being classified into three main groups. The germplasms were not completely classified based on their geographical origins and flower colors; furthermore, the genetic backgrounds of these germplasms were complex and diverse. The average polymorphsim information content (PIC) values for the three inferred groups clustered by structure analysis and the six classified color groups were 0.2445 and 0.2628, respectively, indicating a low to medium informative degree of genetic diversity. Moreover, a core collection containing 29.4% (35) out of the 119 X. sorbifolium germplasms was established. Our results revealed the genetic diversity and structure of X. sorbifolium germplasms, and the development of a core collection will be useful for the efficient improvement of breeding programs and genome-wide association studies.
1. Introduction
Xanthoceras sorbifolium is a deciduous shrub or small tree that belongs to the Sapindaceae family and the monotypic genus Xanthoceras, and is widely distributed in arid and semiarid regions in northern China. The geographic distribution of X. sorbifolium in China spans from 28°34′ N to 47°20′ N in latitude and from 73°20′ E to 120°25′ E in longitude. It is found in North China, East China and the Northwest of China, including Beijing, Hebei, Inner Mongolia, Liaoning, Shanxi, Shaanxi, Shandong, Henan, Anhui, Gansu, Ningxia, Qinghai, Xinjiang, and Tibet, in 14 provinces (municipalities and autonomous regions) in total. The Inner Mongolia, Hebei, Henan, Shanxi, Shaanxi, and Gansu provinces have the most planted resources [1] (Figure 1a). It is widely adaptable to various growth conditions, such as drought, low temperature, salt, alkali, and other conditions [2,3]. It is one of the most important species of woody oil [4]. The oil content of its seed kernel can be as high as 67%, of which 85–93% is unsaturated fatty acids, including 37.1–46.2% linoleic acid and 28.6–37.1% oleic acid, which are essential dietary fatty acids [5]. Notably, an essential nutrient for brain growth and maintenance, nervonic acid, which is rarely contained in plants, can account for as much as 3.04% of the seed oil of X. sorbifolium [6]. The species is also known for possessing functional ingredients used in traditional Chinese medicines, due to its diverse bioactive compounds [7]. For example, xanthoceraside, which is extracted from the husks of X. sorbifolium, has been reported to have antitumor effects and the potential to treat Alzheimer’s disease [8,9].
In addition, this species is also an important plant for urban landscapes in northern China due to its beautiful shape, with a wide crown, long flowering duration, and colorful flowers [10,11]. Due to its high oil content and important economic value, it has received increased scientific and conservation attention, and special support has been provided by the Chinese government to aid the development of X. sorbifolium. At least 5 × 10⁵ ha of X. sorbifolium have been cultivated, up to the year 2020 [12]. Due to its wide distribution and growth in a range of environmental conditions, as well as long-term extensive cross-pollination, there is abundant phenotypic variation and diversity in X. sorbifolium, providing abundant resources for further breeding. More than 40 varieties have been registered over the last five years, and there are still many new strains and plus trees to be explored. The collection and preservation of germplasms of X. sorbifolium has also been carried out by researchers [13]. Screening large germplasm collections for traits of interest is laborious and costly. Establishing core collections, which represent the diversity of the whole collection, makes screening more practical [14]. In order to understand the genetic diversity and establish a core collection of X. sorbifolium, morphological traits and molecular marker techniques, i.e., random amplified polymorphic DNA (RAPD), restriction fragment length polymorphism (RFLP), inter-simple sequence repeats (ISSR), and simple sequence repeats (SSR) markers have been applied [15,16,17,18,19,20,21,22]. However, single nucleotide polymorphisms have been less frequently applied in X. sorbifolium.
SNPs have the characteristics of a ubiquitous presence, uniform distribution, high heritability, and bi-allelic nature, which make them a widely accepted molecular marker for use in high-throughput screening [23]. SNPs are the best choice for genomic studies and have been widely used for studying the population structure and genetic diversity of germplasms [24,25,26,27,28]. A comparative study between SNPs and SSRs for studying population structure and genetic diversity showed that SNPs can be a more valuable tool for genomics approaches and crop improvement [23]. In 2019, the complete genomic sequences and annotation information of X. sorbifolium were released, which provide a valuable dataset for genetic and molecular research on this species [29,30]. In this study, the whole genome re-sequencing of 119 germplasms was conducted, the genetic diversity and structure of X. sorbifolium germplasms were analyzed, and the core germplasms were selected using the genome-wide SNP set. The objectives of this work were to (1) to estimate the levels of genetic diversity and population structure of the X. sorbifolium germplasms; (2) to create a core collection that captures the species’ whole genetic diversity; (3) to provide groundwork for future genomic selection in X. sorbifolium breeding programs and genome-wide association studies.
2. Materials and Methods
2.1. Plant Materials
In total, 119 elite germplasms (Table S1) of X. sorbifolium were obtained from the germplasm plot of X. sorbifolium in Yinchuan Botanical Garden (Yingchuan, Ningxia, China; coordinates: 38°28′ N, 106°16′ E), with these germplasms being collected from the planted populations of the main planted area of X. sorbifolium and primarily comprising registered new cultivars, improved cultivar, strains, and plus trees (Figure 1a). The origin of some germplasms show in Table S1 may not represent their actual origin, because in the long-term selection process, germplasms from different provinces were introduced or exchanged. These 119 germplasms were also classified into six groups on the basis of five different flower colors and one double flower group (the white-flowered group contains 42 germplasms(35.29%), the compound-flowered group contains 46 germplasms (38.66%), the red-flowered group contains 16 germplasms (13.45%), the pink-flowered group contains 9 germplasms (7.56%), the yellow-and pink-flowered group contains 4 germplasms (3.36%), and the double-flowered group contains 2 germplasms (1.68%)).
2.2. DNA Extraction and Genotyping
Fresh, healthy leaves from each germplasm were sampled, frozen in liquid nitrogen immediately and stored at −80 °C until DNA extraction. Genomic DNA was extracted using a CTAB (cetrimonium bromide) method. The concentration and quality of the total genomic DNA were measured using a NanoDrop Spectrophotometer. DNA libraries for Illumina sequencing were constructed and re-sequencing was carried out on an Illumina HiSeq XTen platform by a commercial service (Biomarker Technologies, Beijing, China), with 150-bp read lengths used.
Raw reads were filtered based on the following criteria: (1) removing reads containing adapter; (2) removing reads with an N content exceeding 10% (3) removing reads in which more than 50% of the bases had Phred quality scores less than 10. The published genome sequence of X. sorbifolium [29] was used as a reference genome. Sequence alignment was performed between the re-sequencing data and the reference genome using BWA software [31]. SNP calling was performed using Genome Analysis Toolkit (GATK) software [32]. Duplicate reads were removed using Picard Tools [33]. All SNPs were called using the HaplotypeCaller module in GATK and were filtered with the following parameters: QD < 2.0||FS > 60.0||MQ < 40.0||QUAL < 30.0|| clusterSize 2-clusterWindowSize 5; SNPs with a minor allele frequency (MAF) lower than 5% andintegrity lower than 0.8 in the germplasm were discarded. As the linkage disequilibrium (LD) of this species decayed rapidly (Figure S1), we did not further filter SNPs according to LD [34]. SNP annotation was performed using snpEff software [35].
2.3. Phylogenetic and Population Structure Analysis
To analyze the phylogenetic relationships of the 119 germplasms, an unrooted phylogenetic tree was constructed using the neighbor-joining method with the Kimura 2-parameter model in MEGA X software [36], with 1000 bootstrap replicates used. Population structure was examined using ADMIXTURE [37]. The number of populations (K) was set from 1 to 10, and the K optimum was selected based on the cross-validation error compared to other K values. Principal component analysis (PCA) was performed using the EIGENSOFT software package [38].
2.4. Genetic Diversity Analysis
Assessments of genetic diversity, including minor allele frequency (MAF), expected allele number (Ne), expected heterozygous number (He), Nei diversity index (H), number of polymarkers (A), observed allele number (Na), observed heterozygous number (Ho), polymorphism information content (PIC), and Shannon–Wiener index (I) were calculated based on the whole-genome SNP data using calculation scripts developed by Biomarker Technologies Corporation.
2.5. Core Collection Establishment and Evaluation
Core Hunter is a multi-purpose core subset selection tool that uses local search algorithms to generate subsets relying on one or more metrics, including several distance metrics and allele richness [39]. Core Hunter II software was used to establish a core collection according to the SNP data which, with high diversity, maximally represented the individual accessions from the entire collection. Comparisons of genetic diversity, allele percentages, MAFs, and PCA between the entire collection and the core collection were performed to evaluate the core collection.
3. Results
3.1. Sequencing of X. sorbifolium among 119 Elite Germplasms
The sequence information on the genomes of 119 elite germplasms of X. sorbifolium is shown in Table S2. We obtained 916,477,939 clean reads, and the Q30 reached 93.37%, while the GC content was 35.89%. We performed sequence alignment against the reference genome. The average mapping rate was 97.95%, the average coverage depth was 3×, and average coverage was 81.11%. Finally, 105,685,557 high-quality SNPs (Table S3) were identified, which were used to perform the following analyses. Among these high-quality SNPs, the number of SNPs belonging to base transitions (73,971,318) was 2.33 times the number of SNPs belonging to base transversions (31,714,239), indicating that most of the SNPs were of the base transition type; The average SNP heterozygosity ratio was 38.67%.
3.2. Phylogenetic Analysis
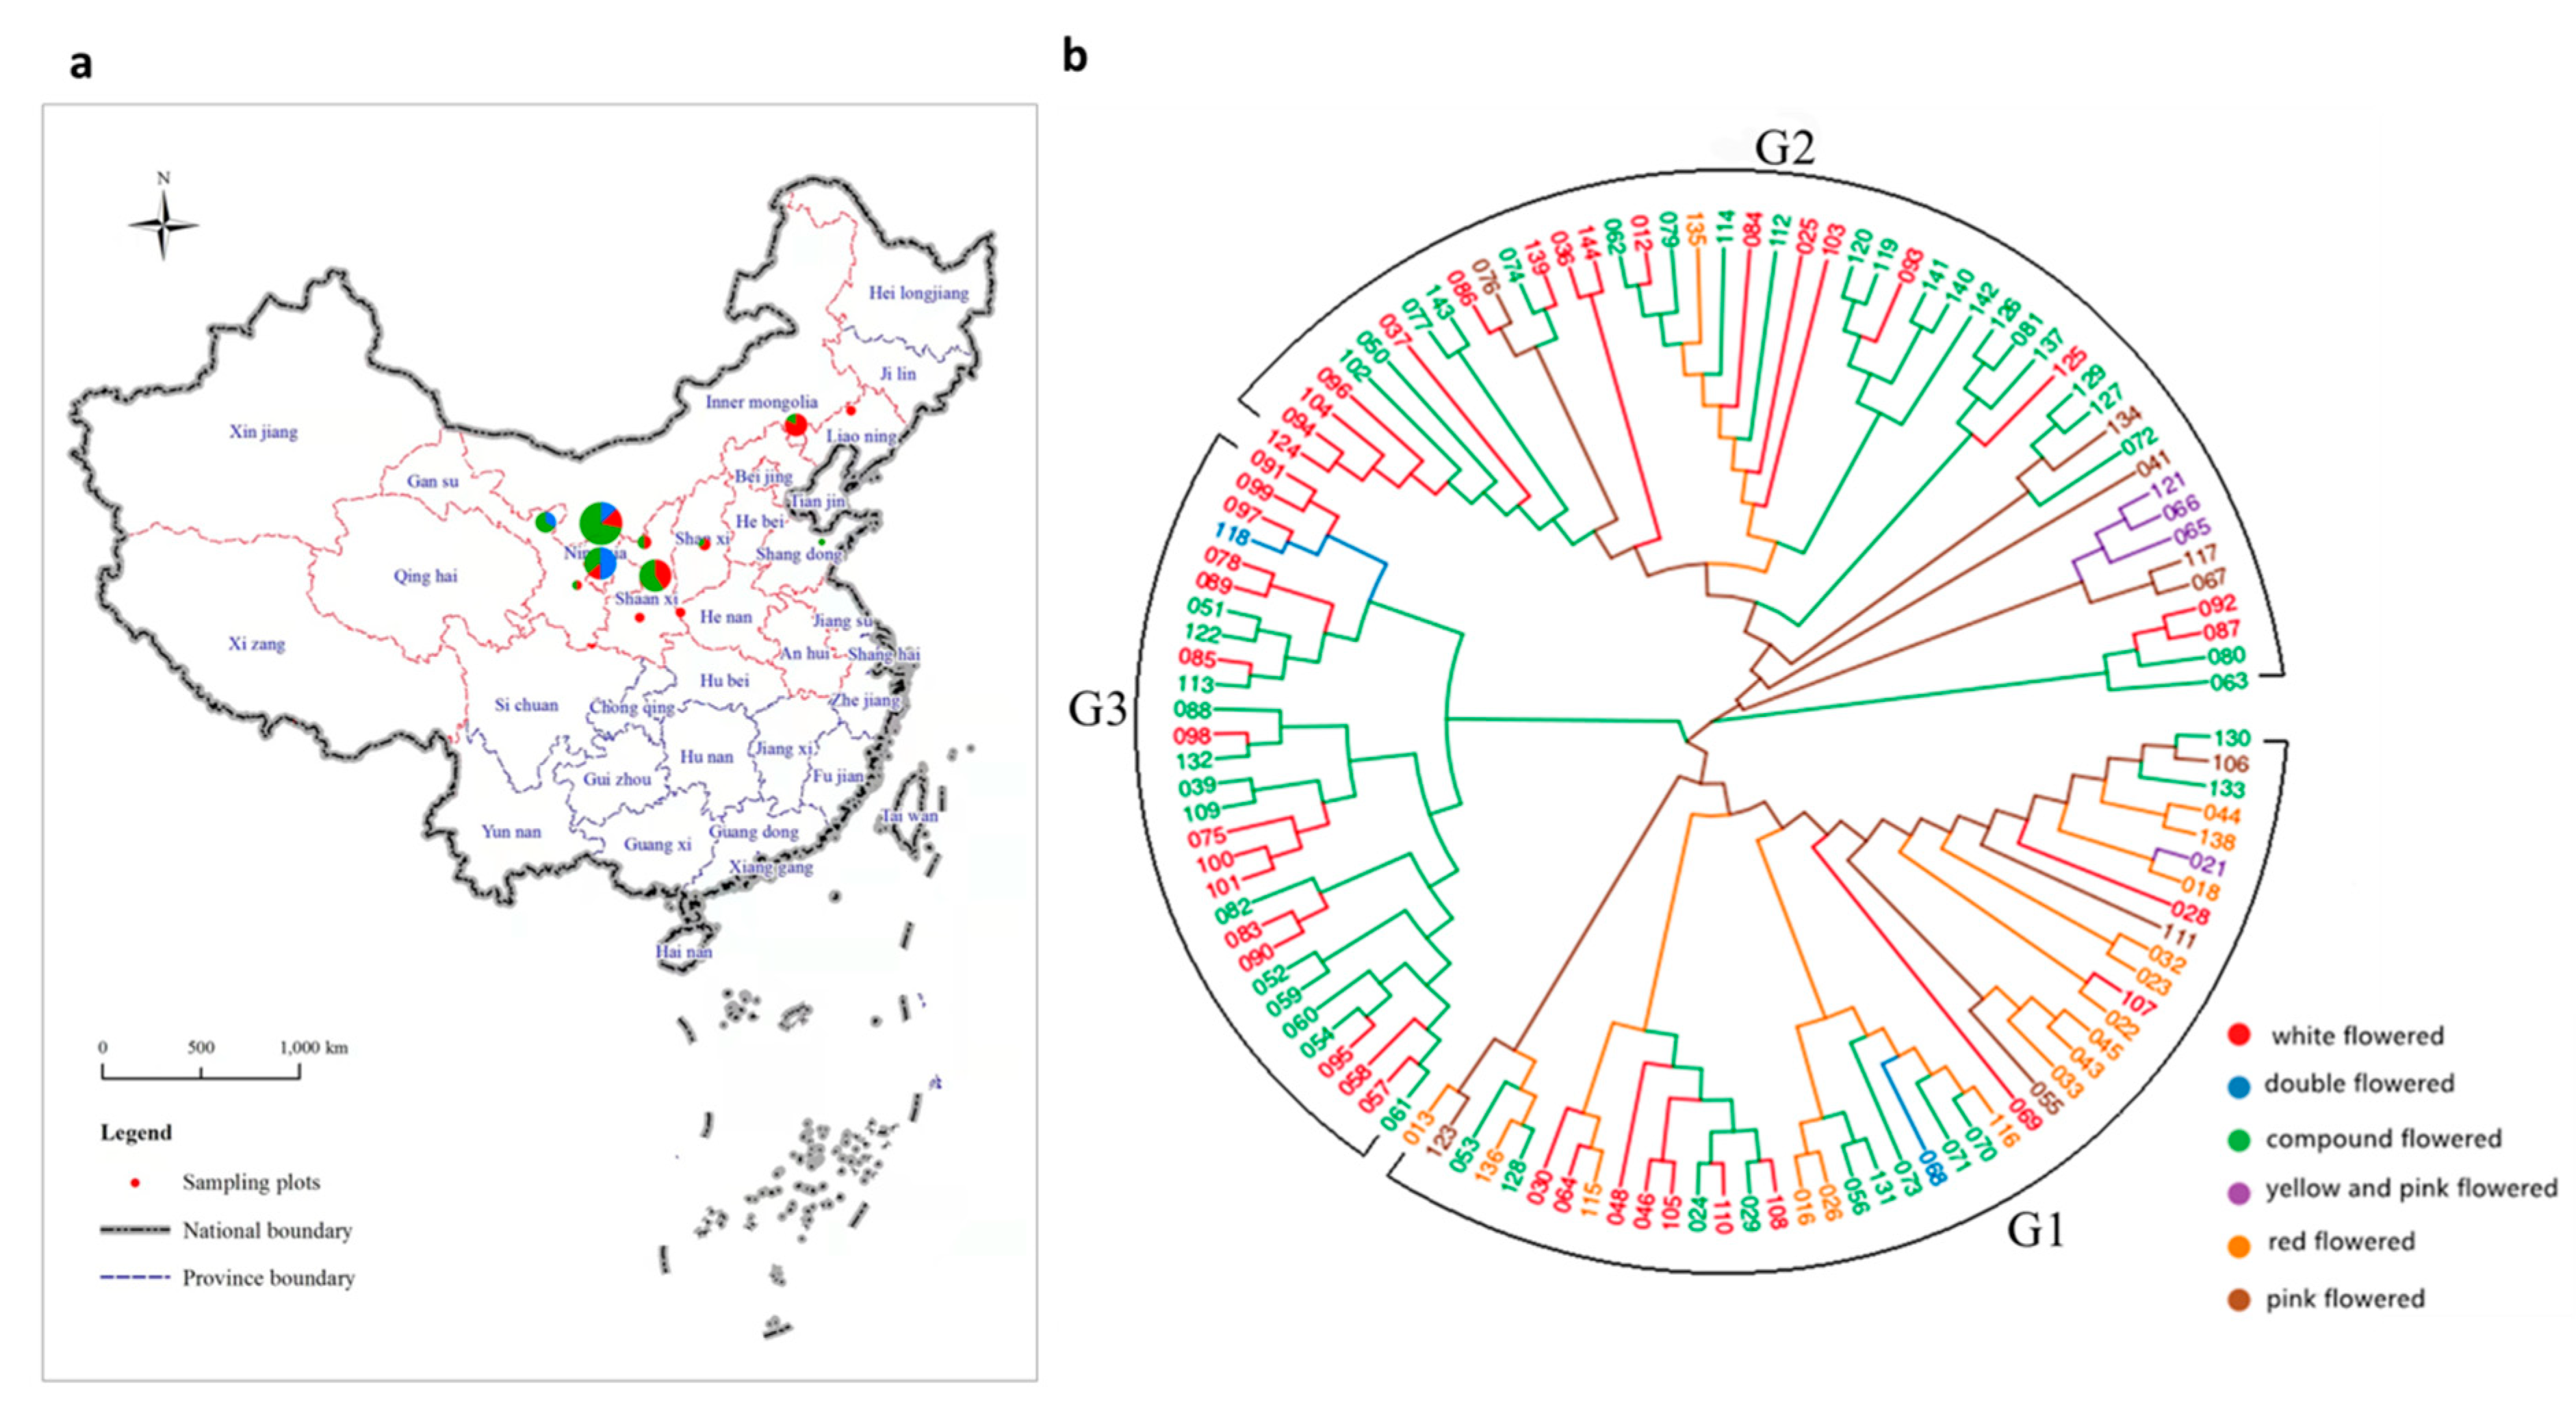
Using the SNP set, a neighbor-joining analysis was performed, and the 119 germplasms were classified into three main groups, designated as groups G1, G2 and G3 (Figure 1b). The distribution of the different flower colors of the X. sorbifolium germplasms in the inferred groups is shown in Table S6. The first main group (G1) included 42 germplasms, consisting of 10 white-flowered, 11 compound-flowered, 15 red-flowered, 4 pink-flowered, 1 yellow- and pink-flowered, and 1 double flowered germplasm. The second main group (G2) included 48 germplasms, consisting of 17 white-flowered, 22 compound-flowered, 1 red-flowered, 5 pink-flowered and 3 yellow- and pink-flowered germplasms. The third main group (G3) included 29 germplasms, consisting of 15 white-flowered, 13 compound-flowered, and 1 double flowered germplasm. The red-flowered germplasms were mainly distributed in G1; the yellow- and pink-flowered germplasms were mainly distributed in G2; the pink-flowered germplasms were mainly distributed in G2 and G3. The white-flowered and compound-flowered germplasms were distributed among the three main groups. From a geographic origin perspective, some of the germplasms from the same geographic origin clustered in the same group (Table S7), e.g., the germplasms from Wuzhong, Ningxia and Minqin, Gansu were clustered in G1; germplasms from Chifeng, Inner Mongolia and other regions were clustered in G2. However, the germplasms from Fuxian, Shaanxi were distributed in G2 and G3, and the germplasms from Yinchuan, Ningxia were distributed across the three cluster groups. This shows that the three groups classified by phylogenetic analysis contained germplasms from different geographical locations.
3.3. Population Structure Analysis
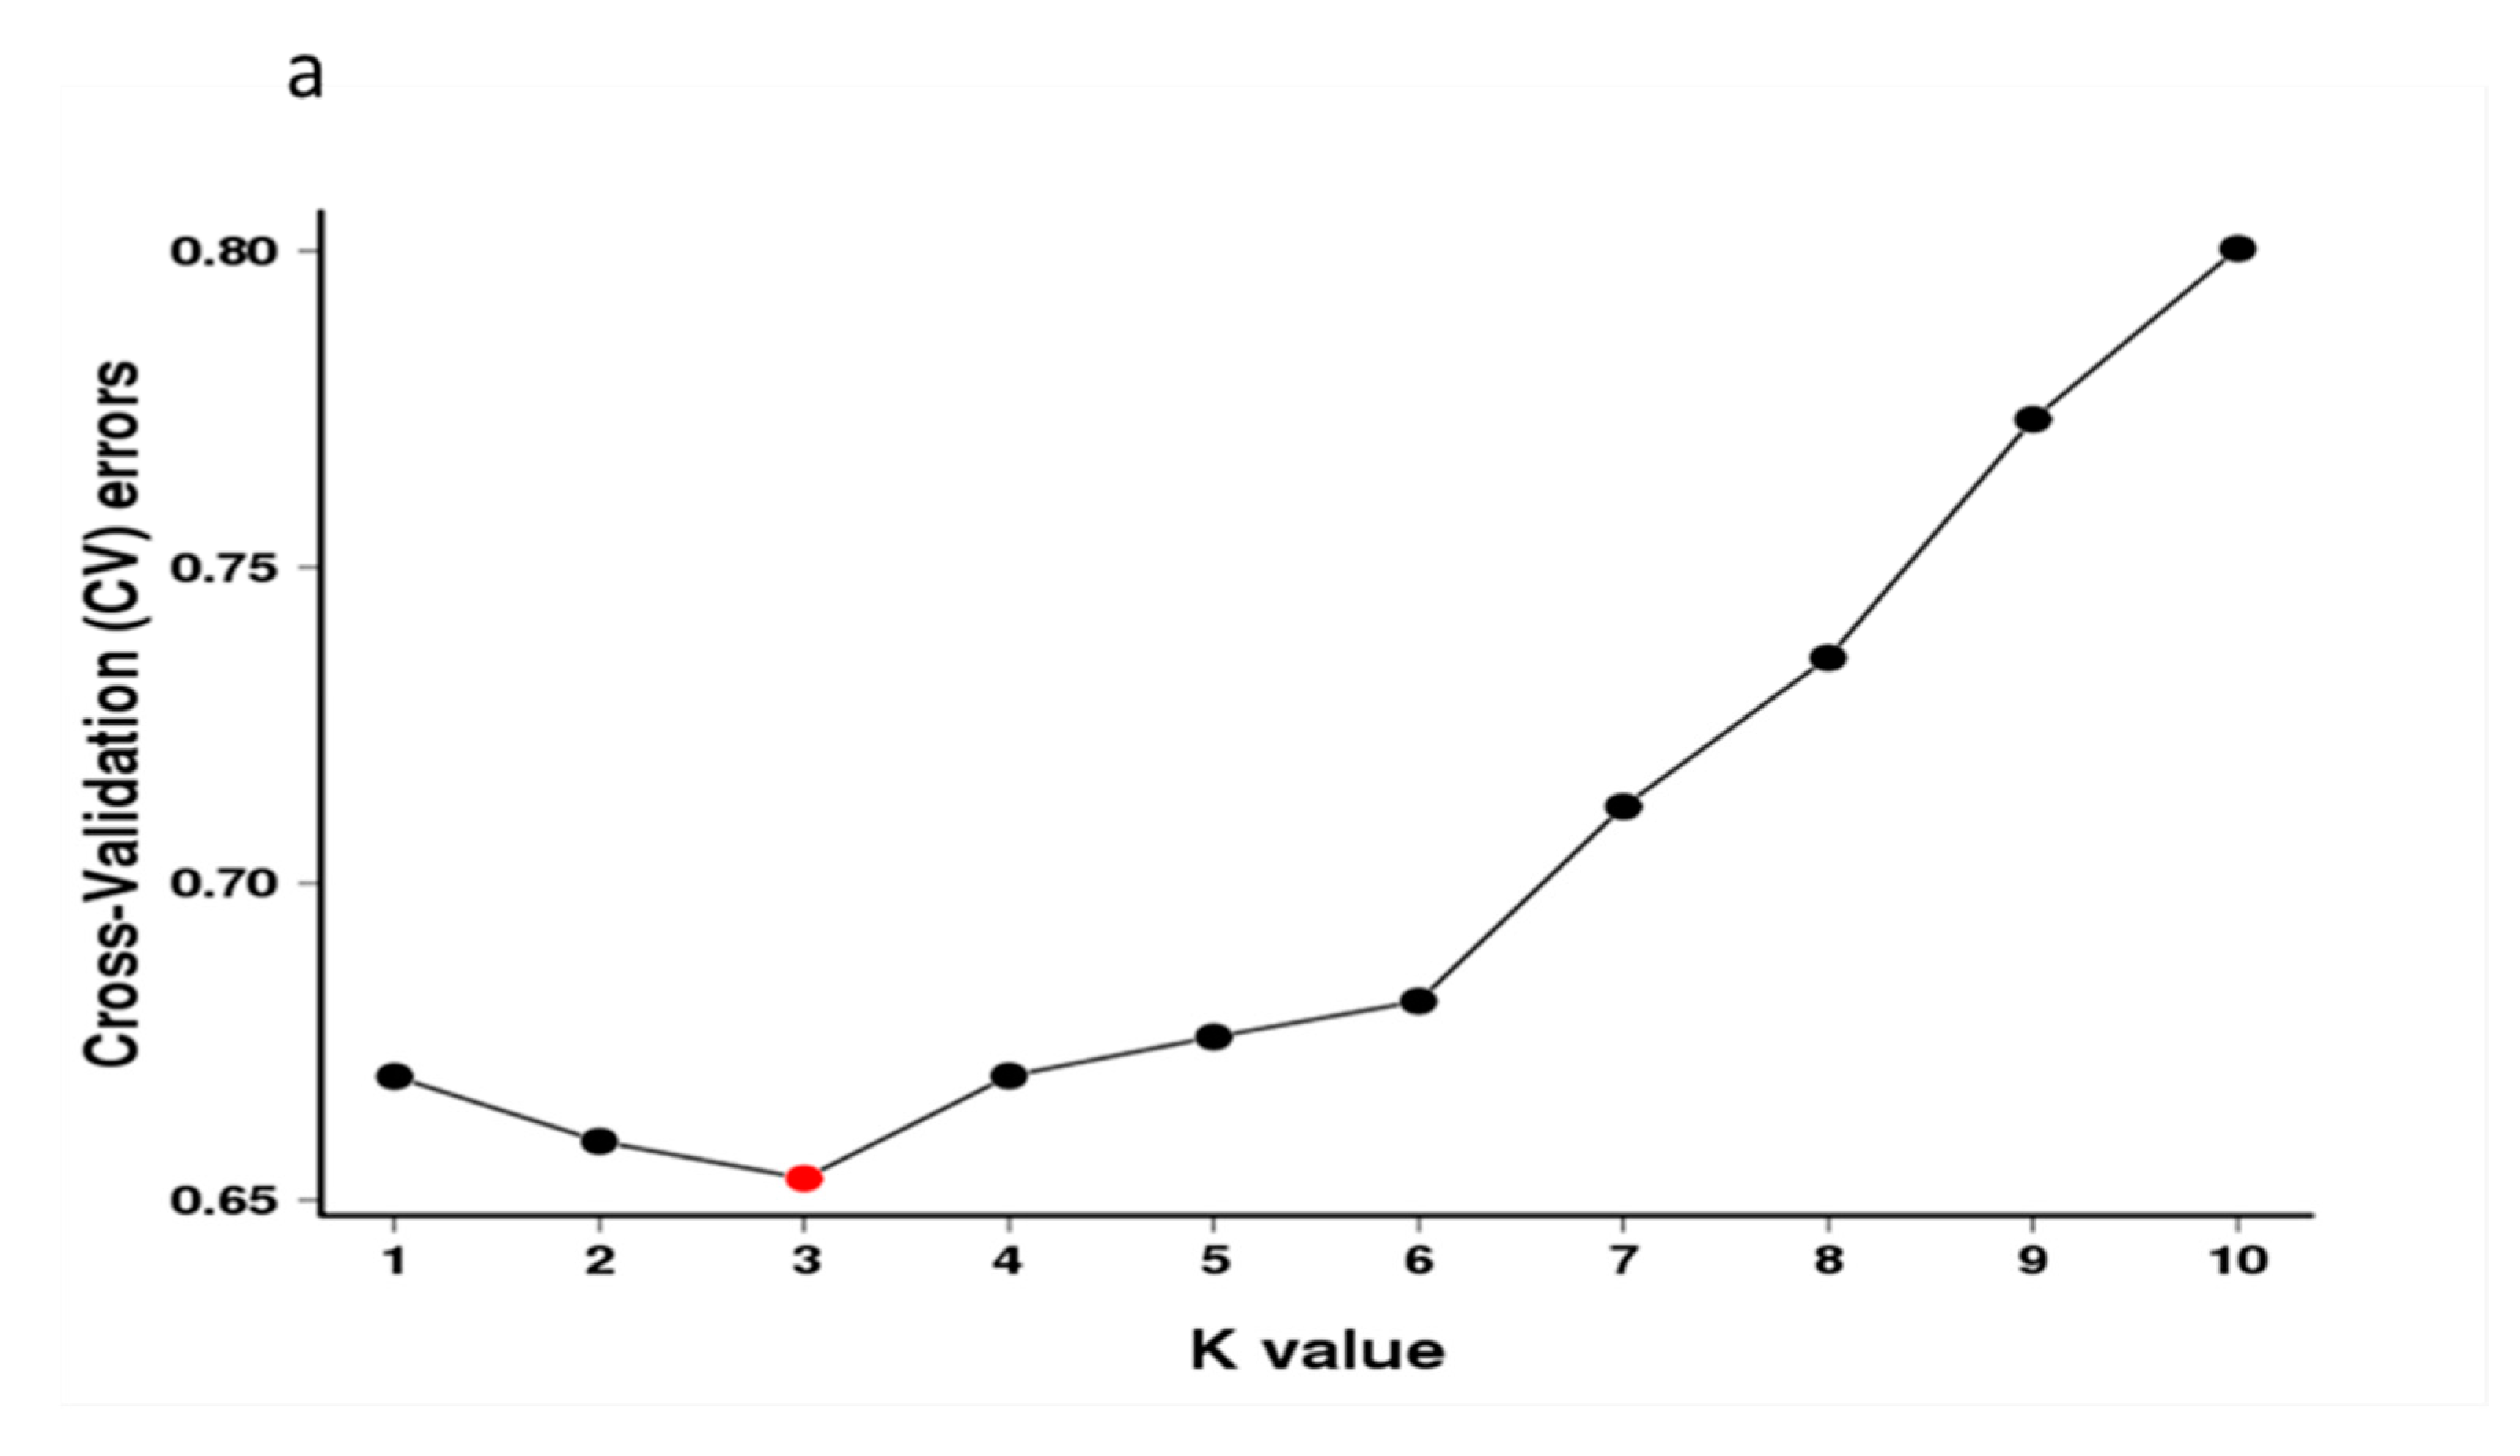
Population structure analysis revealed that three subgroup clusters (K = 3) represented the optimal model (Figure 2a,b). The correspondence subgroups of the 119 germplasms are described in Table S4. The three subgroups were designated as Q1, Q2, and Q3 (indicated in blue, red, and green, respectively, in Figure 2b), which consisted of 19, 38, and 62 germplasms, respectively. Admixture occurred between clusters, indicating that there was a certain degree of gene exchange among the populations. The concordance between the phylogenetic analysis and structure results was observed to be 68.07% (Table S8). The 19 germplasms of Q1 all corresponded to G1; 35 out of 38 germplasms of Q2 corresponded to G2; 29 out of 62 germplasms of Q3 corresponded to G3. The test germplasms were not completely clustered according to their flower color, especially the white-flowered and compound-flowered germplasms, which is consistent with the results of phylogenetic analysis (Table S6). In the population structure analysis, the germplasms from Yinchuan, Ningxia were also more scattered than others, which could be clearly visualized in Q1, Q2, and Q3, indicating that the genetic backgrounds of these germplasms were more complex and diverse (Table S7).
3.4. Principal Component Analysis
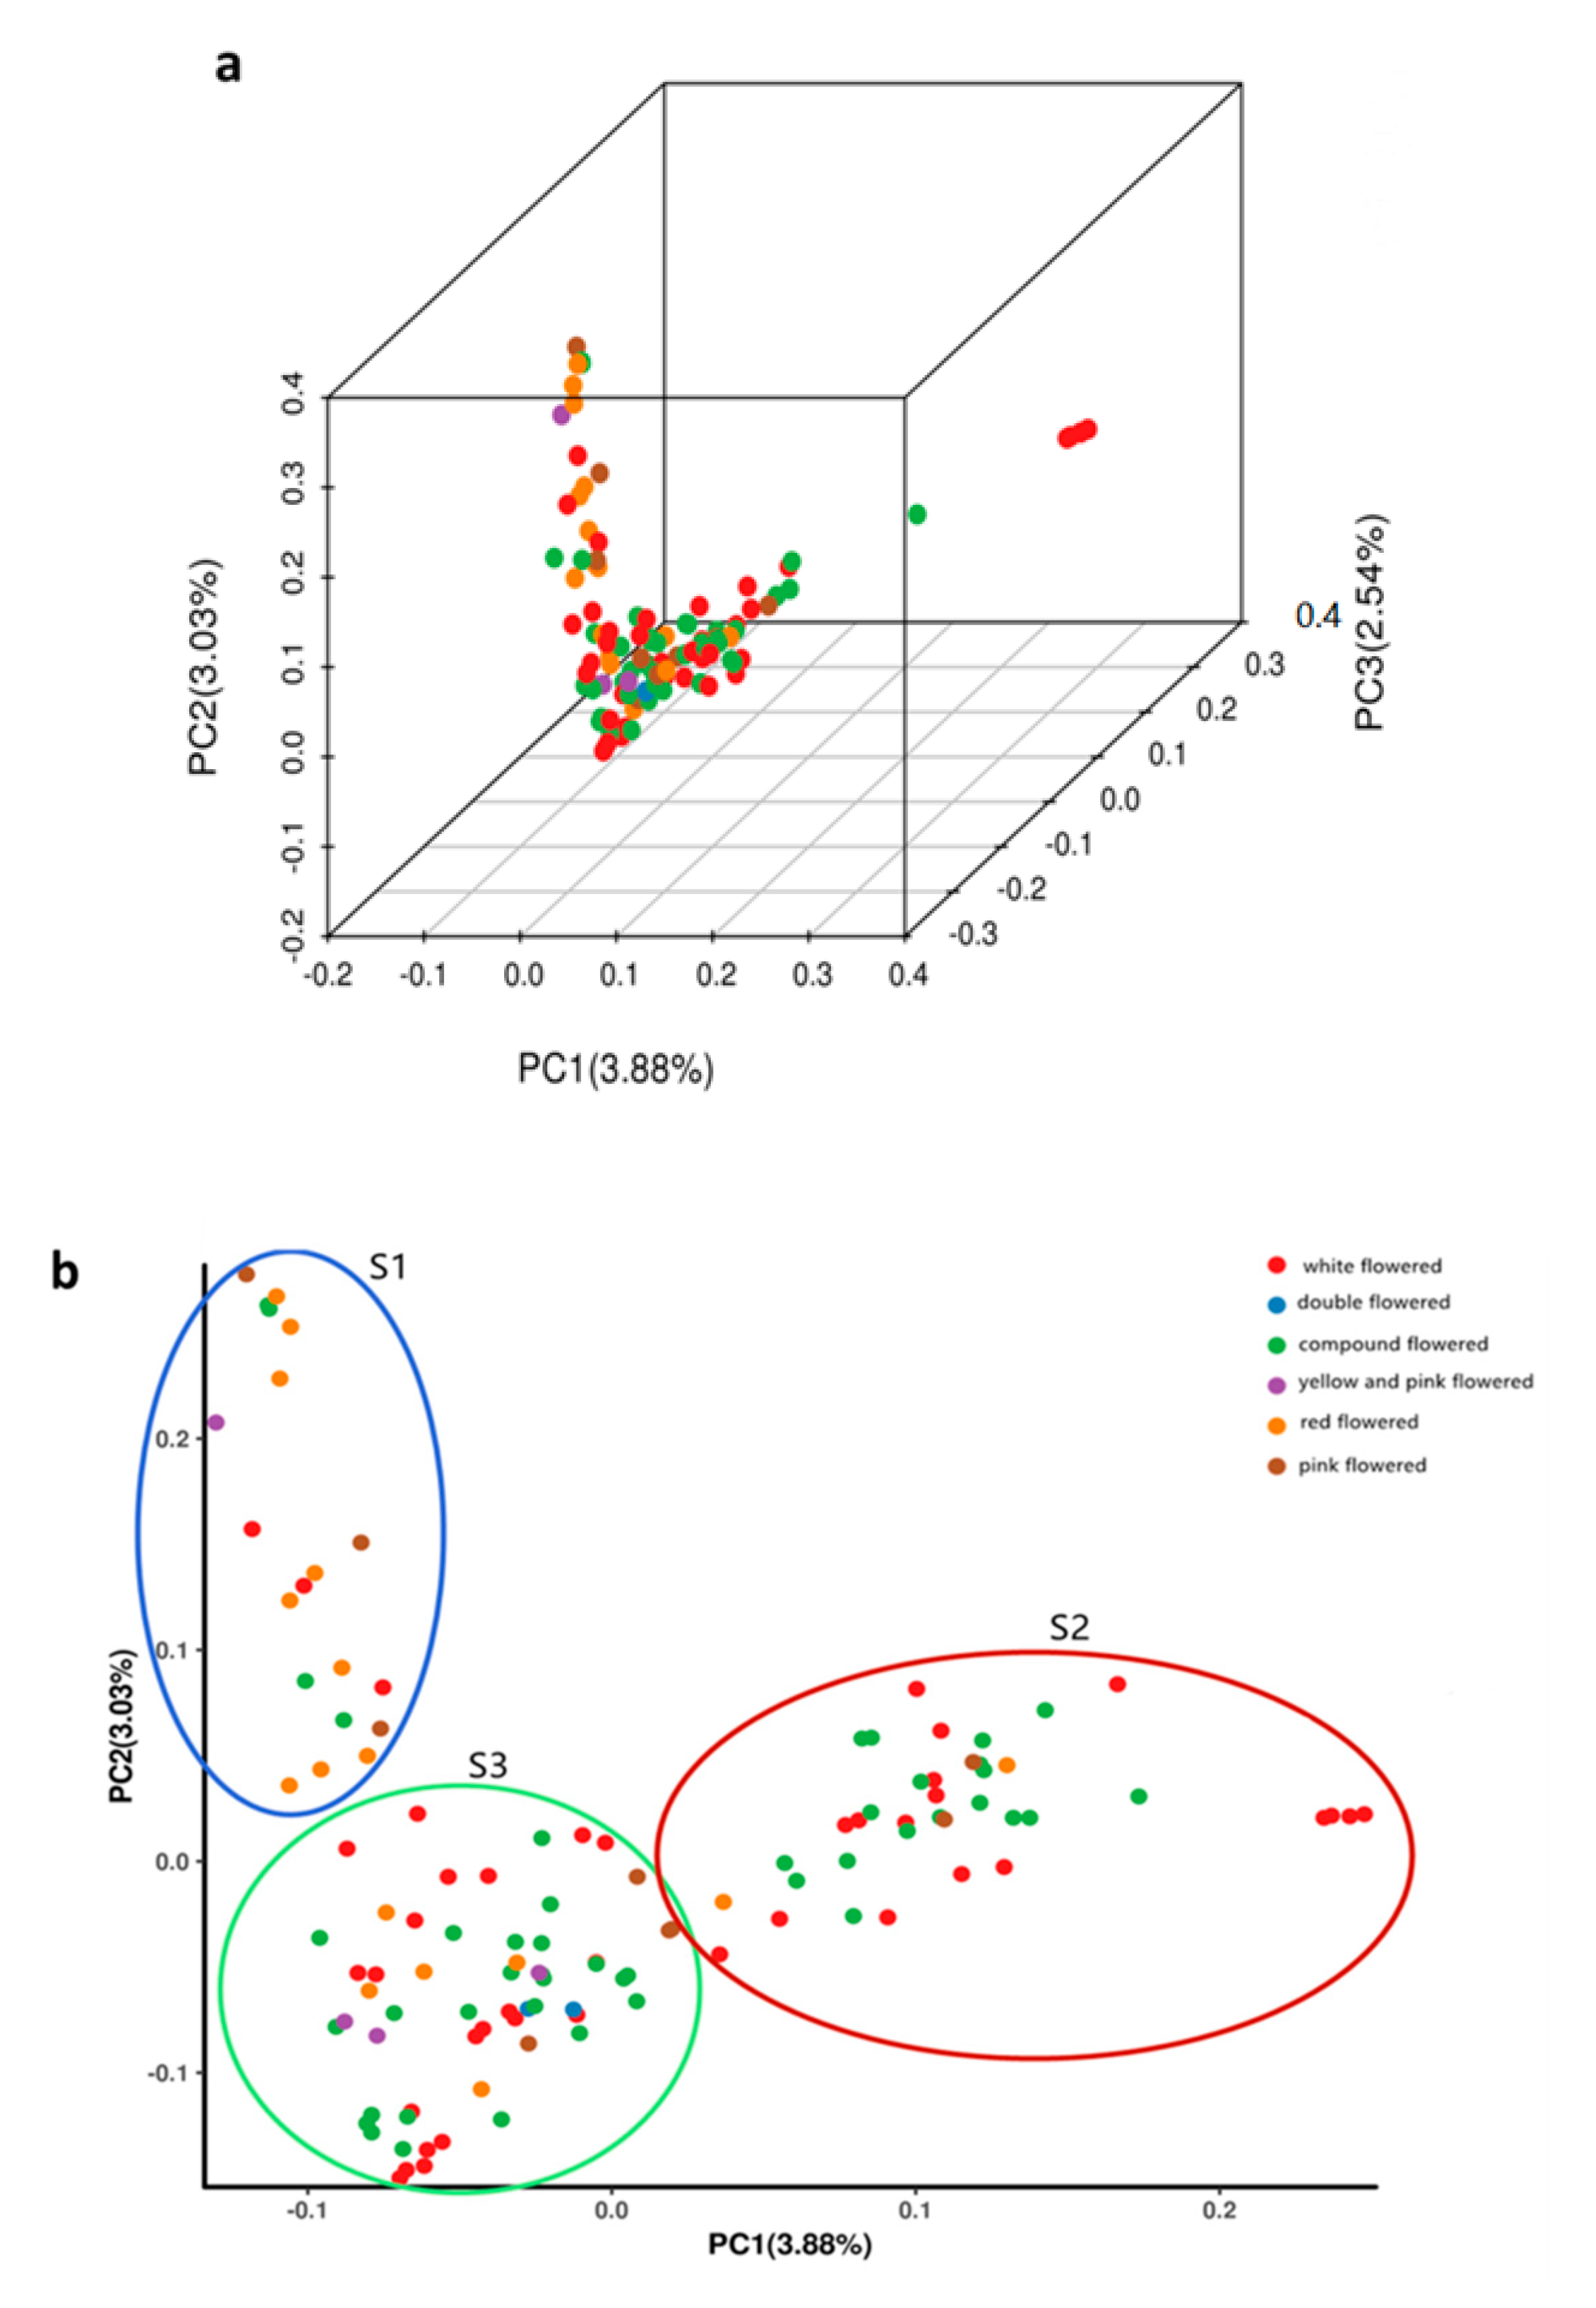
Principal component analysis (PCA) was performed using the data of the SNPs identified in the 119 X. sorbifolium germplasms (Figure 3, Table S5). A three-dimensional graph based on the value of each sample in the first (PC1), second (PC2), and third (PC3) principal components is shown in Figure 3a. The first, second, and third principal components explained 3.88%, 3.03%, and 2.54% of the total variance, respectively. The first two PCs (PC1 and PC2) clustered the 119 germplasms into three clusters (Figure 3b), designated as S1, S2, and S3, which consisted of 20, 40, and 59 germplasms, respectively. This result was very consistent with the structure analysis, and the percent concordance was as high as 93.25% (Table S8). The germplasms were not completely clustered according to their color of flower, and each of the three clusters contained X. sorbifolium germplasms from different geographical locations (Tables S6 and S7). These results further confirmed the results of the phylogenetic analysis and population structure analysis.
3.5. Genetic Diversity Analysis
A summary of the genetic diversity of the inferred groups, which were clustered by population structure, and the genetic diversity of the inferred groups, which were classified by the flower color, is shown in Table 1. The MAF, expected allele numbers (Ne), expected heterozygous numbers (He), Nei diversity index (H), observed heterozygous numbers (Ho), PIC values, and the Shannon–Wiener index (I) for Q1 were the highest and for Q3 were the lowest among the three subgroups. Taken together, these results suggested that Q1 had the highest genetic diversity among the three subgroups, and Q3 showed the lowest genetic diversity. According to these genetic diversity parameters, the double-flowered group showed the highest genetic diversity among the six groups, and the second- and third-highest genetic diversity was among the yellow- and pink-flowered group, and red-flowered group, respectively. The pink-flowered group and white-flowered group were the fourth and fifth, respectively, and the compound-flowered group showed the lowest genetic diversity.
The results for the genetic diversity of the three inferred population structure groups and six classified color groups were consistent. The genetic diversity of Q1 was the highest among the three subgroups, and Q1 mainly consisted of red-flowered germplasms, which had higher diversity; Q3 had the lowest genetic diversity among the three subgroups, and Q3 mainly consisted of white-flowered and compound-flowered germplasms, with these two color groups having the lowest genetic diversity.
3.6. Core Collection Establishment and Evaluation
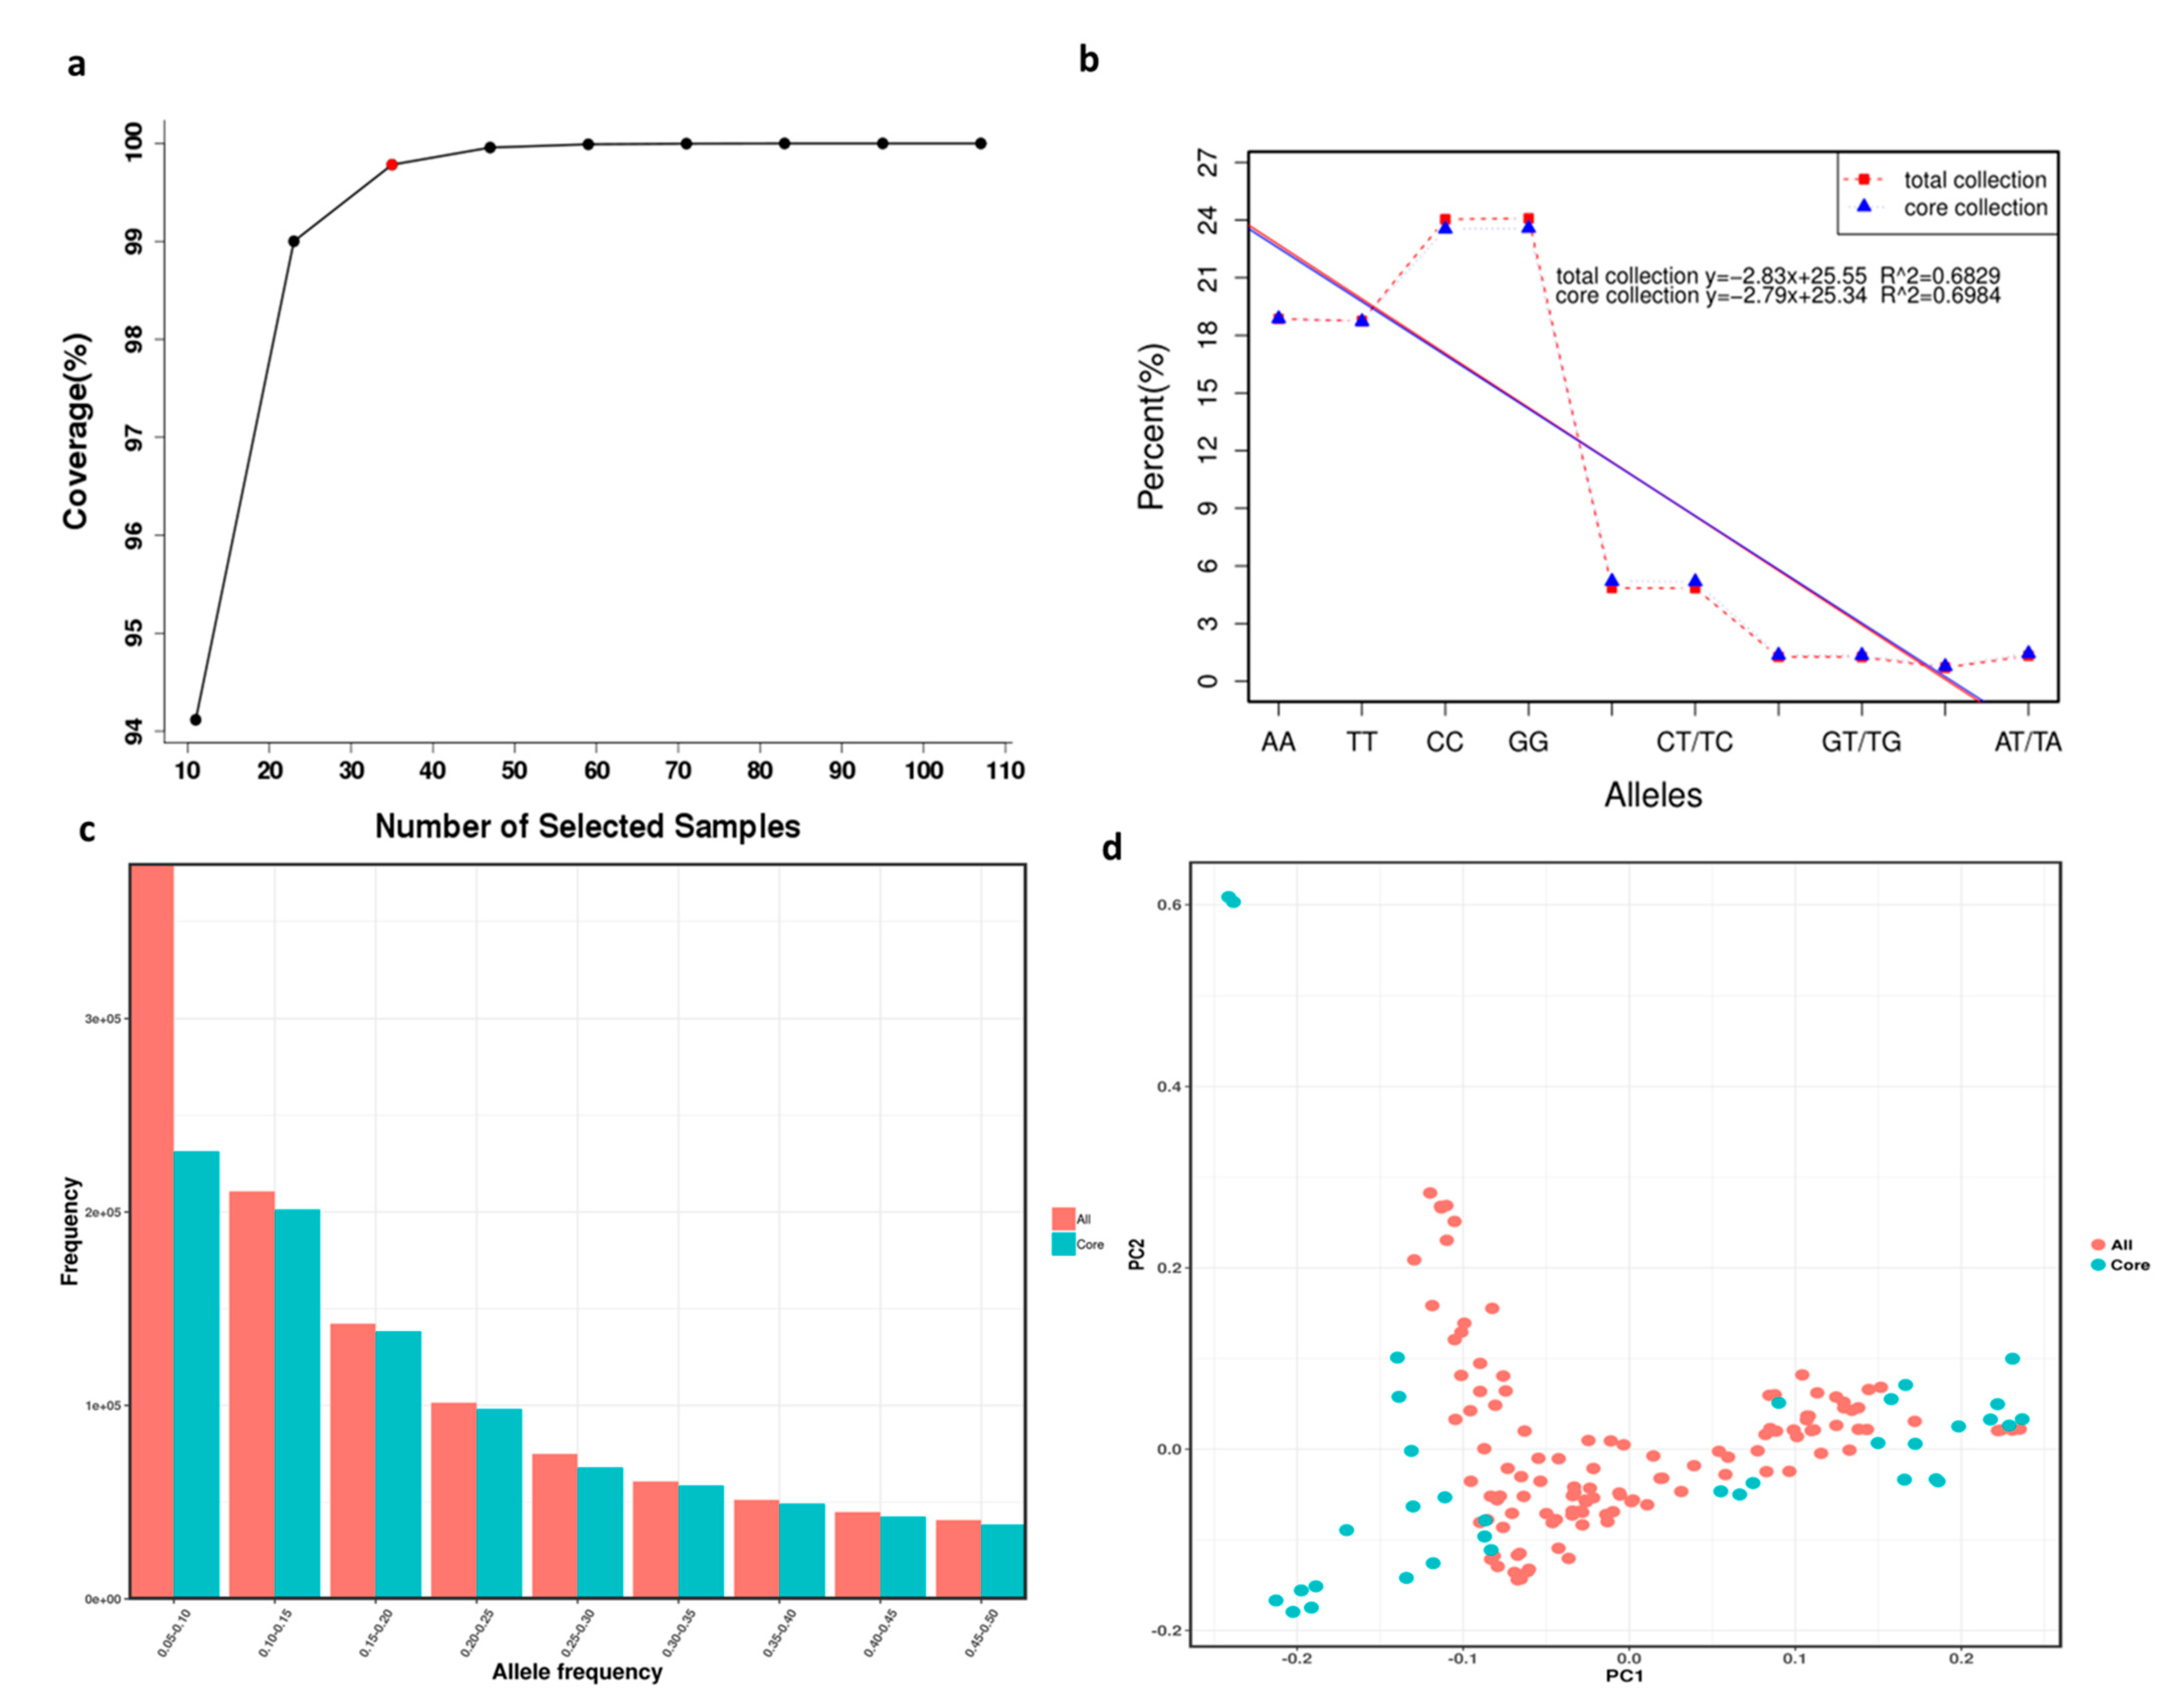
Combined with the modified Rogers’ distance (0.7) and the Shannon diversity index (0.3), screening was conducted according to the total proportion of germplasm resources at 0.1, 0.2, 0.3, 0.4, 0.5, 0.6, 0.7, 0.8, and 0.9 gradients. Finally, a core collection containing 29.4% (35) out of the 119 X. sorbifolium germplasms was established using Core Hunter software (Table S9). Furthermore, the gene coverage of the core collection was 99.7% (Figure 4a). The core collection included 3 red-flowered germplasms, 10 white-flowered germplasms, 18 compound-flowered germplasms, 1 yellow- and pink-flowered germplasm, and 3 pink-flowered germplasms.
Ten allele types were produced, of which four alleles were homozygous and six were heterozygous (Table S10). Comparisons of the numbers and percentages of the ten allele types generated in the total collection and core collection are shown in Table S9 and Figure 4b, and the comparison of the MAFs in the total collection and core collection is shown in Figure 4c. The results showed that almost all alleles were present in the core collection, and the MAFs of the total collection and core collection had few differences, which indicated that the selections for the core collection were accurate and rational. Principal component analysis (PCA) was employed for the core collection and total collection in order to evaluate the accuracy of germplasm screening (Table S8, Figure 4d). The PCA plot of the first two components (PC1 and PC2) based on the core collection and total collection (Figure 4d) was consistent, which can also explain the rationality of the screening results.
The genetic diversity of the core collection was estimated to determine the extent of diversity captured from the total collection (Table 2). The comparison results of the genetic parameters (observed heterozygosity (Ho), expected heterozygosity (He), Nei diversity index (H), Shannon–Wiener index (I), and PIC) showed that the values for the core collection were greater than those for the total collection. For example, the observed heterozygosity ranged from 0.008 to 1.00 for the total collection and from 0.029 to 1.00 for the core collection; the Nei diversity index values ranged from 0.095 to 0.503 for the total collection and from 0.097 to 0.509 for the core collection. The mean observed heterozygosity, expected heterozygosity, Nei diversity index, Shannon–Wiener index, and PIC values for the total collection were 0.142, 0.266, 0.268, 0.425, and 0.223, respectively, and increased to 0.152, 0.288, 0.293, 0.453, and 0.239, respectively, in the core collection.
4. Discussion
4.1. SNP-Based Genetic Relationships among the X. sorbifolium Germplasm Resources
SNPs, due to their abundance in genomes, having high levels of polymorphism, and amenability for high-throughput assay formats, are predominantly used in genetic studies [40,41,42]. To understand the genetic relationships and population genetic structure of X. sorbifolium germplasm at the genomic level, the re-sequence genome-wide SNP data of 119 elite germplasms of X. sorbifolium were used. We found that the results of phylogenetic analysis, genetic population analysis, and principal component analysis were basically consistent and complemented one another. The cluster group of phylogenetic analysis and population structure analysis did not fully cluster by geographical origin. This is mainly because the elite germplasms used in this test were all selected and obtained from local seedlings; in the long-term selection process, germplasms from different provinces were introduced or exchanged. Wang et al. (2021) reported similar results in a study conducted on 113 cigar tobacco accessions; the accessions were not completely classified based on their geographical origins [43].
4.2. Genetic Diversity of X. sorbifolium Germplasm Resources
Genetic diversity is an integral part of all biological diversity. It is the basis of biological evolution and species differentiation and is of great significance for population maintenance and reproduction, and adaptation to habitat changes. The higher the genetic diversity, the more likely a population is to adapt to different environments, and variations in DNA sequences are the primary drivers of such diversity [44]. In recent years, various molecular markers (SSR, ISSR, and RAPD) have been used to study the genetic diversity of X. sorbifolium [15,16,17,18,19,20,45]. In this study, the whole-genome SNP markers were used to calculate the genetic diversity among 119 elite X. sorbifolium germplasms.
Nei’s gene diversity, observed heterozygosity and expected heterozygosity, the Shannon–Wiener index, polymorphism information content, etc., have all been used to evaluate the level of genetic diversity of plant species [44]. In this study, the average values for Nei’s diversity index, observed heterozygous number, expected heterozygous number, and the Shannon–Wiener index for the inferred groups classified by population structure analysis were 0.3018, 0.1768, 0.2963, and 0.4624, respectively. For the six groups (five different colored flower groups and one double-flowered group), these were 0.3611, 0.2194, 0.3229, and 0.4940, respectively, implying that the genetic diversity of the X. sorbifolium germplasms was medium. The genetic diversity was lower than that reported in previous studies conducted by RAPD, SSR, and ISSR, which all found high genetic diversity among the germplasms or population of X. sorbifolium [15,19,21].
The PIC values, which are a reflection of allelic diversity and frequency among the genotypes, are estimators of the usefulness of any marker system for genotype distinction and genetic diversity analysis. The degree of PIC values is usually categorized as low (PIC < 0.25), medium (0.5 > PIC > 0.25), or high (PIC > 0.5) [46]. Since SNP markers are bi-allelic in nature, their PIC values are considered to be moderate or low informative, and are also restricted to extreme PIC values of 0.5 [47]. In this study, the overall average values of PIC for the three inferred groups classified by population structure analysis and for the classified six groups were 0.2445 and 0.2628, respectively. Although the PIC values ranged from low to medium informative, they were higher than the average PIC values in previously reported studies based on SNP markers in durum wheat (0.203) [48], and similar to those reported in studies on cotton (0.25) [25] and wheat (0.29) [26], supporting the fact that moderate to low informative PIC values are acceptable. Furthermore, as expected, the PIC values were lower compared with the SSR marker in X. sorbifolium reported by Shen et al. [19,20] and Bi et al. [19], which reported PIC values as high as 0.51, 0.49, and 0.459, respectively. This result was also reported for Ethiopian durum wheat, and higher PIC and genetic diversity scores were reported in studies using multi-allelic markers such as SSRs which, unlike SNPs, can go beyond 0.5 values [48].
4.3. Core Collection Establishment and Evaluation
Core collections facilitate access to genetically diverse germplasms and trait diversity. They can consist of a manageable number of accessions, while retaining the greatest part of the genetic variability found in a large germplasm collection [14,49]. A core collection selected from the entire collection is of the utmost importance for breeders and geneticists. There is no perfect proportion or fixed size for all core collections, as different species have different research needs. The breadth and complexity of germplasm resources determine the sampling proportion without universality. Yonezawa et al. recommend a 20–30% sampling proportion for the core collection of total collection resources [50]. In this study, employing Core Hunter II software, we developed a core set collection for X. sorbifolium using SNP data, which consisted of 35 core germplasms and contained 29.4% of the total 119 X. sorbifolium germplasms. The observed heterozygosity (Ho), expected heterozygosity (He), Nei diversity index (H), Shannon–Wiener index (I), and PIC values of the core collection were all higher than those of the total collection, which was expected, because diversity increases with the elimination of genetically similar accessions during core collection development [51]. These findings demonstrated that the core collection sufficiently represents the genetic variation of the whole database. This result was similar with that of a previous study by Shen et al. [52]. They constructed a core collection with 25 germplasms, used a 20% sampling ratio, and applied microsatellite marker data, and there were no significant differences in genetic diversity indexes between the core collection and the original collection, which meant that the core collection could represent the original collection. The identification of duplicates is important in germplasm repositories, particularly when considering the construction of core collections [53]. The 119 test germplasms were introduced from the main distribution area of X. sorbifolium. The relative kinship of these germplasms (Figure S2) showed that a total of 67.95% of kinship coefficients between germplasms were equal to 0 and a total of 93.47% kinship coefficients were less than 0.1, revealing that, in this research, most germplasms have no or weak kinship. Some germplasms were genetically identical to each other. Therefore, our core collection reduced the redundancy in the collection. The core collection generated in our study will provide a useful reference and basis for better utilization of X. sorbifolium germplasm resources and future breeding programs. However, a valuable core collection should be dynamic and periodically revised to incorporate additional accessions [53]. Furthermore, we may be able to determine new core collections that are suitable for other users.
5. Conclusions
In this study, the genetic diversity and structure of 119 X. sorbifolium germplasms were analyzed based on 105,685,557 high-quality SNPs. The 119 germplasms were classified into three main groups and were not completely classified based on their geographical origins and flower colors; the genetic backgrounds of these germplasms are complex and diverse. A low to medium informative degree of genetic diversity was found. Based on the assessment, a core collection containing 29.4% (35) out of the 119 X. sorbifolium germplasms was developed using Core Hunter software, and this collection possesses the entire genetic diversity of the total germplasm collection. The understanding of genetic diversity and construction of a core collection provided by this study is a valuable addition to the present genomic resources of X. sorbifolium, and will be useful for the efficient improvement of breeding programs and genome-wide association studies.
Supplementary Materials
The following supporting information can be downloaded at: https://www.mdpi.com/article/10.3390/f13020338/s1, Table S1: List of 119 elite germplasms of X. sorbifolium; Table S2: Sequence information on the genomes of 119 elite germplasms of X. sorbifolium; Table S3: Statistics of SNPs identified in this study; Table S4: The genetic groups among 119 elite germplasms of X. sorbifolium by population structure analysis; Table S5: The genetic groups among 119 elite germplasms of X. sorbifolium by principal component analysis; Table S6: Distribution of different colored flower germplasms and double-flowered germplasms in inferred groups clustered by phylogenetic analysis, population structure analysis, and PCA analysis; Table S7: Distribution of the different original X. sorbifolium germplasms in inferred groups clustered by phylogenetic analysis, population structure analysis and PCA analysis; Table S8: The inferred groups of 119 X. sorbifolium germplasms based on population structure analysis, phylogenetic analysis and PCA analysis; Table S9: The genetic groups among 35 core collection germplasms of X. sorbifolium by principal component analysis; Table S10: A comparison of allele numbers generated in total collection vs. core collection. Figure S1: The relative kinship of 119 X. sorbifolium germplasms. Figure S2: The attenuation curve of LD.
Author Contributions
Data curation, Y.W.; Investigation, Y.W.; Project administration, Y.L.; Supervision, Y.L.; Writing—original draft, Y.W. All listed authors meet the ICMJE criteria and all who meet the four criteria are identified as authors. All authors contributed significantly to the creation of this manuscript, each having fulfilled criteria as established by the ICMJE. The manuscript has been read and approved by all named authors. The order of authors listed in the manuscript has been approved by all named authors. All authors have read and agreed to the published version of the manuscript.
Funding
This research was funded by the Conventional Science and Technology Assistance Program to Developing Countries, grant number KY202002011; The Innovative Talents in Science and Technology Project of Gansu province, grant number 17JR7WA018; and the Key Research and Development Program of Ningxia Province, grant number 2018ZWYQ0066.
Institutional Review Board Statement
Not applicable.
Informed Consent Statement
Not applicable.
Data Availability Statement
The data presented in this study are openly available in [NCBI] at https://www.ncbi.nlm.nih.gov/, accessed on 18 December 2021. The associated BioProject, SRA, and Bio-Sample numbers are PRJNA790469, SAMN24200001~SAMN24200119, and SRR17271781~SRR17271899, respectively.
Acknowledgments
We thank Wenbin Guan, Jianfeng Mao, Yan Ao and Quanxin Bi of Beijing Forestry University for their useful suggestions.
Conflicts of Interest
The authors declare no conflict of interest.
References
- Mou, H.X.; Yu, H.Y.; Hou, X.C. Regular Distribution of Woody Energy Plant Xanthoceras sorbifolium Bunge in China. J. Anhui Agric. Sci. 2008, 36, 3626–3628. [Google Scholar]
- Shao, H.B.; Chu, L.Y. Resource evaluation of typical energy plants and possible functional zone planning in China. Biomass Bioenergy 2008, 32, 283–288. [Google Scholar] [CrossRef]
- Fu, Y.J.; Zu, Y.G.; Wang, L.L.; Zhang, N.J.; Liu, W.; Li, S.M.; Zhang, S. Determination of Fatty Acid Methyl Esters in Biodiesel Produced from Yellow Horn Oil by LC. Chromatographia 2008, 67, 9–14. [Google Scholar] [CrossRef]
- Zhao, Y.; Liu, X.J.; Wang, M.K.; Bi, Q.X.; Cui, Y.F.; Wang, L.B. Transcriptome and physiological analyses provide insights into the leaf epicuticular wax accumulation mechanism in yellowhorn. Hortic. Res. 2021, 8, 134–144. [Google Scholar] [CrossRef]
- Venegas-Calerón, M.; Ruíz-Méndez, M.V.; Martínez-Force, E. Characterization of Xanthoceras sorbifolium Bunge seeds: Lipids, proteins and saponins content. Ind. Crops Prod. 2017, 109, 192–198. [Google Scholar] [CrossRef] [Green Version]
- Bi, Q.X.; Zhao, Y.; Cui, Y.F.; Wang, L.B. Genome survey sequencing and genetic background characterization of yellow horn based on next-generation sequencing. Mol. Biol. Rep. 2019, 46, 4303–4312. [Google Scholar] [CrossRef]
- Rong, W.; Sun, Z.; Li, Q.; Liu, R.; Zhang, T.; Wang, T.; Yang, W.; Li, Z.; Bi, K. Characterization and simultaneous quantification of seven triterpenoid saponins in different parts of Xanthoceras sorbifolia Bunge by HPLC-ESI-TOF. Anal. Methods 2016, 8, 2176–2184. [Google Scholar] [CrossRef]
- Zhang, Y.; Xiao, L.; Xiao, B.; Yin, M.; Gu, M.Y.; Zhong, R.; Shang, Y.; Wang, K.; Wei, L. Research progress and application prospect of Xanthoceras sorbifolia for treating Alzheimer’s disease. Drug Eval. Res. 2018, 41, 912–917. [Google Scholar]
- Qi, Y.; Ji, X.F.; Chi, T.Y.; Liu, P.; Jin, G.; Xu, Q.; Jiao, Q.; Wang, L.H.; Zou, L.B. Xanthoceraside attenuates amyloid β peptide1-42-induced memory impairments by reducing neuroinflammatory responses in mice. Eur. J. Pharmacol. 2017, 820, 18–30. [Google Scholar] [CrossRef]
- Wang, Y.L.; Yue, S.L.; Li, R.F.; Zhai, H.X.; Song, Q. A New Cultivar of Landscaping Xanthoceras sorbifolium ‘Senmiao Jinziguan’. Acta Hortic. Sin. 2020, 47, 405–406. [Google Scholar]
- Zhou, Q.Y.; Cai, Q. The superoxide dismutase genes might be required for appropriate development of the ovule after fertilization in Xanthoceras sorbifolium. Plant Cell Rep. 2018, 37, 727–739. [Google Scholar] [CrossRef] [PubMed]
- Yu, H.Y.; Fan, S.Q.; Bi, Q.X.; Wang, S.X.; Hu, X.Y.; Chen, M.Y.; Wang, L.B. Seed morphology, oil content and fatty acid composition variability assessment in yellow horn (Xanthoceras sorbifolium Bunge) germplasm for optimum biodiesel production. Ind. Crops Prod. 2017, 97, 425–430. [Google Scholar] [CrossRef]
- Ren, X.B.; Li, S.C.; Li, F.M.; Sun, J.H.; Zhang, L.M.; Li, X.G. The genetic germplasm collection field construction and sapling increment evaluation of Xanthoceras sorbifolia. J. Jilin For. Sci. Technol. 2016, 45, 21–25. [Google Scholar]
- Schafleitner, R.; Nair, R.M.; Rathore, A.; Wang, Y.W.; Lin, C.Y.; Chu, S.H.; Lin, P.Y.; Chang, J.C.; Ebert, A.W. The World Vegetable Center mungbean (Vigna radiata) core and mini core collections. BMC Genom. 2015, 16, 344. [Google Scholar] [CrossRef] [Green Version]
- Wang, L.W.; Wu, S.Q.; Kou, Y.Y.; Luo, G.J. RAPD analysis of germplasm resources of Xanthoceras sorbifolia. J. Liaoning For. Sci. Technol. 2012, 1, 11–12. [Google Scholar]
- Guan, L.P.; Yang, T.; Li, N.; Li, B.S.; Lu, H. Identification of superior clones by RAPD technology in Xanthoceras sorbifolia Bunge. For. Stud. China 2010, 12, 37–40. [Google Scholar] [CrossRef]
- Bi, Q.X.; Guan, W.B. Isolation and characterisation of polymorphic genomic SSRs markers for the endangered tree Xanthoceras sorbifolium Bunge. Conserv. Genet. Resour. 2014, 6, 895–898. [Google Scholar] [CrossRef]
- Bi, Q.X.; Mao, J.F.; Guan, W.B. Efficiently developing a large set of polymorphic EST-SSR markers for Xanthoceras sorbifolium by mining raw reads from high-throughput sequencing. Conserv. Genet. Resour. 2015, 7, 423–425. [Google Scholar] [CrossRef]
- Shen, Z.; Zhang, K.; Ma, L.; Duan, J.; Ao, Y. Analysis of the genetic relationships and diversity among 11 populations of Xanthoceras sorbifolia using phenotypic and microsatellite marker data. Electron. J. Biotechnol. 2017, 26, 33–39. [Google Scholar] [CrossRef]
- Shen, Z.; Duan, J.; Ma, L.Y. Genetic diversity of Xanthoceras sorbifolium bunge germplasm using morphological traits and microsatellite molecular markers. PLoS ONE 2017, 7, e0177577. [Google Scholar] [CrossRef] [Green Version]
- Chanhoon, A.; Hyunseok, L.; Jeonghoon, L.; Eun, J.C.; Li, Y.H.; Jaeseon, Y. Analysis of genetic diversity and differentiation of artificial populations of yellowhorn (Xanthoceras sorbifolium) in China using ISSR markers. J. For. Res. 2016, 27, 1099–1104. [Google Scholar]
- El-Kassaby, Y.A.; Wang, Q.; Wang, T.; Ratcliffe, B.; Bi, Q.X.; Wang, Z.; Mao, J.F.; Guan, W.B. Concept for gene conservation strategy for the endangered Chinese yellowhorn, Xanthoceras sorbifolium, based on simulation of pairwise kinship coefficients. For. Ecol. Manag. 2019, 432, 976–982. [Google Scholar] [CrossRef]
- Wurschum, T.; Langer, S.M.; Longin, C.F.H. Population structure, genetic diversity and linkage disequilibrium in elite winter wheat assessed with SNP and SSR markers. Appl Genet 2013, 126, 1477–1486. [Google Scholar] [CrossRef]
- Verma, S.; Gupta, S.; Bandhiwal, N. High-density linkage map construction and mapping of seed trait QTLs in chickpea (Cicer arietinum L.) using genotyping-by-sequencing (GBS). Sci. Rep. 2015, 5, 17512. [Google Scholar] [CrossRef] [PubMed] [Green Version]
- Ai, X.; Liang, Y.; Wang, J.; Zheng, J.Z.; Gong, J.; Guo, X.; Qu, Y. Genetic Diversity and Structure of Elite Cotton Germplasm (Gossypium Hirsutum L.) Using Genome-Wide Snp Data. Genetica 2017, 145, 4–5. [Google Scholar] [CrossRef]
- Kumar, D.; Chhokar, V.; Sheoran, S.; Singh, R.; Sharma, P.; Jaiswal, S.; Iquebal, M.A. Characterization of Genetic Diversity and Population Structure in Wheat Using Array Based Snp Markers. Mol. Biol. Rep. 2020, 47, 293–306. [Google Scholar] [CrossRef]
- Yin, M.H.; Wang, Q.; Zhang, H.L.; Cai, X.H.; Xu, C.Q.; Chen, F.L.; Liu, S.Y.; Zhang, Q.W.; Ca, H.; Chen, R.H. Whole Genome Re-sequencing Analysis of Alpine Potato and Local Farm Potato in Huaiyu Mountain under High Altitude Habitats. Genom. Appl. Biol. 2020, 39, 1198–1207. [Google Scholar]
- Tan, Q.J.; Wang, W.L.; Chen, H.S.; Wei, Y.R.; Zheng, S.F.; Huang, X.Y.; He, P.; Xia, Z.Q. Genetic Diversity of Macadamia Varieties Based on Single-Nucleotide Polymorphism. Mol. Plant Breed. 2020, 18, 7246–7253. [Google Scholar]
- Bi, Q.X.; Zhao, Y.; Du, W.; Lu, Y.; Gui, L.L.; Zheng, Z.M.; Yu, H.Y.; Cui, Y.F.; Liu, Z.; Cui, T.P.; et al. Pseudomolecule-level assembly of the Chinese oil tree yellowhorn (Xanthoceras sorbifolium) genome. GigaScience 2019, 8, giz070. [Google Scholar] [CrossRef]
- Liang, Q.; Yang, H.; Li, S.k.; Yuan, F.L.; Sun, J.F.; Duan, Q.C.; Li, Q.Y.; Zhang, R.; Sang, Y.L.; Wang, N.; et al. The genome assembly and annotation of yellowhorn (Xanthoceras sorbifolium Bunge). GigaScience 2019, 8, giz071. [Google Scholar] [CrossRef] [Green Version]
- Li, H.; Durbin, R. Fast and accurate short read alignment with Burrows-Wheeler transform. Bioinformatics 2009, 25, 1754–1760. [Google Scholar] [CrossRef] [Green Version]
- McKenna, A.; Hanna, M.; Banks, E.; Sivachenko, A.; Cibulskis, K.; Kernytsky, A.; Garimella, K.; Altshuler, D.; Gabriel, S.; Daly, M.; et al. The Genome Analysis Toolkit: A MapReduce framework for analyzing next-generation DNA sequencing data. Genome Res. 2010, 20, 297–303. [Google Scholar] [CrossRef] [PubMed] [Green Version]
- Picard. Available online: http://sourceforge.net/projects/picard/ (accessed on 29 December 2021).
- Yang, B.M.; Zhang, G.L.; Guo, F.P.; Wang, M.Q.; Wang, H.Y.; Xiao, H.X. A Genomewide Scan for Genetic Structure and Demographic History of Two Closely Related Species, Rhododendron dauricum and R. mucronulatum (Rhododendron, Ericaceae). Front. Plant Sci. 2020, 11, 1093. [Google Scholar] [CrossRef] [PubMed]
- Cingolani, P.; Platts, A.; Wang, L.L.; Coon, M.; Nguyen, T.; Wang, L.; Land, S.J.; Liu, X.; Ruden, D.M. A program for annotating and predicting the effects of single nucleotide polymorphisms, SnpEff: SNPs in the genome of Drosophila melanogaster strain w1118; iso-2; iso-3. Fly 2012, 6, 80–92. [Google Scholar] [CrossRef] [Green Version]
- Kumar, S.; Stecher, G.; Li, M.; Knyaz, C.; Tamura, K. MEGA X: Molecular Evolutionary Genetics Analysis across Computing Platforms. Mol. Biol. Evol. 2018, 35, 1547–1549. [Google Scholar] [CrossRef] [PubMed]
- Alexander, D.H.; Novembre, J.; Lange, K. Fast model-based estimation of ancestry in unrelated individuals. Genome Res. 2009, 19, 1655–1664. [Google Scholar] [CrossRef] [Green Version]
- Price, A.L.; Patterson, N.P. Principal components analysis corrects for stratification in genome-wide association studies. Nat. Genet. 2006, 38, 904–909. [Google Scholar] [CrossRef]
- Thachuk, C.; Crossa, J.; Franco, J.; Dreisigacker, S.; Warburton, M.; Davenport, G.F. Core Hunter: An algorithm for sampling genetic resources based on multiple genetic measures. BMC Bioinform. 2009, 10, 1–13. [Google Scholar] [CrossRef] [Green Version]
- Rafalski, A. Applications of single nucleotide polymorphisms in crop genetics. Curr. Opin. Plant Biol. 2002, 5, 94–100. [Google Scholar] [CrossRef]
- Mammadov, J.; Aggarwal, R.; Buyyarapu, R.; Kumpatla, S. SNP markers and their impact on plant breeding. Int. J. Plant Genom. 2012, 2012, 728398. [Google Scholar] [CrossRef]
- Jehan, T.; Lakhanpaul, S. Single nucleotide polymorphism (SNP)–methods and applications in plant genetics: A review. Indian J. Biotechnol. 2006, 5, 435–459. [Google Scholar]
- Wang, Y.Y.; Lv, H.K.; Xiang, X.H.; Yang, A.G.; Feng, Q.F.; Dai, P.G.; Li, Y.; Jiang, X.; Liu, G.X.; Zhang, X.W. Construction of a SNP Fingerprinting Database and Population Genetic Analysis of Cigar Tobacco Germplasm Resources in China. Front. Plant Sci. 2021, 12, 618133. [Google Scholar] [CrossRef] [PubMed]
- Qiao, D.Y.; Wang, P.; Wang, S.A.; Li, L.F.; Gao, L.L.; Yang, R.T.; Wang, Q.; Li, Y. Genetic Diversity Analysis of Lagerstroemia Germplasm Resources Based on SNP Markers. J. Nanjing For. Univ. 2020, 44, 21–28. [Google Scholar]
- Lang, Y.H.; Sun, Y.; Feng, Y.J.; Qi, Z.; Yu, M.; Song, K. Recent Progress in the Molecular Investigations of Yellow Horn (Xanthoceras sorbifolia Bunge). Bot. Rev. 2020, 86, 136–148. [Google Scholar] [CrossRef]
- Botstein, D.; White, R.L.; Skolnick, M.; Davis, R.W. Construction of a genetic linkage map in man using restriction fragment length polymorphisms. Am. J. Hum. Genet. 1980, 32, 314–331. [Google Scholar]
- Eltaher, S.; Sallam, A.; Belamkar, V. Genetic diversity and population structure of F3:6 nebraska winter wheat geno-types using genotyping-by-sequencing. Front. Genet. 2018, 9, 76. [Google Scholar] [CrossRef]
- Alemu, A.; Feyissa, T.; Letta, T.; Abeyo, B. Genetic diversity and population structure analysis based on the high density SNP markers in Ethiopian durum wheat (Triticum turgidum ssp. durum). BMC Genet. 2020, 21, 18–35. [Google Scholar] [CrossRef] [Green Version]
- Nayak, S.N.; Song, J.; Villa, A.; Pathak, B.; Ayala, S.T.; Yang, X.P.; Todd, J.; Glynn, N.C.; Kuhn, D.N.; Glaz, B.; et al. Promoting Utilization of Saccharum spp. Genetic Resources through Genetic Diversity Analysis and Core Collection Construction. PLoS ONE 2014, 9, e110856. [Google Scholar] [CrossRef] [Green Version]
- Yonezawa, K.; Nomura, T.; Morishima, H. Sampling strategies for use in stratified germplasm collections. In Core Collections of Plant Genetic Resources; Hodgkin, T., Brown, A.H.D., Van Hintum, T.J.L., Eds.; John Wiley & Sons: Chichester, UK, 1995; pp. 35–53. [Google Scholar]
- Agrama, H.A.; Yan, W.G.; Lee, F.; Fjellstrom, R.; Chen, M.H. Genetic assessment of a mini-core subset developed from USDA Rice Genebank. Crop Sci. 2009, 49, 1336–1346. [Google Scholar] [CrossRef]
- Shen, Z.; Ma, L.Y.; Ao, Y.; Duan, J. Analysis of the Genetic Diversity and Construction of Core Collection of Xanthoceras sorbifolia Bunge. Using Microsatellite Marker Data. Mol. Plant Breed. 2017, 15, 3341–3350. [Google Scholar]
- Xu, C.Q.; Gao, J.; Du, Z.F.; Li, D.K.; Wang, Z.; Li, Y.Y.; Pang, X.M. Identifying the genetic diversity, genetic structure and a core collection of Ziziphus jujube Mill. var. jujuba accessions using microsatellite markers. Sci. Rep. 2016, 6, 31503. [Google Scholar] [PubMed]
Figure 1.
(a) The distribution and collection locations of X. sorbifolium. The radius of the circles represents the number of collected germplasms, and the colors represent the subgroup clustered by population structure analysis at K = 3 (see also Figure 2. The red dotted lines of province boundaries indicates there is geographic distribution of X. sorbifolium in these provinces (municipalities and autonomous regions). (b) Phylogenetic tree of all 119 X. sorbifolium elite germplasms based on 105,685,557 SNPs built by the neighbor-joining method with 1000 bootstrap replications in MEGA 6.0 software.

Figure 2.
Population structure analysis of 119 X. sorbifolium elite germplasms. (a) The ADMIXTURE estimation of the number of subgroups for K values ranging from 2 to 5. The K value with the lowest CV error represents the suggested cluster number. (b) Q-plot showing clustering of 119 X. sorbifolium elite germplasms based on analysis of genotypic data using STRUCTURE, where each color represents one subgroup, namely Q1, Q2, and Q3. The x-axis indicates different germplasms. The y-axis quantifies the membership probability of germplasms belonging to different groups. The dot colors in the bottom row represent the six groups on the basis of flower color.

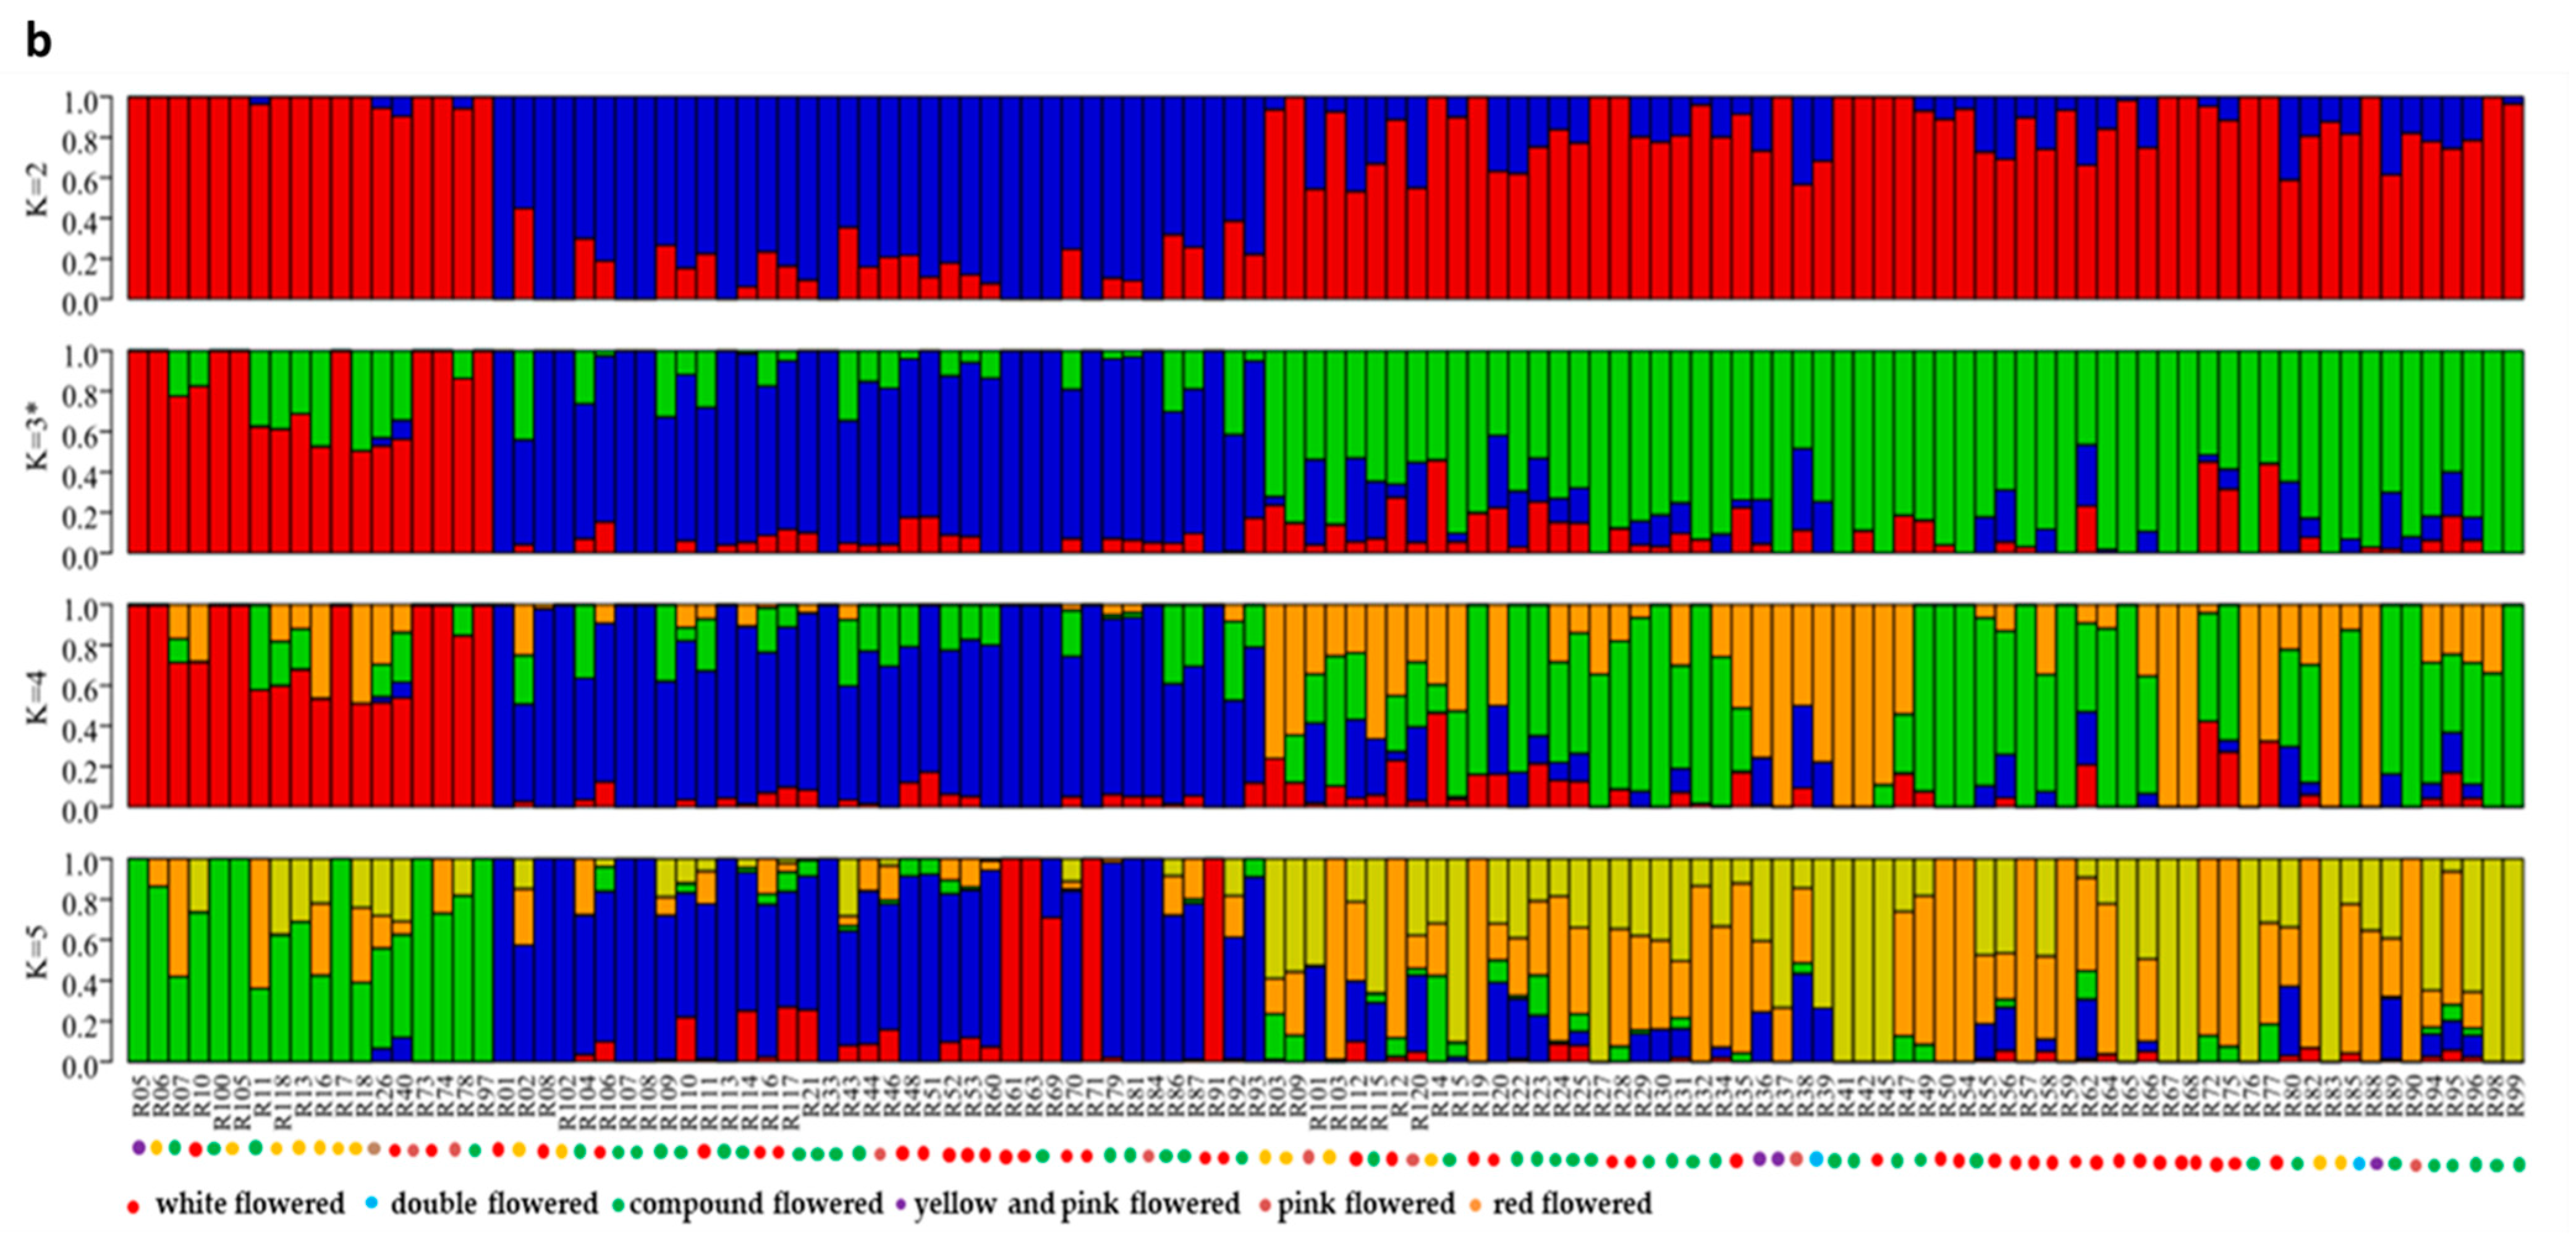
Figure 3.
Principal component analysis (PCA) of 119 X. sorbifolium elite germplasms using EIGENSOFT software. (a) PCA plot of the first three components (PC1, PC2, and PC3) of the 119 germplasms. (b) PCA plot of the first two components (PC1 and PC2) of the 119 germplasms. Each dot represents a germplasm, each color represents a group classified by the flower color.

Figure 4.
Core collection establishment and evaluation of 119 X. sorbifolium elite germplasms. (a) Gene coverage evaluation of the core collection of X. sorbifolium. (b) Comparison of allele percentage occurrence in the total collection and core collection of X. sorbifolium. (c) Comparison of MAFs in the total collection and core collection of X. sorbifolium. (d) Comparison of PCA plots of the first two components (PC1 and PC2) based on the core collection and total collection.


Table 1.
Summary of genetic diversity of the three inferred groups classified by population structure analysis and the six groups classified by the flower color.
Table 1.
Summary of genetic diversity of the three inferred groups classified by population structure analysis and the six groups classified by the flower color.
| Group | No. | MAF | Ne | He | H | A | Na | Ho | PIC | I |
|---|---|---|---|---|---|---|---|---|---|---|
| Q1 | 19 | 0.2157 ± 0.1267 | 1.4948 ± 0.2876 | 0.3063 ± 0.1303 | 0.3155 ± 0.1343 | 535,470 | 2 | 0.2115 ± 0.1446 | 0.2509 ± 0.0912 | 0.4734 ± 0.1569 |
| Q2 | 38 | 0.2045 ± 0.1194 | 1.4687 ± 0.2719 | 0.2968 ± 0.1218 | 0.3014 ± 0.1237 | 677,676 | 2 | 0.1539 ± 0.1033 | 0.2454 ± 0.0846 | 0.4638 ± 0.1454 |
| Q3 | 62 | 0.1950 ± 0.1186 | 1.4468 ± 0.2719 | 0.2858 ± 0.1237 | 0.2886 ± 0.1248 | 788,843 | 2 | 0.1649 ± 0.1016 | 0.2373 ± 0.0865 | 0.4501 ± 0.1486 |
| Average/Total | 119 | 0.2051 ± 0.1190 | 1.4701 ± 0.2737 | 0.2963 ± 0.1276 | 0.3018 ± 0.1282 | 667,330 | 2 | 0.1768 ± 0.0896 | 0.2445 ± 0.0905 | 0.4624 ± 0.1552 |
| White-flowered | 42 | 0.1904 ± 0.1174 | 1.4360 ± 0.2694 | 0.2808 ± 0.1234 | 0.2847 ± 0.1251 | 751,227 | 2 | 0.1528 ± 0.1039 | 0.2337 ± 0.0867 | 0.4439 ± 0.1487 |
| Double flowered | 2 | 0.3500 ± 0.1225 | 1.7600 ± 0.1960 | 0.4250 ± 0.0612 | 0.5667 ± 0.0816 | 282,886 | 2 | 0.3766 ± 0.2911 | 0.3328 ± 0.0344 | 0.6147 ± 0.0641 |
| Compound-flowered | 46 | 0.1896 ± 0.1184 | 1.4335 ± 0.2713 | 0.2792 ± 0.1241 | 0.2828 ± 0.1257 | 874,440 | 2 | 0.1523 ± 0.1003 | 0.2325 ± 0.0871 | 0.4419 ± 0.1495 |
| Yellow- and pink-flowered | 4 | 0.2581 ± 0.1247 | 1.5874 ± 0.2664 | 0.3519 ± 0.1088 | 0.4022 ± 0.1244 | 333,550 | 2 | 0.2722 ± 0.2074 | 0.2841 ± 0.0714 | 0.5304 ± 0.1240 |
| Red-flowered | 16 | 0.2103 ± 0.1234 | 1.4817 ± 0.2799 | 0.3017 ± 0.1250 | 0.3128 ± 0.1296 | 657,812 | 2 | 0.1755 ± 0.1341 | 0.2484 ± 0.0866 | 0.4692 ± 0.1489 |
| Pink-flowered | 9 | 0.2092 ± 0.1274 | 1.4789 ± 0.2882 | 0.2985 ± 0.1317 | 0.3174 ± 0.1401 | 560,379 | 2 | 0.1871 ± 0.1491 | 0.2453 ± 0.0927 | 0.4638 ± 0.1594 |
| Average/Total | 119 | 0.2346 ± 0.1190 | 1.5296 ± 0.2737 | 0.3229 ± 0.1276 | 0.3611 ± 0.1282 | 576,715 | 2 | 0.2194 ± 0.0896 | 0.2628 ± 0.0905 | 0.4940 ± 0.1552 |
No., number of germplasms; MAF, minor allele frequency; Ne, expected allele number; He, expected heterozygous number; H, Nei diversity index; A, number of polymarkers; Na, observed allele number; Ho, observed heterozygous number; PIC, polymorphism information content; I, Shannon–Wiener index. The numbers are presented as the mean ± standard deviation.
Table 2.
Comparison of genetic diversity in the core collection and total collection.
| States | Number of Germplasms | Ho | He | H | I | PIC |
|---|---|---|---|---|---|---|
| All | 119 | 0.008–1.000 (0.142) | 0.095–0.500 (0.266) | 0.095–0.503 (0.268) | 0.199–0.693 (0.425) | 0.090–0.375 (0.223) |
| Core | 35 | 0.029–1.000 (0.152) | 0.095–0.500 (0.288) | 0.097–0.509 (0.293) | 0.199–0.693 (0.453) | 0.090–0.375 (0.239) |
Numbers before and in brackets indicate range and mean, respectively.
Publisher’s Note: MDPI stays neutral with regard to jurisdictional claims in published maps and institutional affiliations. |
© 2022 by the authors. Licensee MDPI, Basel, Switzerland. This article is an open access article distributed under the terms and conditions of the Creative Commons Attribution (CC BY) license (https://creativecommons.org/licenses/by/4.0/).
Share and Cite
MDPI and ACS Style
Wang, Y.; Li, Y. Population Genetics and Development of a Core Collection from Elite Germplasms of Xanthoceras sorbifolium Based on Genome-Wide SNPs. Forests 2022, 13, 338. https://doi.org/10.3390/f13020338
AMA Style
Wang Y, Li Y. Population Genetics and Development of a Core Collection from Elite Germplasms of Xanthoceras sorbifolium Based on Genome-Wide SNPs. Forests. 2022; 13(2):338. https://doi.org/10.3390/f13020338
Chicago/Turabian StyleWang, Yali, and Yi Li. 2022. "Population Genetics and Development of a Core Collection from Elite Germplasms of Xanthoceras sorbifolium Based on Genome-Wide SNPs" Forests 13, no. 2: 338. https://doi.org/10.3390/f13020338
Note that from the first issue of 2016, this journal uses article numbers instead of page numbers. See further details here.