
Aerobiological Pollen Deposition and Transport of Fraxinus excelsior L. at a Small Spatial Scale


1
Physical Geography/Landscape Ecology and Sustainable Ecosystem Development, Catholic University of Eichstätt-Ingolstadt, 85072 Eichstätt, Germany
2
Bavarian Office for Forest Genetics (AWG), 83317 Teisendorf, Germany
3
BioSense Institute–Research Institute for Information Technologies in Biosystems, University of Novi Sad, 21102 Novi Sad, Serbia
*
Author to whom correspondence should be addressed.
Forests 2022, 13(3), 424; https://doi.org/10.3390/f13030424
Submission received: 7 February 2022
/
Revised: 28 February 2022
/
Accepted: 4 March 2022
/
Published: 8 March 2022
(This article belongs to the Section Forest Ecology and Management)
Abstract
:The ongoing fragmentation of ash populations due to ash dieback requires an effective gene flow between individuals; thus, investigations on ash pollen transport are essential. In this study, comprehensive aerobiological field experiments at two seed plantations in Baden-Württemberg were conducted in 2019 and 2020 in order to study the influence of phenology and meteorology (especially wind) on pollen transport using self-constructed gravimetric pollen traps located 1.5 and 5 m a.g.l. Our main objectives were to investigate the local scale dispersion of ash pollen and to evaluate the recommended distance (i.e., 400 m) from seed plantations to other ash trees according to the German Forest Reproduction Act. Our results showed a link between pollen transport and meteorology, the onset of phenological development, and the topography of the plantation. The plantation at Schorndorf was characterized by a slope and associated cold air flows, suggesting that this could be a factor contributing to higher pollen levels at the downslope traps. In addition, in many cases, the cardinal direction associated with the highest pollen impaction was also identical with the predominant wind direction. Analyzing pollen data for single traps in detail, we found that the highest total pollen catch (31%) was measured outside the plantations in 2019, a year with very low flower development. In contrast, most pollen (33%) was caught within the plantation in 2020, which presented a much stronger pollen year than 2019 (with a factor of 11 regarding total sums). This indicates, in the lower pollen year, a potential higher contribution of trees from outside the plantation, and thus it can be recommended that seed harvesting of ash trees in the plantations should preferentially take place in full mast years. Interestingly, the total pollen deposition in Emmendingen at 5 m height showed little difference compared to the traps at 1.5 m height, but there was a large temporal difference pointing to vertical variations in pollen availability. In general, we found that ash pollen was transported for a larger distance than 400 m, but the amount of pollen decreased substantially with increasing distance. At a distance of 200 m, there was already approx. 50% less pollen captured from the air. However, even at a distance of 500 m, more than 10% of the pollen was still captured. In order to ensure cross-pollination of healthy ash trees, the distance of ash individuals or stands should not be too large, and there should be no spatial separation (e.g., by conifer stands).
1. Introduction
1.1. Ash Dieback—Background
The common ash (Fraxinus excelsior L.) has been growing in Europe for centuries [1,2] and is an important and widespread cultivated tree species due to its ecological relevance, climate tolerance, and high-quality wood properties [3,4,5]. However, during the last decades, its existence has been acutely endangered by ash dieback, which is caused by the invasive fungus Hymenoscyphus fraxineus and its asexual stage Chalara fraxinea. This fungus originates from East Asia and has developed an invasive potential in Europe [2,6,7,8]. Its spores successively attack the leaves, shoots, and wood of the ash trees, which in many cases finally leads to their death [9,10,11]. Only approx. 1–5% of ashes are believed to be less susceptible [8,12], and a vast decrease in local populations in many forests throughout Europe has already been observed [4,13]. In addition, forestry often reacts to ash dieback with salvage cuts; i.e., increased timber logging or clearcutting [8,14,15]. For example, the proportion in Lithuanian stands, in which ash made up originally between 40–100% only some decades ago, decreased to 0–24% in the following generation due to the large-scale felling of old trees and weak regeneration in the following generation [16]. In Austria, logging increased by a factor of six by 2015 (compared to 2008) [17], and similar increases were recorded for Germany [15] and Denmark [7].
1.2. Consequences of the Ash Population Decline
According to simulations, over 75% of ash populations are expected to decline in the next 30 years in Europe [18], resulting in the fragmentation of ash populations and a weakening of the pollen flow between trees [7]. The common ash is pollinated by wind [2]. Pollen from the father tree reaches the female flower of the mother tree and thereby passes on its genetic information from one generation to the next [19]. This transfer of genes within and between populations influences the genetic diversity of a species as well as the diversity’s spatial structure [20]. Thus, individual trees and ash populations are “genetically networked” with each other via pollen dispersal. In a healthy ecosystem, those genotypes that have the highest fitness under the prevailing environmental conditions succeed in the course of the evolutionary adaptation process [19]. Progressive fragmentation is accompanied by a reduction in gene flow and, consequently, a narrowing of the gene pool [7]. Accordingly, the adaptability of ash is negatively affected, and the risk of inbreeding is increased [19,20,21]. However, for future robust ash populations, it is essential that genetic diversity is sufficiently high, which requires effective gene flow among individuals. Therefore, phenological synchrony and the relative fecundity of the individuals can be regarded as important features [22,23,24]. However, complex interactions in ecosystems imply that long-term effects of a reduced gene flow are difficult to assess. Due to ongoing fragmentation and the risk of reduced gene flow, studies on ash pollen transport are consequently of mayor importance.
1.3. Seed Plantations
Seed plantations are defined as selectively composed breeding populations used to produce high-quality forest reproductive material [19]. When considering seed plantations, a spatial limitation of pollen flight distances might be desirable. The emission of pollen from other ash trees could have adverse effects on seeds since the source and quality of ash pollen emissions remain unknowns. The German Forest Reproduction Act [25] suggests a minimum distance of 400 m between seed plantations with a low fitness population of the same species to be sufficient to avoid unintended gene flow from other ash populations.
1.4. Previous Studies on Pollen Transport
Information on pollen transport of ash has been mostly gathered indirectly through DNA-based paternity analyses [26,27,28]. However, distances of the effective pollen transport differ widely among studies; e.g., from 70–140 m [26] to 2900 m [27]. Semizer-Cuming et al. [20] reported that only 5% of ash pollen is transported over longer distances than 1.3 km. However, approaches based on paternity analyses are linked to some drawbacks. In addition to methodological difficulties in gene typing [26], it is challenging or often unfeasible to sample all trees that represent a potential pollen source for reproduction [27]. Due to the reported differences in the estimated pollen transport distances and methodological drawbacks, alternative approaches focusing on pollen flight distances per se using aerobiological methods are needed. While these distances alone are not critical for pollination efficiency, studies of ash pollen transport increase our knowledge and provide important information on the radius over which the pollen of (susceptible) individuals can spread and potentially pollinate. In general, pollen dispersal and deposition is known to be influenced by abiotic and biotic factors such as meteorological conditions and vegetation, but also tree height and crown width [29,30,31]. This knowledge is mostly derived from aerobiological studies, and it has also been reported that pollen deposition from single groups of trees outside the forest prevails only over short distances. In a study on the dispersal of Sequoiadendron giganteum pollen, Anderson [32] reported that most pollens are deposited only within 100 m of the source. Bricchi et al. [33] studied pollen deposition for a group of 60 Platanus trees and showed that about 25% of the pollen was deposited within 400 m of the source, and only nine grains were found at 2750 m. Adams-Groom et al. [30] determined that 94% of pollens from isolated trees of Carpinus betulus, Cedrus atlantica, Juglans nigra, and Platanus acerifolia were deposited directly under the canopy.
1.5. Aim of the Study
Since ash pollen dispersal has rarely been investigated through aerobiological studies, we focused on ash pollen deposition and transport, which was assessed using a set of gravimetric traps installed at two seed orchards in Baden-Württemberg in 2019 and 2020. We considered the influence of phenology and weather conditions on pollen quantities. Our main objectives were to investigate the distribution of ash pollen within a small scale in order to assess (a) the possible effects of increasingly fragmented ash populations on ash pollination and (b) the suitability of the recommended distance of 400 m from seed orchards to other ash trees; e.g., characterized by a lower vitality.
2. Materials and Methods
2.1. Study Area
In order to generate generalized knowledge on ash pollen transport, we chose two ash seed plantations, Schorndorf and Emmendingen, in Baden-Württemberg (Germany). These sites were selected since they differ in topography (Emmendingen–flat versus Schorndorf–inclined terrain). In addition, the surrounding area with vast open fields and without obstacles was regarded as an advantage for investigating the distance in which most of the pollen is transported or deposited.
The plantation Schorndorf (48°46′ N, 9°25′ E, 420 m a.s.l.) is located in the valley Remstal near Schorndorf, east of the city of Stuttgart (Figure 1a). Meteorological data were derived from two stations since information on temperature was missing at the closest one. The average annual temperature is 10.3 °C (German Meteorological Service (DWD) station “Stuttgart Schnarrenberg”, 1981–2010 [34]) and the average precipitation sum is 855 mm (DWD station “Winterbach, Rems-Murr-Kr.”, 1981–2010 [34]). The plantation is located on a NW exposed slope with an inclination of about 6° to 10° [35]. It was established in 1992 in a 7 × 7 m seedling cluster and has an area of approx. 2.3 ha. Initially, 68 clones (416 ash trees) were planted in a total of 25 rows: 36 clones with eight female or hermaphroditic individuals and 32 clones with four male individuals. In the past, half of the ash trees were removed due to thinning measures and the adverse effects of ash dieback. The plantation comprised 120 ash trees with a maximum height of 17 m in July 2019 and 2020. According to the scoring system of Lenz et al. [36], 33% were classified as healthy (crown defoliation <30%) and 67% as damaged (crown defoliation 31–100%) in 2019. In 2020, 32 individuals (27%) were classified as healthy and 88 (73%) as damaged. From the 120 ash trees, 51 individuals were identified as female, 54 as male, and 15 as hermaphrodites (Table A1). The plantation is surrounded by meadows, which are mostly bordered by a mixed forest (mainly beech, spruce, and pine), but further ash trees are not present in the immediate surroundings (within a radius of approx. 1 km).
The seed plantation Emmendingen (48°6′ N, 7°52′ E, 209 m a.s.l.) is located approx. 15 km north of Freiburg im Breisgau, between the foothills of the Black Forest and the Kaiserstuhl in the Rhine valley (Figure 1b). There are no noticeable differences in altitude around the plantation. The average annual temperature is 10.2 °C and the average precipitation sum is 882 mm (DWD station “Emmendingen-Mundingen”, 1981–2010 [34]). The plantation was established in 1995 on former agricultural grassland with an area of approx. 2.7 ha. Originally, 49 clones (228 trees) were planted. In contrast to the Schorndorf seed plantation, thinning measures were not applied so far. Nevertheless, 142 trees already had to be removed due to ash dieback. Since the beginning of our surveys, 86 ash trees (maximum tree height: 18 m) still existed in the seed plantation, of which 45 individuals (52%) were classified as healthy and 41 (58%) as damaged in summer 2019. In 2020, only 33 ash trees (38%) could be classified as healthy. From the 86 ash trees, 17 individuals were recognized as female, 49 as male, and 20 as hermaphrodites. The plantation is bordered in the north and east by a small stream, in the east and west by agricultural land, and in the south by a settlement area. Additional ash trees were detected only in the forested area northeast of pollen trap 6 (Figure 1b).
2.2. Aerobiological Pollen Measurements
The aerobiological pollen measurements were carried out during the flowering period of ash at the specific sites: Schorndorf: 18 March to 14 May 2019 and 18 March to 13 May 2020; Emmendingen: 18 March to 14 May 2019 and 11 March to 1 May 2020. To adjust the start and end of the pollen measurement campaigns, phenological observations were used.
To measure cumulative weekly pollen deposition and transport, self-constructed gravimetric pollen traps of the Durham type were installed in the selected survey areas [37,38]. These have been designed to attach five Vaseline coated microscope slides (one at each cardinal direction and one horizontally) under a rain shelter (Figure 2).
The measurement network was adapted to the characteristics and topography of the plantations. One gravimetric pollen trap was installed in the center of each ash seed plantation to estimate the quantity of emitted pollen. Horizontal dispersion of pollen was assessed by placing additional gravimetric pollen traps at 1.5 m a.g.l. along dominant wind directions, ensuring that pollen deposition both upwind and downwind from the ash stand was represented. Besides one pollen trap installed directly in the plantation, one was set in the northeast and two in the southwest on the agricultural land surrounding the plantation at a distance of up to 450 m at the seed plantation Schorndorf (Figure 1a). The maximum distance was considered to exceed the distance of 400 m recommended by the German Forest Reproduction Act [25], but was also limited by local conditions (e.g., the proximity of the forest). At the seed plantation Emmendingen, three additional traps were set in the southeast and two in the northwest at a distance of up to 500 m (Figure 1b). In 2020, six additional pollen traps carrying only horizontal microscope slides were installed above at a height of 5 m a.g.l. in order to better understand vertical pollen distribution. The microscopic slides were replaced on a weekly basis, which allowed for the analysis of the quantity of pollen dispersed around the ash stands with a seven-day temporal resolution.
The pollen on the collected microscope slides were stained with a gelatin gelvatol solution that contained safranin and fixed with a coverslip. The prepared slides were then protected with a clear varnish. After curing, the slides were analyzed using a light microscope (Axio Lab A1, Carl Zeiss AG, Oberkochen, Germany) at 400× magnification. Ash pollen was counted along four longitudinal transects, which resulted in the screening of 11.6% of the total slide. Pollen was converted to pollen grains per square centimeter of the impaction surface (pollen grains/cm2).
We analyzed spatial and temporal variations in pollen distribution over each study location. The “weekly pollen catch” (sums of pollen on the horizontal and all four vertical slides per week) was used to analyze characteristics of pollen emission and transport, while the “total pollen catch” (the sum of “weekly pollen catches” for all samplers in the study location) enabled a comparison between seasons regarding the amount of emitted pollen. Furthermore, we analyzed pollen transport/impaction on the vertical slides in relation to the cardinal direction and the intensity of the flowering phase (main pollen season and pre- or post-pollen season). Since there is no standard for defining the flowering season derived from pollen data obtained with gravimetric sampler [38], we visually delineated the main pollen season and defined it as the phase in which more than 50% of the registered pollen catch occurred. In turn, the pre-season was defined as the period before and the post-season as the period after the main pollen season, whereby the phases were limited to account for not more than 25% of the total pollen catch.
2.3. Phenological Observations
Phenological observations prior to and at flowering were conducted to analyze the relationship of flower phenology and pollen deposition. For the years 2019 and 2020, phenology was observed according to the BBCH Code [39] on a weekly basis. Thereby, the phenological stages BBCH 60 and BBCH 61 represent the beginning of flowering and the start of pollen release (maximum 10% of flowers open/release pollen), BBCH 65 represents the full flowering (>50% of flowers release pollen), and BBCH 68 represents the decrease of flowering intensity and pollen release. At stage BBCH 69, flowers were already faded and no longer associated with pollen release. To determine the phenological developmental stages, the weekly recorded stages were interpolated over the duration of the measurement campaign, which allowed the estimation of phenological stages between the recorded days.
2.4. Meteorological Parameters
Meteorological parameters were obtained from the climate stations (Weather Transmitter WXT 536, Vaisala) installed in each ash seed plantation with the aim of determining the influence on pollen deposition and transport. The climate station had a height of two meters and a minimum distance of five meters to the nearest tree. The parameters used for further analyses in this study were air temperature, precipitation, wind speed, and wind direction. In Emmendingen, two anemometers (Skywatch Aero, JDC Electronic SA, Yverdon-les-Bains, Switzerland) were additionally placed in the surrounding agricultural areas, which served for a more detailed investigation of the variation of wind direction and speed. In addition, the regional wind that prevailed during the measurement campaigns was included. The parameters wind speed and wind direction were obtained from climate stations of the DWD [34] (Schorndorf: station “Kaisersbach-Cronhütte”; Emmendingen: station “Freiburg”).
Since the seed plantation near Schorndorf is located on a slope (inclination maximum 10°), we additionally examined cold air flows. Despite their usually low velocities, cold air flows can have a substantial impact on the dispersion of pollen [40]. For this purpose, the two-dimensional mathematical–physical simulation model KLAM_21 developed by the DWD was used [41,42]. The simulation results of KLAM_21 provided spatial and temporal information on wind direction and speed as well as the height of cold air accumulation during radiation weather/cloudless night. Three air temperature and relative humidity data loggers (HOBO U23-001, Onset, Bourne, MA, USA) were installed in order to determine temperature differences; e.g., caused by possible cold air flows.
2.5. Statistical Analyses
All gathered meteorological, phenological and aerobiological data were descriptively analyzed, and their temporal development were presented. Wind rose plots were generated to investigate the pattern of wind direction and associated pollen impaction. All statistical analyses and visualizations were performed in RStudio (version 1.2.1335.0) or Microsoft Excel 2016.
3. Results
3.1. Plantation Schorndorf
3.1.1. Total Pollen Catch in Relation to Phenology, Temperature and Precipitation
In 2019, a total pollen catch (the sum of all horizontal and vertical slides attached at the four installed pollen traps during eight weeks) of 849 pollen grains/cm2 was recorded, and in 2020, the value increased to 9391 pollen grains/cm2. Thus, 2020 was a much stronger pollen year than 2019 (with a factor of 11) (Figure 3; note the logarithmic scale of the y-axis). The maximum amount of pollen was detected in both years around 16 April 2019: 190 pollen grains/cm2 (22.4% of the total pollen catch), 2020: 3455 pollen grains/cm2 (36.8%). From the beginning of May, only a very small amount of pollen was recorded (2019: 10.0%, 2020: 2.5%). Based on aerobiological data, the pollen seasons were classified as shown in Table 1.
The temporal pattern of the weekly pollen catch matches well the phenological development of the 69 observed male and hermaphrodite ash trees in the seed plantation. We recorded that only 19 (27.5%) of the male and hermaphrodite trees developed flowers in 2019, compared to 62 (89.9%) in 2020. The height of the ash trees ranged between 3 and 17 m (average 11 m) high. The average height of the tree trunk was 2.1 m. The inflorescences were located across the entire tree crown.
In 2019, mean March–April temperatures were 8.5 °C. During the measurement campaign, we registered precipitation on 20 days out of 59 (sum: 77 mm, Figure 4a,b). The lowest temperatures (minimum −3 °C) were measured on 20 and 21 March, before the opening of flowers, and did therefore not lead to a falling off of flowers. The onset of flowering and pollen release (BBCH 60 and BBCH 61) was observed on 26 March on three ash trees.
In the pre-pollen season (18 March–2 April), a mean temperature of only 5.8 °C was reached. From 2 April onwards, temperatures rose noticeably and provided the impetus for the start of pollen release for ca. 80% of the ash trees. Full flowering (BBCH 65) started on 9 April and ended on 25 April, which corresponds well with our classification of the pollen season. During full flowering, when also the highest weekly pollen catch was measured, the temperature maximum was reached (24 April: 26.1 °C). Precipitation was especially high during the post-pollen season (56.8 mm). From 23 April onwards, we recorded the end of flowering and pollen release for most of the trees. Five ash trees were observed that only started to flower at this time (BBCH 60 + 61). This could explain the small increase in the weekly pollen catch from 29 April onwards. After 30 April, however, only one tree was still in flower.
In 2020, the average March–April temperature was 9 °C (+0.5 °C compared to 2019). The sum of precipitation during the measurement campaign was 68.6 mm (−8.4 mm) on a total of 14 days out of 61 (Figure 4c). Thus, the conditions in the respective periods in spring 2020 were warmer and slightly drier than 2019. Already on 18 March, twelve flowering ash trees in BBCH stage 60/61 and two in stage 65 could be observed (Figure 4d). In addition, temperatures of up to 18.9 °C were measured on this day, which may explain the high weekly pollen catch during this week. On the 21 of March, a total precipitation of 14.3 mm was measured, along with a decrease in temperatures with a minimum value of −3.9 °C on 24 March. This matches the period of stagnation in flower development and could explain the decline in the pollen catch. From 2 April onwards, temperatures started to rise again, and the beginning of flowering and the registered pollen reached its peak. Between 1 April and 8 April, flowering started in most male/hermaphrodite ash trees. During the main pollen season, temperature increased continuously, and there were only 2 days with precipitation. Full flowering (BBCH 65) continued until 16 April. Stage 68 had its peak around 8 April. However, pollen was still released simultaneously from 61 trees around 16 April, even if in varying degrees. This fits well with the maximum of the weekly pollen catch. After 22 April, no more pollen release could be detected, and from 29 April onwards, all flowers had faded. In the post-pollen season, precipitation increased and had a total of 51.2 mm.
3.1.2. Pollen Catch at the Four Traps
For a comprehensive overview, Figure 5 shows the results of the pollen measurements demerged for each pollen trap.
We found that in 2019, the highest total pollen catch was measured at pollen trap 4 (31.4%) and 3 (30.7%), situated 450 m and 225 m to the west of the center of the pollen source, respectively. Trap 2, located within the plantation, had a percentage of 23.1%, and trap 1, at a distance of 150 m to the east of the central point of the plantation, had the smallest percentage of 14.8%. In 2020, most pollen was caught within the plantation (trap 2, 33.4%), closely followed by trap 3 (33.0%). Trap 4 was only associated with 18.8% and trap 1 with 14.7%.
The analysis of pollen that was transported to and impacted on the vertical slides (“pollen impaction”) gives an indication of the wind direction from which the pollen came. Related to meteorological data, the wind direction was predominantly south (30%), southeast (24%), and northwest (15%) in 2019 (wind roses, also for 2020, Figure A1 and Figure A2). Southerly winds were also mostly prevailing when accounting for different pollen seasons (pre-season 36%, main season 31%, post-season 25%. Regarding aerobiological data, most pollen, however, came from the west (35.8%) and east (30.8%). At pollen trap 1, located east of the plantation, the highest pollen impaction was recorded on the microscope slides placed to the west (43.1%), with the second highest in the north (27.6%). These directions fit well with the regional wind (DWD station “Kaisersbach-Cronhütte”), which also was predominately from the west and from the north. Splitting between different seasons revealed that northerly impaction mostly occurred in the post-pollen season. Trap 2 had the highest total pollen impaction in the south (35.5%) and west (31.0%), although a dominance of easterly impaction could be observed in the pre-season. Trap 3 showed the highest impaction in the west (28.7%) and trap 4 in the east (43.5%). In the main pollen season, the dominant direction for both traps was east. In case of trap 3, north was the dominant direction during the post-pollen season. At the furthermost site (trap 4), almost no pollen was recorded in the pre- and post-pollen season. Thus, our results showed that only at pollen trap 2 did major amounts of pollen impact on the south side of the trap, which matches with our main wind direction directly measured next to this trap. For all other pollen traps, the dominant wind directions were primarily west and east. Detailed plots showing pollen impaction (also for 2020) can be found in the Appendix A (Figure A3 and Figure A4).
In 2020, the dominant wind direction of the plantation was south (34%), southeast (30%), and northwest (10%). During the pre- and main pollen season, it was also south (pre-season 40%, main season 39%). During the post-pollen season, wind was directed mainly from the southeast (30%). Averaged for all gravimetric traps, the most pollen came from east (42.1%) and west (30.3%), which matches well with information on regional winds, which were mainly west, northwest, and northeast. At pollen trap 1, the highest percentage was recorded in the east (46.1%), oriented to the adjacent forest with no ash individuals in the nearer surrounding. The main direction only differed in the post-season, in which it was east. Trap 2 had the highest pollen impaction in the east (37.9%) and north (29.7%). The dominant directions were north for the pre-pollen season, east for the main season, and west for the post-pollen season. Pollen trap 3 was hardly associated with any pollen in the north and south. In contrast, a pollen impaction of approx. 45% each was found in the east and west. For trap 4, oriented towards the plantation, the highest pollen impaction was found in the east (39.2%), followed by north (26.4%). However, during the pre-pollen season, the amount of pollen was very homogeneously distributed across the east, south, and west cardinal directions, and the latter seasons were associated with a primarily northern impaction.
3.1.3. KLAM_21
Another approach to interpreting our aerobiological data was achieved using KLAM_21. Our calculations showed the cold air flows at 2 m a.g.l. that prevail one hour after sunset and highlighted that air masses move westwards following the downhill gradient (Figure 6). Such topoclimatological features can be observed under clear sky conditions and are therefore associated with cold air flows reducing the night-time temperatures at sites located at the lower altitude. Using temperature data measured in the east and west of the plantation (Figure 1a), we also confirmed the existence of lower temperature in the east (2019: 9.5 °C, 2020: 10.7 °C) compared to the west (2019: 9.7 °C, 2020: 10.6 °C).
3.2. Plantation Emmendingen
3.2.1. Total Pollen Catch in Relation to Phenology, Temperature and Precipitation
In 2019, a total pollen catch of 2647 pollen grains/cm2 was recorded during our measurement campaign, and 12,024 pollen grains/cm2 were measured in 2020. Again, 2020 was a much stronger pollen year than 2019 (with a factor of 4.5) (Figure 7). However, compared to Schorndorf, the pollen catch in total was consistently higher. In 2020, the pollen season started about one week earlier than in 2019. The maximum amount of pollen was recorded in 2019 between 9 April and 16 April (939 pollen grains/cm2 (35.4% of the total pollen)) and in 2020 between 20 March and 27 March (2264 pollen grains/cm2 (18.8% of the total pollen)). The main pollen season in 2020 (17 March–17 April) was interrupted between 27 March and 3 April and can thus be divided into two phases. The first phase was from 17 March to 27 March (29.9% of the total pollen catch) and the second phase from 3 April to 17 April (33.8%). From the end of April onwards, only very small amounts of pollen could be registered in both years (2019: 13.8%, 2020: 5.3%). Based on the aerobiological data, the pollen seasons were classified as shown in Table 2.
The temporal pattern of the cumulative pollen catch also matched well with the phenological development of the 69 observed male and hermaphrodite ash trees in the plantation. We recorded that 38 (44.2%) of the male or hermaphrodite trees developed flowers in 2019, compared to 58 (67.4%) in 2020. In addition, it was observed that the flowers in 2019 were often not completely developed and were rather stunted. In Emmendingen, the height of the ash trees ranged between 6 and 18 m, with most ash trees varying between 11 and 14 m in height. The average height of the trunk was 2.3 m. Here, the inflorescences were also located over the entire tree crown.
In 2019, the mean March–April temperature was 10 °C. During the measurement campaign, we registered precipitation on 27 days out of 59 (sum: 125 mm, Figure 8a,b). Thus, this location received substantially more precipitation during the measurement campaign than Schorndorf. As in Schorndorf, the lowest temperatures (minimum −2.6 °C) were measured on the 20 and 21 March. The onset of flowering and pollen release (BBCH 60 + 61) was observed on 26 March on eight ash trees. In the pre-pollen season (18 March–9 April), a mean temperature of 8.3 °C was reached, and temperatures rose constantly until 2 April. However, this was followed by a temperature decrease and substantially more precipitation. The onset of rainy episodes affects the beginning of pollen release, which can be clearly seen in the fluctuations of the curve for stage BBCH 60/61. The first observation of full flowering (BBCH 65) was on the 2 April on six ash trees. This stage reached its peak between 9 April and 23 April, which again corresponds well with our classification of the pollen seasons. The maximum temperature (20 April and 24 April: 25.6 °C) during the measurement campaign was also reached in this period. On 30 April, 87% of the ash trees had reached BBCH stage 68. During the post-pollen season (23 April–14 May) precipitation was especially high (62.4 mm). At the end of the measurement campaign, only one ash tree was still in flower.
In 2020, the average March–April temperature was 11 °C (+1 °C compared to 2019). The sum of precipitation during the measurement campaign was 13.7 mm (−111.3 mm) on a total of 9 days out of 52 (Figure 8d). On the 11 March, two flowering ash trees were observed at BBCH stage 60/61 and one at stage 65 (Figure 8c). At this time, a maximum temperature of 17.2 °C was measured. A week later, on 17 March, 22 ash trees began to release pollen, eight ash trees were in full flower, and the one that was already in full flower on 11 March was in the end of its flowering and pollen release. Between 17 March and 3 April, the beginning of pollen release could be detected in most of the ash trees. The full flowering (BBCH 65) reached its maximum values between 20 March and 17 April. This coincides well with the peak of the pollen catch. Between 20 March and 27 April, 26 ash trees were at stage BBCH 60/61 and 14 at stage BBCH 65. The interruption around 3 April was confirmed both by pollen data and phenology. At this time, the lowest temperatures (31 March: −5.1 °C; 2 April: −3.2 °C) were measured. After that, the temperature increased and there was no precipitation. Between 10 April and 17 April, eight trees were still at stage BBCH 60/61 and 18 at stage BBCH 65. By 24 April, only two ash trees could still be associated to stage 68. In addition, precipitation resumed from the 26 April onwards. During the post-pollen season, a precipitation sum of 34.1 mm were recorded.
3.2.2. Pollen Catch at the Four Traps
For a comprehensive overview, Figure 9 illustrates the results related to the study site Emmendingen of the pollen measurements demerged for each pollen trap.
Analyzing pollen data for single traps in detail, we found that in 2019, the highest total pollen catch was measured at the two outermost pollen traps, trap 1 (23.1%) and 6 (18.9%), situated 400 m west and 500 m east of the center of the pollen source, respectively. Trap 3, located within the plantation, had a percentage of 15.4%, while trap 5, situated 300 m to the east of the central point of the plantation, had the lowest percentage of 11.6%. Pollen traps 2 and 4, situated 200 m west and east of the pollen source center, had 16.6% and 14.4%, respectively. In contrast, in 2020, most pollen was caught at pollen trap 3 (32.3%), located in the center of the plantation. The lowest pollen catch was found in the most distant pollen traps. Thus, traps 1, 5, and 6 each had only about 12% of the total pollen count.
In 2020, we additionally compared pollen deposition (horizontal slides) for the traps at 1.5 m height and 5.0 m height. It is interesting that the total pollen deposition of all traps placed at 5 m height (5035 pollen grains/cm2) showed only slight differences compared to the traps placed at 1.5 m height (4863 pollen grains/cm2). For both heights, the highest amount of pollen was registered within the plantation (trap 3, 1.5 m: 40.1%; 5.0 m: 41.4%) and the lowest at trap 5 (1.5 m: 9.5%; 5.0 m: 9.3%). However, there was a huge temporal difference. For example, at a height of 1.5 m, trap 3 already showed very high values between 15 March and 17 March (380 pollen grains/cm2), but at a height of 5 m, only 116 pollen grains/cm2 were registered. However, this reversed in the period between 17 March and 20 March, where 681 pollen grains/cm2 were detected at 5 m height, and only 335 pollen grains/cm2 at 1.5 m height. This temporal shift was also obvious when focusing on the peak dates of single traps (Table 3).
In Emmendingen, the main wind directions measured at the climate station in the center of the plantation were west (17%), east (16%), and northeast (12%) (Figure A5). The main wind directions recorded by the anemometers located to the west (hereafter Aero1; Figure A6) and east to the plantation (hereafter Aero2; Figure A7) were also west (Aero1: 23%; Aero2 46%). Westerly winds were also mostly prevailing when splitting for different seasons, only during the pre-pollen season, the wind was mainly from the east. Regarding aerobiological data, most pollen came from the north (37.5%) and west (27.5%). At pollen trap 1, located west of the plantation, the highest pollen impaction was found in the north (31.1%) and in the south (31.3%). Splitting between different seasons, it was obvious that the northern impaction occurred mainly in the main pollen season, and the southern impaction was mainly in the post-pollen season. Trap 2 also had the highest total pollen impaction in the north (54.9%) and the second highest in the west (20.3%), although a dominance of easterly impaction could be observed in the pre-season. Trap 3 in the plantation had the highest pollen impaction in the north (42.5%), followed by east (25.1%). In this case, the predominant direction was north during the main pollen season and west during the pre- and post-pollen seasons. Traps 4 and 5 had the highest pollen impaction to the west, facing the plantation (trap 3: 35.6%; trap 4: 63.0%). For trap 4, west was the main wind direction in the pre- and post-pollen season, and for trap 5, it was west in the pre- and main pollen seasons. For the most distant pollen trap, trap 6, the highest pollen impaction was recorded in the north (51.0%). It is also remarkable that on the western side facing the plantation, only 36 pollen grains/cm2 (8.3%) were collected. During the main and post-pollen season, north was the predominant wind direction. During the pre-pollen season, only 3 pollen grains/cm2 were registered at pollen trap 6. Detailed plots showing pollen impaction (also for 2020) can be found in the Appendix A (Figure A8 and Figure A9).
In 2020, the dominant wind directions measured at the central climate station were east (18%), northeast (16%), and west (14%) (Figure A10). The main wind directions for Aero1 (west of the plantation; Figure A11) were found to be similar. For Aero2, no data are available for 2020. Based on our data, changes in the direction of local winds occurred more frequently at the plantation in Emmendingen compared to Schorndorf, since the share of main wind directions was considerably lower. This was also indicated by the results of the pollen traps. Averaged for all gravimetric traps, the most pollen came from east (30.5%) and north (27.2%). At trap 1, the highest impaction was recorded in the east (27.9%), facing the plantation. In addition, high values could be registered in the south (26.6%) and west (26.5%). During the pre-pollen season, the dominant direction was south, during the main pollen seasons east and north, and during the post-pollen season west. Trap 2 had the highest pollen impaction in the east (30.7%) and south (26.5%). The dominant directions in different seasons were similar to those of trap 1. Pollen trap 3 showed comparable results to 2019. The highest pollen impaction was registered in the east (42.4%). Again, the dominant side was east in the first main pollen season and north in the second main pollen season. In case of trap 4, the highest pollen impaction was in the west (38.6%), although a dominance of northern impaction could be observed in the main seasons. For trap 5, pollen impaction was highest in the south (36.6%). Split for seasons, the main directions were the same as observed at pollen trap 1 and 2. In the case of trap 6, the highest pollen impaction was observed in the east (39.9%) and north (27.6%). It is also remarkable that on the side facing the plantation in the west, only 11 pollen grains/cm2 (13.3%) were collected. The predominant directions during the pre- and first main pollen season were east, the predominant direction during the second main season was north, and the predominant direction during the post-pollen season was south.
4. Discussion
4.1. Relationships between Pollen Catch, Phenology, Temperature, and Precipitation
Our results showed a link between temperature, precipitation, the onset of phenological development, and pollen catch. During the period in which the maximum of pollen was caught, most of the trees were in flower. Thus, the temporal pattern of cumulative pollen catch and our classification of the pollen seasons matched well with our phenological observations, and it can also be assumed that during the period with the highest pollen abundance, mainly local pollen was caught. Thus, phenological observations are a good indicator of pollen dispersion at the local scale. Since in 2019, the onset of pollen release could be observed phenologically on the 26 March at both plantations, it is reasonable to assume that pollen that reached the pollen traps before this date was mainly transported from outside the plantation. Similar results were presented by Estrella et al. [43], who detected that the onset of the birch pollen season in Germany occurred on average six days earlier than the onset of the local flowering. This discrepancy can be explained by long- or medium-range transport of pollen [43,44]. Such an effect was not noticeable in the stronger pollen year 2020 since pollen was only measured after the first open flower could be observed in the plantation. Although we focused only on two years, our results highlight a sequence of a pollen poor and a pollen rich year. Together with the number of flowering trees and the amount of pollen captured, this points to a resting phase at both plantations in 2019. Gassner et al. [2] noted that there are mast and rest years not only in terms of ash seed production, but also in pollen production. Their pollen analyses showed years with very low pollen concentrations at various sites in Switzerland, followed by years with very high values. Mast years were observed in every second to fourth year, and years with low pollen concentrations occurred synchronously at all study sites in Switzerland. This synchrony coincides with our observations since both seed plantations were associated with a substantial increase of flowers and pollen in 2020.
Average temperature in the months prior to flowering is the most important factor in explaining spring phenological onset dates [44,45,46]. The rise in temperatures at the end of March 2019 matched well with the start of pollen release, and in the warmer season of 2020, the pollen release started one week earlier than in 2019. The highest pollen catch was measured when temperatures increased above 20 °C. Conversely, it became clear that a drop in temperature is the main reason for a standstill in phenological development, and that this had an immediate impact on pollen catch; for example, during the main pollen season in Emmendingen around 3 April 2020. Temperature is a determining factor for flower growth and development [44,47]. Spatially different temperatures across landscapes which can also occur within small distances [48] can result in a much earlier or later start of the ash pollen season, which could, in case of fragmentation, lead to a failure of pollination as the flowers of the individual ash populations may not mature synchronously.
Precipitation can have an influence on pollen release and concentration [47]. We found that the onset of rain was often linked to temperature decreases, causing a decline in the pollen catch. On the other hand, it was noticed that the onset of rain was associated with an increase in the pollen catch at the end of March in Emmendingen in 2019. In general, the impact of raindrops can also cause a vibration, which lifts pollen inside the flowers or already accumulated on surrounding surfaces such as leaves [49]. Light precipitation during the measurement campaigns had therefore, on the other hand, a minor influence on the weekly pollen catch. High precipitation sums at the end of April 2019 and 2020 were linked to a decrease of captured pollen at both plantations. Thus, rain probably also removed pollen from the atmosphere at the end of the season.
Since in our study, pollen data were only available as a weekly sum, a direct relationship with meteorological conditions, especially precipitation events of a finer temporal resolution, cannot be investigated. Methodologically, it should also be noted that the phenological observations were made only on a weekly basis. In 2019, it was observed that the flowers often did not fully develop and were partially stunted. Therefore, further research should include information on tree specific pollen production. Moreover, an excessive flowering due to an increased damage of trees related to the “forest dieback” in the 1980s was already recognized. In this regard, Gassner et al. [2] suggested that an infection by the invasive fungus Hymenoscyphus fraxineus may enhance pollen emission, at least temporarily, as stress symptoms could lead to increased flowering in affected trees. Further research should assess estimations on the pollen production of healthy and affected trees along with an investigation on the viability of ash pollen, which is crucial for pollination success. In addition, a comparison between aerobiological studies and DNA based parental analyses may give important information on the effective gene flow of the endangered ash.
4.2. Estimation of Pollen Transport Distances
Our results showed that the distance over which pollen can be transported depends on various factors. In general, wind is the main factor responsible for the dispersal of pollen [47]. We also revealed a link between wind direction and pollen catch. In many cases, the cardinal direction associated with the highest possible pollen impaction was also identical with the predominant wind direction. For example, high concentrations of ash pollen in Emmendingen 2020 were transported from easterly and westerly directions, which coincided with the prevailing wind directions. Exceptions were found for example in Schorndorf. These can be explained on the one hand by the formation of cold air flows, and on the other hand by the location of the climate stations (within the plantation) that restricts information of the regional wind. Therefore, we included the climate stations of the DWD (Schorndorf: station “Kaisersbach-Cronhütte”) located in the vicinity and found a better coherence with the prevailing regional wind direction. We demonstrated that the topography of the terrain (i.e., the inclination of the slope) favors the formation of cold air flows, which are able to move pollen following the gradient to pollen trap 4, 450 m away from the center of the plantation. At this measuring site, we found especially high quantities in 2019 (31% of the pollen catch). Pollen trap 1, placed 150 m apart from the plantation, received only very small amounts of pollen in both years. In this case, the wind was hardly directed from the west and mainly from the south and southeast.
In addition, pollen deposition at the Emmendingen plantation, which is located on a flat plain, was also influenced by winds. In 2019, the highest pollen catch was measured at the two outermost pollen traps. Therefore, it cannot be ruled out that pollen from neighboring ash trees might have contributed to higher values on the edge of the study area. This might be especially the case for pollen trap 6, as further ash trees were identified in the forested area northeast of the trap, and the third most common wind direction during the measurement campaign was northeast. Furthermore, the proportion of trapped pollen was less than 10% for traps 4 and 5, located in the east of the plantation. Since there is a dense edge planting on the east side of the plantation, it can be assumed that pollen dispersal is partially blocked. Adams-Groom et al. [30] also found that pollen dispersal within a forest is more limited. In 2020, pollen catch and deposition at the traps located furthest away from the plantation was much lower than compared to the trap within the plantation, so we concluded a considerable decrease in pollen amount with distance. At a distance of 200 m, there was already ca. 50% less pollen deposited. Semizer-Cuming et al. [20], who studied DNA-based pollen transport in ash trees, reported that 50% of ash pollen flew within 140 m and only 5% of pollen farther than 1.3 km. This coincides with our study; however, a finer temporal resolution of the aerobiological data would allow more detailed information on the relationship between pollen and wind.
Another factor was the height of the pollen source in relation to the pollen trap. Pollen traps within the plantations were linked to a lower amount of pollen in 2019 than in 2020. This can be related to the fact that in the weaker pollen year flowers developed mainly in the tops of the tree canopies indicating that pollen was probably carried over the pollen trap. This is also supported by the fact that Fraxinus spp. pollen, which has a small diameter of about 20–26 µm and a circular to triangular convex shape [50], can be lifted and transported even at low wind speeds. In order to get closer to the pollen source, additional pollen traps were set up to determine pollen deposition at a height of 5 m in Emmendingen in 2020. We have assumed to measure on average higher quantities at the elevated traps. However, our results showed that the deposition sums did not differ considerably. Although our data only provided weekly averages, we documented substantial temporal differences. Inside the plantation, the peak was reached first at the higher trap; outside the plantation, it was reached at the latest sampling week. Therefore, we conclude that pollen availability at various heights is different and pollination efficiency also varies according to this respective availability. In general, and depending on turbulences, pollen is firstly moved upward from the source and then advectively away with the wind, but begins to sink a few meters from the source [30,51]. This may account for the fact that the highest pollen catch was not registered within the plantation in 2019 at both plantations.
5. Conclusions
The ongoing fragmentation of ash populations will be associated with a decrease in the possibility of effective pollination. This means that the planting density and distance between preferably healthy ash trees are essential and contribute to the exchange of genetic material between trees. Additionally, the results of the study showed a link between pollen transport and meteorology, the onset of phenological development, and the topography of the plantation. For example, we suggest that the slope and associated night-time air movement at the plantation in Schorndorf could be a factor contributing to higher pollen levels at the traps located in the west. In 2019, the low pollen year, the highest total pollen catch was measured outside of plantations. In 2020, the pollen-rich year, the highest total pollen catch was measured within the plantations. This indicates, in the lower pollen year, a potential higher contribution of trees from outside the plantation, and thus it can be recommended that seed harvesting of ash trees in the plantations should preferentially take place in full mast years.
However, to fully understand the dispersion of ash pollen, further studies should consider a finer temporal resolution and more detailed measurements at different heights. Since effective pollination is also dependent on pollen viability, there is a need to incorporate studies on the decrease of viability during long-range transport, which has the potential to pollinate ash trees further away. For this purpose, artificial pollination in different time sequences could be used.
In general, we found that ash pollen was transported over a distance greater than 400 m, but the amount of pollen decreased substantially with increasing distance. At a distance of 200 m, there was already approx. 50% less pollen captured from the air. Nevertheless, even at a distance of 500 m, more than 10% of the pollen was still captured. In order to ensure cross-pollination of healthy ash trees, the distance of ash individuals or stands should not be too large, and there should be no spatial separation (e.g., by conifer stands).
The results obtained from our study are helpful for forestry and seed plantation management and valuable for assessing the future impacts of gene flow in increasingly fragmented ash populations.
Author Contributions
Conceptualization, S.J.-O.; methodology, S.J.-O., A.-K.E., B.F. and B.Š.; software, A.-K.E.; validation, S.J.-O., A.-K.E., B.F. and B.Š.; formal analysis, A.-K.E.; investigation, A.-K.E.; resources, S.J.-O. and A.-K.E.; data curation, A.-K.E.; writing—original draft preparation, A.-K.E.; writing—review and editing, A.-K.E., S.J.-O., B.F. and B.Š.; visualization, A.-K.E.; supervision, S.J.-O.; project administration, S.J.-O.; funding acquisition, S.J.-O. All authors have read and agreed to the published version of the manuscript.
Funding
This research was funded by the Bavarian State Ministry of Food, Agriculture, and Forestry through the Bavarian State Institute for Forests and Forestry (LWF) as part of the project “P035–Quo vadis Pollen? Untersuchungen zur (effektiven) Pollenausbreitung und Pollen- und Samenqualität als Beitrag zur Generhaltung bei der Esche“. The open access publication of this article was supported by the Open Access Fund of the Catholic University Eichstätt-Ingolstadt.
Institutional Review Board Statement
Not applicable.
Informed Consent Statement
Not applicable.
Data Availability Statement
Not applicable.
Acknowledgments
We thank Johann Gesell, Georgia Kahlenberg, Johanna Jetschni, Nadine Gebhardt, Verena Wiethüchter, Sabine Fürst, Sophia Große, Lisa Hutzler, Lena Holzapfel, Fabian Dremel, Johanna Weidendorfer, Selina Tönnes, Anja Eisen, Gerhard Eisen, and Stephan Maxant for technical assistance. In addition, we thank Forst Baden-Württemberg and Forstliche Versuchs- und Forschungsanstalt Baden-Württemberg for providing the seed plantations as study sites.
Conflicts of Interest
The authors declare no conflict of interest. The funders had no role in the design of the study; in the collection, analyses, or interpretation of data; in the writing of the manuscript; or in the decision to publish the results.
Appendix A

Table A1.
Plantation tree information.
| 1992/1995 | 2019 | 2020 | ||
|---|---|---|---|---|
| Schorndorf | Number of clones | 68 | 36 | 36 |
| Number of ash trees | 416 | 120 | 120 | |
| Thereof female | 288 | 51 | 51 | |
| Thereof male | 128 | 54 | 54 | |
| Thereof hermaphrodite | included in the category “female” | 15 | 15 | |
| Thereof healthy ash trees | 33% | 27% | ||
| Thereof damaged ash trees | 67% | 73% | ||
| Emmendingen | Number of clones | 49 | 32 | 32 |
| Number of ash trees | 228 | 86 | 86 | |
| Thereof female | NA | 17 | 17 | |
| Thereof male | NA | 49 | 49 | |
| Thereof hermaphrodite | NA | 20 | 20 | |
| Thereof healthy ash trees | 52% | 38% | ||
| Thereof damaged ash trees | 58% | 62% |
Figure A1.
Wind rose during the measurement campaign in 2019 at the location Schorndorf for the periods (a) total: 18.03–14.05, (b) pre-flowering: 18.03–02.04, (c) main flowering: 02.04–23.04, (d) post-flowering: 23.04–14.05.
Figure A1.
Wind rose during the measurement campaign in 2019 at the location Schorndorf for the periods (a) total: 18.03–14.05, (b) pre-flowering: 18.03–02.04, (c) main flowering: 02.04–23.04, (d) post-flowering: 23.04–14.05.

Figure A2.
Wind rose during the measurement campaign in 2020 at the location Schorndorf for the periods (a) total: 18.03–13.05, (b) pre-flowering: 18.03–25.03, (c) main flowering: 25.03–22.04, (d) post-flowering: 22.04–13.05.
Figure A2.
Wind rose during the measurement campaign in 2020 at the location Schorndorf for the periods (a) total: 18.03–13.05, (b) pre-flowering: 18.03–25.03, (c) main flowering: 25.03–22.04, (d) post-flowering: 22.04–13.05.

Figure A3.
Pollen impaction (pollen grains/cm2) on the vertical slides in 2019 for the pollen seasons; pre-pollen season: 18.03–02.04 (green), main pollen season: 02.04–23.04 (pink), post-pollen season: 23.04–14.05 (brown) and total (blue). For pollen traps 1 (a), 2 (b), 3 (c) and 4 (d) at the location Schorndorf.

Figure A4.
Pollen impaction (pollen grains/cm2) on the vertical slides in 2020 for the pollen seasons: pre-pollen season: 18.03–02.04 (green), main pollen season: 02.04–23.04 (pink), post-pollen season: 23.04–14.05 (brown) and total (blue). For pollen traps 1 (a), 2 (b), 3 (c) and 4 (d) at the location Schorndorf.
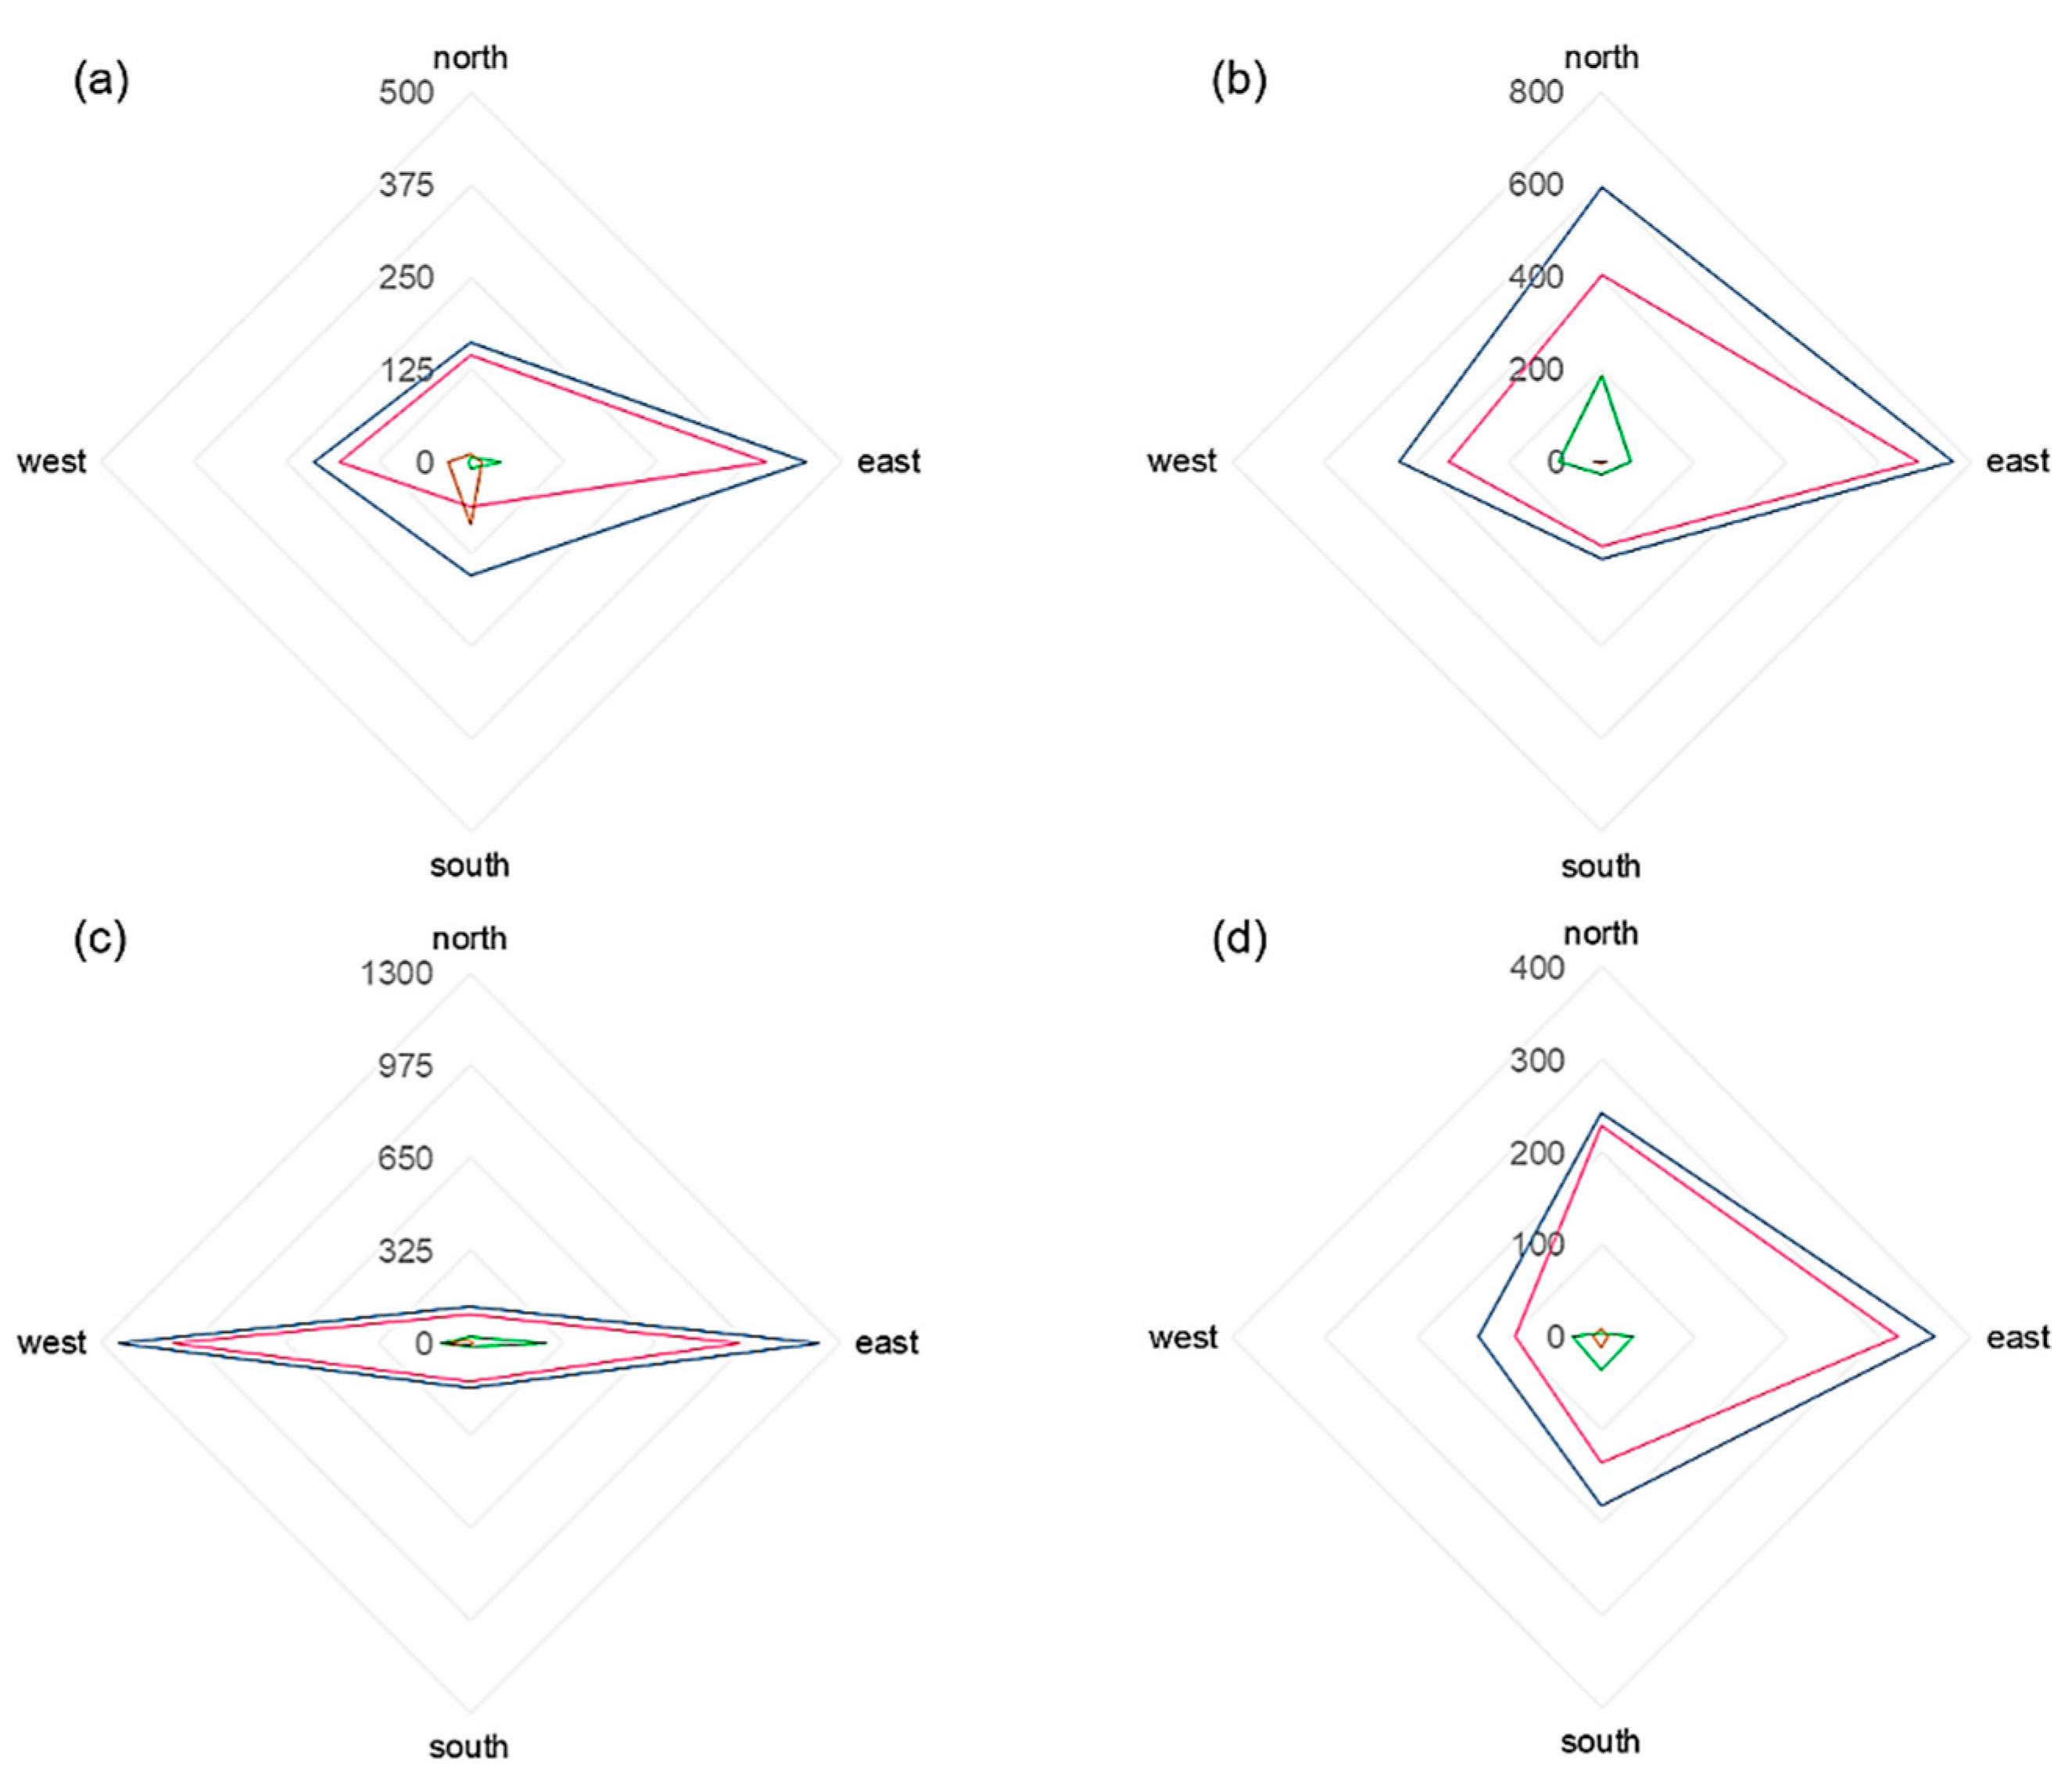
Figure A5.
Wind rose from climate station during the measurement campaign in 2019 at the location Emmendingen for the periods (a) total: 18.03–14.05, (b) pre-flowering: 18.03–09.04, (c) main flowering: 09.04–23.04, (d) post-flowering: 23.04–14.05.
Figure A5.
Wind rose from climate station during the measurement campaign in 2019 at the location Emmendingen for the periods (a) total: 18.03–14.05, (b) pre-flowering: 18.03–09.04, (c) main flowering: 09.04–23.04, (d) post-flowering: 23.04–14.05.

Figure A6.
Wind rose from Aero 1 during the measurement campaign in 2019 at the location Emmendingen for the periods (a) total: 18.03–14.05, (b) pre-flowering: 18.03–09.04, (c) main flowering: 09.04–23.04, (d) post-flowering: 23.04–14.05.
Figure A6.
Wind rose from Aero 1 during the measurement campaign in 2019 at the location Emmendingen for the periods (a) total: 18.03–14.05, (b) pre-flowering: 18.03–09.04, (c) main flowering: 09.04–23.04, (d) post-flowering: 23.04–14.05.
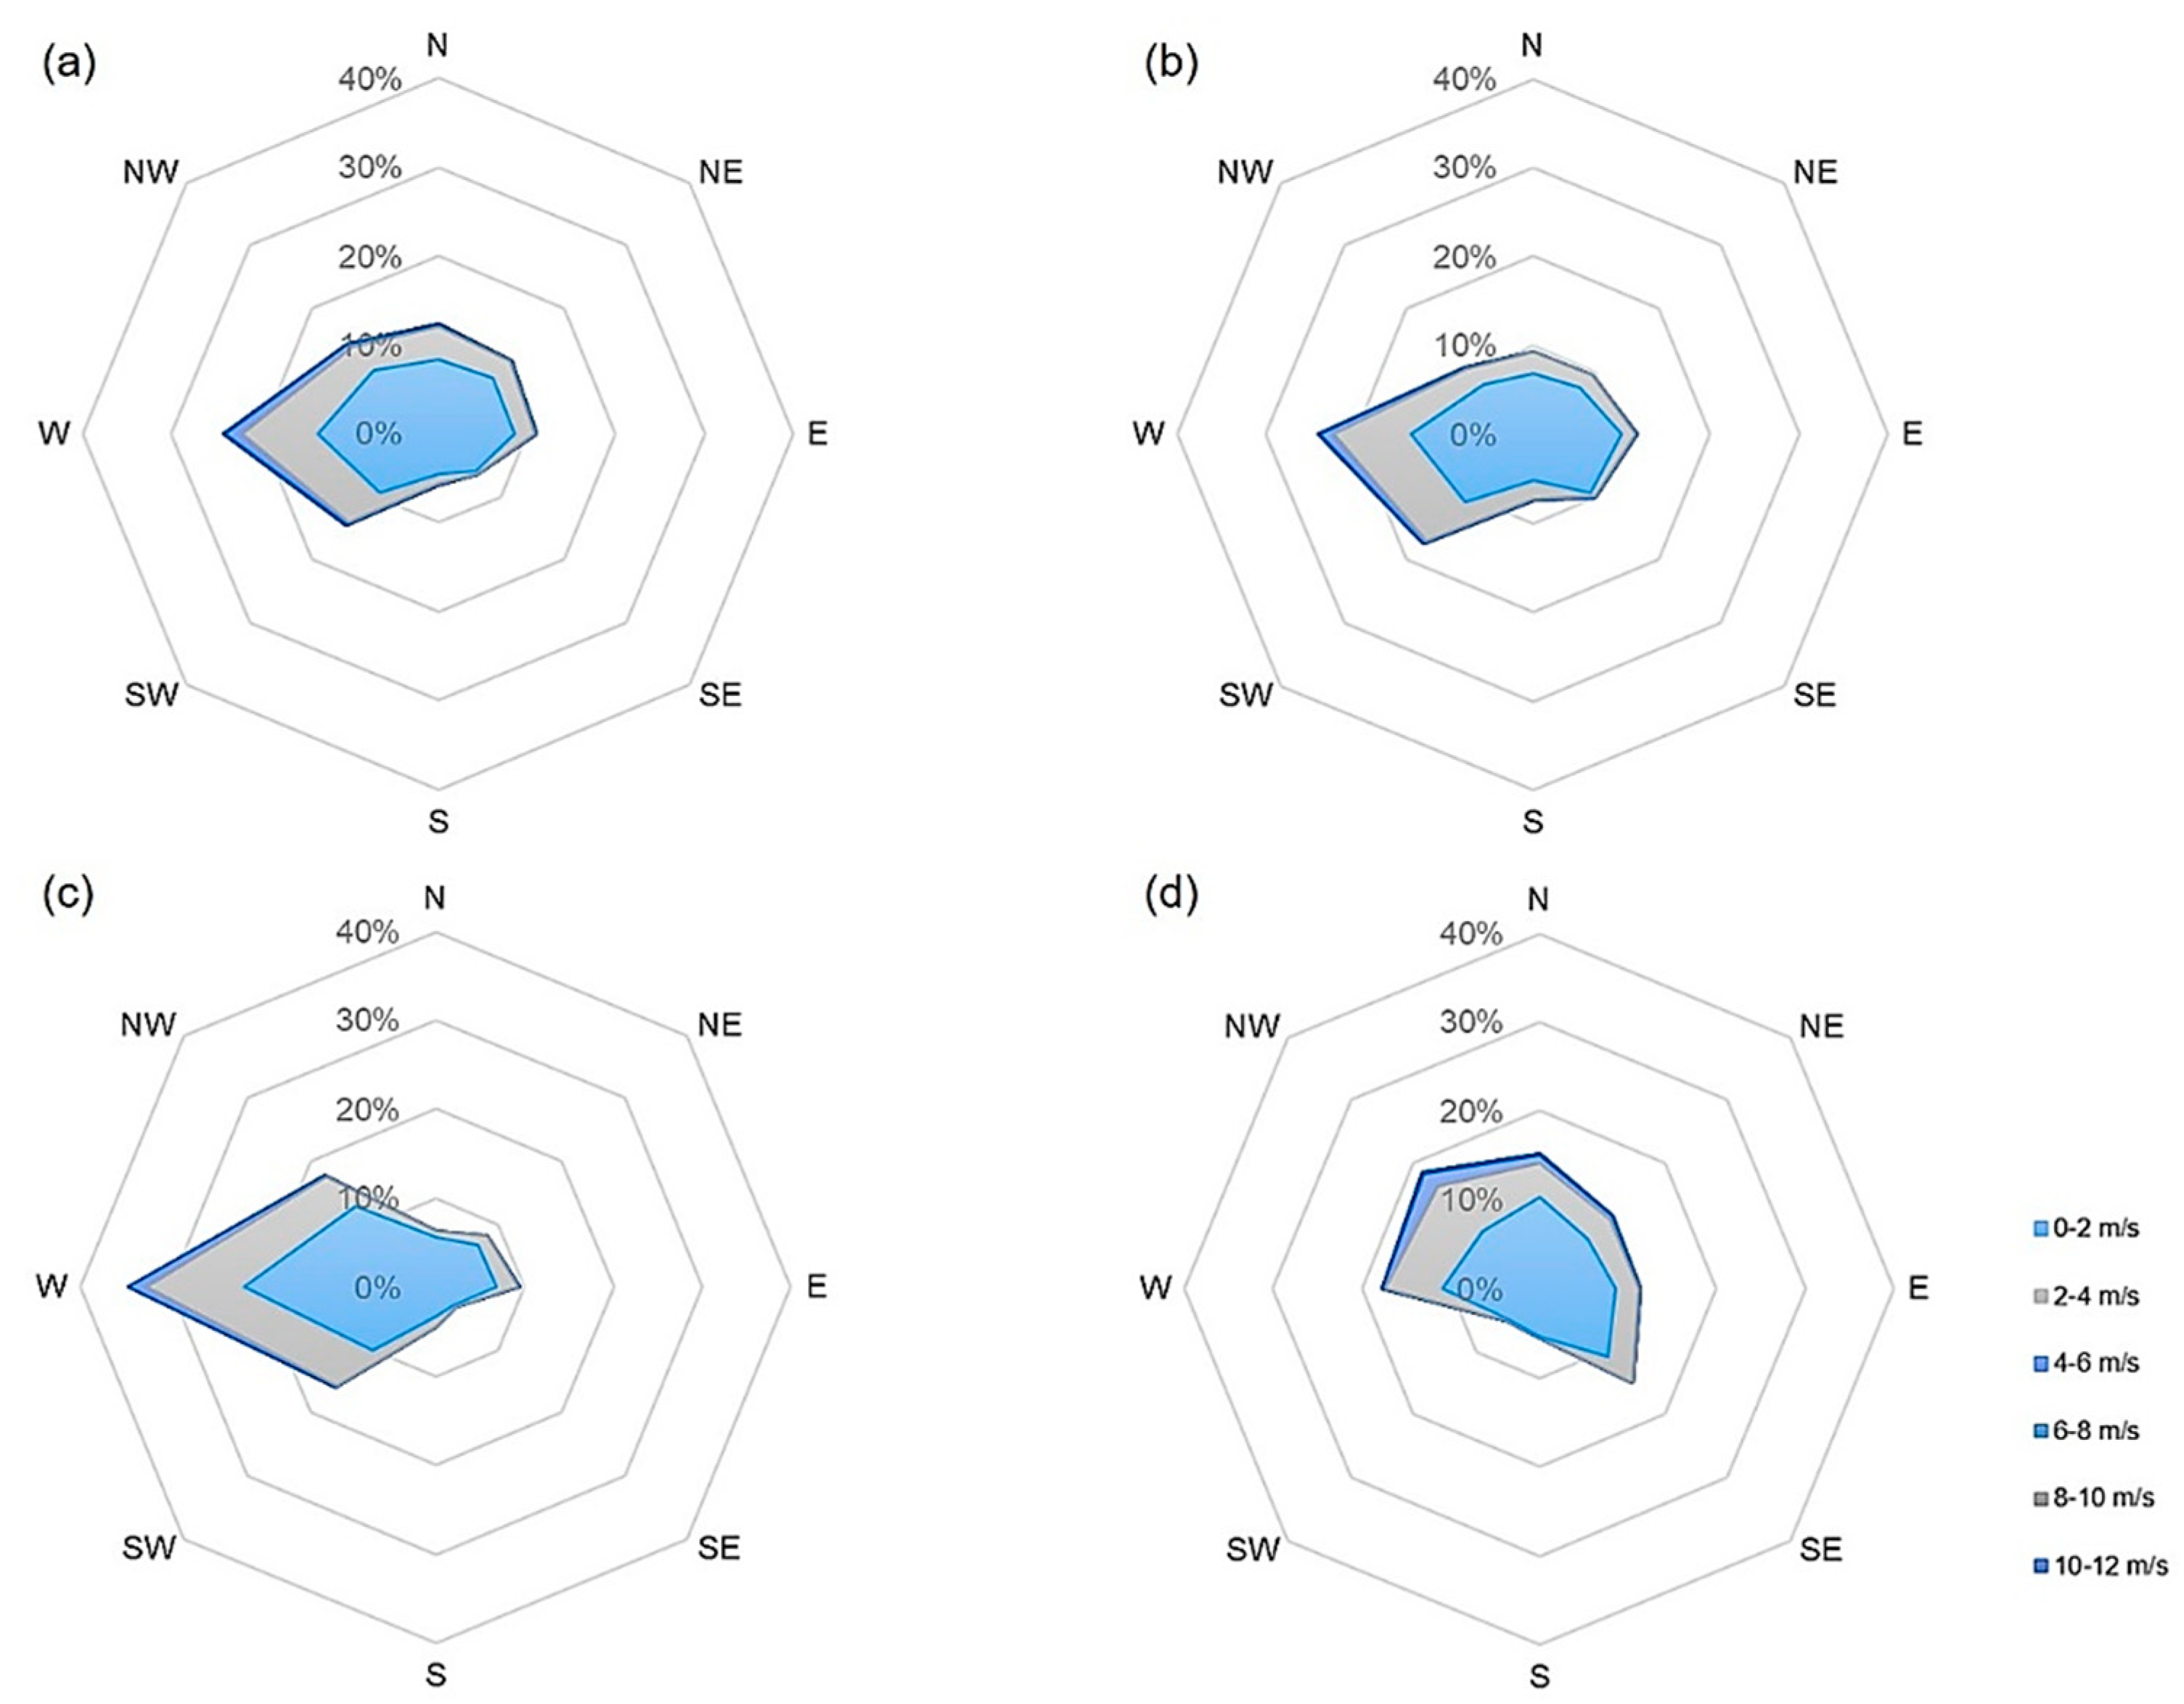
Figure A7.
Wind rose from Aero 2 during the measurement campaign in 2019 at the location Emmendingen for the periods (a) total: 18.03–14.05, (b) pre-flowering: 18.03–09.04, (c) main flowering: 09.04–23.04, (d) post-flowering: 23.04–14.05.
Figure A7.
Wind rose from Aero 2 during the measurement campaign in 2019 at the location Emmendingen for the periods (a) total: 18.03–14.05, (b) pre-flowering: 18.03–09.04, (c) main flowering: 09.04–23.04, (d) post-flowering: 23.04–14.05.

Figure A8.
Pollen impaction (pollen grains/cm2) on the vertical slides in 2019 for the pollen seasons: pre-pollen season: 18.03–09.04 (green), main pollen season: 09.04–23.04 (pink), post-pollen season: 23.04–14.05 (brown) and total (blue). For pollen traps 1 (a), 2 (b), 3 (c), 4 (d), 5 (e) and 6 (f) at the location Emmendingen.

Figure A9.
Pollen impaction (pollen grains/cm2) on the vertical slides in 2020 for the pollen seasons: pre-pollen season: 11.03–17.03 (green), first main pollen season: 17.03–27.03 (pink), interruption: 27.03–03.04 (light blue), second main pollen season: 03.04–17.04 (purple), post-pollen season: 17.04–01.05 (brown) and total (dark blue).For pollen traps 1 (a), 2 (b), 3 (c), 4 (d), 5 (e) and 6 (f) at the location Emmendingen.

Figure A10.
Wind rose from climate station during the measurement campaign in 2020 at the location Emmendingen for the periods (a) total: 11.03–01.05, (b) pre-flowering: 11.03–17.03, (c) main flowering: 17.03–17.04, (d) post-flowering: 17.04–01.05.
Figure A10.
Wind rose from climate station during the measurement campaign in 2020 at the location Emmendingen for the periods (a) total: 11.03–01.05, (b) pre-flowering: 11.03–17.03, (c) main flowering: 17.03–17.04, (d) post-flowering: 17.04–01.05.

Figure A11.
Wind rose from Aero1 during the measurement campaign in 2020 at the location Emmendingen for the periods (a) total: 11.03–01.05, (b) pre-flowering: 11.03–17.03, (c) main flowering: 17.03–17.04, (d) post-flowering: 17.04–01.05.
Figure A11.
Wind rose from Aero1 during the measurement campaign in 2020 at the location Emmendingen for the periods (a) total: 11.03–01.05, (b) pre-flowering: 11.03–17.03, (c) main flowering: 17.03–17.04, (d) post-flowering: 17.04–01.05.

References
- Heuertz, M.; Fineschi, S.; Anzidei, M.; Pastorelli, R.; Salvini, D.; Paule, L.; Frascaria-Lacoste, N.; Hardy, O.J.; Vekemans, X.; Vendramin, G.G. Chloroplast DNA variation and postglacial recolonization of common ash (Fraxinus excelsior L.) in Europe. Mol. Ecol. 2004, 13, 3437–3452. [Google Scholar] [CrossRef] [PubMed]
- Gassner, M.; Schmid-Grendelmeier, P.; Clot, B. Ash pollen allergy and aerobiology. Allergo. J. Int. 2019, 28, 289–298. [Google Scholar] [CrossRef] [Green Version]
- Enderle, R.; Fussi, B.; Lenz, H.D.; Langer, G.; Nagel, R.; Metzler, B. Ash Dieback in Germany: Research on Disease Development, Resistance and Management Options. In Dieback of European Ash (Fraxinus spp.): Consequences and Guidelines for Sustainable Management; Vasaitis, R., Enderle, R., Eds.; European Cooperation in Science & Technology (COST): Uppsala, Sweden, 2017; pp. 89–105. ISBN 978-91-576-8696-1. [Google Scholar]
- Hultberg, T.; Sandström, J.; Felton, A.; Öhman, K.; Rönnberg, J.; Witzell, J.; Cleary, M. Ash dieback risks an extinction cascade. Biol. Conserv. 2020, 244, 108516. [Google Scholar] [CrossRef]
- Jochner-Oette, S.; Rohrer, T.; Eisen, A.-K.; Tönnes, S.; Stammel, B. Influence of Forest Stand Structure and Competing Understory Vegetation on Ash Regeneration—Potential Effects of Ash Dieback. Forests 2021, 12, 128. [Google Scholar] [CrossRef]
- Metzler, B.; Enderle, R.; Karopka, M.; Töpfner, K.; Aldinger, E. Development of Ash dieback in a provenance trial on different sites in southern Germany. Allg. Forst-Und Jagdztg. 2012, 183, 168–180. [Google Scholar]
- McKinney, L.V.; Nielsen, L.R.; Collinge, D.B.; Thomsen, I.M.; Hansen, J.K.; Kjaer, E.D. The ash dieback crisis: Genetic variation in resistance can prove a long-term solution. Plant Pathol. 2014, 63, 485–499. [Google Scholar] [CrossRef]
- Enderle, R. An overview of ash (Fraxinus spp.) and the ash dieback disease in Europe. CAB Rev. 2019, 14, 1–12. [Google Scholar] [CrossRef] [Green Version]
- Kowalski, T.; Holdenrieder, O. Pathogenicity of Chalara fraxinea. For. Pathol. 2009, 39, 1–7. [Google Scholar] [CrossRef]
- Timmermann, V.; Børja, I.; Hietala, A.M.; Kirisits, T.; Solheim, H. Ash dieback: Pathogen spread and diurnal patterns of ascospore dispersal, with special emphasis on Norway. EPPO Bull. 2011, 41, 14–20. [Google Scholar] [CrossRef]
- Pautasso, M.; Aas, G.; Queloz, V.; Holdenrieder, O. European ash (Fraxinus excelsior) dieback—A conservation biology challenge. Biol. Conserv. 2013, 158, 37–49. [Google Scholar] [CrossRef]
- Rigling, D.; Hilfiker, S.; Schöbel, C.; Meier, F.; Engesser, R.; Scheidegger, C.; Stofer, S.; Senn-Irlet, B.; Queloz, V. Das Eschentriebsterben. Biologie, Krankheitssymptome und Handlungsempfehlungen. Merkbl. Für Die Prax. 2016, 57, 1–8. [Google Scholar]
- Gross, A.; Holdenrieder, O.; Pautasso, M.; Queloz, V.; Sieber, T.N. Hymenoscyphus pseudoalbidus, the causal agent of European ash dieback. Mol. Plant Pathol. 2014, 15, 5–21. [Google Scholar] [CrossRef] [PubMed]
- Pliūra, A.; Bakys, R.; Suchockas, V.; Marčiulynienė, D.; Gustienė, A.; Verbyla, V.; Lygis, V. Ash dieback in Lithuania: Disease history, research on impact and genetic Ash dieback in Lithuania: Disease history, research on impact and genetic variation in disease resistance, tree breeding and options for forest management. In Dieback of European Ash (Fraxinus spp.):, Consequences and Guidelines for Sustainable Management; Vasaitis, R., Enderle, R., Eds.; European Cooperation in Science & Technology (COST): Uppsala, Sewden, 2017; pp. 150–165. ISBN 978-91-576-8696-1. [Google Scholar]
- ForstBW. Herausforderung Eschentriebsterben: Waldbauliche Behandlung Geschädigter Eschenbestände, Stuttgart. 2018. Available online: https://www.forstbw.de/fileadmin/forstbw_infothek/forstbw_praxis/ForstBW_Praxis_Eschentriebsterben_20180327.pdf (accessed on 29 November 2021).
- Lygis, V.; Bakys, R.; Gustiene, A.; Burokiene, D.; Matelis, A.; Vasaitis, R. Forest self-regeneration following clear-felling of dieback-affected Fraxinus excelsior: Focus on ash. Eur. J. For. Res. 2014, 133, 501–510. [Google Scholar] [CrossRef]
- Heinze, B.; Tiefenbacher, H.; Litschauer, R.; Kirisits, T. Ash dieback in Austria—history, current situation and outlook. In Dieback of European Ash (Fraxinus spp.): Consequences and Guidelines for Sustainable Management; Vasaitis, R., Enderle, R., Eds.; European Cooperation in Science & Technology (COST): Uppsala, Sweden, 2017; pp. 33–52. ISBN 978-91-576-8696-1. [Google Scholar]
- Coker, T.L.R.; Rozsypálek, J.; Edwards, A.; Harwood, T.P.; Butfoy, L.; Buggs, R.J.A. Estimating mortality rates of European ash (Fraxinus excelsior) under the ash dieback (Hymenoscyphus fraxineus) epidemic. Plants People Planet 2019, 1, 48–58. [Google Scholar] [CrossRef] [Green Version]
- Fussi, B.; Konnert, M.; Cremer, E. Genfluss in Waldbeständen. LWF Wissen 2014, 74, 22–26. [Google Scholar]
- Semizer-Cuming, D.; Chybicki, I.J.; Finkeldey, R.; Kjær, E.D. Gene flow and reproductive success in ash (Fraxinus excelsior L.) in the face of ash dieback: Restoration and conservation. Ann. For. Sci. 2021, 78, 14. [Google Scholar] [CrossRef]
- Fussi, B.; Enderle, R.; Karopka, M.; Zollner, A.; Baier, R.; Konnert, M. Ansätze zur Resistenzzüchtung gegenüber Eschentriebsterben. AFZ-Der Wald 2016, 71, 18–21. [Google Scholar]
- Bochenek, G.M.; Eriksen, B. First Come, First Served: Delayed Fertilization Does Not Enhance Pollen Competition in a Wind-Pollinated Tree, Fraxinus excelsior L. (Oleaceae). Int. J. Plant Sci. 2011, 172, 60–69. [Google Scholar] [CrossRef] [Green Version]
- Chybicki, I.J.; Burczyk, J. Seeing the forest through the trees: Comprehensive inference on individual mating patterns in a mixed stand of Quercus robur and Q. petraea. Ann. Bot. 2013, 112, 561–574. [Google Scholar] [CrossRef] [Green Version]
- Gleiser, G.; Chybicki, I.J.; González-Martínez, S.C.; Aizen, M.A. Phenological match drives pollen-mediated gene flow in a temporally dimorphic tree. Plant Biol. 2018, 20, 93–100. [Google Scholar] [CrossRef]
- German Forest Reproduction Act, FoVG (2002) In: BGBl. I p.1658. Available online: https://www.gesetze-im-internet.de/fovg/BJNR165800002.html (accessed on 7 February 2022).
- Heuertz, M.; Vekemans, X.; Hausman, J.-F.; Palada, M.; Hardy, O.J. Estimating seed vs. pollen dispersal from spatial genetic structure in the common ash. Mol. Ecol. 2003, 12, 2483–2495. [Google Scholar] [CrossRef] [PubMed]
- Bacles, C.F.E.; Ennos, R.A. Paternity analysis of pollen-mediated gene flow for Fraxinus excelsior L. in a chronically fragmented landscape. Hered. (Edinb) 2008, 101, 368–380. [Google Scholar] [CrossRef] [PubMed] [Green Version]
- Thomasset, M.; Hodkinson, T.R.; Restoux, G.; Frascaria-Lacoste, N.; Douglas, G.C.; Fernández-Manjarrés, J.F. Thank you for not flowering: Conservation genetics and gene flow analysis of native and non-native populations of Fraxinus (Oleaceae) in Ireland. Heredity 2014, 112, 596–606. [Google Scholar] [CrossRef] [PubMed] [Green Version]
- Scheifinger, H.; Belmonte, J.; Buters, J.; Celenk, S.; Damialis, A.; Dechamp, C.; García-Mozo, H.; Gehrig, R.; Grewling, L.; Halley, J.M.; et al. Monitoring, Modelling and Forecasting of the Pollen Season. In Allergenic Pollen: A Review of the Production, Release, Distribution and Health Impacts; Sofiev, M., Bergmann, K.-C., Eds.; Springer: Dordrecht, The Netherlands, 2013; pp. 71–126. ISBN 978-94-007-4880-4. [Google Scholar]
- Adams-Groom, B.; Skjøth, C.A.; Baker, M.; Welch, T.E. Modelled and observed surface soil pollen deposition distance curves for isolated trees of Carpinus betulus, Cedrus atlantica, Juglans nigra and Platanus acerifolia. Aerobiologia 2017, 33, 407–416. [Google Scholar] [CrossRef]
- Šikoparija, B.; Marko, O.; Panić, M.; Jakovetić, D.; Radišić, P. How to prepare a pollen calendar for forecasting daily pollen concentrations of Ambrosia, Betula and Poaceae? Aerobiologia 2018, 34, 203–217. [Google Scholar] [CrossRef]
- Anderson, R.S. Modern pollen rain within and adjacent to two giant sequoia (Sequoiadendrongiganteum ) groves, Yosemite and Sequoia national parks, California. Can. J. For. Res. 1990, 20, 1289–1305. [Google Scholar] [CrossRef]
- Bricchi, E.; Frenguelli, G.; Mincigrucci, G. Experimental results about Platanus pollen deposition. Aerobiologia 2000, 16, 347–352. [Google Scholar] [CrossRef]
- DWD. Deutscher Wetterdienst/German Meteorological Service. Available online: https://www.dwd.de/DE/Home/home_node.html (accessed on 16 December 2021).
- LGRB. LGRB-Kartenviewer:—Layer Bodenkunde: Reliefparameter. Available online: https://maps.lgrb-bw.de/ (accessed on 16 December 2021).
- Lenz, H.; Straßner, L.; Baumann, M.; Baier, U. Boniturschlüssel zur Einstufung der Vitalität von Alteschen. AFZ-Der Wald. 2012, 3, 18–129. [Google Scholar]
- Durham, O.C. The volumetric incidence of atmospheric allergens. J. Allergy 1946, 17, 79–86. [Google Scholar] [CrossRef]
- Jetschni, J.; Jochner-Oette, S. Spatial and Temporal Variations of Airborne Poaceae Pollen along an Urbanization Gradient Assessed by Different Types of Pollen Traps. Atmosphere 2021, 12, 974. [Google Scholar] [CrossRef]
- Meier, U. Entwicklungsstadien Mono-und Dikotyler Pflanzen. BBCH-Monographie, 2nd ed.; Blackwell Wissenschaftsverlag: Berlin, Germany, 2001. [Google Scholar]
- Stakeman, E.C.; Harrar, J.G. Principles of Plant Pathology; Ronald Press: New York, NY, USA, 1957. [Google Scholar]
- Sievers, U. Das Kaltluftabflussmodell KLAM_21: Theoretische Grundlagen, Anwendung und Handhabung des PC-Modells; Selbstverl. des Deutschen Wetterdienstes: Offenbach am Main, Germany, 2005; ISBN 3881484078. [Google Scholar]
- Kossmann, M.; Sievers, U. Klam_21 Drainage Wind Modelling of Wintertime Air Pollution Events in Christchurch, New Zealand. In Proceedings of the 29th International Conference on Alpine Meteorology, Chambéry, France, 4–8 June 2007; Volume 1, pp. 29–32. [Google Scholar]
- Estrella, N.; Menzel, A.; Krämer, U.; Behrendt, H. Integration of flowering dates in phenology and pollen counts in aerobiology: Analysis of their spatial and temporal coherence in Germany (1992–1999). Int. J. Biometeorol. 2006, 51, 49–59. [Google Scholar] [CrossRef] [PubMed]
- Jochner, S.; Ziello, C.; Böck, A.; Estrella, N.; Buters, J.; Weichenmeier, I.; Behrendt, H.; Menzel, A. Spatio-temporal investigation of flowering dates and pollen counts in the topographically complex Zugspitze area on the German–Austrian border. Aerobiologia 2012, 28, 541–556. [Google Scholar] [CrossRef]
- Menzel, A.; Fabian, P. Growing season extended in Europe. Nature 1999, 397, 659. [Google Scholar] [CrossRef]
- Badeck, F.-W.; Bondeau, A.; Böttcher, K.; Doktor, D.; Lucht, W.; Schaber, J.; Sitch, S. Responses of spring phenology to climate change. New Phytol. 2004, 162, 295–309. [Google Scholar] [CrossRef]
- Laaidi, M. Forecasting the start of the pollen season of Poaceae: Evaluation of some methods based on meteorological factors. Int. J. Biometeorol. 2001, 45, 1–7. [Google Scholar] [CrossRef]
- Jochner, S.; Heckmann, T.; Becht, M.; Menzel, A. The integration of plant phenology and land use data to create a GIS-assisted bioclimatic characterisation of Bavaria, Germany. Plant Ecol. Divers. 2011, 4, 91–101. [Google Scholar] [CrossRef]
- Šikoparija, B.; Mimić, G.; Panić, M.; Marko, O.; Radišić, P.; Pejak-Šikoparija, T.; Pauling, A. High temporal resolution of airborne Ambrosia pollen measurements above the source reveals emission characteristics. Atmos. Environ. 2018, 192, 13–23. [Google Scholar] [CrossRef]
- Fægri, K. Textbook of Pollen Analysis, 4th ed.; Knut, F., Peter, E.K., Knut, K., Eds.; Blackburn Press: Caldwell, NJ, USA, 2000; ISBN 1-930665-01-6. [Google Scholar]
- Skjøth, C.A.; Ørby, P.V.; Becker, T.; Geels, C.; Schlünssen, V.; Sigsgaard, T.; Bønløkke, J.H.; Sommer, J.; Søgaard, P.; Hertel, O. Identifying urban sources as cause of elevated grass pollen concentrations using GIS and remote sensing. Biogeosciences 2013, 10, 541–554. [Google Scholar] [CrossRef] [Green Version]
Figure 1.
Study areas: (a) seed plantation near Schorndorf (48°46′ N, 9°25′ E, 420 m a.s.l.), (b) seed plantation near Emmendingen (48°6′ N, 7°52′ E, 209 m a.s.l.) including measurement sites: red circles—gravimetric pollen traps; yellow flags—air temperature and humidity loggers; blue flags—anemometers; blue circle—climate station. Source of the map: Esri, DigitalGlobe, GeoEye, Earthstar Geographics, CNES/Airbus DS, USDA, USGS, AeroGrid, IGN and the GIS User Community.

Figure 2.
Self-constructed gravimetric pollen trap of the Durham type.
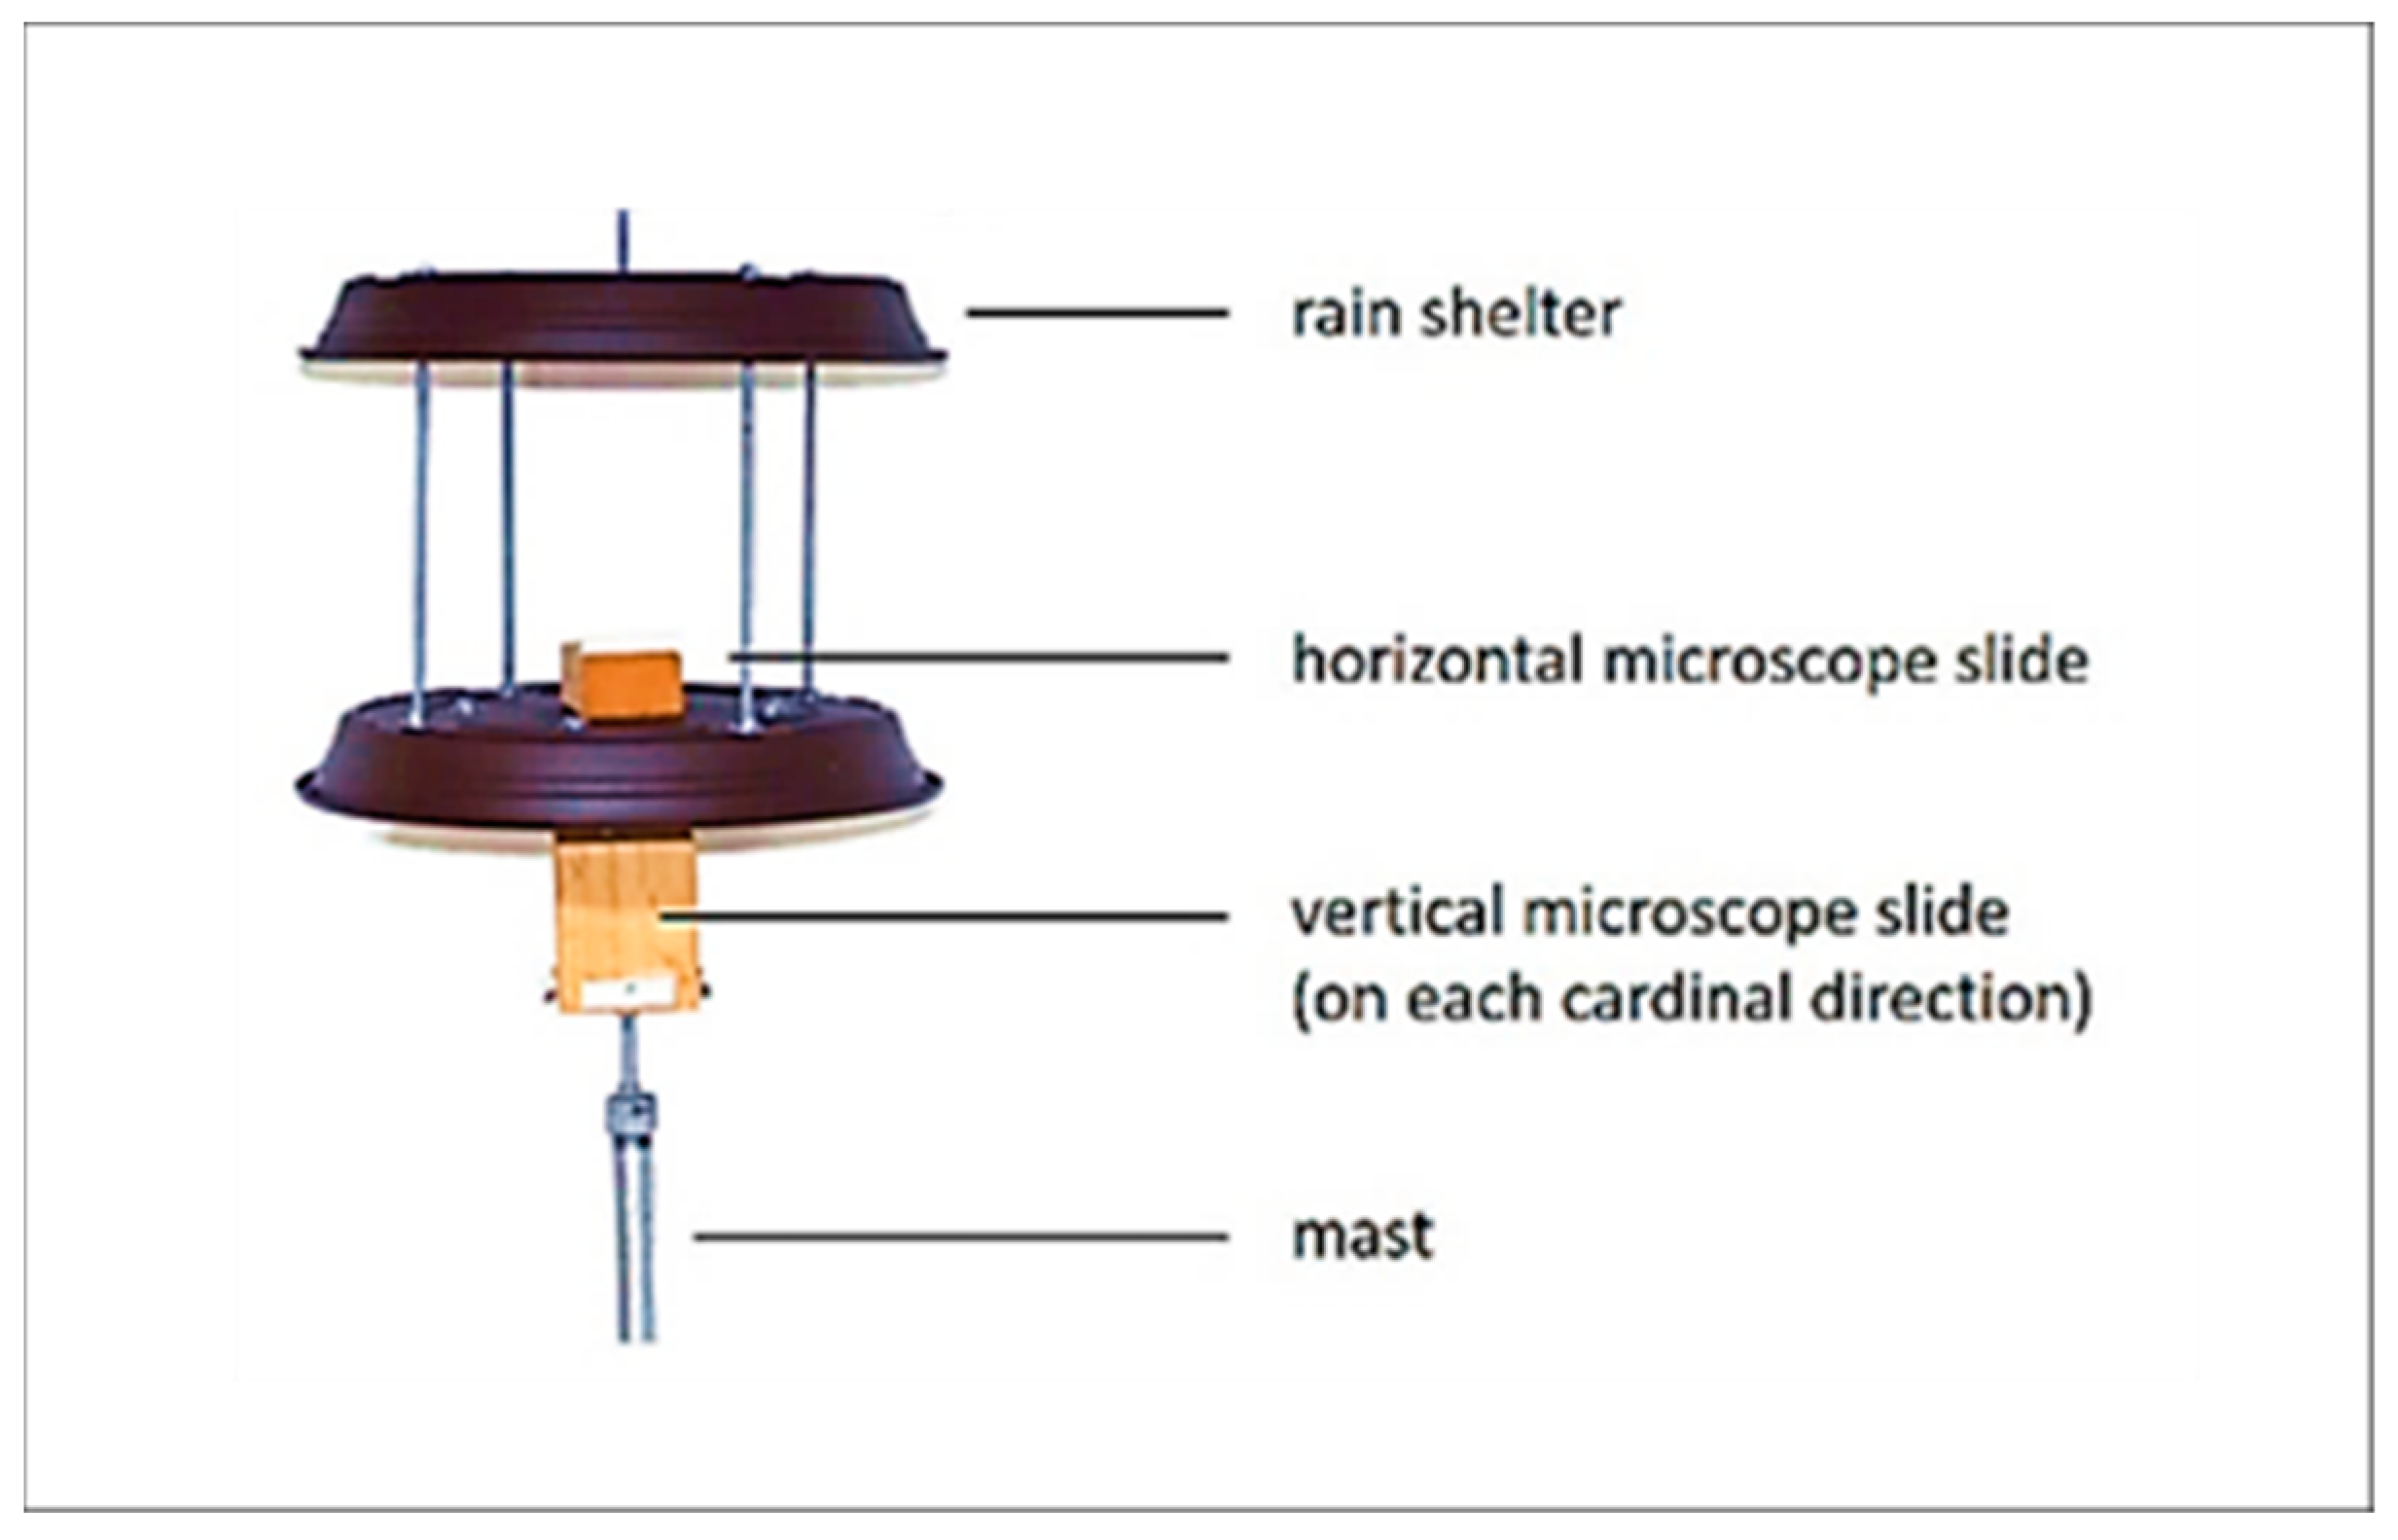
Figure 3.
Weekly pollen catch (pollen grains/cm2) presented with a logarithmic scale on the y-axis for horizontal and vertical slides attached at four pollen traps for at the location Schorndorf in 2019 (solid black line) and 2020 (dashed black line).
Figure 3.
Weekly pollen catch (pollen grains/cm2) presented with a logarithmic scale on the y-axis for horizontal and vertical slides attached at four pollen traps for at the location Schorndorf in 2019 (solid black line) and 2020 (dashed black line).

Figure 4.
Phenological observations in relation to temperature [°C] and precipitation [mm] during the ash flowering at the location Schorndorf in 2019 (a,b) and 2020 (c,d). (a,c) Phenological observations: BBCH 60 + 61—beginning of pollen release: max. 10% of flowers release pollen (dashed green line); BBCH 65—full flowering: >50% of flowers release pollen (dashed orange line); BBCH 68—end of flowering and pollen release (dashed pink line) and BBCH 69—no more pollen release (dashed brown line). (b,d) daily maximum (red line) and minimum (light blue line), and mean (yellow dotted line) of temperature [°C] and daily precipitation sum [mm] (dark blue bars).

Figure 5.
Pollen measurements obtained for the study site Schorndorf. The location of traps (marked with an “x”) and of the plantation (green rectangle) are highlighted at the top of the table. For pollen catch, the size of the circles represents the order of the amount of pollen measured. For pollen impaction, the square represents the pollen trap, the red thick dashes indicate the direction where the most pollen was recorded, and the blue dashes show where the second most pollen was recorded.

Figure 6.
Cold air flows calculated using KLAM_21 (DWD) one hour after sunset. The arrows indicate the magnitude and direction of the flow velocity as an elevation average. The outline of the plantation is marked in red.
Figure 6.
Cold air flows calculated using KLAM_21 (DWD) one hour after sunset. The arrows indicate the magnitude and direction of the flow velocity as an elevation average. The outline of the plantation is marked in red.
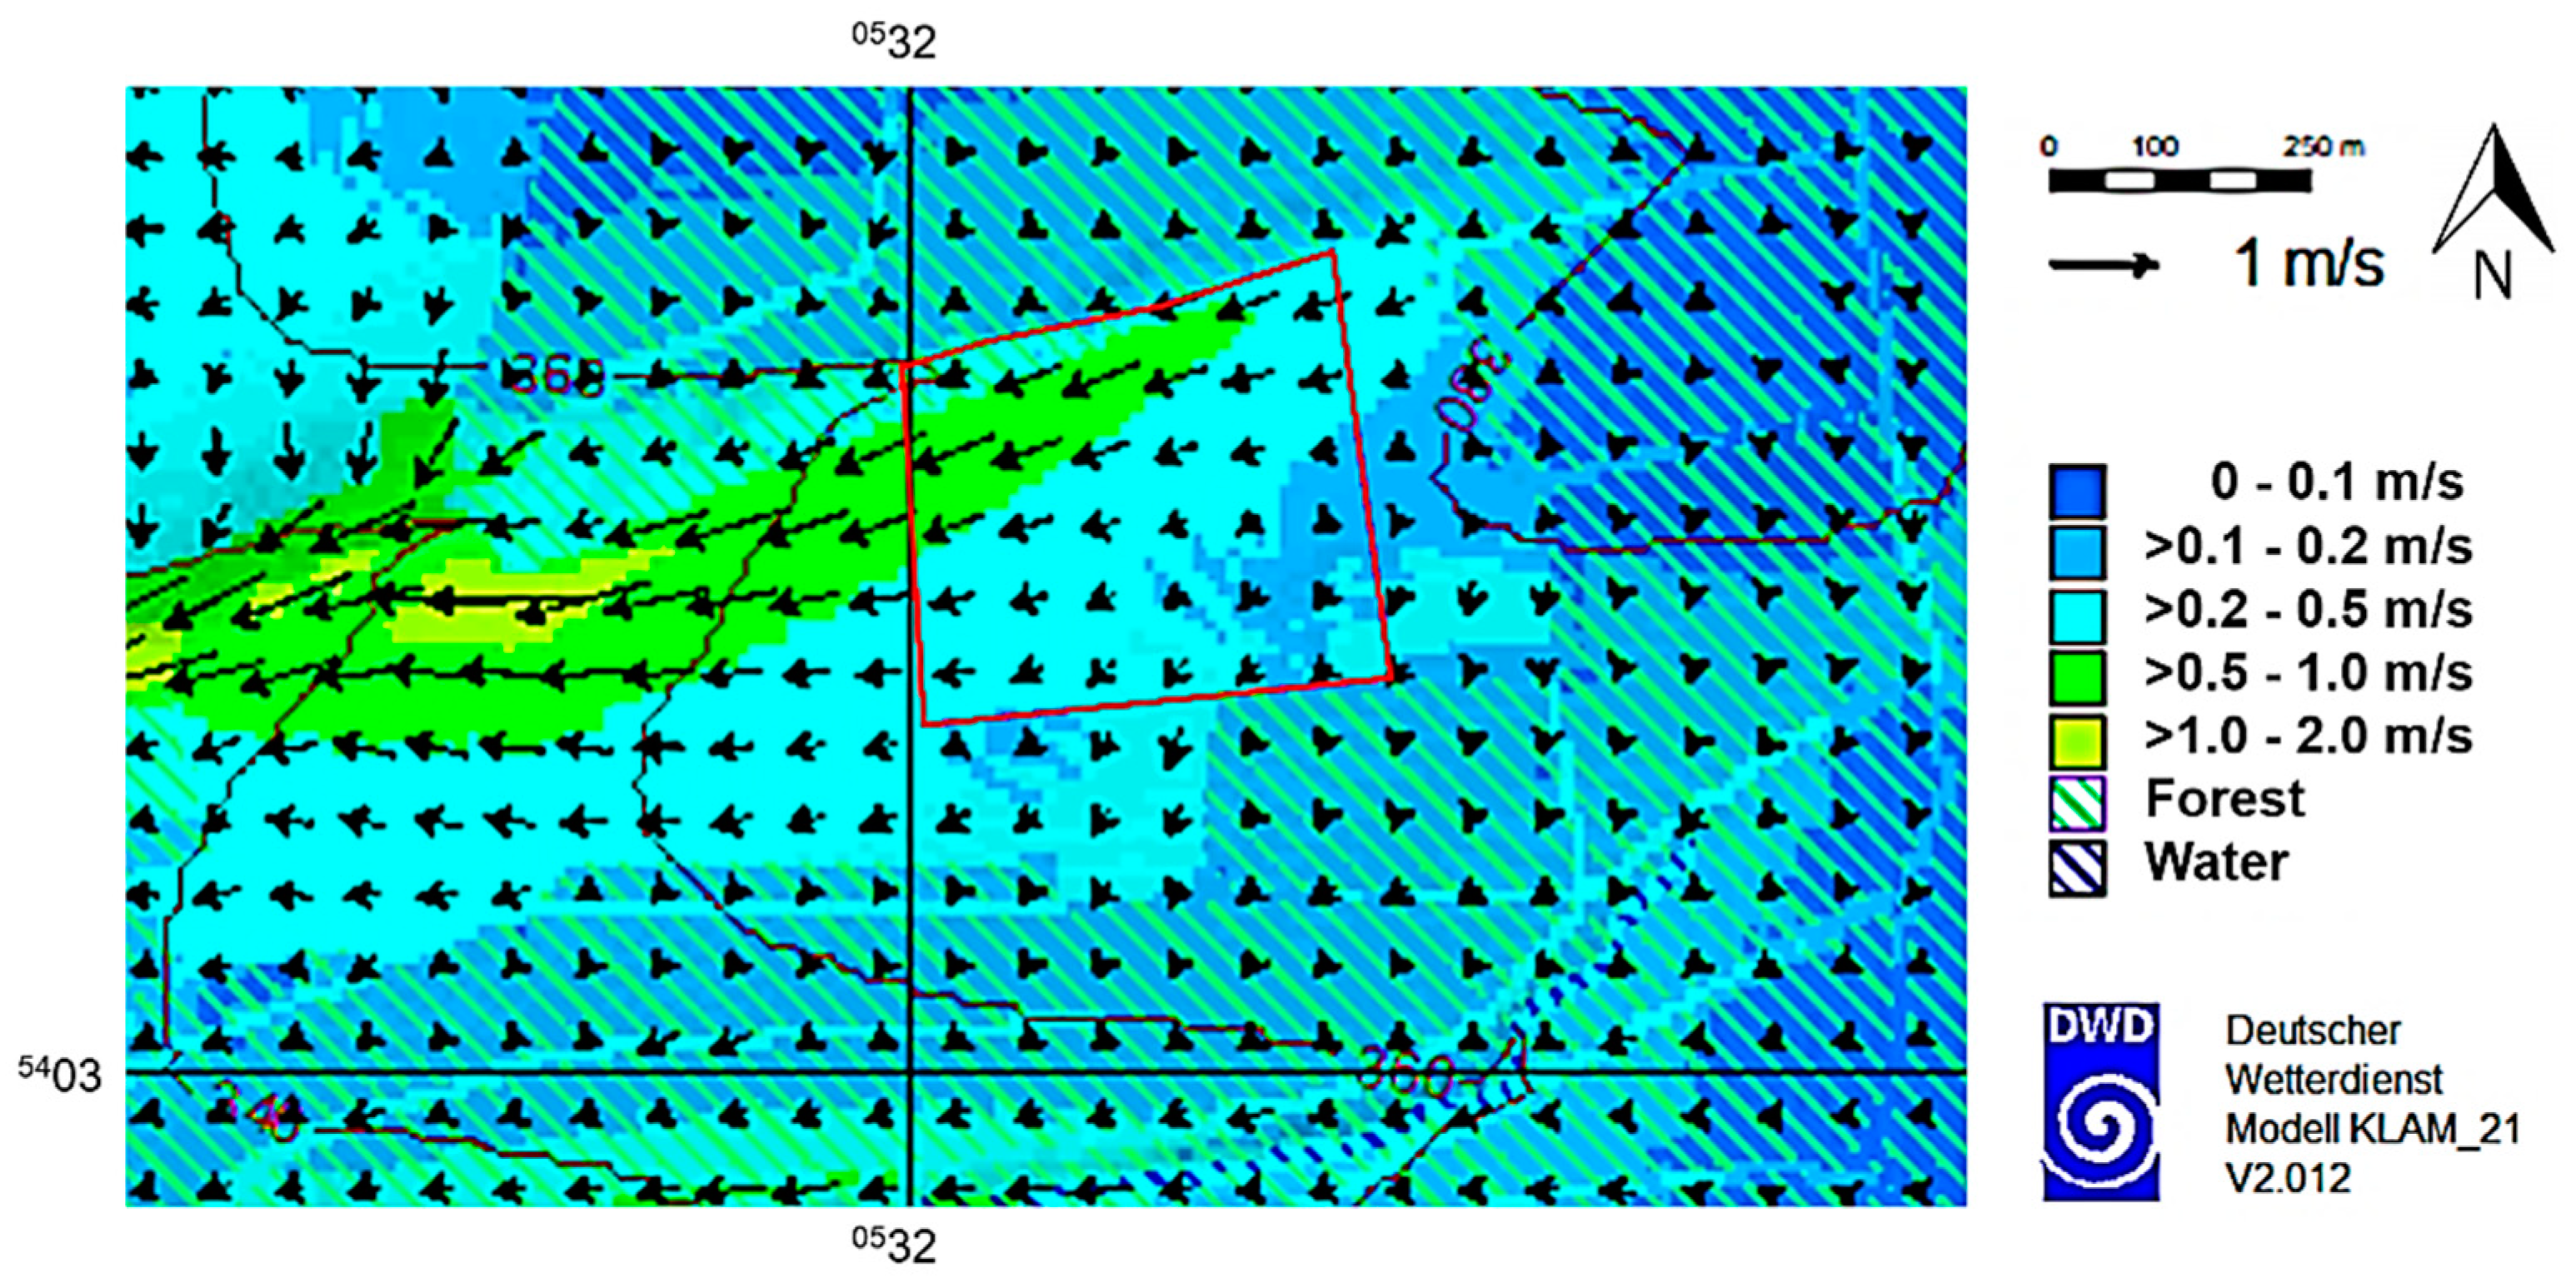
Figure 7.
Weekly pollen catch (pollen grains/cm2) presented with a logarithmic scale on the y-axis for horizontal and vertical slides attached at four pollen traps for at the location Emmendingen in 2019 (solid black line) and 2020 (dashed black line).
Figure 7.
Weekly pollen catch (pollen grains/cm2) presented with a logarithmic scale on the y-axis for horizontal and vertical slides attached at four pollen traps for at the location Emmendingen in 2019 (solid black line) and 2020 (dashed black line).
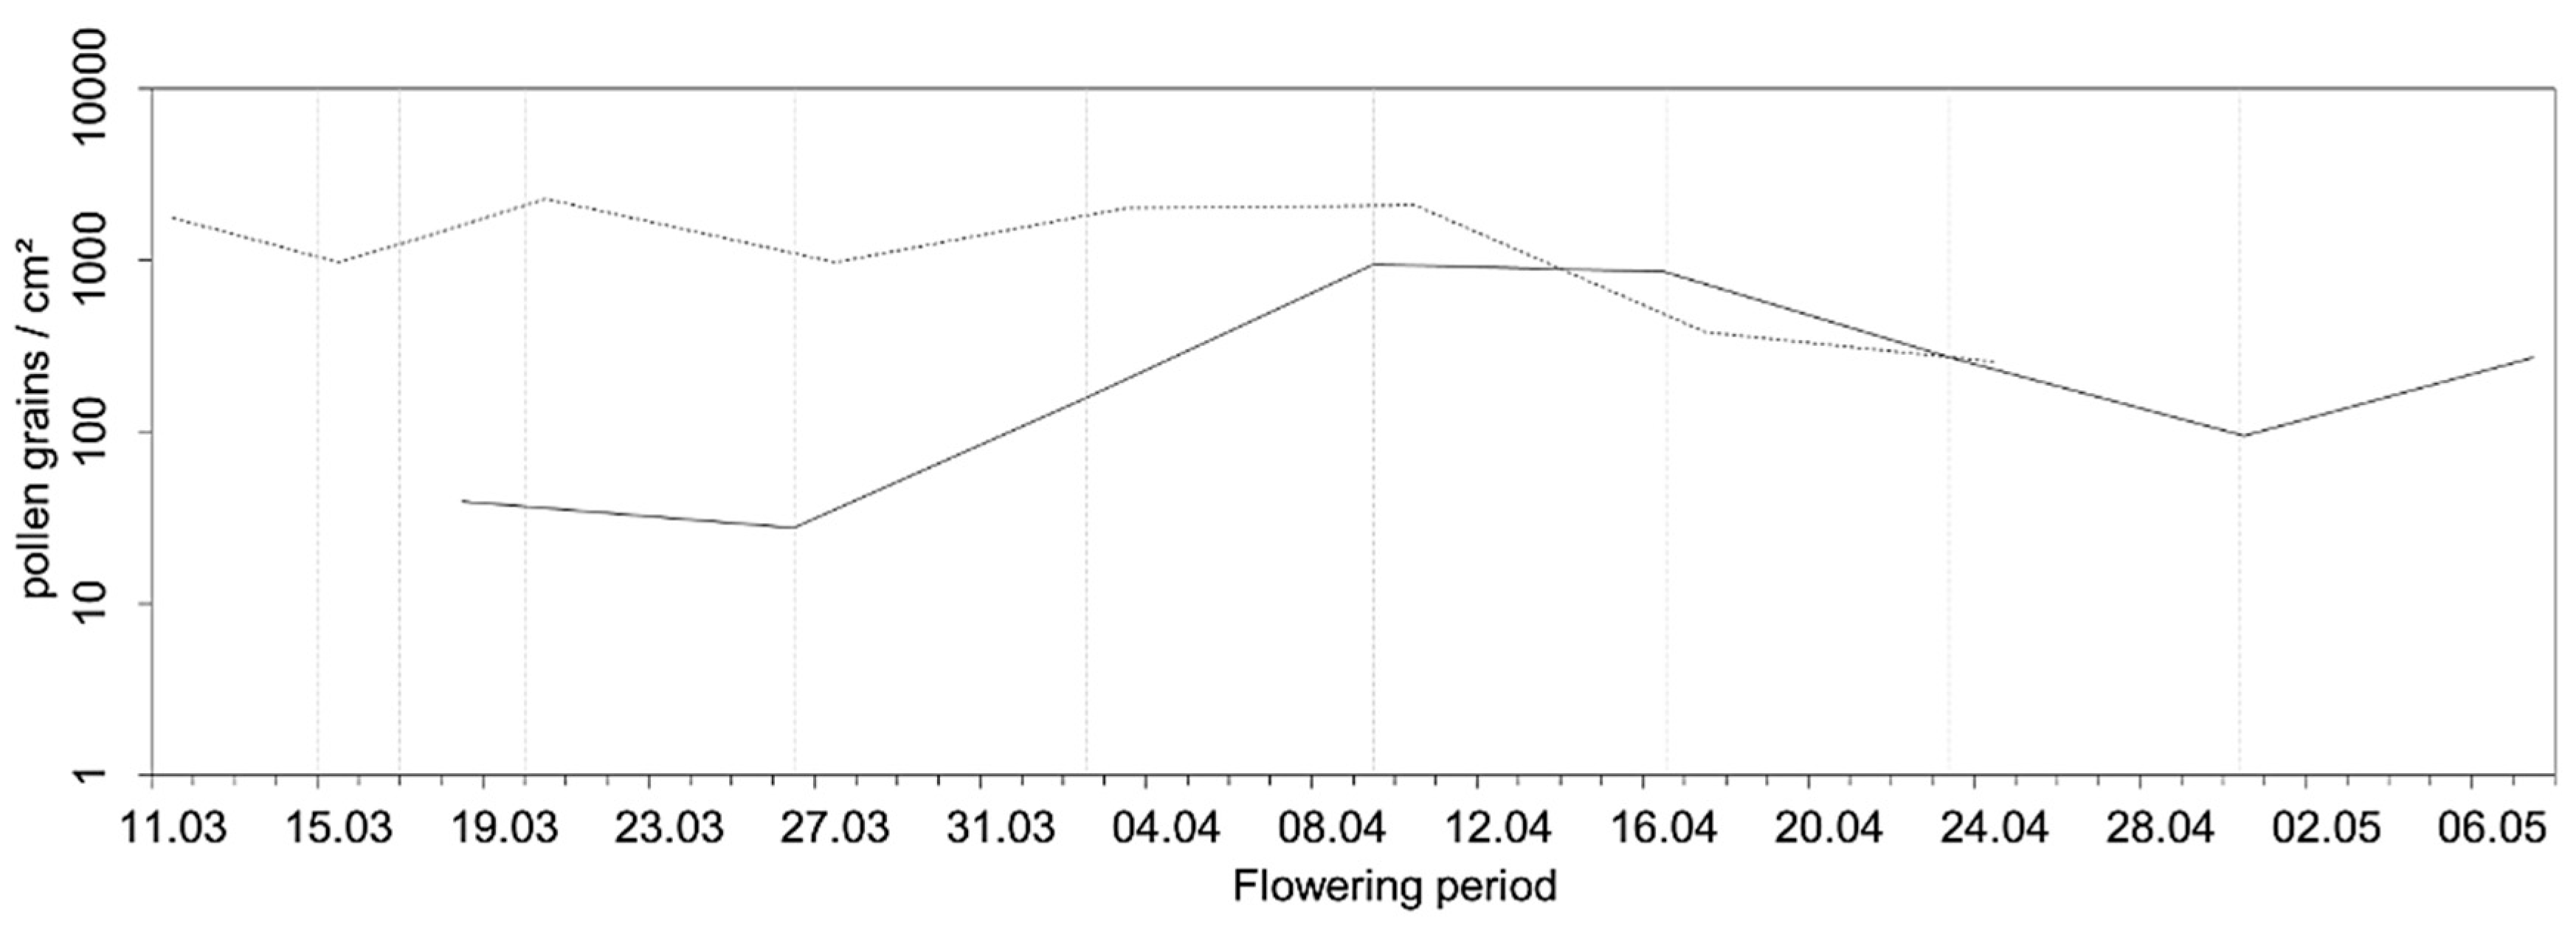
Figure 8.
Phenological observations in relation to temperature [°C] and precipitation [mm] during the ash flowering at the location Emmendingen in 2019 (a,b) and 2020 (c,d). (a,c) Phenological observations: BBCH 60 + 61—beginning of pollen release: max. 10% of flowers release pollen (dashed green line); BBCH 65—full flowering: >50% of flowers release pollen (dashed orange line); BBCH 68—end of flowering and pollen release (dashed pink line) and BBCH 69—no more pollen release (dashed brown line). (b,d) daily maximum (red line) and minimum (light blue line), and mean (yellow dotted line) of temperature (°C) and daily precipitation sum [mm] (dark blue bars).

Figure 9.
Pollen measurements obtained for the study site Emmendingen. The location of traps (marked with an “x”) and of the plantation (green rectangle) are highlighted at the top of the Table. For pollen catch, the size of the circles represents the order of the amount of pollen measured. For pollen impaction, the square represents the pollen trap, the red thick dashes indicate the direction where the most pollen was recorded, and the blue dashes show where the second most was recorded.
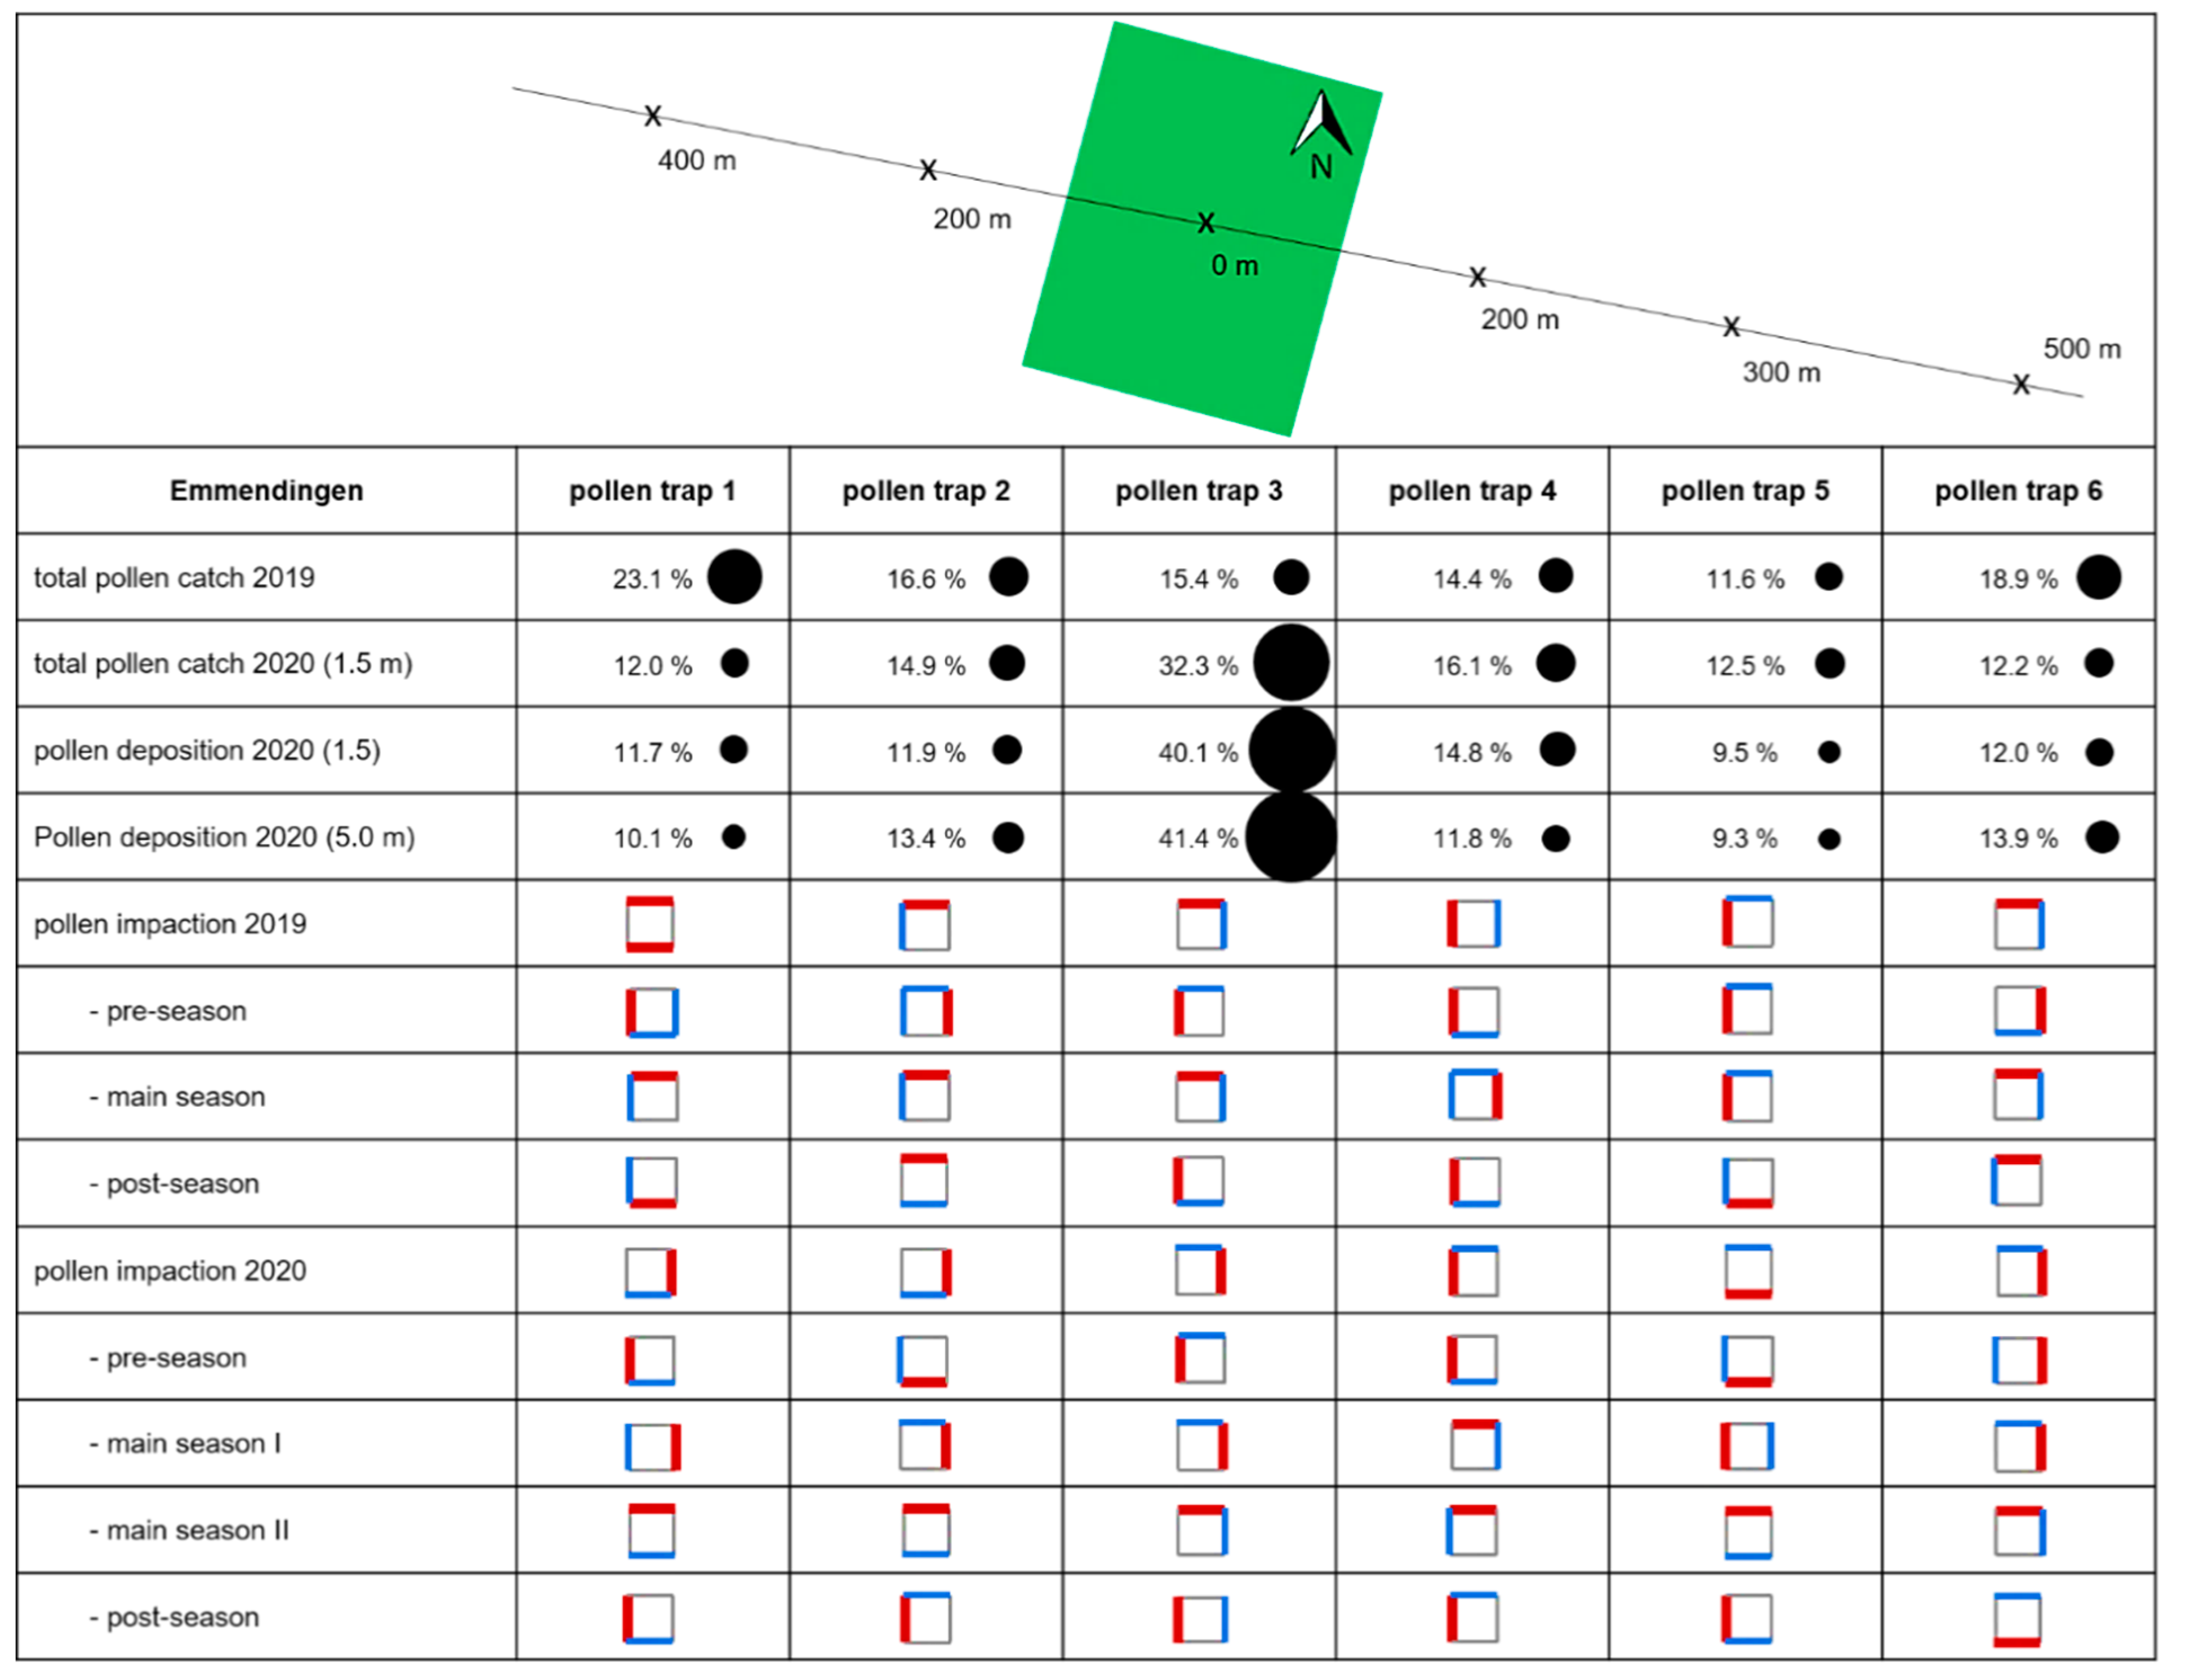
Table 1.
Classification of pollen seasons for the seed plantation Schorndorf in 2019 and 2020.
| Pollen Season | 2019 | 2020 |
|---|---|---|
| Pre-season | 18 March–2 April | 18 March–25 March |
| Main season | 2 April–23 April | 25 March–22 April |
| Post-season | 23 April–14 May | 22 April–13 May |
Table 2.
Classification of pollen seasons for the seed plantation Emmendingen in 2019 and 2020.
| Pollen Season | 2019 | 2020 |
|---|---|---|
| Pre-season | 18 March–9 April | 11 March–17 March |
| Main season | 9 April–23 April | 17 March–17 April |
| Post-season | 23 April–14 May | 17 April–1 May |
Table 3.
Peak dates and maximum pollen deposition for single traps at a height of 1.5 m and 5.0 m.
| Trap 1 | Trap 2 | Trap 3 | Trap 4 | Trap 5 | Trap 6 | |
|---|---|---|---|---|---|---|
| peak dates 1.5 m | 20.03–27.03 | 11.03–15.03, 10.04–17.04 | 03.04–10.04 | 03.04–10.04 | 10.04–17.04 | 03.04–10.04 |
| Max. pollen 1.5 m [pollen grains/cm2] | 107 | 104 | 424 | 139 | 106 | 139 |
| peak dates 5.0 m | 10.04–17.04 | 03.04–10.04 | 17.03–20.03 | 10.04–17.04 | 10.04–17.04 | 03.04–10.04 |
| Max. pollen 5.0 m [pollen grains/cm2] | 102 | 120 | 681 | 151 | 105 | 149 |
Publisher’s Note: MDPI stays neutral with regard to jurisdictional claims in published maps and institutional affiliations. |
© 2022 by the authors. Licensee MDPI, Basel, Switzerland. This article is an open access article distributed under the terms and conditions of the Creative Commons Attribution (CC BY) license (https://creativecommons.org/licenses/by/4.0/).
Share and Cite
MDPI and ACS Style
Eisen, A.-K.; Fussi, B.; Šikoparija, B.; Jochner-Oette, S. Aerobiological Pollen Deposition and Transport of Fraxinus excelsior L. at a Small Spatial Scale. Forests 2022, 13, 424. https://doi.org/10.3390/f13030424
AMA Style
Eisen A-K, Fussi B, Šikoparija B, Jochner-Oette S. Aerobiological Pollen Deposition and Transport of Fraxinus excelsior L. at a Small Spatial Scale. Forests. 2022; 13(3):424. https://doi.org/10.3390/f13030424
Chicago/Turabian StyleEisen, Anna-Katharina, Barbara Fussi, Branko Šikoparija, and Susanne Jochner-Oette. 2022. "Aerobiological Pollen Deposition and Transport of Fraxinus excelsior L. at a Small Spatial Scale" Forests 13, no. 3: 424. https://doi.org/10.3390/f13030424
Note that from the first issue of 2016, this journal uses article numbers instead of page numbers. See further details here.