Article

Understanding the Limiting Climatic Factors on the Suitable Habitat of Chinese Alfalfa

1
Institute of Soil and Water Conservation, Chinese Academy of Sciences and Ministry of Water Resource, Xianyang 712100, China
2
State Key Laboratory of Soil Erosion and Dryland Farming on Loess Plateau, Northwest A&F University, Xianyang 712100, China
3
University of Chinese Academy of Sciences, Beijing 100049, China
4
College of Forestry, Northwest A&F University, Xianyang 712100, China
*
Authors to whom correspondence should be addressed.
Forests 2022, 13(3), 482; https://doi.org/10.3390/f13030482
Submission received: 24 February 2022 / Revised: 17 March 2022 / Accepted: 18 March 2022 / Published: 20 March 2022
(This article belongs to the Section Forest Ecology and Management)

Abstract

:
Chinese alfalfa (Medicago sativa) is one of the most widely planted species in China. It has considerable economic potential and plays an important role in soil and water conservation. In order to conduct scientific cultivation of Chinese alfalfa, we collected 100 occurrence records from herbarium and publications and 19 climatic variables from BIOCLIM to simulate potential suitable habitat and identified the key climatic factors of Chinese alfalfa by MaxEnt and GIS software. The result shows that the MaxEnt model performed well, with an average test AUC value of 0.86 with 10-fold cross validation. The potential distribution of Chinese alfalfa is mainly in arid and semi-arid areas of north and northwest China, about 15.2% (1.46 million km2) of China’s total land area, and the highly suitable area is Loess Hilly region and Xinjiang. The main climatic factors affecting the distribution of this species is hydrological-related factors (PDM, PS, AP, PDQ and PCQ), which explained 58.6% of the variation, and the climatic factors limiting the southern, northern, northwestern and Tibetan plateau boundaries were PDM, AMT, AP and MTCM, respectively. The climatic thresholds of the core area of Chinese alfalfa are 0.0–14.0 mm of PDM, 23.8–108.2% of PS, 3.9–15.5 °C of AMT, 14.0–664.0 mm of AP, 1.0–47.0 mm of PDQ, 2.0–51.0 mm of PCQ. The results improve our understanding of limiting climatic factors for Chinese alfalfa and suggest a priority management measures for areas with corresponding limiting climatic factor.

1. Introduction

Land degradation has been occurring around the world in recent decades, due to human activities [1]. For example, the degraded area of China’s grassland ecosystem is increasing at a rate of 2.0 × 10⁶/ha·y−1 [2]. Since 1999, the Chinese government has established an ambitious grain for green project, also named as converting farmlands to forests or grasslands, to deal vegetation degradation [3]. A total of 535.3 billion yuan (about 84.43 billion dollars with exchange rate of 6.34) has been invested in returning 3.48 × 10⁷ ha2 of farmland to forest or grassland by 2020 [4]. In such an ecosystem reconstruction process, planting wood species and adding grass seeds have become the main strategy to accelerate restoration of degraded land.
Many species have been used as potential provenances to restore degraded ecosystems. For example, wood species were used to rebuild the forest ecosystem (e.g., trees: Robinia pseudoacacia, Prunus armeniaca, Pinus tabulaeformis, Platycladus orientalis; shrubs: Caragana korshins, Hippophae rhamnoides, Elaeagnus angustifolia) [5], whereas grass seed were used to reconstruction the grassland ecosystem (e.g., Medicago sativa, Astragalus -adsurgens, Onobrychis viciifolia, Bromus inermis, Agropyron cristatum) [6,7]. Among all the species planted in arid and semi-arid region of northern China, Chinese alfalfa (Medicago sativa) is particularly valued (also named as “the king of forages” around the world) [8]. This is mainly because the species has strong tolerance to dry stress and is suitable for the fragile environment in northwest of China [9,10]. The species also has high nutritional value and excellent palatability, which can meet the feed source of animal husbandry in the northern and western China [11].
In terms of scientific planting of this species, this species has received high attention. Many studies have focus on cultivation of Chinese alfalfa [12], the eco-physiological characteristics of Chinese alfalfa [13,14,15] and regionalization of this species [16,17]. On the distribution of Chinese alfalfa, we searched “Chinese alfalfa or Medicago sativa distribution” into web of Science and China National Knowledge Infrastructure (CNKI, https://www.cnki.net/, accessed on 5 September 2021), and obtained 17 relevant studies about the distribution of Chinese alfalfa. These studies mainly focused on the provincial and county-level scale rather than the national level, as well as focused on planting zoning rather than the climatic niche of the species [16,18]. Currently, the climatic limiting factors and climatic threshold of this species on a large scale are still not clear. The solution of this problem can help us predict the response of species under different environmental conditions and manage Chinese alfalfa reasonably.
The common approach to study the relationship between species distribution and climate factors is climatic niche model, is also named as species distribution models, or statistical models [19], as they do not need number of physiological and ecological parameters compared with the mechanism model. Based on the type of data, climatic niche models also can classified into presence–absence-based methods and presence-only data based methods [20]. Due to reliable absence data being rare and hard to obtain, which made models requiring presence-only data (directly obtained from museums and herbaria) more broadly be used [21,22].
Among presence-only data models, MaxEnt is the most deeply studied and widely used in study the relationship between species distribution and climate factors, e.g., predict species distributions or simulate species response curves [23,24,25]. In addition, Elith et al. [26] added a more powerful interpretation capabilities than others by using the limiting factor mapping and similarity surface mapping algorithms for interpretation of limiting climatic factors for range-shifting species.
In this study, we used MaxEnt model to explore how climate factors limit the distribution of Chinese alfalfa. The purpose of our study is as follows: (1) to map potential climatically suitable habitats of Chinese alfalfa; (2) to identify the important climatic factors and what climatic factors restrict the distribution of Chinese alfalfa; (3) to identify the climatic thresholds of Chinese alfalfa.

2. Materials and Methods

2.1. MaxEnt and Data Requirements

MaxEnt (version 3.3) was created by Phillips et al. [27,28] and it requires a set of environmental (e.g., climatic) grids and georeferenced current localities data of target species. Species records of Chinese alfalfa were collected from Chinese Virtual Herbarium (CVH, https://www.cvh.ac.cn/, accessed on 3 March 2021), the iplant (http://www.iplant.cn/, accessed on 3 March 2021). In total, 100 valid records were obtained, and latitude/longitude coordinates of each record were stored in an Excel database for MaxEnt model building. Climatic variables were obtained from the Worldclim database with cell size of 10 arc min (http://www.worldclim.org/, accessed on 3 March 2021); the 19 climatic variables are shown in Table 1.
The habitat suitability of Chinese alfalfa was simulated by MaxEnt by integrating occurrence records together with 19 climate variables. The feature parameters were settled as linear, quadratic, product, threshold and hinge in order to build non-linear response curves.
Ten-fold cross-validation method and AUC (Area under the curve) was used to evaluate the performance of the MaxEnt. The maximum number of iterations is 500. A jackknife test is used to evaluate which climatic factors were the most important in determining the potential distribution of the species. Maximum test sensitivity plus specificity were selected as threshold standard.
We calculate the optimal threshold of 0.3 in the simulation of this study. In order to preserve the maximum amount of forecast information and facilitate further analysis, we divided the habitat suitability in the map into four levels: unsuitable habitat (0.0–0.3), lowly suitable habitat (0.3–0.5), moderately suitable habitat (0.5–0.7) and highly suitable habitat (0.7–1.0). The climatic thresholds were calculated by GIS software.

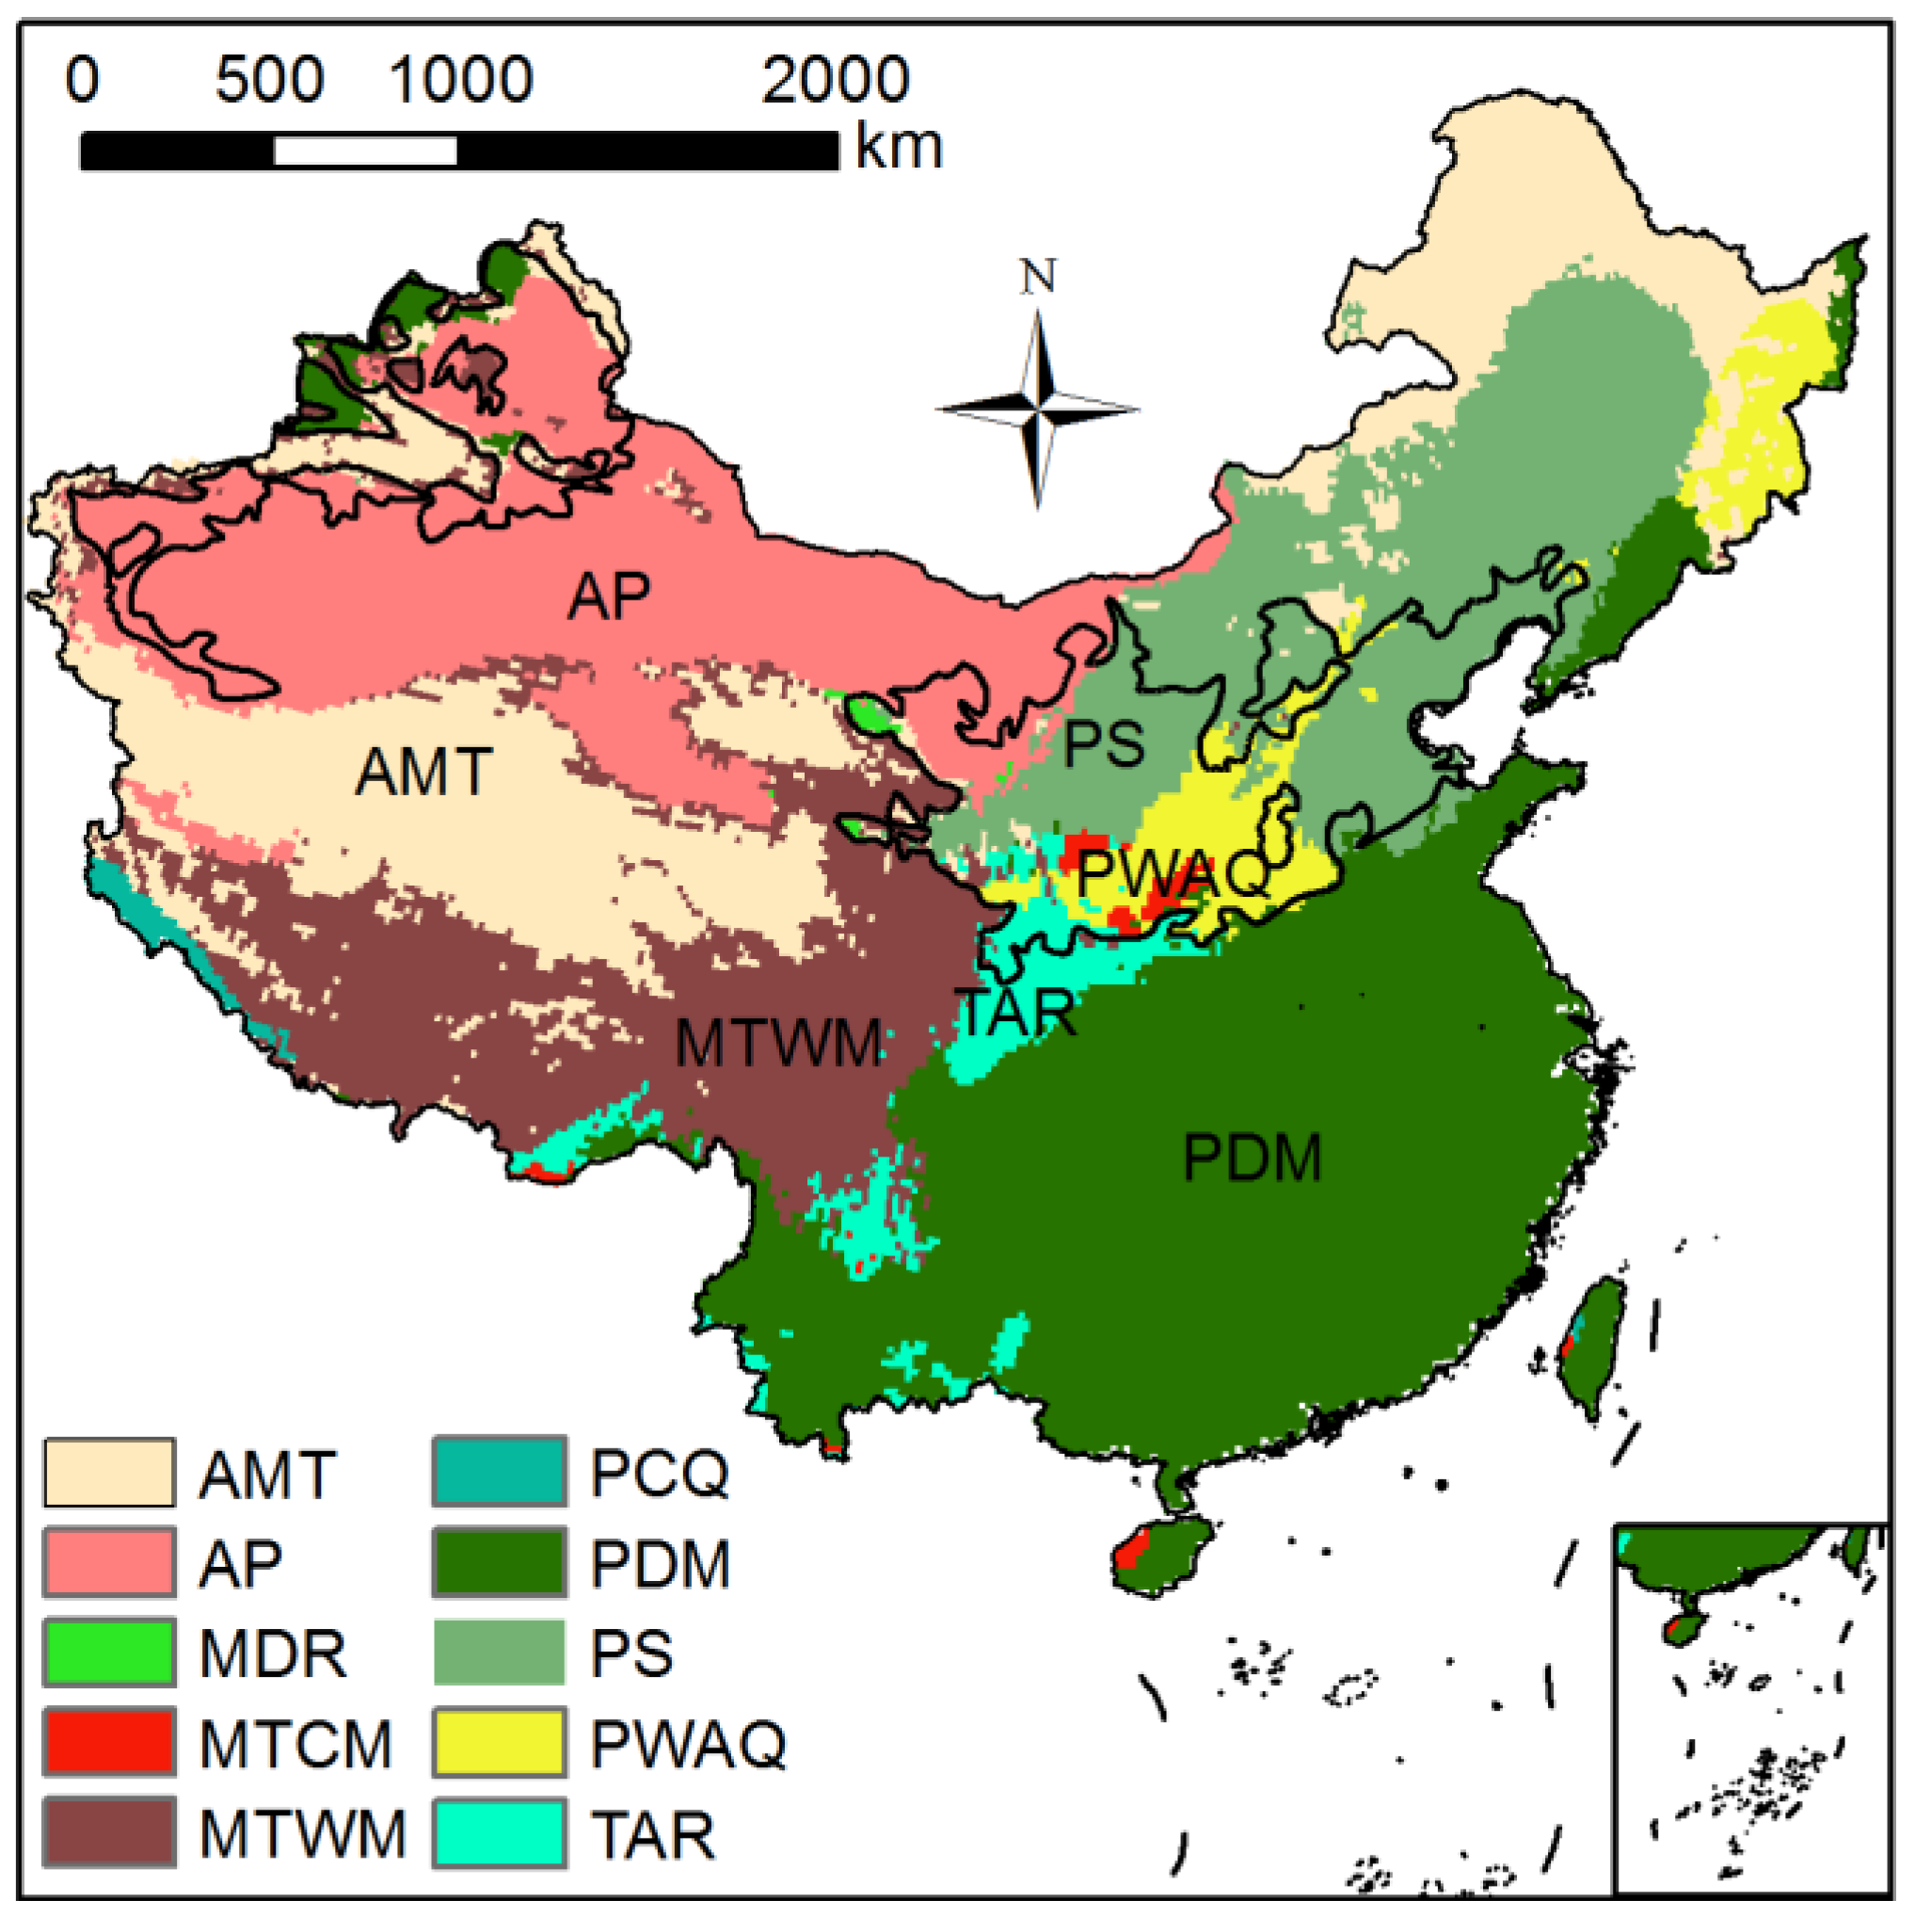
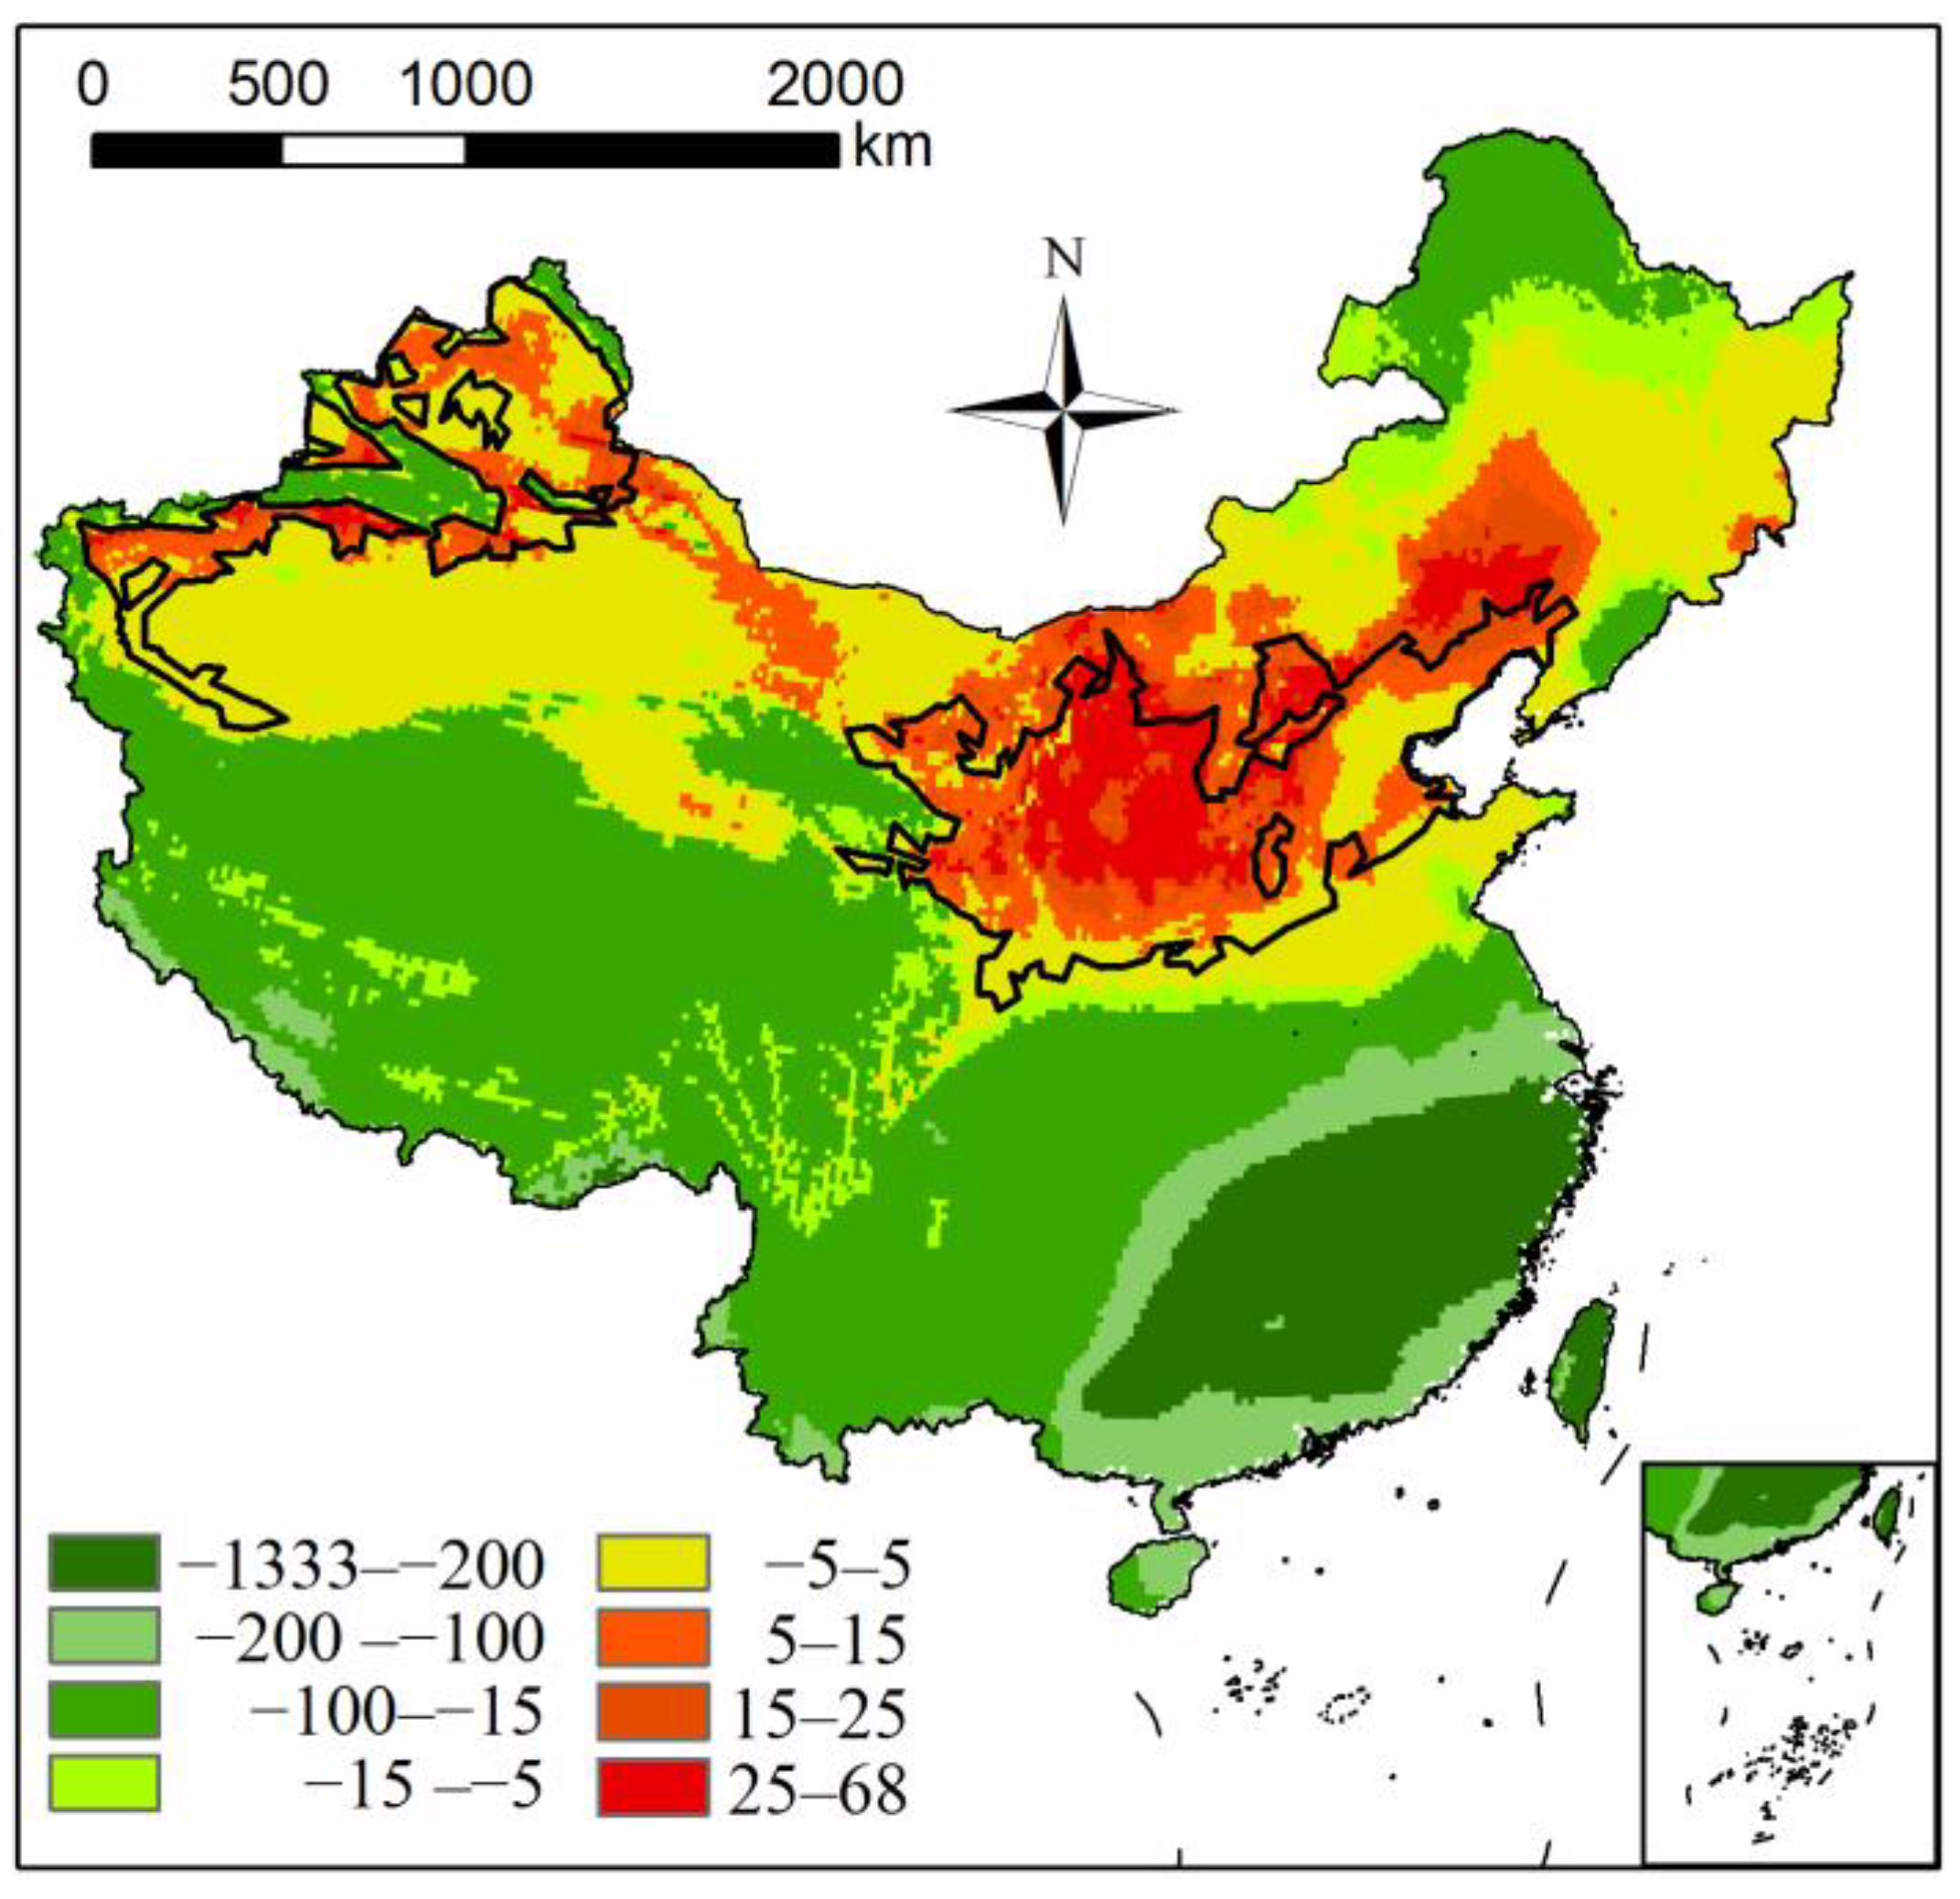
2.2. Limiting Climatic Mapping and Multivariate Environmental Similarity Surface

Elith et al. [26] have added limiting climatic mapping and multivariate environmental similarity surface techniques in MaxEnt model. Multivariate environmental similarity surface calculation shows how similar a point is to a set of reference points.
If we let mini be the minimum value of variable Vi over the reference point set, and then similarly for maxi, let pi be the value of variable Vi at point P, fi be the percent of reference points whose value of variable Vi is smaller than pi, then the similarity of P with respect to variable Vi is calculated by Equation (1):
SMi = min { p i m i n i m a x i m i n i   i f           f i = 0 2 × f i i f           0 < f i 50 2 × ( 100 f i ) i f           50 < f i < 100 m a x i p i m a x i m i n i   × 100 i f           f i = 100
Here, SMi represents of similarity map of variable Vi. Multivariate environmental similarity surface helps reveal whether there is possible model-predicted novel habitat (extrapolation), and from which we can know the credibility of model output, it is calculated by Equation (2):
MESS = min(stack(SMi))
Here, MESS represents multivariate environmental similarity surface map. Limiting climatic mapping analysis brings insight into which climatic factors mostly limit physiological and ecological processes in each grid cell for study range. Climatic limiting factor (CLF) is calculated by Equation (3):
CLF = which(stack(SMi) == MESS)

3. Results

3.1. Model Performance

The average value of training AUC value is 0.94 (0.936 to 0.947) and test AUC obtained is 0.88 (0.816 to 0.926), showing that the performance of MaxEnt model is very good. The coefficient of variation in test AUC values was only 3.6% among 10 model simulations, which proved that the 10-fold cross validation method did not influence the predicted performance of the MaxEnt.

3.2. Current and Potential Distribution of Chinese Alfalfa

From occurrence records (Figure 1A) and potential suitable habitat (Figure 1B) of Chinese alfalfa we can know that Chinese alfalfa occurs in Heilongjiang, Inner Mongolia, Liaoning, Hebei, Beijing, Shaanxi, Shandong, Henan, Shanxi, Ningxia, Gansu, Qinghai, and Xinjiang provinces. Mainly distributed in the north and northwest and low altitude areas of China and the potential distribution area is about 1.46 million km2. The potential suitable habitat of Chinese alfalfa highly suitable area is mainly located in Shaanxi western, southeast of Gansu, most of Ningxia and northwest of Xinjiang provinces (Figure 1C), from Humid region with distinct dry season region (II) to extremely arid region (VI) (Figure 1D).

3.3. Importance of Climatic Factors

The relative importance of climatic factors in limiting the growing of Chinese alfalfa was shown in Table 2. The results indicated that PDM, PS, AMT, AP, PDQ, PCQ and MTWT were the most influential climatic factors, and these seven factors can explain 76.4% of the variation, followed by TAT, TS, MTCM, MDR, PWAQ and MTDQ, which only explained 18.5% of the variation (2.2–4.0% for each factor). The remaining 6 climatic factors were unimportant in limiting the growing of Chinese alfalfa, and they accounted for 4.9% of the variation (0.2–1.6% for each factor). These significant factors can be divided into thermal-related factors (ATM and MTWM, accounting for 17.8% of the variance) and hydrological-related factors (PDM, PS, AP, PDQ, PCQ accounting for 58.6% of the variance). The hydrological related climatic factors played the more important role in controlling the growing of Chinese alfalfa in China.
The climatic thresholds for the habitat categories are shown in Table 2. The results show that the climatic thresholds for the highly suitable areas of Chinese alfalfa are as follows: PDM of 0.0–14.0 mm, PS of 23.8–108.2%, AMT of 3.9–15.5 °C, AP of 14.0–664.0 mm, PDQ of 1.0–47.0 mm, PCQ of 2.0–51.0 mm.

3.4. Response Curves and Limiting Factors

Response curves to climatic suitability for six most influential climatic factors (PDM, PS, AMT, AP, PDQ and PCQ) were shown in Figure 2. Upward trends for variables indicated a positive relationship, while downward trends represented a negative relationship. Response peaks to habitat suitability for PDM, PS, AMT, AP, PDQ, PCQ were 3.5 mm, 13.9%, 6.8 °C, 199.5 mm, 13.7 mm, 4.42 mm.
The areas outside the potential suitable habitat range of Chinese alfalfa were mainly shaped due to the limitation of AP, AMT, PDM and MTWM (Figure 3). PDM limits the southern border of Chinese alfalfa, following AMT and MTWM are the limiting factors for Qinghai Tibet Plateau in western China. PS and AMT limits the northern border of Chinese alfalfa. AP is the limiting factor of the northwest boundary of Chinese alfalfa.

4. Discussion

4.1. Understanding the Limiting Climatic Factors of Chinese Alfalfa

Here, we simulated the climatic suitability, climatic thresholds, and map the limiting climatic factors of Chinese alfalfa using MaxEnt model. The simulated range of Chinese alfalfa was similar to its occurrence record (Figure 1C), which indicated that the distribution pattern of alfalfa in China is in balance with climatic conditions. The results of MaxEnt model showed that little novel habitat outside the range boundary as shown in the MESS map (Figure 4), which indicates that the MaxEnt model output had high reliability, because the habitat was interpolated, but not extrapolated, by the MaxEnt algorithm. The AUC in this paper is 0.88 (significantly better than random) that demonstrates that the occurrence records were sufficient to simulate the climatic niche of the species.
Two methods are used to understand species limiting climatic factors, one is the jackknife test, the other is limiting factor mapping. The jackknife test is the method used in most studies at present [25,28,29,30]. This method mainly describes the factors affecting the suitability or growth of species in general, but it cannot reflect the aspect of the spatial distribution of limiting factors. The limiting factor mapping method, based on Liebig’s law of minimum, can objectively describe the spatial location information of the limiting climatic factor. It is a more informative method than the jackknife test and one which is rarely used at present [26,31]. Both methods can complement each other and help us to fully understand the limiting factors of the species.
Our jackknife test shows that hydrological-related climatic factor is the main factors affect species suitability than heat-related factor. However, where does the hydrological-related climatic factor work? Or is the heat-related factor not important? Limiting factor mapping can help us understand these questions. Our limiting factors maps show that in the Qinghai–Tibet Plateau and Northern China, the distribution of Chinese alfalfa is mainly limited by heat-related factors, which are likely due to the short growth season in these places and the heat accumulation; these factors are not conducive to maintaining the historical cycle of life, which means Chinese alfalfa is unable to survive for a long time, thus confirming the view that temperature is the main factor limiting the distribution of species in northern or high-altitude regions [32,33].
In the western, southern and eastern regions of China, the distribution of Chinese alfalfa is mainly limited by rainfall factors. The western region is arid and rainless, which cannot meet the physiological needs of Chinese alfalfa for water in the growing season, thus limiting the distribution of the species [34,35,36]; The abundant rainfall in the eastern and southern regions has also become the main factor limiting the distribution of Chinese alfalfa, which seems to be inconsistent with the traditional view (phenological view) [37]. It is suggested that the southern boundary of species distribution area is also due to the limitation of temperature. That is, the chilling requirement of plant from dormancy to growth should be met during the period of germination [38]. Actually, our research does not deny the hypothesis; the process may be also a potential limiting factor but not the most limiting climatic factor.
Our results expand the understanding suggested by the traditional phenological model that only temperature-related factors limit the distribution boundary of species. We found that the rainfall-related factor (PDM) is the most important factor limiting in southern boundary of the species distribution. This could be explained by competitive exclusion of Chinese alfalfa by productive dominant species under high rainfall environment. In research of wood species (shrub: Elaeagnus angustifolia) in arid and semi-arid regions of China, Zhang et al. [31] also found that high PDM was the most limiting climatic factors in the southeast boundary of the species. It is exceedingly likely that the process of rainfall-related factors limiting the southern boundary of species distribution is a universal law in natural ecosystem in China. Further validation is needed on more species.

4.2. Application and Future Research

Understanding climatic limiting factors and climatic thresholds of Chinese alfalfa can help us predict the response of the species under different climatic conditions and manage Chinese alfalfa reasonably [29,39]. For example, the climatic thresholds in the core area are 0.0–14.0 mm of PDM, 23.8–108.2% of PS, 3.9–15.5 °C of AMT, 14.0–664.0 mm of AP, 1.0–47.0 mm of PDQ, 2.0–51.0 mm of PCQ. Accordingly, we can judge whether Chinese alfalfa is suitable for planting in area based on local weather station information. At the same time, they help us reasonably create microclimate conditions in micro topography to meet the climate requirements of Chinese alfalfa growth (e.g., runoff forestry).
We also obtained the response curve of Chinese alfalfa, which can help us judge the habitat suitability and growth of Chinese alfalfa under climate change or climate variation, and also provide data support for formulation the climate adaptation strategy of Chinese alfalfa. In addition, the climate limiting factor map we have drawn can help us understand which places are likely vulnerable to climate threats, and thus manage Chinese alfalfa reasonably. For example, in areas limited by insufficient rainfall, we can use irrigation or artificial water storage measures to operate Chinese alfalfa bases [16,40]. In areas with large rainfall, manual management may be required to eliminate the interference of strong competitors such as woody plants. In the areas with insufficient heat, some artificial warming measures should be used, such as plastic film mulching for feed production, or supplementing seed sources for ecological restoration to ensure the sufficient seed demand for maintenance the ecosystem stability of Chinese alfalfa [40].
Our research shows that Chinese alfalfa has a wide range of climatic suitability in the vast arid and semi-arid areas of northwestern China. However, the study does not suggest that all the ranges are suitable for Chinese alfalfa planting, such as in cities, farmland and water body, and areas far to reach by humans. At the same time, this study only involves climatic factors at large-scale (Grinnellian niche) without considering terrain, soil factors, and biological factors at small and medium-scale (Elton’s niche). Eltonian noise hypothesis suggest that there should be an overestimated risk in simulating the area of suitable habitat of this species [41]. Even so, the climate heterogeneity on a large scale will be greater than the microclimate heterogeneity on a small scale [42], so our description of the species’ climate needs should be reasonable and useful [43]. Further, the species climate threshold, climate limiting factor map and suitable range obtained by our research can be used as a baseline for screening the priority planting areas in combination with remote sensing data and land use data. Furthermore, carrying out a long-term climate monitoring in these priority planting areas should be necessary, so as to timely evaluate the impact of climate change or climate variation on Chinese alfalfa growth, thus taking appropriate measures for Chinese alfalfa management.

5. Conclusions

This study is the first to reveal the limiting climatic factors on the suitable habitat of Chinese alfalfa in China. The results showed that the northern boundary of Chinese alfalfa is mainly controlled by both hydrological and heat climatic factors, whereas the southern boundary of the species is most limited by hydrological climatic factors. High altitude areas are mainly limited by heat related climatic factors (such as the Qinghai–Tibet Plateau). The limiting mapping suggest that hydrological factors are the most limiting factor in limiting species southern and northern boundary of the species. The most suitable climatic niche for Chinese alfalfa is 0.0–14.0 mm of PDM, 23.8–108.2% of PS, 3.9–15.5 °C of AMT, 14.0–664.0 mm of AP, 1.0–47.0 mm of PDQ, 2.0–51.0 mm of PCQ. The climatic threshold and limiting mapping drawn can be used to predict the response of the species under different climatic conditions and manage Chinese alfalfa reasonably.

Author Contributions

Y.Z., G.L. (Guan Liu), Q.L., D.X., S.D. and G.L. (Guoqing Li) conceived and designed the experiments; Y.Z. and G.L. (Guoqing Li) analyzed the data; Y.Z. and G.L. (Guoqing Li) wrote the paper. All authors have read and agreed to the published version of the manuscript.

Funding

This research was funded by the National Natural Science Foundation of China grant number [31971488] and the National Key Research and Development Program of China grant number [2017YFC0504601].

Institutional Review Board Statement

Not applicable.

Informed Consent Statement

The study did not involve humans.

Data Availability Statement

All data are provided in the main manuscript. Contact the corresponding author if further explanation is required.

Acknowledgments

We are very grateful to academic editor and English editor for their valuable suggestions and language polishing, which significantly improved the manuscript.

Conflicts of Interest

The authors declare no conflict of interest. The founding sponsors had no role in the design of the study, in the collection, analyses, or interpretation of data, in the writing of the manuscript, and in the decision to publish the results.

References

  1. Yin, F.; Deng, X.Z.; Jin, Q.; Yuan, Y.W.; Zhao, C.H. The impacts of climate change and human activities on grassland productivity in Qinghai Province, China. Front. Earth Sci. 2014, 8, 93–103. [Google Scholar] [CrossRef]
  2. State Environmental Protection Administration-SEPA. Report on China’s Ecological and Environmental Situation in 2002; State Environmental Protection Administration-SEPA: Beijing, China, 2002.
  3. Wang, X.G.; Han, J.G.; Dong, Y.P. Recent grassland policies in China—An overview. Outlook Agric. 2005, 34, 105–110. [Google Scholar] [CrossRef]
  4. Li, S.D.; Chen, Y.F. Progress and prospect of monitoring on benefits of the conversion of farmland to forests and grasses. For. Resour. Manag. 2021, 5, 1–9. [Google Scholar] [CrossRef]
  5. Yang, Z.Y.; Liu, Q.J.; Qin, L.H.; Liu, F.Z. Ecological benefit assessment of the Grain for green Project in Yan’an. J. Northwest For. Univ. 2022, 37, 259–266. [Google Scholar] [CrossRef]
  6. Wang, S.X. Five forage species suitable for landscape application in arid areas of northwest China. Gansu Agric. Sci. Tech. 2009, 11, 63–64. [Google Scholar]
  7. Wang, Z.X. Selection of cultivars for Planting Apocynum in the semi-arid region of western Liaoning province. Anim. Prod. 1994, 12, 21. [Google Scholar]
  8. Li, Y.S. Productivity dynamic of alfalfa and its effects on water eco-environment. Acta Pedol. Sin. 2002, 39, 404–411. [Google Scholar]
  9. Li, X.L.; Su, D.R.; Yuan, Q.H. Ridge-furrow planting of alfalfa (Medicago sativa L.) for improved rainwater harvest in rainfed semiarid areas in Northwest China. Soil Tillage Res. 2007, 93, 117–125. [Google Scholar] [CrossRef]
  10. Zheng, H.F. Alfalfa Science; China Agriculture Press: Beijing, China, 2009. [Google Scholar]
  11. Bouton, J.H. Breeding lucerne for persistence. Crop Pasture Sci. 2012, 63, 95–106. [Google Scholar] [CrossRef] [Green Version]
  12. Telekalo, N.; Melnyk, M. Agroecological substantiation of Medicago sativa cultivation technology. Agric. Res. 2020, 18, 2613–2626. [Google Scholar] [CrossRef]
  13. Thivierge, M.N.; Jego, G.; Belanger, G.; Bertrand, A.; Tremblay, G.F.; Rotz, C.A.; Qian, B.D. Predicted yield and nutritive value of an alfalfa-timothy mixture under climate change and elevated atmospheric carbon dioxide. Agron. J. 2016, 108, 585–603. [Google Scholar] [CrossRef] [Green Version]
  14. Medina-Garcia, G.; Echavarria-Chairez, F.G.; Ruiz-Corral, J.A.; Rodriguez-Moreno, V.M.; Sooria-Ruiz, J.; De La Mora-Orozco, C. Global warming effect on alfalfa production in Mexico. Rev. Mex. Cienc. Pecu. 2020, 11, 34–48. [Google Scholar] [CrossRef]
  15. Zhao, C.Y.; Feng, Z.D.; Chen, D.D. Soil water balance simulation of alfalfa (Medicago sativa L.) in the semiarid Chinese Loess Plateau. Agric. Water Manag. 2004, 69, 101–114. [Google Scholar] [CrossRef]
  16. Deng, F.; Li, X.B.; Wang, H.; Zhang, M.; Li, R.H.; Li, X. GIS-based assessment of land suitability for alfalfa cultivation: A case study in the dry continental steppes of northern China. Span. J. Agric. Res. 2014, 12, 364–375. [Google Scholar] [CrossRef] [Green Version]
  17. Xu, L.J.; Xu, D.W.; Pang, H.C.; Xin, X.P.; Jin, D.Y.; Tang, X.J.; Guo, M.Y. Chinese alfalfa habitat suitability regionalization. Pratacul. Sci. 2017, 34, 2347–2358. [Google Scholar] [CrossRef]
  18. Xu, K.; Wang, H.; Li, X.B.; Liu, H.H.; Chi, D.K.; Yu, F. Identifying areas suitable for cultivation of Medicago sativa L. In a typical steppe of Inner Mongolia. Environ. Earth Sci. 2016, 75, 341. [Google Scholar] [CrossRef]
  19. Guisan, A.; Thuiller, W. Predicting species distribution: Offering more than simple habitat models. Ecol. Lett. 2005, 8, 993–1009. [Google Scholar] [CrossRef]
  20. Nazeri, M.; Kumar, L.; Jusoff, K.; Bahaman, A.R. Modeling the potential distribution of sun bear in Krau wildlife reserve, Malaysia. Ecol. Inform. 2014, 20, 27–32. [Google Scholar] [CrossRef]
  21. Ponder, W.F.; Carter, G.A.; Flemons, P.; Chapman, R.R. Evaluation of museum collection data for use in biodiversity assessment. Conserv. Biol. 2001, 15, 648–657. [Google Scholar] [CrossRef]
  22. Tsoar, A.; Allouche, O.; Steinitz, O.; Rotem, D.; Kadmon, R. A comparative evaluation of presence-only methods for modelling species distribution. Divers. Distrib. 2007, 13, 397–405. [Google Scholar] [CrossRef]
  23. Qin, A.L.; Liu, B.; Guo, Q.S.; Bussmann, R.W.; Ma, F.Q.; Jian, Z.J.; Xu, G.X.; Pei, S.X. Maxent modeling for predicting impacts of climate change on the potential distribution of Thuja sutchuenensis Franch. an extremely endangered conifer from southwestern China. Glob. Ecol. Conserv. 2017, 10, 139–146. [Google Scholar] [CrossRef]
  24. Tang, X.G.; Yuan, Y.D.; Zhang, J.C. How climate change will alter the distribution of suitable Dendrobium habitats. Front. Ecol. Evol. 2020, 8, 536339. [Google Scholar] [CrossRef]
  25. Li, G.Q.; Du, S.; Wen, Z.M. Mapping the climatic suitable habitat of oriental arborvitae (Platycladus orientalis) for introduction and cultivation at a global scale. Sci. Rep. 2016, 6, 30009. [Google Scholar] [CrossRef] [PubMed] [Green Version]
  26. Elith, J.; Kearney, M.; Phillips, S. The art of modelling range-shifting species. Methods Ecol. Evol. 2010, 1, 330–342. [Google Scholar] [CrossRef]
  27. Phillips, S.J.; Dud´ık, M.; Schapire, R.E. A maximum entropy approach to species distribution modeling. In Proceedings of the Twenty-First International Conference on Machine Learning, Banff, AB, Canada, 14 July 2004; pp. 655–662. [Google Scholar]
  28. Phillips, S.J.; Anderson, R.P.; Schapire, R.E. Maximum entropy modeling of species geographic distributions. Ecol. Model. 2006, 190, 231–259. [Google Scholar] [CrossRef] [Green Version]
  29. Li, G.Q.; Du, S.; Guo, K. Evaluation of limiting climatic factors and simulation of a climatically suitable habitat for Chinese Sea Buckthorn. PLoS ONE 2015, 10, e0131659. [Google Scholar] [CrossRef]
  30. Wang, R.L.; Li, Q.; He, S.A.; Liu, Y.; Wang, M.T.; Jiang, G. Modeling and mapping the current and future distribution of Pseudomonas syringae pv. actinidiae under climate change in China. PLoS ONE 2018, 13, e0192153. [Google Scholar] [CrossRef] [Green Version]
  31. Zhang, X.Q.; Li, G.Q.; Du, S. Simulating the potential distribution of Elaeagnus angustifolia L. based on climatic constraints in China. Ecol. Eng. 2018, 113, 27–34. [Google Scholar] [CrossRef]
  32. Chen, I.C.; Hill, J.K.; Ohlemuller, R.; Roy, D.B.; Thomas, C.D. Rapid Range Shifts of Species Associated with High Levels of Climate Warming. Science 2011, 333, 1024–1026. [Google Scholar] [CrossRef]
  33. Krehenwinkel, H.; Tautz, D. Northern range expansion of European populations of the wasp spider Argiope bruennichi is associated with global warming correlated genetic admixture and population-specific temperature adaptations. Mol. Ecol. 2013, 22, 2232–2248. [Google Scholar] [CrossRef]
  34. Jin, J.; Wang, Q. Assessing ecological vulnerability in western China based on Time-Integrated NDVI data. J. Arid Land 2016, 8, 533–545. [Google Scholar] [CrossRef] [Green Version]
  35. Xu, B.; Yang, X.C.; Bai, K.Y.; Chen, Z.X.; Qin, Z.H.; Qiu, J.J. Alfalfa climatic subdivisions in China. Acta Agrestia Sin. 2007, 15, 316–321. [Google Scholar]
  36. Liu, Y.H. Study on the Relations between Growth Development and Yield Formation of Alfalfa and Climate Conditions; Northwest A & F University: Yangling, China, 2006. [Google Scholar]
  37. Guilbault, K.R.; Brown, C.S.; Friedman, J.M.; Shafroth, P.B. The influence of chilling requirement on the southern distribution limit of exotic Russian olive (Elaeagnus angustifolia) in western North America. Biol. Invasions 2012, 14, 1711–1724. [Google Scholar] [CrossRef] [Green Version]
  38. Fang, Q.E. Study on the Rules of Alfalfa Crown Bud Developing into Shoot and Its Winter Hardiness in the State of Dormancy; Gansu Agricultural University: Lanzhou, China, 2016. [Google Scholar]
  39. Niles, M.T.; Lubell, M.; Brown, M. How limiting factors drive agricultural adaptation to climate change. Agric Ecosyst. Environ. 2015, 200, 178–185. [Google Scholar] [CrossRef] [Green Version]
  40. Chu, S.L. The Study on Climatic Regionalization of Alfalfa Based on GIS Technology in China; Lanzhou University: Lanzhou, China, 2008. [Google Scholar]
  41. Peterson, A.T.; Soberón, J.; Pearson, R.G.; Anderson, R.P.; Martínez-Meyer, E.; Nakamura, M.; Araújo, M.B. Ecological Niches and Geographic Distributions (MPB-49). In Monographs in Population Biology; Princeton University Press: Princeton, NJ, USA, 2011; p. 49. [Google Scholar] [CrossRef]
  42. Pincebourde, S.; Murdock, C.C.; Vickers, M.; Sears, M.W. Fine-Scale Microclimatic Variation Can Shape the Responses of Organisms to Global Change in Both Natural and Urban Environments. Integr. Comp. Biol. 2016, 56, 45–61. [Google Scholar] [CrossRef] [PubMed] [Green Version]
  43. Li, G.Q.; Rogers, P.C.; Huang, J.H. Black locust (Robinia pseudoacacia L.) range shifts in China_ Application of a global model in climate change futures. Clim. Change Ecol. 2021, 2, 100036. [Google Scholar] [CrossRef]
Figure 1. The suitable habitat of Chinese alfalfa and its relationship with other influencing factors. (A) Occurrence records of Chinese alfalfa with topography in China; (B) potential suitable habitat of Chinese alfalfa in China; (C) graded suitable habitat of Chinese alfalfa and (D) the relationship with graded suitable habitat of Chinese alfalfa and dry and wet divisions. (I) Humid region with non-distinct dry season; (II) humid region with distinct dry season; (III) semi-humid region; (IV) semi-arid region; (V) arid region; (VI) extremely arid region.
Forests 13 00482 g001
Figure 2. The response curve of climatic suitability for six dominant climatic factors. (A) Precipitation of driest month (PDM, mm); (B) precipitation seasonality (PS, %); (C) annual mean temperature (AMT, °C); (D) annual precipitation (AP, mm); (E) precipitation of driest quarter (PDQ, mm); (F) precipitation of coldest quarter (PCQ, mm).
Forests 13 00482 g002
Figure 3. The limiting factors map of Chinese alfalfa in China. AMT (annual mean temperature, °C); AP (annual precipitation, mm); PDM (precipitation of driest month, mm); PS (precipitation seasonality, %); MTWM (maximum temperature of warmest month, °C); TAR (temperature annual range, °C); PWAQ (precipitation of warmest quarter, mm). Coarse black polygon represents potential suitable habitat range of Chinese alfalfa.
Forests 13 00482 g003
Figure 4. Multivariate environmental similarity surface (MESS) map of novel habitat. Coarse black polygon represents potential suitable habitat range of Chinese alfalfa. Red color represents interpolation habitat (positive value), green color represents extrapolation habitat (negative value), and yellow color represents marginal habitat (near zero).
Forests 13 00482 g004
Table 1. Overview of bioclimatic variables used in this study.
Climatic VariablesAbbreviationUnit
Annual mean temperatureAMT°C
Mean diurnal rangeMDR°C
IsothermalityIS°C
SD of temperature seasonalityTS°C
Max temperature of warmest monthMTWM°C
Min temperature of coldest monthMTCM°C
Temperature annual rangeTAR°C
Mean temperature of wettest quarterMTWQ°C
Mean temperature of driest quarterMTDQ°C
Mean temperature of warmest quarterMTWAQ°C
Mean temperature of coldest quarterMTCQ°C
Annual precipitationAPmm
Precipitation of wettest monthPWMmm
Precipitation of driest monthPDMmm
Precipitation seasonalityPS%
Precipitation of wettest quarterPWQmm
Precipitation of driest quarterPDQmm
Precipitation of warmest quarterPWAQmm
Precipitation of coldest quarterPCQmm
Table 2. Climatic threshold of suitable habitat map for Chinese alfalfa predicted by the MaxEnt (See Table 1. for abbreviations).
Climatic FactorRelative Importance (%)Climatic Thresholds
Highly Suitable
(0.7–1.0)
Moderately Suitable (0.5–0.7)Lowly Suitable (0.3–0.5)Unsuitable (0.0–0.3)
PDM160.0–14.00.0–14.00.0–34.00.0–200.0
PS12.923.8–108.228.7–151.032–150.221.9–146.4
AMT113.9–15.51.8–15.3−0.2–14.7−16.1–25.5
AP10.814.0–664.015.0–675.015–778.012.0–3846.0
PDQ9.71.0–47.01.0–47.01.0–112.00.0–726.0
PCQ9.22.0–51.02.0–49.01.0–54.00.0–761.0
MTWM6.821.4–42.020.5–42.019.2–42.41.5–39.1
TAR433.9–55.130.6–56.028.2–57.113.3–62.5
TS3.9839.7–1616.6765.7–1672.1629.4.0–1658.9283.4–1752.0
MTCM3.3−21.8–4.5−26.4–4.3−27.2–3.4−37.3–17.4
MDR2.99.7–14.79.0–16.27.9–17.55.0–18.4
PWAQ2.28.0–335.09.0–472.010.0–47110.0–2339.0
MTDQ2.2−14.0–12.2−14.5–12.5−16.1–12.5−27.3–22.3
IS1.618.8–36.419.0–37.118.5–38.218.5–53.4
MTCQ1.4−14.0–1.6−17.6–1.7−19.0–2.5−27.6–21.4
MTWQ0.814.1–32.613.8–32.413.0–31.5−15.4–29.8
PWM0.63.0–1164.0–228.04.0–227.04.0–924.0
PWQ0.38.0–345.09.0–472.010.0–471.010.0–2239.0
MTWAQ0.214.4–32.613.8–32.411.7–31.5−5.1–29.9
Publisher’s Note: MDPI stays neutral with regard to jurisdictional claims in published maps and institutional affiliations.

