Article

Responses to Climate Change of Maximum Latewood Density from Larix speciosa Cheng et Law and Abies delavayi Franch. in the Northwest of Yunnan Province, China

1
Key Laboratory of Land Surface Pattern and Simulation, Institute of Geographic Sciences and Natural Resources Research, CAS, Beijing 100101, China
2
University of Chinese Academy of Sciences, Beijing 100049, China
*
Author to whom correspondence should be addressed.
Forests 2022, 13(5), 720; https://doi.org/10.3390/f13050720
Submission received: 1 April 2022 / Revised: 30 April 2022 / Accepted: 1 May 2022 / Published: 4 May 2022

Abstract

:
Tree-ring density has been used for climate-response analysis and climate reconstruction for many species. However, our knowledge of wood density for the responses of different species to climate remains very limited and inconclusive. To determine the relationship between maximum latewood density (MXD) and climate for deciduous and evergreen coniferous species, MXD chronologies were developed from Larix speciosa Cheng et Law and Abies delavayi Franch. growing at 3200–3300 m a.s.l. in Gongshan county, northwestern Yunnan, in China. Significant positive correlations with late summer mean temperature were found for the MXD chronologies of both species. However, the highest correlation occurred in August–September for L. speciosa (r = 0.551, p < 0.01) and in September–October for A. delavayi (r = 0.575, p < 0.01), which may be associated with the physiological habits of trees. Linear model can describe relationships between late-summer temperature and MXD index for L. speciosa (MXD = 0.0506T8–9 − 0.0509, R2 = 30.3%) and A. delavay (MXD = 0.0317T9–10 + 0.4066, R2 = 33.0%). The composite chronology from the two species can reveal a late summer temperature (August−October) signal with the explained variance 32.2% for its response model. However, in dry areas and or at high altitudes close to upper tree line, the responses of wood densities to climate require further investigation for deciduous and evergreen coniferous species.

1. Introduction

Tree-ring data, for example, tree-ring width (TRW) and density, have been used widely in global climate reconstructions from hundreds to thousands of years [1,2,3,4,5,6,7,8,9,10,11]. Compared to TRW, maximum latewood density (MXD) contains an enhanced temperature signal of growing season because it is less influenced by biological memory [3,4,12,13,14,15,16,17]. Since the 1980s, many temperature series have been reconstructed, based on MXD, from different genera in the Northern Hemisphere, such as Pinus [1,2,5,18,19,20,21], Picea [22,23,24,25,26], Larix [27,28], Abies [29,30], Pseudotsuga [30,31], and Tsuga [30,31]. In China, many climate series have also been reconstructed based on MXD from different species since the 1990s [32], for example, Larix gmelinii (Rupr.) Rupr. in the North Da Hinggan Mountains [33], Larix olgensis Henry in the Changbai Mountains [34], Picea schrenkiana Fisch. et Mey. in the Tianshan Mountains [35,36,37], and Picea purpurea Mast. [38], Picea brachytyla (Franch.) Pritz. var. complanata (Mast.) Cheng ex Rehd. [39], and Abies georgei Orr var. smithii (Viguie et Gaussen) Cheng et L. [12] in the east and southeast of the Tibetan Plateau. However, there were differences regarding the explained variances of the tree-ring density among tree species from different areas during the instrumental period. For example, the MXD series from Picea likiangensis var. balfouriana (Rehd. et Wils.) Hillier ex Slsvin explained 42.6%–71.4% variances for the August–September or April–September mean temperature during the instrumental period in southwestern China [40,41,42,43,44,45]. Abies fabri (Mast.) Craib MXD in the Gongga Mountains explained 53.3% (1960–2007) for August–September mean temperature, and mean latewood density of Abies georgei var. smithii in Sygera Mountain explained 39.4% for the same climate variable (1950–2008) [12,46]. The possible causes of these different variances may be caused not only by different growing environments (degree of continentality, elevation, latitude, and exposure), but also by tree species.
Some studies have investigated how tree ring density varied with elevation [16,47,48,49]. The results indicated that the mean absolute MXD values varied with elevation in the central Scandinavian mountains [47], and a positive influence of warm summers on high elevation and a positive influence of summer precipitation on low elevation MXD in the Tatra Mountains in Slovakia [16]. However, the influences of inner heredity from tree species cannot be ignored, although the growth increment and climate relationships of tree-rings are significantly more dependent on their site environments [50,51]. The European project named GenTree (http://www.gentree-h2020.eu, accessed on 16 January 2021) tries to provide systematic evaluations of phenotypic and genomic variation among tree species under different circumstances for all of Europe [52]. Only a few studies have investigated the inter-species comparison of wood density responses to climate, which appears to vary regionally. For example, in the dry conditions of northern Mexico, the inter-annual variation of the minimum density for Pinus lumholtzii B. L. Rob. & Fernald showed a stronger water availability signal because of its ability to inhabit drier sites compared to Pinus durangensis Martínez [53]. Similar relationships with climate were found for the inter-annual variation in MXD of Abies veitchii Lindl. and Abies mariesii Mast. at 1900 m a.s.l. on Mount Norikura, central Japan [48]. In China, MXD from L. gmelinii and Pinus sylvestris L. var. mongolica Litv. had a similar correlation with July−August mean temperature in the Da Hinggan Mountains [54]. However, an understanding of the growth-climate-species interactions for tree-ring density is currently limited, and an investigation of the relationships between tree-ring density among species, in particular under the same growing conditions, is necessary.
The northwest of Yunnan Province is located in the south of the Hengduan Mountains. Abundant conifer species are present because of the complex terrain, which has significant potential for dendroclimatological studies [55]. There are mixed forests of Larix speciosa Cheng et Law and Abies delavayi Franch.in the north of Gaoligong Mountain [56], which provides the same growing environment for an assessment of climatic sensitivity of tree-ring density from different species. The L. speciosa is a deciduous conifer species, which prefers to a sunny, warm, and well-drained environment at 2500–3800 m a s l altitude [57]. Meanwhile, A. delavayi is an evergreen species mainly distributed in warm and shady slopes with elevation ranges from 3000 to 4300 m a s l. [58].
A warmer growing season is beneficial for tree-ring radial growth and thickening of the cell wall of L. speciosa in 3200–3300 m a.s.l., with positive correlations to May−August temperature for tree-ring width and to August−September temperature for its MXD [57,59]. Different to L. speciosa, warm and dry air conditions in spring limit stomatal aperture and then reduce photosynthesis rates, slowing its radial growth of stem for A. delavayi [58]. For instance, the annual basal area increment of A. delavayi above 3600 m a.s.l. showed a decreasing trend since the 1950s under the warming and drying climate [60]. As lower relative humidity in spring makes light isotope of A. delavayi lost easily, the tree-ring stable oxygen isotope (δ18O) yields a negative response to spring relative humidity. However, the MXD of Abies delavayi var. motouensis in 4000 m a.s.l, which is a variant of A. delavayi, still strongly respond to August–September temperature with correlation coefficient of 0.79 [61]. It is uncertain that their different climate responses of tree-ring growth were caused by species difference, because they had different growing environment.
Here, to compare their similarities and differences in response to climate, we collected tree ring cores from L. speciosa and A. delavayi in a mixed forest to develop MXD chronologies and conduct response analysis. The results will provide scientific information for future regional large-scale climate reconstruction studies for selected species.

2. Materials and Methods

2.1. Study Area

The study area was located in the southeastern Tibetan Plateau, in the Yunnan Province of Southwestern China. The Nujiang, Lantsang, and Jinsha Rivers traverse from north to south (Figure 1A). The floral distribution changes with elevation, and the vegetation is sub-alpine coniferous forest, such as Tsuga dumosa (D. Don) Eichler, L. speciosa, and A. delavayi at 2700–3500 m a.s.l. [57]. According to the meteorological records of Gongshan (98.67° E, 27.75° N, 1595.7 m a.s.l.), Deqin (98.88° E, 28.45° N, 3488.0 m a.s.l.), and Weixi (99.28° E, 27.27° N, 2321.5 m a.s.l.) stations, the mean annual temperature is 10.6 °C, with a mean temperature 17.5 °C in July (the warmest month) and 3.1 °C in January (the coldest month). The mean annual precipitation is 1094.3 mm, with two rainy peaks in March–April and June–August (Figure 1B).

2.2. Tree-Ring Data

Tree-ring increment cores from L. speciosa and A. delavayi were collected from a southeast-facing slope (98.477° E, 27.786° N, 3200–3300 m a.s.l.) in Gongshan county, northwestern Yunnan in November, 2012 and 2019. Clumping Fargesia praecipua Yi grows under the canopy (Figure 1C), resulting in less sunlight and relatively high humidity in the forest. The soil surface is covered with fallen leaves and branches, forming a relatively thick layer of litter. Ninety-six increment cores were sampled from 50 living Larix trees, and 108 cores were sampled from 55 living Abies trees, and 51 cores from 26 Larix trees and 51 cores from 27 Abies trees were selected for densitometric analyses (Table 1). These did not decay and were without spiral growth and scars [62].

2.3. Climate Data

The climate data from the Gongshan, Deqin, and Weixi stations were obtained from the China Meteorological Data Service Centre (https://data.cma.cn/, accessed on 5 January 2021), and included monthly mean maximum temperature (Tmax), monthly mean temperature (Tmean), monthly mean minimum temperature (Tmin), and monthly precipitation (P). In mountainous areas, the temperature and precipitation vary with the altitude [63]. Therefore, the sampling site and its nearest station Gongshan may have a different climate due to a nearly 1600 m elevational difference. To find a better representation of climate at a sampling site, monthly temperature and precipitation data from the Climate Research Unit (CRU TS4.04, with the spatial resolution of 0.5° × 0.5° https://catalogue.ceda.ac.uk/, accessed on 31 December 2020) at two grid points (98.250° E/27.750° N and 98.750° E/27.750° N) near the sampling site were used for the growth responses analysis (Table 1). The CRU TS4.04 data were interpolated from meteorological station data. However, most station records started after 1950 in China, meaning this dataset span 1951–2019 has a higher quality than data from 1901–1950 [64]. Thus, we only analyzed climate responses during 1951–2019.

2.4. Chronology Development

The tree-ring cores were processed according to the standard procedures for densitometric analysis [65] and were visually cross-dated with a microscope. The TRW in each year was measured using the LINTAB measurement system, with a precision of 0.01 mm. The examination and validation of raw TRW were executed by the COFECHA program [66]. The tree-ring cores were then cut into subsections at lengths of 3–4 cm. The subsections were mounted on support blocks and the wood fiber angles were measured using a Dendroscope and cut into 1.0 mm slices with a twin-bladed Dendrocut. The resin was extracted after 72 h with a water bath of 80 °C. The slices were kept at a constant room temperature of 20 °C and 50% relative humidity for 12 h before X-ray photography was taken. The grey-scale values of X-ray film were measured by the DENDRO-2003 tree-ring workstation. The density cross-dating was determined by comparing the consistency of the variations of raw tree-ring width series, which were measured by the DENDRO-2003 densitometer and the LINTAB measurement system [45].
The MXD chronologies of L. speciosa and A. delavayi were developed by using the ARSTAN program [67]. Each series of tree-ring MXD measurements was fitted with a 67% cubic smoothing spline at a 50% cutoff frequency to remove the non-climatic trends from the age, size, and effects of stand dynamics [68]. Each value in the detrended series was calculated as the ratio of tree-ring original value to the corresponding spline curve value in a given year. Index series of all samples were averaged to form a mean chronology using a robust mean value function [67]. All the measurements of the two species were entered into a file and then run with the ARSTAN program to develop the composite chronology using the same detrending and standardizing method. The mean correlation coefficient between trees (Rbt), signal-to-noise ratio (SNR), and expressed population signal (EPS) was used for a statistical characteristic analysis of chronology. The Rbt represents the chronology signal strength, the SNR expresses the strength of the observed common signal among the trees [48], and EPS indicates the representativeness of a subsample to the entire sample. The threshold of 0.85 determines the trusted period of the chronology [69]. Standard chronologies (STD) and residual chronologies (RES) were utilized for comparing climate signals in different chronologies and determining which was more appropriate for climate-growth analysis.

2.5. Climate-Growth Response Analysis

The Pearson’s correlation coefficients of MXD and the climate variables (Tmin, Tmean, Tmax, and P) from September of the previous year to October of the current year were calculated. To test whether the correlation with climate was influenced by variations in the low-frequency domain of MXD chronologies, the correlation coefficients between the chronologies and the climate data after the first order differences were calculated. A spatial field correlation analysis was performed between the MXD chronologies and the gridded climate data. A hyperbolic tangent function (Z) and test statistic (µ) were induced to estimate the significance of the differences in the correlations with contemporaneous climate variable between species [70]. A correlation with climate during the same period from different species was considered to be identical when the absolute value of µ was lower than 1.96. A linear regression model was developed to estimate specific statistical relationships between MXD and climate parameters, and the slopes were used to estimate the responsive sensitivity to climate.

3. Results

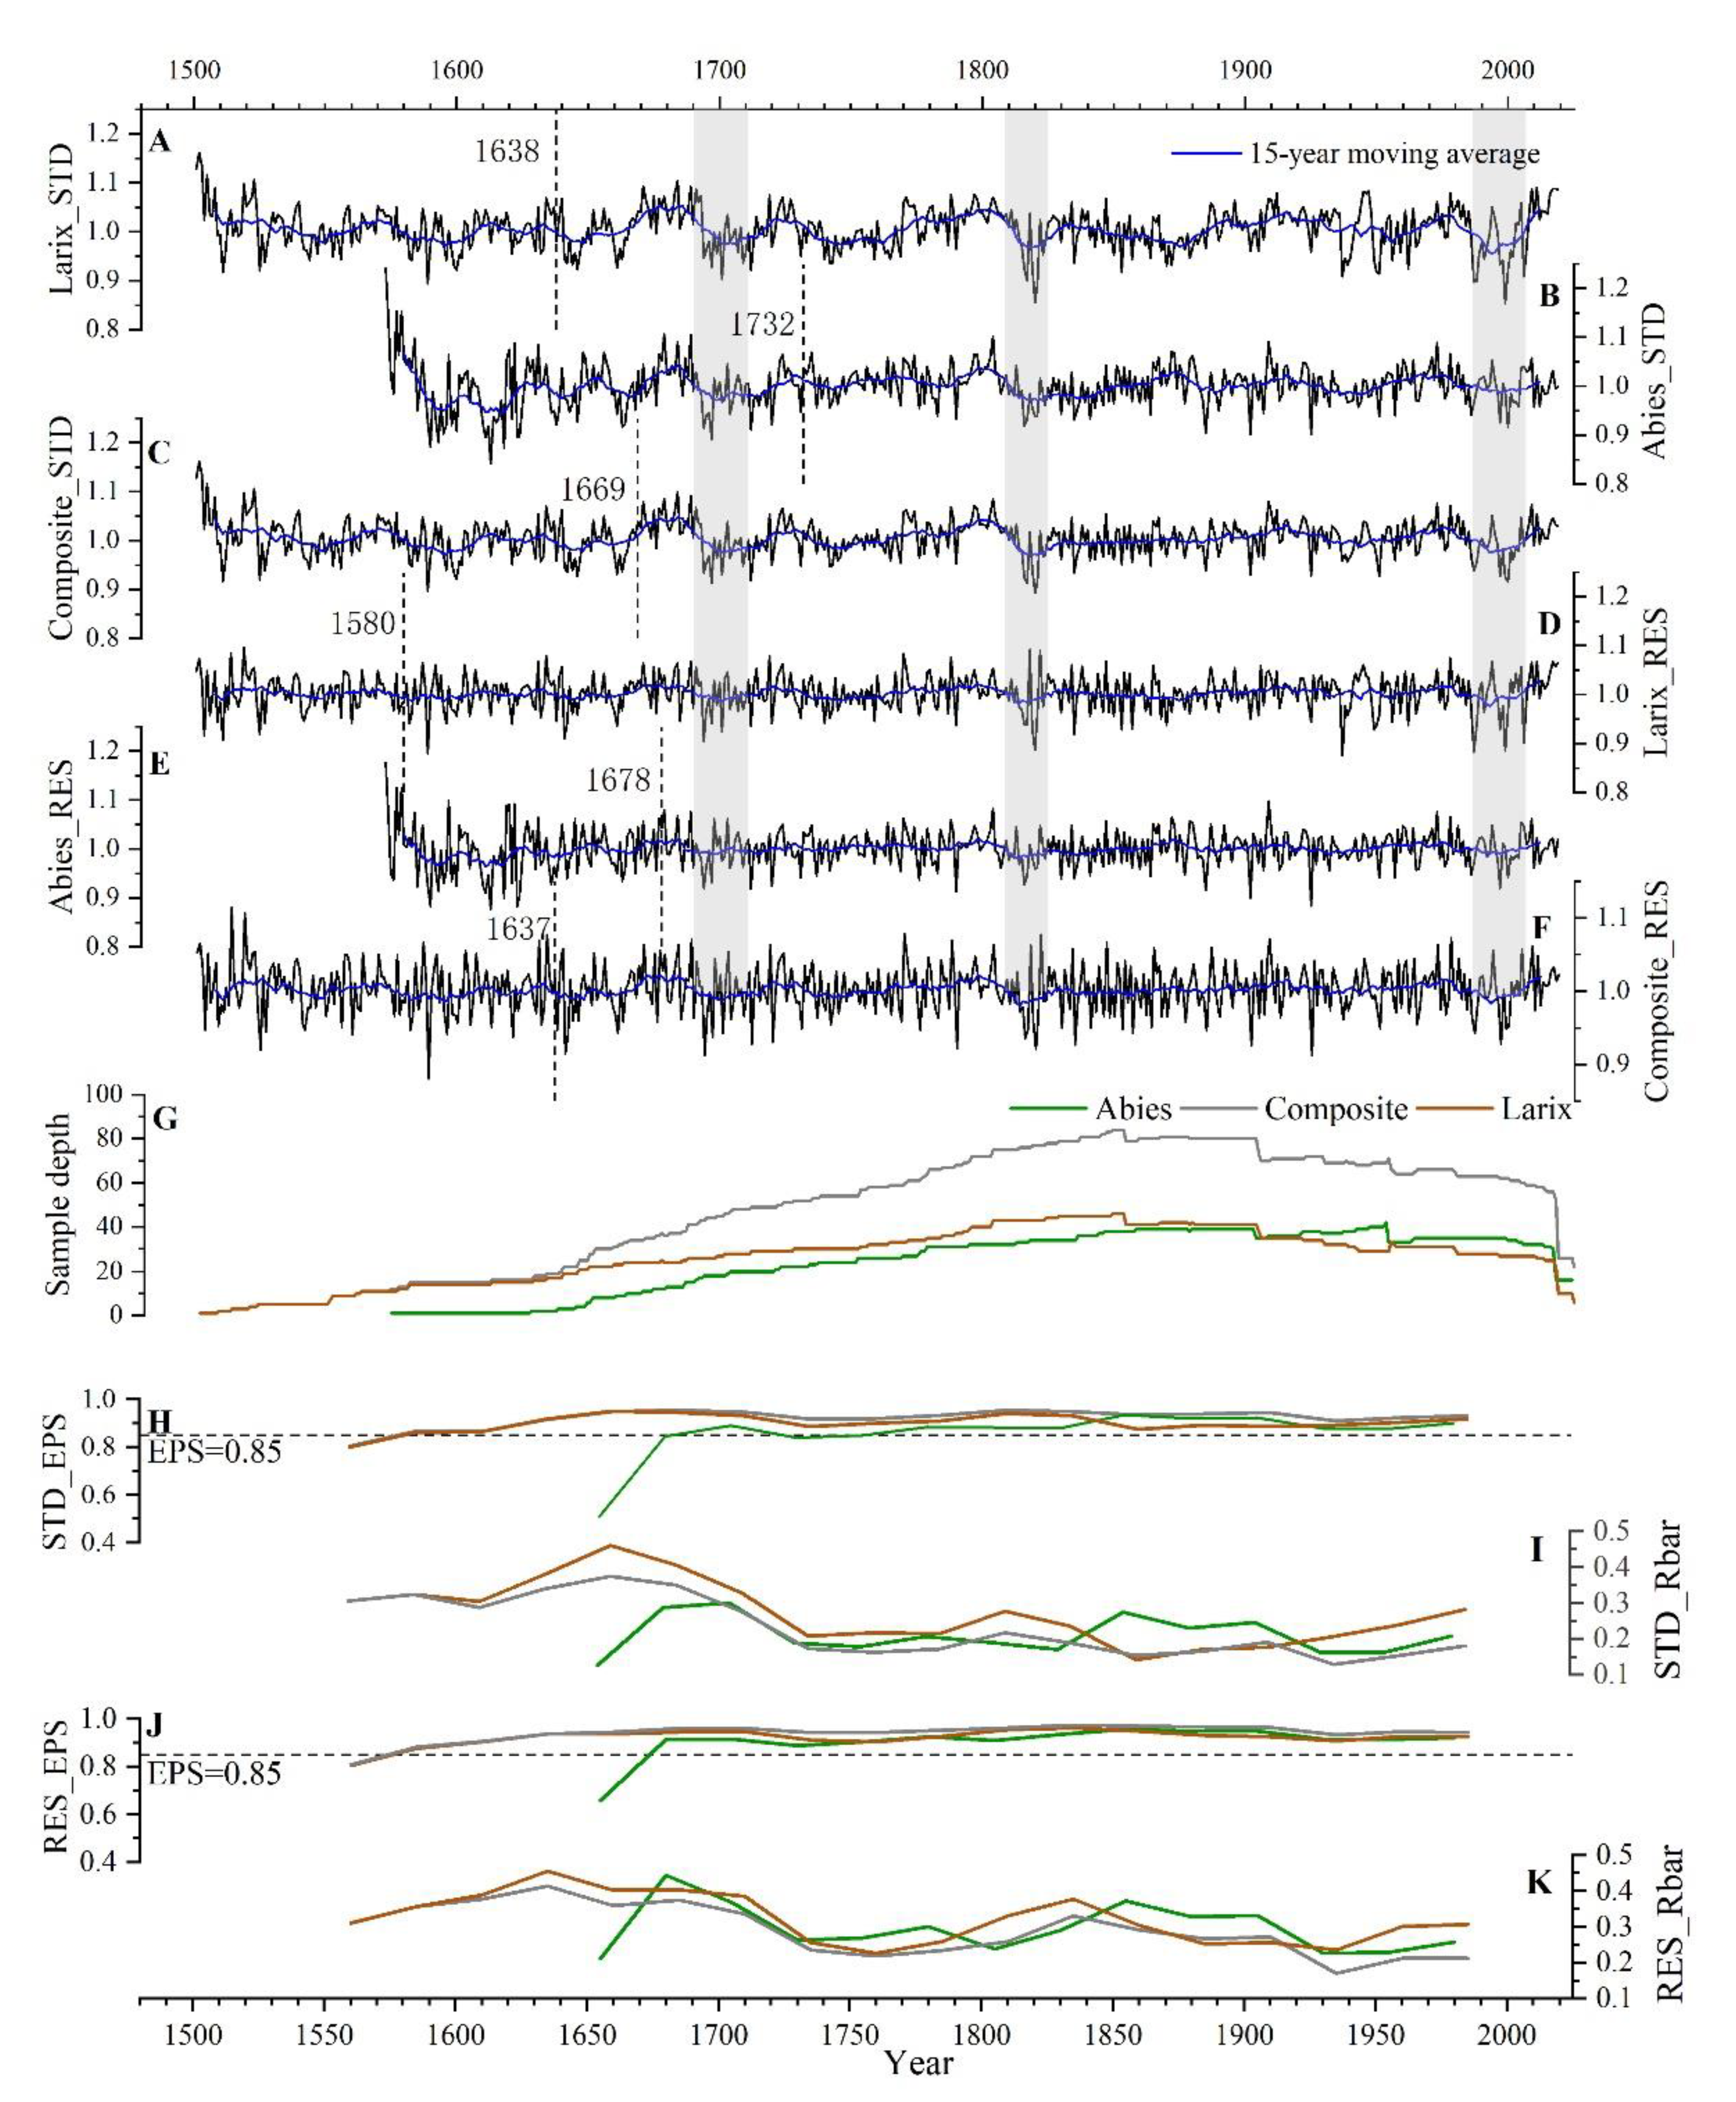
3.1. Statistical Parameters of Chronologies

The 519-year MXD chronology of L. speciosa covered the time period 1501–2019 A.D. (Figure 2A) and the 447-year MXD chronology of A. delavayi was for the time period 1573–2019 A.D. (Figure 2B) (Table 2). The higher first-order autocorrelation (AC1) of L. speciosa STD chronology indicated that L. speciosa had more climate memory than A. delavayi. Beginning in 1638 (1580) for the Larix STD (RES) chronology, the series could be considered reliable with sufficient numbers of samples because the EPS reached 0.85 with 18 (13) cores (Figure 2A,D,H,I). The STD (RES) chronology of A. delavayi began in 1732 (1678) with 23 (13) cores when the EPS exceeded 0.85, which was later than that of the L. speciosa STD (RES) (Figure 2B,E,H,I). The Rbt of both species ranged from 0.2–0.3, showing low common signals between trees. The mean sensitivity of the two MXD chronologies was 0.035 and 0.05, indicating small differences in MXD of two adjacent rings. This was similar to the results of other studies in this region [59,69]. In addition, the RES of MXD for the two species showed a higher signal-to-noise ratio (SNR) compared with STD, indicating more climatic signal in the RES chronologies.
The composite chronologies showed a high AC1 for STD and a low ACI for RES, which was the same as for L. speciosa. The EPS of composite chronology reached 0.85 in 1669 for STD and 1637 for RES with 35 and 20 cores, respectively (Figure 2C,H–K) (Table 2). However, the composite chronology displayed a lower Rbt and the variance explained by the first eigenvector (PC1) than each individual species chronology, which may have resulted from the mixture of different species MXD. However, the composite chronology still retained a strong climate signal according to their high SNR values.
Similarities between low-frequency MXD series (15-year moving average) for the two species were apparent at the decadal scale (Figure 2A,B), high-index intervals occurred in 1672–1691, 1720–1734, 1771–1810, 1902–1919, and 1965–1980, and marked low-index intervals appeared in 1695–1716, 1812–1828, and 1989–2006. The difference occurred in 1735–1770, 1829–1882, and 1938–1964 at the decadal scale. The MXD values of L. speciosa decreased, while that of A. delavayi increased. A significant negative correlation in 1841–1899 between the low-frequency series also suggested an adverse growing trend (Figure 3). Furthermore, unstable correlations during 1731–1781 and low correlations during 1936–1964 of the 15-year moving average series also indicated less common low-frequency information in the MXD chronologies of the two species.

3.2. Responses of Abies and Larix MXD to Climate

Figure 4 shows the results of the climate response analysis. The L. speciosa MXD displayed positive correlations with the mean temperature during August–September (r = 0.551, p < 0.01) (Figure 4A,D,G). It also was more sensitive to mean maximum temperature (r = 0.499, p < 0.01) than minimum temperature (r = 0.369, p < 0.01) from August to September. However, L. speciosa MXD showed a negative response to the current September precipitation (r = −0.273, p < 0.05) (Figure 4J). For A. delavayi MXD, it showed positive correlations with mean temperature of April (r = 0.286, p < 0.05) and September–October (r = 0.575, p < 0.01) (Figure 4B,E,H). In addition, A. delavayi MXD positively correlated with the precipitation in current February (r = 0.289, p < 0.05), and negatively related to precipitation in April (r = −0.387 for first difference, p < 0.05) (Figure 4L). Although similar correlations with mean temperature during late summer for both species, the strongest responsive time was August–September for L. speciosa while September–October for A. delavayi. These were also statistically significant for the first-difference data for both species, respectively (r = 0.538 and r = 0.719, p < 0.01). The results indicated that there was a difference about the response time between the two species. The absolute values of statistic (µ) of less than 1.96 during the growing season also suggested the accordance of responses to temperature for the tree-ring density of the two species (Figure 4E,F,I,L).

3.3. Statistic Model of Climate-Growth Relationships for MXD

Despite the different response seasons from the MXD of the two species, there was similar climatic sensitivity between them. For L. speciosa MXD, its relationship to August–September mean temperature was more suitable to a linear model, with MXD changes of 0.0506 sigma unit per centigrade (Figure 5). While its distribution to September–October mean temperature is relatively discrete, only with explained variance 14.1% for a linear fit. For A. delavayi MXD, the linear model described its relationships to September–October mean temperature better, with a slope of 0.0317 sigma unit per centigrade. Composite chronologies also retained a late summer (August–October) temperature signal, with the explained variance 32.2% of the response model.

4. Discussion

4.1. Tree Growth-Climate Relationship

The strong response to late-summer temperature of tree growth revealed the MXD characteristic, reserving climate information of the growing season during the process of cell formation [16,44,71,72]. It indicated that the wall thickness of latewood cells was likely influenced by temperature on high altitude mountains, because high-temperature conditions favored more deposited cell wall material [17,73]. In other alpine areas of the southeastern Tibetan Plateau, the MXD of coniferous species was also affected by late summer temperature [12,13,69].
However, the formation time of maximum latewood density for L. speciosa was earlier by one month than A. delavayi, which may be associated with the physiological habit of trees. A. delavayi is an evergreen coniferous species, for which the optimum temperature for photosynthesis is 10–25 °C. However, L. speciosa is a deciduous tree species, and its optimal photosynthetic temperature is 15–25 °C [74]. The maximum temperature of this site in October ranges from 6.5 to 14.7 °C, which is better for A. delavayi. Previous studies have shown that the most temperature-related month of MXD for L. gmelinii is earlier than Pinus sylvestris var. mongolica [54]. The MXD chronologies of the two species correlated differently to other reconstructions in nearby areas. For the correlation with the reconstructed July–October mean temperature in Yulong County, the L. speciosa MXD chronology was lower than A. delavayi (Figure 6A–D), which may be induced by the evergreen coniferous species spruce used in the reconstruction [69]. Furthermore, the climates of Gongshan and Yulong are similar, which may be another reason. The nearest station data may not well represent the climate of the mixed forest due to an elevational difference. Therefore, CRU TS4.04 data were employed to analyze annual variability of two species MXD and late-summer temperature (Figure 6E–G). The MXD of A. delavayi and Picea asperata Mast. were less sensitive to climate warming in the recent twenty years than L. speciosa. A non-significant correlation was found between the MXD chronologies of the two species and the reconstructed August–September mean temperature in Sygera Mountain using mean latewood density because the sampling sites were located in different climate regions [12].
The MXD chronology of A. delavayi correlated significantly with the current April Tmax and Tmean (Figure 4), while L. gmelinii did not. Studies indicate that nonstructural carbohydrates, produced both in the early and late growing season, are needed for the formation of latewood cell walls, because there were not enough photosynthates to form tissues in late summer [75]. L. gmelinii is just beginning to bud in April, and therefore, it cannot perform photosynthesis to produce photosynthate. Conversely, being an evergreen conifer species, A. delavayi has a stronger photosynthesis and accumulate more carbohydrates.
A negative correlation was also found between MXD chronology and precipitation for L. speciosa in the current September because of lower temperatures on rainy days [69]. This can be confirmed by the negative coefficient of mean temperature and precipitation as −0.416 (CRU TS 4.04). The partial correlation coefficients of RES with precipitation for L. speciosa was −0.091 (p > 0.05), which indicated that temperature is an important factor for MXD. The negative correlation that was found between MXD chronology and precipitation for Abies in April was because the high moisture content in soil can cause enlargement of earlywood cells [17,76,77], resulting in less carbohydrates reserved for the growth of latewood cells. In addition, the positive correlation between A. delavayi and precipitation in February could be caused by increasement in snow depth. For one hand, the snow cover acts as a reservoir for soil and trees during the growing season [78]. For the other, months with more precipitation have a high relative humidity. A wet condition in February can prevent the reduced leaf photosynthesis due to an excessive transpiration [58]. A. delavayi normally photosynthesize with foliage to accumulate carbohydrate for later growth [79,80].

4.2. Potentials and Limitations of MXD for Different Species for Climate Reconstruction

The composite chronology not only retained the August temperature information of L. speciosa, but also contained October temperature signals of A. delavayi. The spatial correlation reflected that MXD for both L. speciosa and A. delavayi contained the August–October mean temperature signal in the southeastern Tibetan plateau (Figure 7). Therefore, if there are insufficient replications for one site, developing composite chronologies of different species is suggested, which can reflect the climate response of the tree-ring density for an entire forest well.
Different results would be obtained if sampling sites were in arid areas, whereby, the xylem growth for different species may respond to drought differently. On the lowest elevation of the southern Black Forest, drought may lead to cell differentiation of Fagus sylvatica L. to stop earlier and damage growth more severely compared to Abies alba Mill and Pinus sylvestris L. [81]. The minimum wood density of P. lumholtzii is more sensitive to drought than P. durangensis in Sierra Madre Occidental because P. lumholtzii can inhabit drier sites [53]. Therefore, different responses to climate for the wood density of deciduous and evergreen coniferous species may occur under drought conditions because of their physiological properties. This issue requires further investigation.

5. Conclusions

In this study, an assessment of the climate signals of MXD data for L. speciosa and A. delavayi growing under the same conditions in the northwest of Yunnan Province, was presented. It was found that the MXD chronologies of two species were positively responsive to late summer mean temperature. However, there were differences in the response span to climate between their MXD chronologies. The most sensitive period was August–September for L. speciosa, and September–October for A. delavayi., which may be associated with the deciduous properties of trees. While composite MXD chronology from two species in moister areas can reveal signal of the August–October mean temperature, which meant that tree-ring density from different species in moister areas could produce a new series for reconstruction. Meanwhile, the question of whether their wood densities respond to climate differently requires further verification for deciduous and evergreen coniferous species under dry conditions. Furthermore, our sampling site is near the center of forest ecological amplitude, where good environmental conditions limit the response of tree growth to climate. Tree-ring growth in a mixed forest close to upper tree line is more sensitive to temperature, and there may be a different responsive amplitude between species.
Some low-frequency differences occurred in 1735–1770, 1829–1882, and 1938–1964 for L. speciosa and A. delavayi. More evidence is needed to verify that the same difference exists in other tree species. There is also a question to answer that how to qualitatively and quantitatively estimate the impact of multiple-species origin on climate reconstruction and how to eliminate such influence.

Author Contributions

Methodology, G.D.; validation, G.D.; formal analysis, G.D.; resources, M.L. and X.S.; data curation, G.D.; writing—original draft preparation, G.D.; writing—review and editing, M.L. and Z.H.; visualization, G.D.; supervision, M.L.; project administration, M.L.; funding acquisition, M.L. All authors have read and agreed to the published version of the manuscript.

Funding

This research was funded by National Natural Science Foundation of China (grant number 41977391, 41630529 and 41571194).

Institutional Review Board Statement

Not applicable.

Informed Consent Statement

Not applicable.

Data Availability Statement

The residual chronology of maximum latewood density for A. delavayi can be found in Global Change Research Data Publishing & Repository: http://www.geodoi.ac.cn/WebCn/doi.aspx?Id=2070 (accessed on 29 April 2022). Other data presented in this study are available on request from the corresponding author. The data are not publicly available due to privacy restrictions.

Acknowledgments

The authors thank Weili Xu and Xueping Feng for their assistance with the tree-ring density experiments and Hongli Wang for assisting with the chronology development.

Conflicts of Interest

The authors declare no conflict of interest.

References

  1. Grudd, H. Torneträsk tree-ring width and density ad 500–2004: A test of climatic sensitivity and a new 1500-year reconstruction of north Fennoscandian summers. Clim. Dyn. 2008, 31, 843–857. [Google Scholar] [CrossRef] [Green Version]
  2. Zhang, P.; Linderholm, H.W.; Gunnarson, B.E.; Björklund, J.; Chen, D. 1200 years of warm-season temperature variability in central Scandinavia inferred from tree-ring density. Clim. Past 2016, 12, 1297–1312. [Google Scholar] [CrossRef] [Green Version]
  3. Klippel, L.; Krusic, P.J.; Konter, O.; George, S.S.; Trouet, V.; Esper, J. A 1200+ year reconstruction of temperature extremes for the northeastern Mediterranean region. Int. J. Clim. 2018, 39, 2336–2350. [Google Scholar] [CrossRef] [Green Version]
  4. Esper, J.; George, S.S.; Anchukaitis, K.; D’Arrigo, R.; Ljungqvist, F.C.; Luterbacher, J.; Schneider, L.; Stoffel, M.; Wilson, R.; Büntgen, U. Large-scale, millennial-length temperature reconstructions from tree-rings. Dendrochronologia 2018, 50, 81–90. [Google Scholar] [CrossRef] [Green Version]
  5. Matskovsky, V.V.; Helama, S. Testing long-term summer temperature reconstruction based on maximum density chronologies obtained by reanalysis of tree-ring data sets from northernmost Sweden and Finland. Clim. Past 2014, 10, 1473–1487. [Google Scholar] [CrossRef] [Green Version]
  6. Esper, J.; Schweingruber, F.H.; Winiger, M. 1300 years of climatic history for Western Central Asia inferred from tree-rings. Holocene 2002, 12, 267–277. [Google Scholar] [CrossRef] [Green Version]
  7. Cook, E.R.; Anchukaitis, K.J.; Buckley, B.M.; D’Arrigo, R.D.; Jacoby, G.C.; Wright, W.E. Asian Monsoon Failure and Megadrought During the Last Millennium. Science 2010, 328, 486–489. [Google Scholar] [CrossRef] [Green Version]
  8. Shao, X.; Wang, S.; Zhu, H.; Xu, Y.; Liang, E.; Yin, Z.-Y.; Xu, X.; Xiao, Y. A 3585-year ring-width dating chronology of qilian juniper from the northeastern qinghai-tibetan plateau. IAWA J. 2009, 30, 379–394. [Google Scholar] [CrossRef] [Green Version]
  9. Cook, E.R.; Seager, R.; Kushnir, Y.; Briffa, K.R.; Büntgen, U.; Frank, D.; Krusic, P.J.; Tegel, W.; Van Der Schrier, G.; Andreu-Hayles, L.; et al. Old World megadroughts and pluvials during the Common Era. Sci. Adv. 2015, 1, e1500561. [Google Scholar] [CrossRef] [Green Version]
  10. Grudd, H.; Briffa, K.; Karlén, W.; Bartholin, T.S.; Jones, P.D.; Kromer, B. A 7400-year tree-ring chronology in northern Swedish Lapland: Natural climatic variability expressed on annual to millennial timescales. Holocene 2002, 12, 657–665. [Google Scholar] [CrossRef]
  11. Helama, S.; Seppä, H.; Bjune, A.E.; Birks, H.J.B. Fusing pollen-stratigraphic and dendroclimatic proxy data to reconstruct summer temperature variability during the past 7.5 ka in subarctic Fennoscandia. J. Paleolimnol. 2012, 48, 275–286. [Google Scholar] [CrossRef]
  12. Li, M.Y.; Duan, J.P.; Wang, L.; Zhu, H.F. Late summer temperature reconstruction based on tree-ring density for Sygera Mountain, southeastern Tibetan Plateau. Glob. Planet. Chang. 2018, 163, 10–17. [Google Scholar] [CrossRef]
  13. Duan, J.P.; Ma, Z.G.; Li, L.; Zheng, Z.Y. August–September temperature variability on the Tibetan Plateau: Past, present, and future. J. Geophys. Res. Atmos. 2019, 124, 6057–6068. [Google Scholar] [CrossRef]
  14. Tardif, R.; Hakim, G.J.; Perkins, W.A.; Horlick, K.A.; Erb, M.P.; Emile-Geay, J.; Anderson, D.M.; Steig, E.J.; Noone, D. Last Millennium Reanalysis with an expanded proxy database and seasonal proxy modeling. Clim. Past 2019, 15, 1251–1273. [Google Scholar] [CrossRef] [Green Version]
  15. Esper, J.; Klippel, L.; Krusic, P.J.; Konter, O.; Raible, C.C.; Xoplaki, E.; Luterbacher, J.; Büntgen, U. Eastern Mediterranean summer temperatures since 730 CE from Mt. Smolikas tree-ring densities. Clim. Dyn. 2020, 54, 1367–1382. [Google Scholar] [CrossRef]
  16. Klippel, L.; Büntgen, U.; Konter, O.; Kyncl, T.; Esper, J. Climate sensitivity of high- and low-elevation Larix decidua MXD chronologies from the Tatra Mountains. Dendrochronologia 2020, 60, 125674. [Google Scholar] [CrossRef]
  17. Björklund, J.; von Arx, G.; Nievergelt, D.; Wilson, R.; Van den Bulcke, J.; Günther, B.; Loader, N.J.; Rydval, M.; Fonti, P.; Scharnweber, T.; et al. Scientific merits and analytical challenges of tree-ring densitometry. Rev. Geophys. 2019, 57, 1224–1264. [Google Scholar] [CrossRef] [Green Version]
  18. Hughes, M.K.; Schweingruber, F.H.; Cartwright, D.; Kelly, P.M. July–August temperature at Edinburgh between 1721 and 1975 from tree-ring density and width data. Nature 1984, 308, 341–344. [Google Scholar] [CrossRef]
  19. Linderholm, H.W.; Björklund, J.; Seftigen, K.; Gunnarson, B.E.; Fuentes, M. Fennoscandia revisited: A spatially improved tree-ring reconstruction of summer temperatures for the last 900 years. Clim. Dyn. 2014, 45, 933–947. [Google Scholar] [CrossRef] [Green Version]
  20. Rydval, M.; Gunnarson, B.E.; Loader, N.J.; Cook, E.R.; Druckenbrod, D.L.; Wilson, R. Spatial reconstruction of Scottish summer temperatures from tree rings. Int. J. Clim. 2016, 37, 1540–1556. [Google Scholar] [CrossRef] [Green Version]
  21. Linderholm, H.W.; Gunnarson, B.E. Were medieval warm-season temperatures in Jämtland, central Scandinavian Mountains, lower than previously estimated? Dendrochronologia 2019, 57, 125607. [Google Scholar] [CrossRef]
  22. Anchukaitis, K.J.; D’Arrigo, R.D.; Andreu-Hayles, L.; Frank, D.; Verstege, A.; Curtis, A.; Buckley, B.M.; Jacoby, G.C.; Cook, E.R. Tree-ring-reconstructed summer temperatures from Northwestern North America during the last nine centuries. J. Clim. 2013, 26, 3001–3012. [Google Scholar] [CrossRef] [Green Version]
  23. Davi, N.K.; Jacoby, G.C.; Wiles, G.C. Boreal temperature variability inferred from maximum latewood density and tree-ring width data, Wrangell Mountain region, Alaska. Quat. Res. 2003, 60, 252–262. [Google Scholar] [CrossRef]
  24. D’Arrigo, R.; Mashig, E.; Frank, D.; Jacoby, G.; Wilson, R. Reconstructed warm season temperatures for Nome, Seward Peninsula, Alaska. Geophys. Res. Lett. 2004, 31, L09202. [Google Scholar] [CrossRef] [Green Version]
  25. Jacoby, G.C.; D’Arrigo, R.D. Tree-ring width and density evidence of climatic and potential forest change in Alaska. Glob. Biogeochem. Cycles 1995, 9, 227–234. [Google Scholar] [CrossRef]
  26. D’Arrigo, R.D.; Cook, E.R.; Jacoby, G.C. Annual to decadal-scale variations in northwest Atlantic sector temperatures inferred from Labrador tree rings. Can. J. For. Res. 1996, 26, 143–148. [Google Scholar] [CrossRef]
  27. Briffa, K.R.; Jones, P.D.; Schweingruber, F.H. Summer temperatures across northern North America: Regional reconstructions from 1760 using tree-ring densities. J. Geophys. Res. Earth Surf. 1994, 99, 25835–25844. [Google Scholar] [CrossRef]
  28. Chen, F.; Yuan, Y.; Wei, W.; Wang, L.; Yu, S.; Zhang, R.; Fan, Z.; Shang, H.; Zhang, T.; Li, Y. Tree ring density-based summer temperature reconstruction for Zajsan Lake area, East Kazakhstan. Int. J. Clim. 2011, 32, 1089–1097. [Google Scholar] [CrossRef]
  29. Schweingruber, F.H.; Briffa, K.R.; Jones, P.D. Yearly maps of summer temperatures in Western Eroupe from AD 1750 to 1975 and Western North America from 1600 to 1982: Results of a radiodensitometrical study on tree rings. Vegetatio 1991, 92, 5–71. [Google Scholar] [CrossRef]
  30. Briffa, K.R.; Jones, P.D.; Schweingruber, F.H. Tree-ring density reconstructions of summer temperature patterns across Western North America since 1600. J. Clim. 1992, 5, 735–754. [Google Scholar] [CrossRef] [Green Version]
  31. Wiles, G.C.; D’Arrigo, R.D.; Jacoby, G.C. Temperature changes along the Gulf of Alaska and the Pacific Northwest coast modeled from coastal tree rings. Can. J. For. Res. 1996, 26, 474–481. [Google Scholar] [CrossRef]
  32. Deng, G.; Li, M. Advances of study on the relationship between tree-ring density and climate and climate reconstruction. Prog. Geogr. 2021, 40, 343–356. [Google Scholar] [CrossRef]
  33. Sun, Y.; Wang, L.; Chen, J.; Duan, J. Reconstructing mean maximum temperatures of May–August from tree-ring maximum density in North Da Hinggan Mountains, China. Chin. Sci. Bull. 2012, 57, 2007–2014. [Google Scholar] [CrossRef] [Green Version]
  34. Sun, Y.; Wang, L.L.; Chen, J. Response of tree growth to climate change and reconstruction of summer temperature based on Korean larch. J. Earth Environ. 2012, 3, 889–899. [Google Scholar] [CrossRef]
  35. Yu, S.; Yuan, Y.; Wei, W.; Chen, F.; Zhang, T.; Shang, H.; Zhang, R.; Qing, L. A 352-year record of summer temperature reconstruction in the western Tianshan Mountains, China, as deduced from tree-ring density. Quat. Res. 2013, 80, 158–166. [Google Scholar] [CrossRef]
  36. Zhang, Z.H.; Li, J. Precipitation and average monthly high temperature in the Jimusare, Xinjiang as reconstructed from tree density and tree width. Acta Meteorol. Sin. 1998, 56, 77–86. [Google Scholar] [CrossRef]
  37. Chen, J.; Wang, L.; Zhu, H.; Wu, P. Reconstructing mean maximum temperature of growing season from the maximum density of the Schrenk Spruce in Yili, Xinjiang, China. Chin. Sci. Bull. 2009, 54, 2300–2308. [Google Scholar] [CrossRef]
  38. Yin, H.; Liu, H.; Linderholm, H.; Sun, Y. Tree ring density-based warm-season temperature reconstruction since A.D. 1610 in the eastern Tibetan Plateau. Palaeogeogr. Palaeoclim. Palaeoecol. 2015, 426, 112–120. [Google Scholar] [CrossRef]
  39. Fan, Z.X.; Bräuning, A.; Yang, B.; Cao, K.F. Tree ring density-based summer temperature reconstruction for the central Hengduan Mountains in southern China. Glob. Planet. Chang. 2009, 65, 1–11. [Google Scholar] [CrossRef]
  40. Wang, L.; Duan, J.; Chen, J.; Huang, L.; Shao, X. Temperature reconstruction from tree-ring maximum density of Balfour spruce in eastern Tibet, China. Int. J. Clim. 2009, 30, 972–979. [Google Scholar] [CrossRef]
  41. Duan, J.; Zhang, Q.B. A 449 year warm season temperature reconstruction in the southeastern Tibetan Plateau and its relation to solar activity. J. Geophys. Res. Atmos. 2014, 119, 11578–11592. [Google Scholar] [CrossRef]
  42. Xing, P.; Zhang, Q.B.; Lv, L.X. Absence of late-summer warming trend over the past two and half centuries on the eastern Tibetan Plateau. Glob. Planet. Chang. 2014, 123, 27–35. [Google Scholar] [CrossRef]
  43. Liang, H.; Lyu, L.; Wahab, M. A 382-year reconstruction of August mean minimum temperature from tree-ring maximum latewood density on the southeastern Tibetan Plateau, China. Dendrochronologia 2016, 37, 1–8. [Google Scholar] [CrossRef]
  44. Duan, J.; Li, L.; Ma, Z.; Chen, L. Post-industrial late summer warming recorded in tree-ring density in the eastern Tibetan Plateau. Int. J. Clim. 2019, 40, 795–804. [Google Scholar] [CrossRef]
  45. Yin, H.; Li, M.Y.; Huang, L. Summer mean temperature reconstruction based on tree-ring density over the past 440 years on the eastern Tibetan Plateau. Quat. Int. 2020, 571, 81–88. [Google Scholar] [CrossRef]
  46. Duan, J.P.; Wang, L.L.; Li, L.; Chen, K.L. Temperature variability since A.D. 1837 inferred from tree-ring maximum density of Abies fabric in Gongga Mountains, China. Chin. Sci. Bull. 2010, 55, 3015–3022. [Google Scholar] [CrossRef]
  47. Zhang, P.; Björklund, J.; Linderholm, H. The influence of elevational differences in absolute maximum density values on regional climate reconstructions. Trees 2015, 29, 1259–1271. [Google Scholar] [CrossRef] [Green Version]
  48. Takahashi, K.; Okuhara, I.; Tokumitsu, Y.; Yasue, K. Responses to climate by tree-ring widths and maximum latewood densities of two Abies species at upper and lower altitudinal distribution limits in central Japan. Trees 2011, 25, 745–753. [Google Scholar] [CrossRef]
  49. Yu, S.; Zhang, T.; Jiang, S.; Zhang, R.; Qin, L.; Shang, H.; Zhang, H. Tree-ring minimum density chronologies of Picea schrenkiana along an elevation gradient in the Tien Shan Mountains, China. Geogr. Ann. Ser. A Phys. Geogr. 2020, 102, 209–221. [Google Scholar] [CrossRef]
  50. Liang, E.; Shao, X.; Eckstein, D.; Huang, L.; Liu, X. Topography- and species-dependent growth responses of Sabina przewalskii and Picea crassifolia to climate on the northeast Tibetan Plateau. For. Ecol. Manag. 2006, 236, 268–277. [Google Scholar] [CrossRef]
  51. Di Filippo, A.; Baliva, M.; Brunetti, M.; Di Fiore, L. Long-term tree-ring response to drought and frost in two Pinus halepensis populations growing under contrasting environmental conditions in Peninsular Italy. Forests 2021, 12, 305. [Google Scholar] [CrossRef]
  52. Martínez-Sancho, E.; Slámová, L.; Morganti, S.; Grefen, C.; Carvalho, B.; Dauphin, B.; Rellstab, C.; Gugerli, F.; Opgenoorth, L.; Heer, K.; et al. The GenTree Dendroecological Collection, tree-ring and wood density data from seven tree species across Europe. Sci. Data 2020, 7, 1. [Google Scholar] [CrossRef]
  53. Pompa-García, M.; Hevia, A.; Camarero, J.J. Minimum and maximum wood density as proxies of water availability in two Mexican pine species coexisting in a seasonally dry area. Trees 2021, 35, 597–607. [Google Scholar] [CrossRef]
  54. Wang, L.L.; Shao, X.M.; Lei, H.; Liang, E.Y. Tree-ring characteristics of Larix Gmelinii and Pinus Sylvestris Var. Mongolica and their response to climate in Mohe, China. Chin. J. Plant Ecol. 2005, 29, 380–385. [Google Scholar] [CrossRef]
  55. Fan, Z.X.; Bräuning, A.; Cao, K.F.; Zhu, S.D. Growth-climate responses of high-elevation conifers in the central Hengduan Mountains, southwestern China. For. Ecol. Manag. 2009, 258, 306–313. [Google Scholar] [CrossRef]
  56. Ou, G.L.; Peng, M.C.; He, Z.R.; Wang, C.Y.; Wang, H.B.; Xiang, L. Quantitative classification of plant communities on the Northern part of Gaoligong Mountains by Twinspan. Plant Divers. 2008, 30, 679–687. [Google Scholar] [CrossRef]
  57. Fan, Z.X.; Bräuning, A.; Tian, Q.H.; Yang, B.; Cao, K.F. Tree ring recorded May–August temperature variations since A.D. 1585 in the Gaoligong Mountains, southeastern Tibetan Plateau. Palaeogeogr. Palaeoclim. Palaeoecol. 2010, 296, 94–102. [Google Scholar] [CrossRef]
  58. Zhao, F.; Fan, Z.; Su, T.; Li, S.; Tang, H.; Spicer, T.E.; Zhou, Z. Tree-ring δ18O inferred spring drought variability over the past 200 years in the Hengduan Mountains, Southwest China. Palaeogeogr. Palaeoclim. Palaeoecol. 2019, 518, 22–33. [Google Scholar] [CrossRef]
  59. Li, M.Y.; Wang, L.L.; Fan, Z.X.; Shen, C.C. Tree-ring density inferred late summer temperature variability over the past three centuries in the Gaoligong Mountains, southeastern Tibetan Plateau. Palaeogeogr. Palaeoclim. Palaeoecol. 2015, 422, 57–64. [Google Scholar] [CrossRef]
  60. Yang, R.Q.; Zhao, F.; Fan, Z.X.; Panthi, S.; Fu, P.-L.; Bräuning, A.; Grießinger, J.; Li, Z.S. Long-term growth trends of Abies delavayi and its physiological responses to a warming climate in the Cangshan Mountains, southwestern China. For. Ecol. Manag. 2021, 505, 119943. [Google Scholar] [CrossRef]
  61. Bräuning, A. Tree-ring evidence of ‘Little Ice Age’ glacier advances in southern Tibet. Holocene 2006, 16, 369–380. [Google Scholar] [CrossRef]
  62. Jacoby, G.C.; Ivanciu, I.S.; Ulan, L.D. A 263-year record of summer temperature for northern Quebec reconstructed from tree-ring data and evidence of a major climatic shift in the early 1800’s. Palaeogeogr. Palaeoclim. Palaeoecol. 1988, 64, 69–78. [Google Scholar] [CrossRef]
  63. Sun, L.; Cai, Y.; Zhou, Y.; Shi, S.; Zhao, Y.; Gunnarson, B.E.; Jaramillo, F. Radial growth responses to climate of Pinus yunnanensis at low elevations of the Hengduan Mountains, China. Forests 2020, 11, 1066. [Google Scholar] [CrossRef]
  64. Harris, I.; Osborn, T.J.; Jones, P.; Lister, D. Version 4 of the CRU TS monthly high-resolution gridded multivariate climate dataset. Sci. Data 2020, 7, 109. [Google Scholar] [CrossRef] [Green Version]
  65. Cook, E.R.; Kairiukstis, L.A. Methods of Dendrochronology, 1st ed.; Springer: Dordrecht, The Netherlands, 1990; pp. 40–61. [Google Scholar]
  66. Holmes, R.L. Computer-assisted quality control in tree-ring dating and measurement. Tree-Ring Bull. 1983, 43, 51–67. [Google Scholar]
  67. Cook, E.R. A time series analysis approach to tree ring standardization. Ph.D. Dissertation, The University of Arizona, Tucson, AZ, USA, 5 August 1985. [Google Scholar]
  68. Cook, E.R.; Briffa, K.; Meko, D.M.; Graybill, D.A.; Funkhouser, G. The ‘segment length curse’ in long tree-ring chronology development for palaeoclimatic studies. Holocene 1995, 5, 229–237. [Google Scholar] [CrossRef] [Green Version]
  69. Li, M.Q.; Huang, L.; Yin, Z.Y.; Shao, X.M. Temperature reconstruction and volcanic eruption signal from tree-ring width and maximum latewood density over the past 304 years in the southeastern Tibetan Plateau. Int. J. Biometeorol. 2017, 61, 2021–2032. [Google Scholar] [CrossRef]
  70. Meng, X.L.; Rosenthal, R.; Rubin, D.B. Comparing correlated correlation coefficients. Psychol. Bull. 1992, 111, 172–175. [Google Scholar] [CrossRef]
  71. Björklund, J.; Seftigen, K.; Fonti, P.; Nievergelt, D.; von Arx, G. Dendroclimatic potential of dendroanatomy in temperature-sensitive Pinus sylvestris. Dendrochronologia 2020, 60, 125673. [Google Scholar] [CrossRef]
  72. Heeter, K.J.; Harley, G.L.; Maxwell, J.T.; McGee, J.H.; Matheus, T.J. Late summer temperature variability for the Southern Rocky Mountains (USA) since 1735 CE: Applying blue light intensity to low-latitude Picea engelmannii Parry ex Engelm. Clim. Chang. 2020, 162, 965–988. [Google Scholar] [CrossRef]
  73. Björklund, J.; Seftigen, K.; Schweingruber, F.; Fonti, P.; Arx, G.; Bryukhanova, M.V.; Cuny, H.E.; Carrer, M.; Castagneri, D.; Frank, D.C. Cell size and wall dimensions drive distinct variability of earlywood and latewood density in Northern Hemisphere conifers. New Phytol. 2017, 216, 728–740. [Google Scholar] [CrossRef] [PubMed] [Green Version]
  74. Zhang, L.; Liu, X. Plant Physiology, 2nd ed.; Science Press: Beijing, China, 2011; p. 128. [Google Scholar]
  75. Büntgen, U.; Krusic, P.J.; Verstege, A.; Barreda, G.S.; Wagner, S.; Camarero, J.J.; Ljungqvist, F.C.; Zorita, E.; Oppenheimer, C.; Konter, O.; et al. New Tree-ring evidence from the Pyrenees reveals Western Mediterranean climate variability since Medieval Times. J. Clim. 2017, 30, 5295–5318. [Google Scholar] [CrossRef]
  76. Nagavciuc, V.; Roibu, C.-C.; Ionita, M.; Mursa, A.; Cotos, M.-G.; Popa, I. Different climate response of three tree ring proxies of Pinus sylvestris from the Eastern Carpathians, Romania. Dendrochronologia 2019, 54, 56–63. [Google Scholar] [CrossRef] [Green Version]
  77. Camarero, J.J.; Rozas, V.; Olano, J.M. Minimum wood density of Juniperus thurifera is a robust proxy of spring water availability in a continental Mediterranean climate. J. Biogeogr. 2014, 41, 1105–1114. [Google Scholar] [CrossRef]
  78. Carrer, M.; Nola, P.; Eduard, J.L.; Motta, R.; Urbinati, C. Regional variability of climate-growth relationships in Pinus cembra high elevation forests in the Alps. J. Ecol. 2007, 95, 1072–1083. [Google Scholar] [CrossRef]
  79. Sevanto, S.; Suni, T.; Pumpanen, J.; Grönholm, T.; Kolari, P.; Nikinmaa, E.; Hari, P.; Vesala, T. Wintertime photosynthesis and water uptake in a boreal forest. Tree Physiol. 2006, 26, 749–757. [Google Scholar] [CrossRef] [Green Version]
  80. Yang, Q.; Blanco, N.E.; Hermida-Carrera, C.; Lehotai, N.; Hurry, V.; Strand, Å. Two dominant boreal conifers use contrasting mechanisms to reactivate photosynthesis in the spring. Nat. Commun. 2020, 11, 128. [Google Scholar] [CrossRef]
  81. Larysch, E.; Stangler, D.F.; Nazari, M.; Seifert, T.; Kahle, H.-P. Xylem Phenology and Growth Response of European Beech, Silver Fir and Scots Pine along an Elevational Gradient during the Extreme Drought Year 2018. Forests 2021, 12, 75. [Google Scholar] [CrossRef]
Figure 1. Geography of the study area. (A) The location of sampling site within the northwestern Yunnan, China region. (B) Climate diagram of the mean values of the meteorological stations in Gongshan, Deqin, and Weixi. P, monthly precipitation; Tmax, monthly mean maximum temperature; Tmin, monthly mean minimum temperature; Tmean, monthly mean temperature. (C) Images of the L. speciosa and A. delavayi mixed forest.
Forests 13 00720 g001
Figure 2. MXD Chronologies of L. speciosa and A. delavayi. (AC) The standard chronologies. (DF) The residual chronologies. (G) The sample depth of chronologies. (HK) The running inter-series correlation (rbar) and the expressed population signal (EPS) were centered on a 50-year window with a 25-year step length. The dashed line is 0.85 cutoff. The gray shaded vertical areas indicated the low-index intervals of 15-year moving average of chronologies.
Forests 13 00720 g002
Figure 3. Moving correlations centered on a 50-year window with a 1-year step length between L. speciosa MXD and A. delavayi MXD during 1701–2019.
Forests 13 00720 g003
Figure 4. Correlation between MXD of different tree species and CRU TS 4.04 climatic variables during different periods (1951–2019). Correlation between (A) Tmax, (D) Tmean, (G) Tmin, (J) P, and RES chronologies of L. speciosa. Correlation between (B) Tmax, (E) Tmean, (H) Tmin, (K) P, and RES chronologies of A. delavayi. Significance of the different correlations with (C) Tmax, (F) Tmean, (I) Tmin, and (L) P between the MXD of the two species. The absolute values of statistic (µ) less than 1.96 (dashed line) indicates the same correlation with climate for MXD of the two species.
Forests 13 00720 g004
Figure 5. Linear regression between RES of MXD and late-summer temperature (CRU, 1951–2019). T8–9: mean temperature of August–September, T9–10: mean temperature of September–October, and T8–10: mean temperature of August–October.
Forests 13 00720 g005
Figure 6. Comparison of MXD chronology of different tree species in this study and P. asperata in Yulong County during 1721–2010 [69]. (A) MXD (RES, black line) of A. delavayi and MXD (RES, gray line) of P. asperata in Yulong County. (B) MXD (RES, black line) of L. speciosa and MXD (RES, gray line) of P. asperata in Yulong County. (C) MXD (RES, black line) of A. delavayi and July–October maximum temperature reconstruction (Tmax7–10, gray line) in Yulong County. (D) MXD (RES, black line) of L. speciosa and July–October maximum temperature reconstruction (Tmax7–10, gray line) in Yulong County. (E) August–September mean temperature (CRU, 1951–2019) and MXD(RES) of L. speciosa. (F) September–October mean temperature (CRU, 1951–2019) and MXD(RES) of A. delavayi. (G) Observed Tmax7–10 (1958–2005) and MXD(RES) of P. asperata in Yulong County.
Forests 13 00720 g006
Figure 7. Spatial correlation of MXD (RES) and CRU TS 4.04 mean temperature of August–October (1951–2019) for (A) L. speciosa, (B) A. delavayi, and (C) composite chronology.
Forests 13 00720 g007
Table 1. Details of sampling site, meteorological stations, and grid points in the northwestern Yunnan Province.
SitesLatitude/LongitudeElevation, m a.s.l.SpeciesTime SpanC/T1C/T2
Sampling site98.477° E/27.786° N3200–3300L. speciosa1422–201996/5051/26
A. delavayi1573–2019108/5551/27
Gongshan98.667° E/27.750° N1583.3 1958–2019
Deqin98.917° E/28.483° N3319.0 1958–2019
Weixi99.283° E/27.167° N2326.1 1958–2019
Grid set198.250° E/27.750° N 1951–2019
Grid set298.750° E/27.750° N 1951–2019
C/T1: cores/trees of sampling, C/T2: cores/trees for densitometric analyses.
Table 2. Statistical parameters of MXD chronologies.
ChronologyLarixSTDAbiesSTDLarixRESAbiesRESCompositeSTDCompositeRES
Time span1501–2019 A.D.1573–2019 A.D.1501–2019 A.D.1573–2019 A.D.1501–2019 A.D.1501–2019 A.D.
Mean length215216215216216216
Trees/Cores26/5127/5126/5127/5153/10253/102
AC10.4590.293−0.095−0.2120.354−0.176
Rbt0.2300.1910.3020.2960.1330.223
Mean EPS0.8530.8880.8920.9330.8770.929
Year/CEPS>0.851638/181732/231580/131678/131669/351637/20
SNR5.8137.9358.22713.9297.14713.061
MS0.0360.0420.0440.0500.0350.042
PC129.3%24.4%35.4%33.1%17.2%25.7%
AC1: first-order autocorrelation, Rbt: correlation between trees, EPS: expressed population signal, Year/CEPS>0.85: year and minimum number of cores when EPS > 0.85, SNR: signal-to-noise ratio, MS: mean sensitivity, PC1: variance explained by the first eigenvector, and common period years of principal components analysis for L. speciosa, A. delavayi and composite chronologies are 1800–2000, 1850–1950, and 1850–1950 when developing chronologies.
Publisher’s Note: MDPI stays neutral with regard to jurisdictional claims in published maps and institutional affiliations.

