
Effects of Different Native Plants on Soil Remediation and Microbial Diversity in Jiulong Iron Tailings Area, Jiangxi
by
 and
and
Qian Wang
1,2, 
Qiwu Sun
1,2,
Wenzheng Wang
1,2,
Xiangrong Liu
1,2,
Liguo Song
1,2 and
Lingyu Hou
1,2,* 1
Research Institute of Forestry, Chinese Academy of Forestry, Beijing 100091, China
2
Key Laboratory of Tree Breeding and Cultivation of State Forestry Administration, Chinese Academy of Forestry, Beijing 100091, China
*
Author to whom correspondence should be addressed.
Forests 2022, 13(7), 1106; https://doi.org/10.3390/f13071106
Submission received: 8 June 2022
/
Revised: 9 July 2022
/
Accepted: 12 July 2022
/
Published: 14 July 2022
(This article belongs to the Special Issue Pollution, Heavy Metal, and Emerging Threats in Forest Soil)
Abstract
:Phytoremediation is an important solution to heavy metal pollution in soil. However, the impact of plants on microbial communities in contaminated soil also requires attention. Community-level physiological profiling (CLPP) based on the Biolog™ EcoPlate and high-throughput sequencing were used to study the soil microbial community in this article. The rhizosphere and bulk soil samples of six native species were collected from the iron mine tailings on Jiulong Mountain, Jiangxi Province. According to the average well color development (AWCD), all plants improved the activity and diversity of the contaminated soil microbial community to varying degrees. Cunninghamia lanceolate is considered to have good effects and led to the appearance of Cunninghamia lanceolata > Zelkova schneideriana > Toona ciliata > Alnus cremastogyne > Cyclobalanopsis myrsinifolia > Pinus elliottii. The Shannon–Wiener diversity index and principal component analysis (PCA) show that the evenness and dominance of soil microbial communities of several plants are structurally similar to those of uncontaminated soil (UNS). The results of high-throughput sequencing indicated that the bacterial community diversity of C. lanceolata, A. cremastogyne, and P. elliottii is similar to UNS, while fungal community diversity is different from UNS. C. lanceolata has a better effect on soil nutrients, C. myrsinifolia and P. elliottii may have a better effect on decreasing the Cu content. The objective of this study was to assess the influence of native plants on microbial communities in soils and the soil remediation capacity. Mortierellomycota was the key species for native plants to regulate Cu and microbial community functions. Native plants have decisive influence on microbial community diversity.
1. Introduction
As a large number of toxic and hazardous substances enter the natural environment, serious environmental pollution is being produced in the process of excavation and mining of metals, which will greatly increase human health and safety risks [1,2]. The method of ecological restoration of contaminated soil by plants is friendly to the environment and has good economic benefits, so it has attracted much attention. Studies have shown that the long-term effects of certain plants can reduce the content of pollutants in water and soil contaminated by metals and metalloids [3,4]. The effect is mainly due to a variety of activities, including the removal, detoxification, and immobilization of various pollutants to reduce toxic levels and toxicity by plants in the process of accumulating biomass, resulting in the diversity and metabolic function of the microbial community in the rhizosphere soil. Some researchers believe that the phytoremediation function is derived from the synthetic protein products controlled by its specific genes, such as metallothionein and phytochelatin. Some also believe that certain bacteria and fungi in the soil microbial community can enhance the phytoremediation function by regulating the detoxification and metabolites of plants [5,6,7,8]. Researchers found that the rhizobacteria of colonizing plants in mine tailing soil was a key point for plant growth and phytoremediation [9].
The significance of soil remediation lies in the return of soil to a condition of ecological stability together with the establishment of plant communities it supports or supported to conditions prior to disturbance. However, most of the plants that originally grew on metal tailings have been removed during the mining process Therefore, this study focused on changes in soil properties and microbial diversity compared with uncontaminated soil, which is necessary to assess the remediation effect of different plants on tailings. The application of soil microorganisms has been widely reported in the phytoremediation process, such as the bacterial genera Acidovorax, Alcaligenes, Bacillus, Mycobacterium, Paenibacillus, Pseudomonas, and Rhodococcus. It has also been found that Bacillus sp. has a biosorption function for toxic metals by PS-6 [10].
It is certain that if there is plant growth on the abandoned metal tailings, it will indeed have an impact on soil nutrient content and microbial community metabolic diversity. Phytoremediation and phytostabilization lead to changes in the microbial composition of contaminated soils, with pH and nutrient status improving to healthy soils [11,12]. At present, more than 45 families are considered to have the potential to absorb heavy metals, mainly herbaceous plants [13]. The bark and trunk parts of arbor species have poor ability to adsorb heavy metals and have received less attention; however, they have great potential for heavy metal phytoremediation due to the large biomass. Although there are plant species such as Acacia saligna that have been shown to have heavy metal tolerance and phytoremediation capabilities [14], alien species have potential risks of biological invasion and should be carefully considered [15]. Regrettably, there is no unified conclusion on whether native arbor plants can perform phytoremediation by driving changes in the metabolic diversity of microbial communities and how to select suitable species to solve the pollution from tailings in Jiangxi. Indigenous plant species that can tolerate the low pH and heavy metal soil conditions of tailings environments should be emphasized to fill gaps in research and application foundations. In this study, the following six native tree species that have certain tolerance and resistance and can grow well in weakly acidic soil conditions were selected as the research objects. Cunninghamia lanceolata and Pinus elliottii are coniferous evergreen species in southern China. Zelkova schneideriana and Cyclobalanopsis myrsinifolia are common broad-leaved trees. Toona ciliate and Alnus cremastogyne are relatively precious plant species of great significance to ecological diversity [16,17,18]. They are widely distributed native tree species that can achieve a fast-growing high yield and have high economic value under artificially cultivated conditions. If these species can play a better role in the remediation of heavy metal-contaminated soil, this can effectively promote research on the increasingly serious issue of soil pollution.
Biolog™ EcoPlate is a convenient and efficient microbial community research method that can obtain a large amount of data for analysis. It can effectively reflect the utilization intensity of different carbon source substrates by the microbial community and reflect the diversity of the metabolic function to a certain extent [19,20,21]. The community-level physiological profiling (CLPP) method is based on the single carbon source utilization mode of Biolog™ EcoPlate [22], which can compare different microbial communities and is suitable for comparison between contaminated and uncontaminated soil microbial communities [23,24]. With the development of molecular biology, high-throughput sequencing technology is widely regarded as an important means to evaluate the diversity and dynamics of soil microbial communities, and it has outstanding advantages over traditional culture-based methods [25]. Considering that the high-throughput method still requires a relatively high cost, its convenience and practicability in the possible large-scale tailings soil survey in the future were lower than that of using Biolog™ EcoPlate. Our research hopes to verify the applicability of the Biolog™ EcoPlate to the study of soil microbial communities under the conditions of heavy metal pollution by metal tailings, explore the remediation effects of six native plants on contaminated soil and on microbial communities, and further discuss the impact of phytoremediation capabilities and effects possible reasons for differences.
2. Materials and Methods
2.1. Site Description
The experimental area is located on the Jiulong Forestry Farm, Jiulong Mountain, Jiangxi Province, China, at 27°36′31.71″ N, 114°52′53.67″ E, and the altitude is 431 m. It belongs to a humid mid-subtropical monsoon climate, with an average annual temperature of 17.5 °C and precipitation of 1590.9 mm. The parent rock is mainly shale, and the soil is a Jiangxi red loam. C. lanceolata, P. elliottii, Z. schneideriana, C. myrsinifolia, T. ciliate, and A. cremastogyne were planted in adjacent areas at a density of 2 m × 2 m. Each stand containing plants of a particular species was divided into three repetition blocks of 20 m × 20 m.
2.2. Soil Sampling
All soil samples were collected at a depth of 0–20 cm in April 2019. Each bulk soil sample was a mixture of 5 soil cores (1 from each corner and 1 from the center of the block) sampled from each block; similarly, each rhizosphere soil sample was the rhizosphere soil of 5 plants randomly selected in the block—shake off the loose soil around the roots, and then collect the remaining soil attached to the roots. Uncontaminated soil was sampled at a distance of 2.5 km from iron tailings. There were a total of 39 soil samples in 3 replicates of the rhizosphere soil, bulk soil, and uncontaminated soil. All samples were immediately sieved (2 mm), stored at 4 °C, and transported to the laboratory. They were either stored at −80 °C before microbial community analysis or air-dried and ground before chemical property analyses.
2.3. Analyses of Soil Properties
Using soil water suspension with a ratio of 1:2.5 w/v to measure soil pH and electric conductivity (Ec), soil organic carbon (SOC) was determined by the K2Cr2O7-H2SO4 oxidation method. Total nitrogen (TN) was measured using a 2300 Kjeltec Analyzer Unit (FOSS, Höganäs, Sweden). The contents of total phosphorus (TP), total potassium (TK), available nitrogen (AP), available potassium (AK), as well as heavy metal elements were measured by inductively coupled plasma emission spectrometry (Spectro Analytical Instruments, Spectro Arcos ICP, Kleve, Germany).
2.4. Experiments with Biolog™ EcoPlate and High-Throughput Sequencing
A Biolog™ EcoPlate (Biolog Inc, Hayward, CA, USA) containing 31 carbon source substrates were used to analyze the metabolic characteristics of soil microbial communities. The Eco plate inoculum was prepared according to the method described by Classen et al. [26]. We added fresh soil (equivalent to 30 g dry soil) into a sterilized 270 mL Erlenmeyer flask containing 0.85% NaCl solution, shook at 180 rpm for 30 min, took 3 mL supernatant and added to 27 mL concentration of 0.85% NaCl solution. After mixing, we took 3 mL of supernatant and added it to 27 mL of 0.85% NaCl solution. We added 150 μL of the diluted solution with a concentration of 10.3 g·mL−1 to each well of the ecological plate, and then placed it in a constant temperature incubator at 28 °C. The above operations were all carried out in a sterile environment. On the MicroLogTM microplate reader (version 4.20.05; Biolog Inc, Hayward, CA, USA), read the 590 nm and the wavelength value of 750 nm (turbidity).
Average well color development (AWCD) was used to characterize the metabolic activity of soil microbial communities [27]:
C represents the value at 590 nm minus the value at 750 nm of each carbon source hole; R represents the optical density value of the control hole; n is 31 in this study.
The following indexes were always used to assess the level of functional diversity of microbial communities:
McIntosh evenness index (E):
where Pi represents the ratio of the (C–R) value in the i-th non-control well to the sum of all non-control wells (C–R) values, S represents the number of types of carbon source substrates used by the microbial community, and ni represents the i-th value of the carbon source hole (C–R). N represents the sum of the (C–R) values of 31 carbon sources
We used high-throughput sequencing technology (Illumina HiSeq 2500, BioMarker Technologies Corporation, Beijing, China) [32] to compare the microbial communities of soil samples of C. lanceolata, T. ciliata, A. cremastogyne and uncontaminated. Soil DNA was extracted from the frozen soil samples by using the Power Soil DNA Isolation Kit (MoBio Laboratories, Carlsbad, CA, USA), following the manufacturer’s instructions. The ITS1 forward primer (5′-CTTGGTCATTTAGAGGAAGTAA-3′) and the ITS2 reverse primer (5′-GCTGCGTTCTTCATCGATGC-3′) were used for amplifying the fungal ITS1 barcode region, while the 338 forward primer (5′-ACTCCTACGGGAGGCAGCA-3′) and the 806 reverse primer (5′-GGACTACHVGGGTWTCTAAT-3′) were used for amplifying the bacterial V3–V4 barcode region. The polymerase chain reaction (PCR) parameters were as follows: denaturation at 95 °C for 5 min; 25 cycles of 95 °C for 30 s, 50 °C for 30 s, and 72 °C for 40 s; and final extension at 72 °C for 7 min. Amplicons were purified using a GeneJET Gel Extraction Kit (Thermo Scientific, Waltham, MA, USA) and quantified using a Qubit dsDNA HS Assay Kit (Life Technologies, Carlsbad, CA, USA). The raw paired-end reads were joined with FLASH (v.1.2.11) (CCB, Auf, Trabizon, Turkey) [33] and analyzed using QIIME (v.1.8.0) (Knight Lab, Boulder, CO, USA) [34]. To study the microbial diversity information of the samples, clean tags were clustered at a 97% sequence similarity level using USEARCH in QIIME [35]. Different operational taxonomic units (OTUs) were obtained [36]; then, based on SILVA (bacteria) and UNITE (fungal) taxonomy databases, the OTUs were classified and annotated and used to compute and plot rarefaction curves with the help of R (R v.4.1.2) (Ihaka, R., etc., Auckland, New Zealand)
2.5. Statistical Analyses
An analysis of variance (ANOVA) was conducted using SPSS 26.0 (IBM Co., New York, NY, USA) and was used to evaluate the differences in the soil properties and heavy metal content between different samples. Once a significant effect was indicated (p < 0.05), a pairwise comparison between all samples was performed using Tukey’s HSD test (α = 0.05). Data from Biolog™ EcoPlate after 72 h incubation was used to calculate the diversity index, perform the principal component analysis (PCA), and produce the figures by SPSS 26.0 (Nie, N. H., etc., Palo Alto, CA, USA) and Origin 2018 (OriginLab, Northampton, MA, USA). The cluster analysis of the microbial genus level was obtained by R (R v.4.1.3) using the unweighted pair–group method with arithmetic means (UPGMA). Redundancy analysis (RDA) or canonical correlation analysis (CCA) was performed while taking into account the relationships of the microbial community, treatments, and environmental factors. The RDA/CCA analysis mentioned above was performed using the “vegan” package in R (R v.4.1.3). A Spearman correlation analysis was performed using the “corrplot” package in R (R v.4.1.3).
3. Results
3.1. Chemical Characteristics of the Study Soils
The main sources of heavy metal pollution are exchangeable metal ions and some metal complexes in soil. Soil with heavy metal content exceeding the risk screening value may pose risks to vegetation growth and the soil ecological environment (GB 15618-2018). According to related research, the soils of mine tailing were polluted with different loads of Cu, Zn, and Pb. High heavy metal loads may lead to soil acidification [37,38]. The highest values of these metals can exceed 1000 mg·kg−1, which is more than five times higher than the national safety standard. In this study, soil pH ranged from 4.6 to 6.3. The pH of the rhizosphere and bulk soil were significantly higher than those of the uncontaminated area (Table 1). The values of Cu were below 2 times risk screening values, and the values of Zn and Pb were below 1.5 times risk screening values.
The values of SOC and TN in rhizosphere and bulk soils were relatively low and ranged from 2.41 g·kg−1 to 7.88 g·kg−1 and from 0.41 g·kg−1 to 0.83 g·kg−1, and were lower than one-third and one-half of those of UNS. At this point, C. lanceolata had the relatively best soil nutrient status, while P. elliottii was relatively poor. The values of TK, AK, TP, and AN in rhizosphere and bulk soils were ranged from 18.46 g·kg−1 to 24.87 g·kg−1, 10.01 mg·kg−1 to 25.86 mg·kg−1, 0.31 g·kg−1 to 0.69 g·kg−1, and 56.00 mg·kg−1 to 383.25 mg·kg−1.
3.2. Average Well Color Development
With the increase of incubation time in 0–168 h, the slope of the rhizosphere soil curve reached its maximum value at 72 h (Figure 1), when the rhizosphere soil microbial community had the highest utilization rate of carbon source substrates. The AWCD values of the rhizosphere soils were higher than those of the bulk soils. The values of amino acids in CRS and ZRS were slightly higher than those in CBS and ZBS. It meant that native plants have a certain positive effect on the metabolism of the microbial communities. P. elliottii have a weak influence on the functional structure of microbial communities.
Soil microbial communities have differences in carbon source usage, which make differences in the metabolic functions of the microbial communities (Figure 2). CRS, CMRS, PRS, and ARS had significantly higher usage efficiency of carboxylic acids than those of phenolic acids and amines. ZRS had a significantly higher usage of carboxylic acids and amines than those of phenolic acids and polymers. The usage of amino acids and carboxylic acids by ZBS, TRS and CMRS were significantly higher than that of carbohydrates, phenolic acids, and amines. CBS had no significant differences in the usage of carbon sources. The differences in the rhizosphere soils were more significant than those in the bulk soil. The native plants improved metabolic diversity of microbial communities of tailing soils.
3.3. Soil Microbial Functional Diversity
The diversity index is used to reflect the richness and uniformity of a soil microbial community (Table 2). The Simpson dominance index had no significant difference between soil samples. The Pielou evenness index and the McIntosh evenness index of C. lanceolata soil were significantly higher than those of UNS, and the diversity indexes between the other samples and UNS had no significant difference. The overall trend was C. lanceolata > Z. schneideriana > T. ciliata > A. cremastogyne > C. myrsinifolia > P. elliottii. In all samples, the Pielou evenness index was between 0.85 and 0.95, the Simpson dominance index was between 0.89 and 0.95, and the McIntosh evenness index was between 0.88 and 0.96, which indicated the scope of changes was small in the uniformity and dominance of the microbial community among different soil samples, and the differences were mainly derived from the diversity of microbial communities.
PCA is a technique for analyzing and simplifying data sets. By decomposing the variance, the differences of multiple data sets are reflected in the two-dimensional coordinate graph, which can reflect the difference and distance of the samples; the coordinate axis can reflect the maximum variance eigenvalues (Figure 3). The closer the distance between the two samples is, the more similar the composition of the two samples will be [39]. The main difference is between different samples and the UNS. The closest to the UNS were A. cremastogyne and C. myrsinifolia, and the farthest was C. lanceolata. This indicates that the metabolic function structure of the rhizosphere soil and bulk soil of the same plant has a high similarity, and the most different from the UNS microbial metabolic diversity was C. lanceolata, followed by P. elliottii. A. cremastogyne and C. myrsinifolia had a high similarity with the functional structure of microbial metabolism in uncontaminated soil. Generally, the differences in the metabolic function diversity of different soil microbial communities are similar to the six types of carbon sources.
3.4. High-Throughput Sequencing Analysis
The high-throughput sequencing results indicated that the microbial communities of soil samples have high similarity in bacteria and obvious differences in fungi (Figure 4). It suggested that native plants affect the bacterial composition of soils, which is an important driver of the improvement of soil nutrients and microbial community metabolic diversity. The relative abundance of Ascomycota in the soil samples of C. lanceolata and A. cremastogyne was significantly lower than that of the UNS, and Basidiomycota was significantly higher than that of the UNS. Ascomycota and Basidiomycota in the rhizosphere soil was significantly higher than that of bulk soil for C. lanceolata and A. cremastogyne (ARS > ABS, CRS > CBS), while P. elliottii had the opposite trend (PBS > PRS). The similarity of the microbial community diversity structure of CRS, ARS, PRS, and UNS decreased in turn. In the structural composition of fungi, CRS and UNS have smaller differences, which may also explain that C. lanceolata has higher carbon source usage and functional diversity in soil microbial communities than other plants.
Redundancy analysis (RDA) and canonical correspondence analysis (CCA) [40] is the sorting method based on the development of correspondence analysis. The most influential environmental factors in RDA are AK, TN, and Ec (Figure 5). Ec has a strong influence on the changes in UNS, PBS, and CRS bacterial communities. AK, TN, AN, and SOC have a negative correlation with the changes of ABS and ARS bacterial communities. Similarly, the most influential environmental factor in CCA is pH. Ec has a strong influence on the diversity of the ABS and ARS fungal communities. Ec, TN, and SOC have a strong influence on the PRS and CBS fungal communities.
3.5. Correlation Analysis
The life activities of soil microorganisms are inseparable from the soil environment, and environmental factors have an important impact on the metabolism and community composition of soil microorganisms. Spearman correlation analysis was used to determine key factors, carbon sources, and microbial populations that play an important role in phytoremediation and soil stabilization. It is worth noting that most microorganisms showed no significant weak or no correlation with the six types of carbon sources available (Figure 6), and there was no significant correlation between carbon sources and pH, SOC, TN, etc. Similarly, Pb was significantly positively correlated with Chloroflexi, GAL15. We noted a very significant positive correlation between Chloroflexi and GAL15 and a strong correlation with carboxylic acid, phenolic acid, and amines. Moreover, pH was significantly positively correlated with Basidiomycota and Olpidiomycota; Mucoromycota, Chytridiomycota, and Ascomycota were extremely significantly positively correlated with SOC, TN, and AK, and significantly negatively correlated with TK. This indicates that the utilization of carbon sources by soil microorganisms is mainly affected by specific microbial populations, rather than directly controlled by environmental factors such as pH, and these specific microbial populations may also be the key populations affecting soil heavy metals.
4. Discussion
4.1. Effects of Native Plants on Soil Chemical Characteristics
The most important point of soil remediation was the soil toxicity of heavy metals, which depends largely on the concentration of heavy metals. In this study, the values of Cu, Pb, and Zn in the rhizosphere soils and bulk soils were low. It suggested that native plants have soil remediation potential [41,42,43,44]. Moreover, pH and SOC are highly correlated with soil heavy metals and related microorganisms in the community. They may change the concentration of heavy metals and the structure of the microbial community in the soil [45,46,47,48]. Our results indicated that pH and SOC were highly correlated with fungi and not correlated with heavy metal content. Low SOC in the rhizosphere soil led to its limited effect on heavy metals. Improvements in soil nutrients and microbial diversity caused by native plants were considered as part of phytoremediation, and from this point of view, C. lanceolata was the more valuable native species. SOC, TP, and TN were affected by both heavy metal metals and plants. While plants improved soil nutrients, they were hindered by heavy metals and the consumption of organic matter and nitrogen [49]. Nevertheless, soil properties are indicators of the soil remediation capabilities of these plants, and the effect of plants on soil properties cannot be ignored [50,51].
Regarding changes in the content of heavy metals, it was highly accepted that plants, the environment, microbial communities, and so on may affect the ability of phytoremediation of soil heavy metal pollution [52,53,54]. For polluted soil, the change of pollutant content is the most intuitive indicator to measure the remediation effect. From this point of view, C. myrsinifolia and P. elliottii may have a better effect on decreasing the Cu content, but, it may be hard to solve the serious nutrient deficiencies faced by soil in tailing. Generally, our results confirm phytoremediation of native plants to heavy metal pollution but also indicate that native plants may affect soil microorganisms and soil nutrients. It is necessary to select the appropriate species according to the focus of soil remediation.
4.2. The Relationship between Microbial Metabolic Diversity and Soil Remediation
The impact of plants on soil is inseparable from the role of microorganisms. Understanding the metabolic changes of microorganisms is necessary for understanding phytoremediation. In this study, plants with high AWCD values in rhizosphere soil also have high AWCD values in bulk soil (Figure 1), which is clearly different from the performance in chemical properties (Table 1). This was also supported by the utilization of six basic carbon sources and the results of correlation analysis. It can be seen that the improvement of microbial metabolic diversity cannot be simply explained by the effects of environmental factors. It may be due to the influence of native plants.
The presence of plants can enhance the stability of the soil structure, accumulate and absorb heavy metal ions in soil, and synthesize phytochelatins [55,56]. These may alleviate the toxicity or reduce the pollution of heavy metals [57,58]. The reduction of Cu, Pb, and Zn can be used to explain the changes in the diversity of microbial communities, but the function of soil remediation does not depend on the role of the plant itself. Soil microorganisms directly or indirectly participate in this process, strengthening the plant’s tolerance to heavy metal toxicity [59] and making it easier for plants to adapt to the contaminated soil and reduce heavy metal content more efficiently, which has an important assisting role in phytoremediation [60,61]. As our results show, the rhizosphere soil microbes of different plants have significant differences in their ability to metabolize carbon sources, mainly due to changes in microbial diversity. There was little difference in the preference for the certain type of carbon source metabolism. With the assistance of soil microorganisms, plants play a remediation function on heavy metal-contaminated soil. The functional diversity of soil microbial communities is an important reason for the differences in phytoremediation functions. The strength of soil microorganisms’ assisting function in phytoremediation is related to certain specific microbial populations in the community [62,63], and related populations in these microbial communities are sensitive to plants [64]. Studies employed Biolog™ EcoPlate were not enough to detect small changes in the functional structure of soil microbial communities [65,66]. In contrast, our results showed that the functional diversity of soil microbial communities and Mortierellomycota was positively correlated with the values of Cu, which indicated that Mortierellomycota was the key phylum for plants to regulate Cu and microbial community functions. There was not any correlation between Zn and impact factors. It suggested that differences in Zn content were more caused by the different absorption capacity of native plants. As the SOC and TN are important factors of microbial communities, they have no correlation with microbial populations. The rate of organic carbon accumulation in the rhizosphere varied due to differences in species and microbial community composition. It was indicated that the influence of native plants on the microbial community was the more decisive factor.
4.3. The Relationship between Microbial Diversity and Soil Remediation
Studies have shown that the proportion of certain bacteria and fungi is significantly different between contaminated soil and healthy soil [67,68], and changes in their relative abundance can be used as a reference to measure soil restoration. Proteobacteria often dominate in soil microbial communities that have been contaminated with heavy metals for a long time, the Ascomycota:Basidiomycota and Saprotrophic:Ectomycorrhizal ratios for fungi, Cyanobacteria:Chloroflexi ratios for bacteria also largely reflect the differences between contaminated and healthy soils [69,70]. In this study, similar changes can be observed. In addition, Ascomycota has the most obvious change among different soil samples and was highly correlated with TN, TK, SOC, and AK. This was related to its dominant position in the microbial community and partly explains the improvement effect of C. lanceolata on soil nutrients. Chloroflexi and GAL15 also play important roles in phytoremediation due to their association with Pb and Cr. It means that the results obtained by high-throughput sequencing and CLPP in the analysis of microbial community diversity are consistent to some extent. The positive correlation between pH and the microbial population suggested that native plants may have improved microbial community diversity and community structure by reducing soil acidity.
5. Conclusions
Selected native plants play a role in the mitigation of heavy metal and the improvement of soil nutrients and microbial diversity, and it is reasonable to be considered as a solution to the heavy metal problem in tailings soil in Jiangxi. C. lanceolata is a good choice for phytoremediation. The disadvantage of native plants was that the improvement of SOC would take longer.
Native plants have differences in improving soil nutrient status, affecting the rhizosphere microbial community, and reducing heavy metal content. The differences in the effect of native plants on Cu were mainly related to rhizosphere microorganisms, especially Mortierellomycota. The differences in the effect of native plants on Pb were mainly related to the difference in the effect of microorganisms and phosphorus. The differences in the effect of native plants on Zn, may be related to the uptake capacity of plant roots. They may achieve better results in the soil remediation of tailings under the action of a longer period of time. High-throughput sequencing and CLPP have good consistency in the analysis results of the microbial community diversity. The former is superior to the latter in studying subtle differences in soil microbial populations.
Author Contributions
Conceptualization, Q.W., Q.S., L.S. and L.H.; methodology, Q.W. and L.S.; software, L.S. and W.W.; validation, W.W. and X.L.; formal analysis, L.S. and W.W.; investigation, Q.S.; resources, Q.S.; data curation, X.L.; writing—original draft preparation, Q.W. and L.H.; writing—review and editing, L.H.; visualization, Q.W. and L.S.; supervision, Q.S. and L.H.; project administration, Q.S. and L.H.; funding acquisition, Q.S. All authors have read and agreed to the published version of the manuscript.
Funding
Basic research funding was provided by the Central Public-interest Scientific Institution Basal Research Fund (CAFYBB2019SY003).
Institutional Review Board Statement
Not applicable.
Informed Consent Statement
Not applicable.
Data Availability Statement
Not applicable.
Conflicts of Interest
The authors declare no conflict of interest.
References
- Jiang, L.; Sun, H.; Peng, T.; Ding, W.; Liu, B.; Liu, Q. Comprehensive evaluation of environmental availability, pollution level and leaching heavy metals behavior in non-ferrous metal tailings. J. Environ. Manag. 2021, 290, 112639. [Google Scholar] [CrossRef] [PubMed]
- Sui, C.; Fatichi, S.; Burlando, P.; Weber, E.; Battista, G. Modeling distributed heavy metal pollution transport in a mine impacted catchment: Short and long-term effects. Sci. Total Environ. 2021, 812, 151473. [Google Scholar] [CrossRef] [PubMed]
- Jin, Z.; Deng, S.; Wen, Y.; Jin, Y.; Pan, L.; Zhang, Y.; Zhang, D. Application of Simplicillium chinense for Cd and Pb biosorption and enhancing heavy metal phytoremediation of soils. Sci. Total Environ. 2019, 697, 134148. [Google Scholar] [CrossRef] [PubMed]
- Li, X.; Wang, X.; Chen, Y.; Yang, X.; Cui, Z. Optimization of combined phytoremediation for heavy metal contaminated mine tailings by a field-scale orthogonal experiment. Ecotoxicol. Environ. Saf. 2019, 168, 1–8. [Google Scholar] [CrossRef] [PubMed]
- Khalid, M.; Ur-Rahman, S.; Hassani, D.; Hayat, K.; Zhou, P.; Hui, N. Advances in fungal-assisted phytoremediation of heavy metals: A review. Pedosphere 2021, 31, 475–495. [Google Scholar] [CrossRef]
- Kotrba, P.; Najmanova, J.; Macek, T.; Ruml, T.; Mackova, M. Genetically modified plants in phytoremediation of heavy metal and metalloid soil and sediment pollution. Biotechnol. Adv. 2009, 27, 799–810. [Google Scholar] [CrossRef]
- Oladoye, P.O.; Olowe, O.M.; Asemoloye, M.D. Phytoremediation technology and food security impacts of heavy metal contaminated soils: A review of literature. Chemosphere 2021, 288, 132555. [Google Scholar] [CrossRef]
- Sharma, P. Efficiency of bacteria and bacterial assisted phytoremediation of heavy metals: An update. Bioresour. Technol. 2021, 328, 124835. [Google Scholar] [CrossRef]
- Romero, M.F.; Gallego, D.; Lechuga-Jiménez, A.; Martínez, J.F.; Barajas, H.R.; Hayano-Kanashiro, C.; Alcaraz, L.D. Metagenomics of mine tailing rhizospheric communities and its selection for plant establishment towards bioremediation. Microbiol. Res. 2021, 247, 126732. [Google Scholar] [CrossRef]
- Sharma, P.; Tripathi, S.; Chaturvedi, P.; Chaurasia, D.; Chandra, R. Newly isolated Bacillus sp. PS-6 assisted phytoremediation of heavy metals using Phragmites communis: Potential application in wastewater treatment. Bioresour. Technol. 2021, 320, 124353. [Google Scholar] [CrossRef]
- Mensah, A.K.; Marschner, B.; Antoniadis, V.; Stemn, E.; Shaheen, S.M.; Rinklebe, J. Human health risk via soil ingestion of potentially toxic elements and remediation potential of native plants near an abandoned mine spoil in Ghana. Sci. Total Environ. 2021, 798, 149272. [Google Scholar] [CrossRef] [PubMed]
- Stylianou, M.; Gavriel, I.; Vogiatzakis, I.N.; Zorpas, A.; Agapiou, A. Native plants for the remediation of abandoned sulphide mines in Cyprus: A preliminary assessment. J. Environ. Manag. 2020, 274, 110531. [Google Scholar] [CrossRef]
- Jadia, C.; Fulekar, M. Phytoremediation of Heavy Metals: Recent Techniques. Afr. J. Biotechnol. 2009, 8, 921–928. [Google Scholar] [CrossRef]
- Dzomba, P. Heavy Metal Content in Acacia saligna and Acacia polyacantha on Slime Dams: Implications for Phytoremediation. Am. J. Exp. Agric. 2013, 3, 871–883. [Google Scholar] [CrossRef] [Green Version]
- Wang, X.; Wang, Y.; Wang, Y. Use of exotic species during ecological restoration can produce effects that resemble vegetation invasions and other unintended consequences. Ecol. Eng. 2013, 52, 247–251. [Google Scholar] [CrossRef]
- Zhong, A.-L.; Hsiung, W.-Y. Evaluation and diagnosis of tree nutritional status in Chinese-fir (Cunninghamia lanceolata (Lamb) Hook) plantations, Jiangxi, China. For. Ecol. Manag. 1993, 62, 245–270. [Google Scholar] [CrossRef]
- Wei, X.; Li, Q.; Liu, Y.; Liu, S.; Guo, X.; Zhang, L.; Zhang, W. Restoring ecosystem carbon sequestration through afforestation: A sub-tropic restoration case study. For. Ecol. Manag. 2013, 300, 60–67. [Google Scholar] [CrossRef]
- Yang, J.; Dai, G.; Ma, L.; Jia, L.; Wu, J.; Wang, X. Forest-based bioenergy in China: Status, opportunities, and challenges. Renew. Sustain. Energy Rev. 2013, 18, 478–485. [Google Scholar] [CrossRef]
- Kong, X.; Wang, C.; Ji, M. Analysis of microbial metabolic characteristics in mesophilic and thermophilic biofilters using Biolog plate technique. Chem. Eng. J. 2013, 230, 415–421. [Google Scholar] [CrossRef]
- Liu, B.; Li, Y.; Zhang, X.; Wang, J.; Gao, M. Effects of chlortetracycline on soil microbial communities: Comparisons of enzyme activities to the functional diversity via Biolog EcoPlates™. Eur. J. Soil Biol. 2015, 68, 69–76. [Google Scholar] [CrossRef]
- Rutgers, M.; Wouterse, M.; Drost, S.M.; Breure, A.M.; Mulder, C.; Stone, D.; Bloem, J. Monitoring soil bacteria with community-level physiological profiles using Biolog™ ECO-plates in the Netherlands and Europe. Appl. Soil Ecol. 2016, 97, 23–35. [Google Scholar] [CrossRef]
- Weber, K.P.; Legge, R.L. Community-level physiological profiling. Methods Mol. Biol. 2010, 599, 263. [Google Scholar] [CrossRef] [PubMed]
- Garland, J.L.; Mills, A.L.; Young, J.S. Relative effectiveness of kinetic analysis vs single point readings for classifying environmental samples based on community-level physiological profiles (CLPP). Soil Biol. Biochem. 2001, 33, 1059–1066. [Google Scholar] [CrossRef]
- Preston-Mafham, J.; Boddy, L.; Randerson, P.F. Analysis of microbial community functional diversity using sole-carbon-source utilisation profiles–A critique. FEMS Microbiol. Ecol. 2002, 42, 1–14. [Google Scholar] [CrossRef]
- Lahlali, R.; Ibrahim, D.S.S.; Belabess, Z.; Kadir Roni, M.Z.; Radouane, N.; Vicente, C.S.L.; Peng, G. High-throughput molecular technologies for unraveling the mystery of soil microbial community: Challenges and future prospects. Heliyon 2021, 7, e08142. [Google Scholar] [CrossRef]
- Classen, A.T.; Boyle, S.I.; Haskins, K.E.; Overby, S.T.; Hart, S.C. Community-level physiological profiles of bacteria and fungi: Plate type and incubation temperature influences on contrasting soils. FEMS Microbiol. Ecol. 2003, 44, 319–328. [Google Scholar] [CrossRef] [Green Version]
- De Gens, B.P.; Schipper, L.A.; Sparling, G.P.; Vojvodic-Vukovic, M. Decreases in organic C reserves in soils can reduce the catabolic diversity of soil microbial communities. Soil Biol. Biochem. 2000, 32, 189–196. [Google Scholar] [CrossRef]
- Shannon, C.E. A mathematical theory of communication, 1948. Bell Syst. Tech. J. 1948, 27, 3–55. [Google Scholar] [CrossRef] [Green Version]
- Pielou, E.C. Mathematical Ecology. J. Anim. Ecol. 1977, 47, 1024. [Google Scholar] [CrossRef]
- Simpson, E.H. Measurement of Diversity. Nature 1949, 163, 688. [Google Scholar] [CrossRef]
- Yang, Y.; Yao, J.; Hua, X. Effect of pesticide pollution against functional microbial diversity in soil. Wei Sheng Wu Xue Za Zhi 2000, 20, 23–25. [Google Scholar]
- High-Throughput Gene Sequencing. Available online: http://www.biomarker.com.cn (accessed on 7 June 2021).
- Magoč, T.; Salzberg, S.L. FLASH: Fast length adjustment of short reads to improve genome assemblies. Bioinformatics 2011, 27, 2957–2963. [Google Scholar] [CrossRef] [PubMed]
- Caporaso, J.G.; Bittinger, K.; Bushman, F.D.; DeSantis, T.Z.; Andersen, G.L.; Knight, R. PyNAST: A flexible tool for aligning sequences to a template alignment. Bioinformatics 2010, 26, 266–267. [Google Scholar] [CrossRef] [PubMed] [Green Version]
- Bokulich, N.A.; Subramanian, S.; Faith, J.J.; Gevers, D.; Gordon, J.I.; Knight, R.; Mills, D.A.; Caporaso, J.G. Quality-filtering vastly improves diversity estimates from Illumina amplicon sequencing. (1548-7105 (Electronic)). Nat. Methods 2013, 10, 57–59. [Google Scholar] [CrossRef]
- Edgar, R.C. UPARSE: Highly accurate OTU sequences from microbial amplicon reads. (1548-7105 (Electronic)). Nat. Methods 2013, 10, 996–998. [Google Scholar] [CrossRef]
- Qin, F.; Ji, H.; Li, Q.; Guo, X.; Tang, L.; Feng, J. Evaluation of trace elements and identification of pollution sources in particle size fractions of soil from iron ore areas along the Chao River. J. Geochem. Explor. 2014, 138, 33–49. [Google Scholar] [CrossRef]
- Sarathchandra, S.S.; Rengel, Z.; Solaiman, Z.M. Remediation of heavy metal-contaminated iron ore tailings by applying compost and growing perennial ryegrass (Lolium perenne L.). Chemosphere 2022, 288, 132573. [Google Scholar] [CrossRef]
- Illian, J.B.; Prosser, J.I.; Baker, K.L.; Rangel-Castro, J.I. Functional principal component data analysis: A new method for analysing microbial community fingerprints. J. Microbiol. Methods 2009, 79, 89–95. [Google Scholar] [CrossRef]
- Lindström, E.S.; Kamst-van Agterveld, M.P.; Zwart, G.D. Distribution of Typical Freshwater Bacterial Groups Is Associated with pH, Temperature, and Lake Water Retention Time. Appl. Environ. Microbiol. 2005, 71, 8201–8206. [Google Scholar] [CrossRef] [Green Version]
- Kodešová, R.; Chroňáková, A.; Grabicová, K.; Kočárek, M.; Schmidtová, Z.; Frková, Z.; Grabic, R. How microbial community composition, sorption and simultaneous application of six pharmaceuticals affect their dissipation in soils. Sci. Total Environ. 2020, 746, 141134. [Google Scholar] [CrossRef]
- Singhal, A.; Goel, S.; Sengupta, D. Physicochemical and elemental analyses of sandstone quarrying wastes to assess their impact on soil properties. J. Environ. Manag. 2020, 271, 111011. [Google Scholar] [CrossRef] [PubMed]
- Zhang, Y.; Wang, J.; Feng, Y. The effects of biochar addition on soil physicochemical properties: A review. CATENA 2021, 202, 105284. [Google Scholar] [CrossRef]
- Zhang, Z.; Wu, X.; Tu, C.; Huang, X.; Zhang, J.; Fang, H.; Lin, C. Relationships between soil properties and the accumulation of heavy metals in different Brassica campestris L. growth stages in a Karst mountainous area. Ecotoxicol. Environ. Saf. 2020, 206, 111150. [Google Scholar] [CrossRef]
- Kirkham, M.B. Cadmium in plants on polluted soils: Effects of soil factors, hyperaccumulation, and amendments. Geoderma 2006, 137, 19–32. [Google Scholar] [CrossRef]
- Lynch, D.; Voroney, P.; Warman, P. Soil Physical Properties and Organic Matter Fractions Under Forages Receiving Composts, Manure or Fertilizer. Compost. Sci. Util. 2013, 13, 252–261. [Google Scholar] [CrossRef] [Green Version]
- Qin, L.; Wang, M.; Zhao, S.; Li, S.; Lei, X.; Wang, L.; Chen, S. Effect of soil leaching on the toxicity thresholds (ECx) of Zn in soils with different properties. Ecotoxicol. Environ. Saf. 2021, 228, 112999. [Google Scholar] [CrossRef] [PubMed]
- Santos-Francés, F.; Martínez-Graña, A.; Ávila-Zarza, C.; Criado, M.; Sánchez, Y. Comparison of methods for evaluating soil quality of semiarid ecosystem and evaluation of the effects of physico-chemical properties and factor soil erodibility (Northern Plateau, Spain). Geoderma 2019, 354, 113872. [Google Scholar] [CrossRef]
- Wu, H.; Xiang, W.; Ouyang, S.; Xiao, W.; Li, S.; Chen, L.; Peng, C. Tree growth rate and soil nutrient status determine the shift in nutrient-use strategy of Chinese fir plantations along a chronosequence. For. Ecol. Manag. 2020, 460, 117896. [Google Scholar] [CrossRef]
- Li, J.; Zhou, L.; Lin, W. Calla lily intercropping in rubber tree plantations changes the nutrient content, microbial abundance, and enzyme activity of both rhizosphere and non-rhizosphere soil and calla lily growth. Ind. Crops Prod. 2019, 132, 344–351. [Google Scholar] [CrossRef]
- Zhang, X.; Zhu, B.; Yu, F.; Cheng, W. Plant inputs mediate the linkage between soil carbon and net nitrogen mineralization. Sci. Total Environ. 2021, 790, 148208. [Google Scholar] [CrossRef]
- Ashraf, S.; Ali, Q.; Zahir, Z.A.; Ashraf, S.; Asghar, H.N. Phytoremediation: Environmentally sustainable way for reclamation of heavy metal polluted soils. Ecotoxicol. Environ. Saf. 2019, 174, 714–727. [Google Scholar] [CrossRef] [PubMed]
- Gong, X.; Huang, D.; Liu, Y.; Zeng, G.; Chen, S.; Wang, R.; Xue, W. Biochar facilitated the phytoremediation of cadmium contaminated sediments: Metal behavior, plant toxicity, and microbial activity. Sci. Total Environ. 2019, 666, 1126–1133. [Google Scholar] [CrossRef] [PubMed]
- Shen, X.; Dai, M.; Yang, J.; Sun, L.; Tan, X.; Peng, C.; Naz, I. A critical review on the phytoremediation of heavy metals from environment: Performance and challenges. Chemosphere 2021, 291, 132979. [Google Scholar] [CrossRef] [PubMed]
- Manoj, S.R.; Karthik, C.; Kadirvelu, K.; Arulselvi, P.I.; Shanmugasundaram, T.; Bruno, B.; Rajkumar, M. Understanding the molecular mechanisms for the enhanced phytoremediation of heavy metals through plant growth promoting rhizobacteria: A review. J. Environ. Manag. 2020, 254, 109779. [Google Scholar] [CrossRef]
- Sharma, P.; Pandey, A.K.; Udayan, A.; Kumar, S. Role of microbial community and metal-binding proteins in phytoremediation of heavy metals from industrial wastewater. Bioresour. Technol. 2021, 326, 124750. [Google Scholar] [CrossRef]
- Huang, R.; Cui, X.; Luo, X.; Mao, P.; Zhuang, P.; Li, Y.; Li, Y.; Li, Z. Effects of plant growth regulator and chelating agent on the phytoextraction of heavy metals by Pfaffia glomerata and on the soil microbial community. Environ. Pollut. 2021, 283, 117159. [Google Scholar] [CrossRef]
- Patra, D.K.; Pradhan, C.; Patra, H.K. Toxic metal decontamination by phytoremediation approach: Concept, challenges, opportunities and future perspectives. Environ. Technol. Innov. 2020, 18, 100672. [Google Scholar] [CrossRef]
- Raklami, A.; Tahiri, A.-I.; Bechtaoui, N.; Abdelhay, E.G.; Pajuelo, E.; Baslam, M.; Oufdou, K. Restoring the plant productivity of heavy metal-contaminated soil using phosphate sludge, marble waste, and beneficial microorganisms. J. Environ. Sci. 2021, 99, 210–221. [Google Scholar] [CrossRef]
- Rajkumar, M.; Sandhya, S.; Prasad, M.N.V.; Freitas, H. Perspectives of plant-associated microbes in heavy metal phytoremediation. Biotechnol. Adv. 2012, 30, 1562–1574. [Google Scholar] [CrossRef]
- Thakare, M.; Sarma, H.; Datar, S.; Roy, A.; Pawar, P.; Gupta, K.; Prasad, R. Understanding the holistic approach to plant-microbe remediation technologies for removing heavy metals and radionuclides from soil. Curr. Res. Biotechnol. 2021, 3, 84–98. [Google Scholar] [CrossRef]
- Adeyemi, N.O.; Atayese, M.O.; Sakariyawo, O.S.; Azeez, J.O.; Abayomi Sobowale, S.P.; Olubode, A.; Adeoye, S. Alleviation of heavy metal stress by arbuscular mycorrhizal symbiosis in Glycine max (L.) grown in copper, lead and zinc contaminated soils. Rhizosphere 2021, 18, 100325. [Google Scholar] [CrossRef]
- Yang, C.; Ho, Y.-N.; Inoue, C.; Chien, M.-F. Long-term effectiveness of microbe-assisted arsenic phytoremediation by Pteris vittata in field trials. Sci. Total Environ. 2020, 740, 140137. [Google Scholar] [CrossRef]
- Liu, C.; Lin, H.; Li, B.; Dong, Y.; Yin, T. Responses of microbial communities and metabolic activities in the rhizosphere during phytoremediation of Cd-contaminated soil. Ecotoxicol. Environ. Saf. 2020, 202, 110958. [Google Scholar] [CrossRef] [PubMed]
- Chodak, M.; Gołębiewski, M.; Morawska-Płoskonka, J.; Kuduk, K.; Niklińska, M. Diversity of microorganisms from forest soils differently polluted with heavy metals. Appl. Soil Ecol. 2013, 64, 7–14. [Google Scholar] [CrossRef]
- Niklińska, M.; Chodak, M.; Laskowski, R. Characterization of the forest humus microbial community in a heavy metal polluted area. Soil Biol. Biochem. 2005, 37, 2185–2194. [Google Scholar] [CrossRef]
- Ranjard, L.; Lignier, L.; Chaussod, R. Cumulative effects of short-term polymetal contamination on soil bacterial community structure. Appl. Environ. Microbiol. 2006, 72, 1684–1687. [Google Scholar] [CrossRef] [Green Version]
- Singh, B.K.; Quince, C.; Macdonald, C.A.; Khachane, A.; Thomas, N.; Al-Soud, W.A.; Sørensen, S.J.; He, Z.; White, D.; Sinclair, A.; et al. Loss of microbial diversity in soils is coincident with reductions in some specialized functions. Env. Microbiol. 2014, 16, 2408–2420. [Google Scholar] [CrossRef]
- Fernandez Nuñez, N.; Maggia, L.; Stenger, P.-L.; Lelievre, M.; Letellier, K.; Gigante, S.; Carriconde, F. Potential of high-throughput eDNA sequencing of soil fungi and bacteria for monitoring ecological restoration in ultramafic substrates: The case study of the New Caledonian biodiversity hotspot. Ecol. Eng. 2021, 173, 106416. [Google Scholar] [CrossRef]
- Guo, H.; Nasir, M.; Lv, J.; Dai, Y.; Gao, J. Understanding the variation of microbial community in heavy metals contaminated soil using high throughput sequencing. Ecotoxicol. Environ. Saf. 2017, 144, 300–306. [Google Scholar] [CrossRef]
Figure 1.
The AWCD values in the microbial community of soil samples increased quickly and then slowly during the cultivation in both rhizosphere soil (A); and bulk soil (B). The bars represent the means and SD of 3 replicates. CRS/CBS = rhizosphere soil/bulk soil of C. lanceolata, ZRS/ZBS = rhizosphere soil/bulk soil of Z. schneideriana, TRS/TBS = rhizosphere soil/bulk soil of T. ciliate, CMRS/CMBS = rhizosphere soil/bulk soil of C. myrsinifolia, PRS/PBS = rhizosphere soil/bulk soil of P. elliottii, ARS/ABS = rhizosphere soil/bulk soil of A. cremastogyne, UNS = uncontaminated soil.
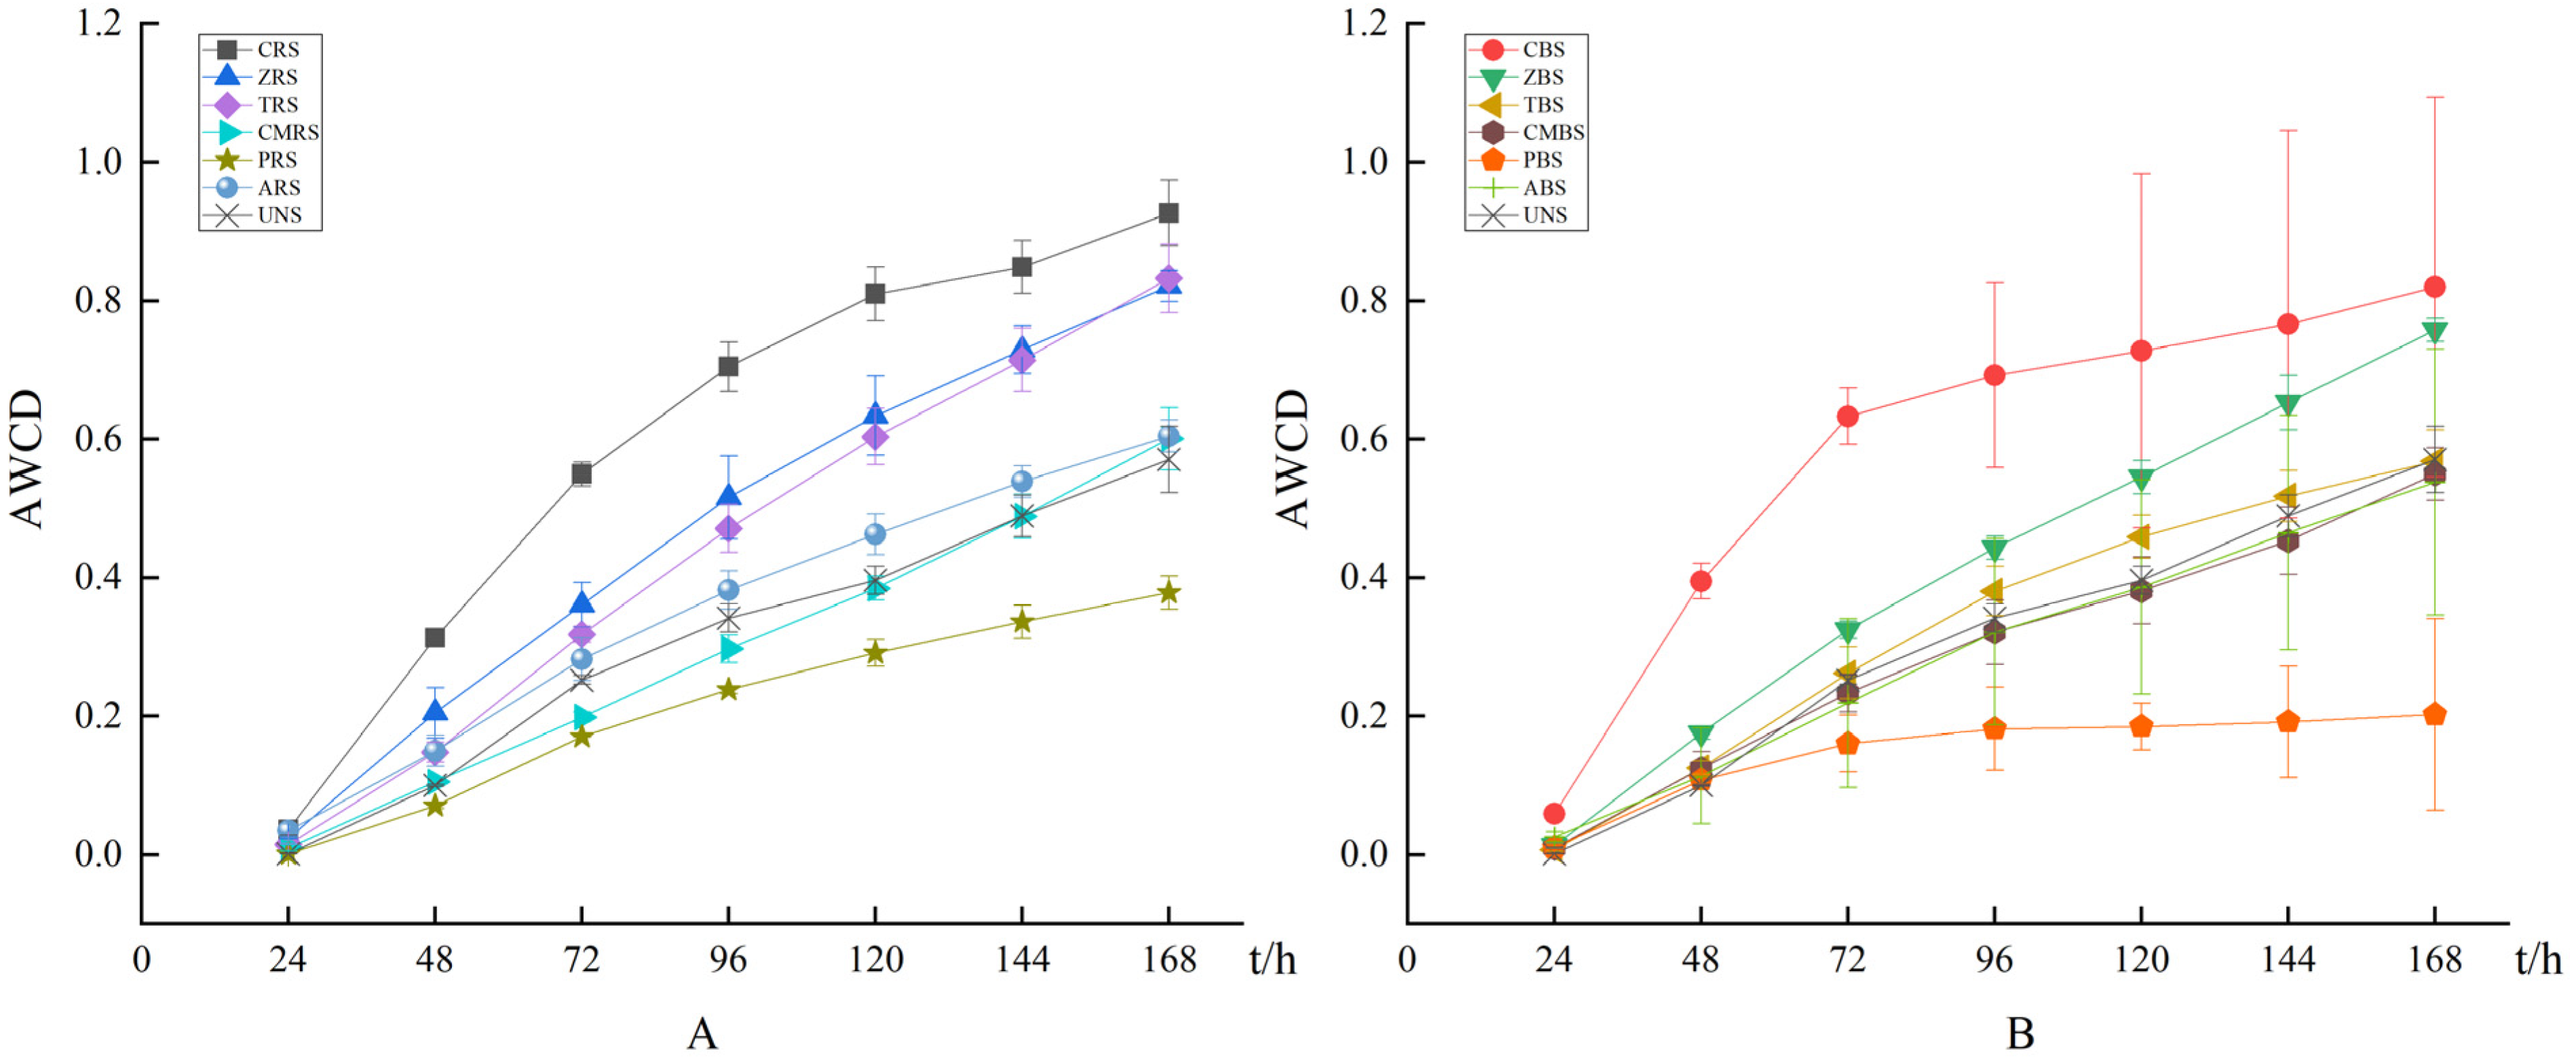
Figure 2.
The AWCD values of soil microbial communities were calculated according to the type of carbon sources for comparison of differences in tailing soils under the influence of six native plants and uncontaminated soil. The bars represent the means and SD of 3 replicates. Means not sharing any letter are significantly different at the 5 % level of significance. (A–F): C. lanceolata; Z. schneideriana; T. ciliata; C. myrsinifolia; P. elliottii; A. cremastogyne; RS = rhizosphere soil; BS = bulk soil; UNS = uncontaminated soil.

Figure 3.
Principal component analysis of microbial carbon utilization patterns using Biolog™ EcoPlates from rhizosphere and bulk soils from six native plants and uncontaminated soil. Squares represent rhizosphere soil; circles represent bulk soil; triangles represent uncontaminated soil. For abbreviations see Table 1.

Figure 4.
High-throughput sequencing to compare the relative abundance of bacteria (A) and fungi (C) at the phylum level in soil samples. Cluster analysis based on distance algorithm was used to further discriminate differences in bacterial (B) and fungal (D) communities at the genus level. For abbreviations see Table 1.
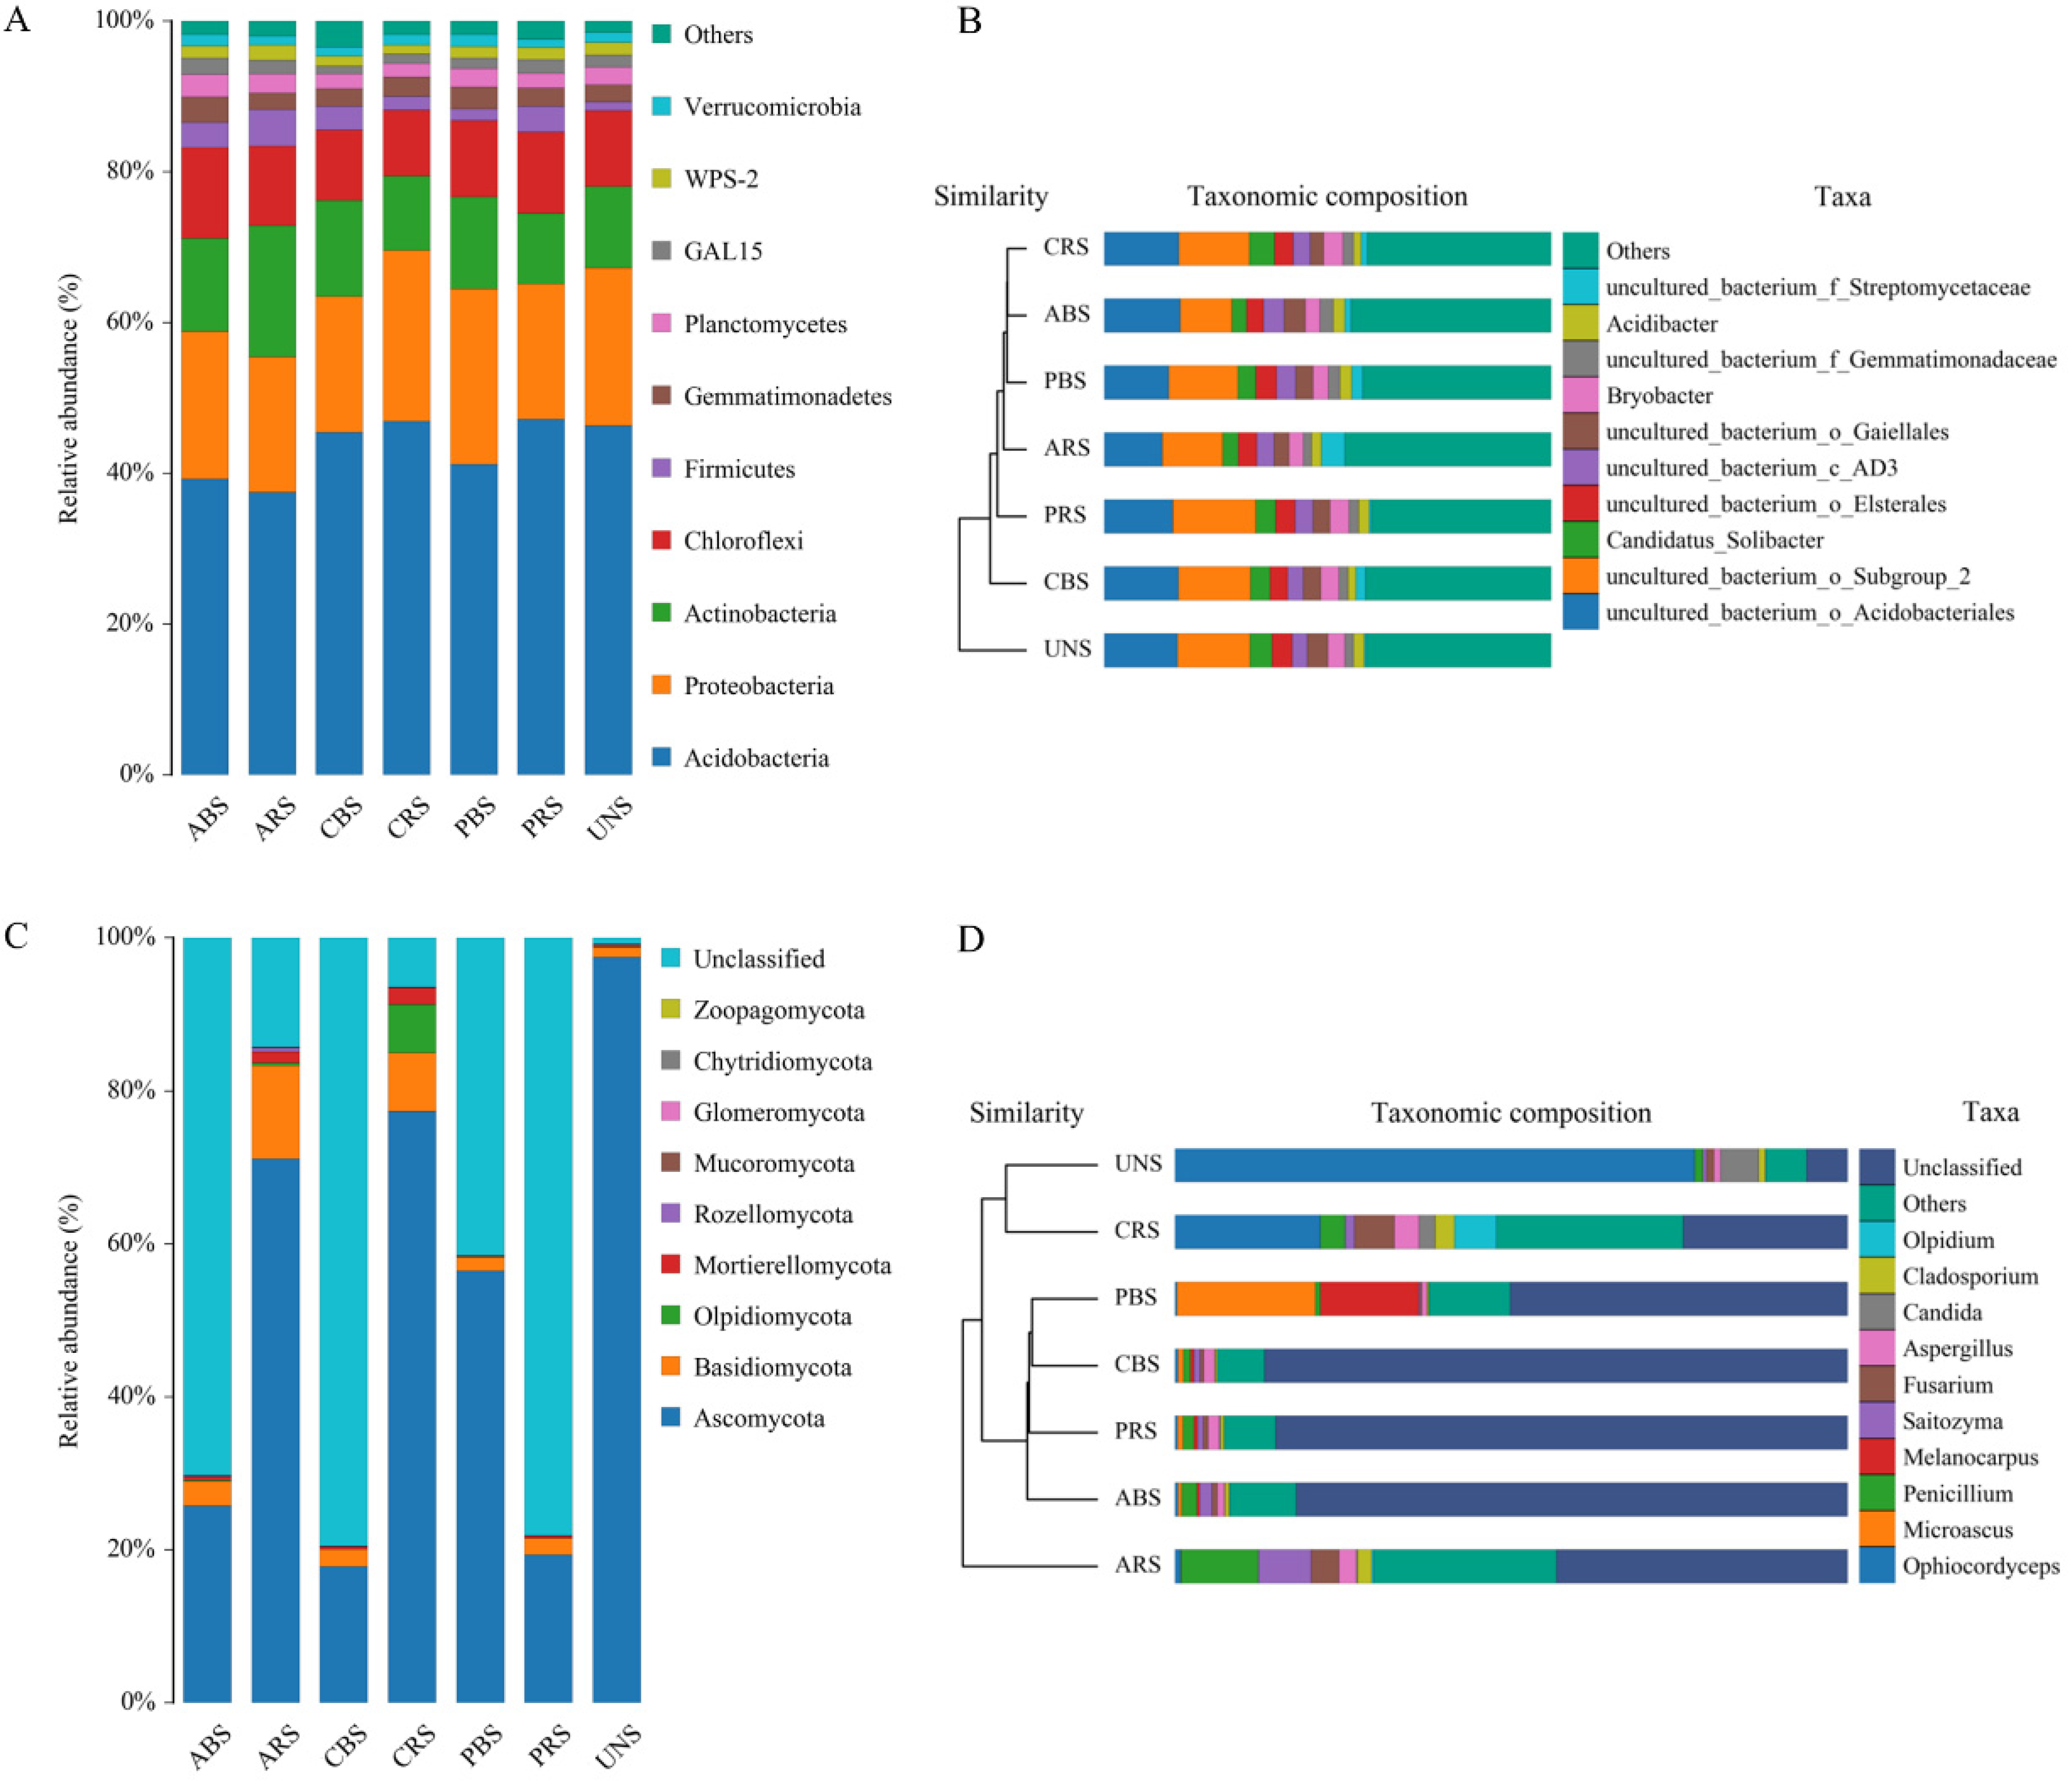
Figure 5.
Regression analysis of correlation between bacterial (A) and fungal (B) composition of soil samples and environmental factors. The scale on the horizontal and vertical coordinates is the value generated by each sample during regression analysis and calculation with environmental factors; dots represent soil samples; arrows represent different environmental factors. The relationship between element points is represented by distance. CRS/CBS = rhizosphere soil/bulk soil of C. lanceolata; PRS/PBS = rhizosphere soil/bulk soil of P. elliottii; ARS/ABS = rhizosphere soil/bulk soil of A. cremastogyne; UNS = uncontaminated soil.

Figure 6.
Correlation of soil properties with microbial abundance and carbon source utilization. The color and size of the discs are used to represent the correlation between two variables. The darker the color and the larger the size is, the greater the absolute value of the correlation coefficient between variables. *, **, *** in white indicate significance at p < 0.05, 0.01, 0.001, respectively; Ec = electric conductivity; SOC = soil organic carbon; TN = total nitrogen; TP = total phosphorus; TK = total potassium; AN = available nitrogen; AK = available potassium; AWCD = the average well color development.


Table 1.
Chemical characteristics of soil samples (rhizosphere and bulk soil) from iron mine tailing in Jiangxi.
Table 1.
Chemical characteristics of soil samples (rhizosphere and bulk soil) from iron mine tailing in Jiangxi.
| Scheme | pH † Mean ± SD | Ec μs/cm Mean ± SD | SOC g/kg Mean ± SD | TN g/kg Mean ± SD | TP g/kg Mean ± SD | TK g/kg Mean ± SD | AN mg/kg Mean ± SD | AK mg/kg Mean ± SD | Cu mg/kg Mean ± SD | Pb mg/kg Mean ± SD | Zn mg/kg Mean ± SD |
|---|---|---|---|---|---|---|---|---|---|---|---|
| CRS ‡ | 5.58 ± 0.03c § | 134.97 ± 0.15a | 7.63 ± 0.25b | 0.82 ± 0.01b | 0.41 ± 0.01c | 20.41 ± 0.95bc | 327.2 ± 47.90b | 19.55 ± 4.52b | 82.47 ± 2.45bc | 50.36 ± 3.69b | 238.34 ± 4.38b |
| CBS | 4.93 ± 0.02hi | 87.43 ± 0.23c | 3.47 ± 0.02d | 0.42 ± 0.01h | 0.37 ± 0.01c | 22.98 ± 0.57ab | 156.51 ± 3.71d | 10.72 ± 0.66c | 79.62 ± 1.74c | 45.94 ± 1.71b | 246.06 ± 2.38ab |
| ZRS | 4.95 ± 0.03hi | 66.93 ± 0.15g | 3.38 ± 0.18d | 0.48 ± 0.00fg | 0.66 ± 0.01a | 20.97 ± 0.45bc | 72.04 ± 1.33f | 14.46 ± 0.72c | 94.87 ± 1.43a | 73.30 ± 1.71a | 269.54 ± 18.32ab |
| ZBS | 5.20 ± 0.02f | 70.57 ± 0.40f | 4.93 ± 0.04cd | 0.51 ± 0.02f | 0.44 ± 0.02bc | 20.04 ± 0.97bc | 112.88 ± 6.13e | 12.91 ± 0.82c | 85.48 ± 2.51b | 68.66 ± 15.74a | 60.52 ± 3.43d |
| TRS | 5.49 ± 0.01d | 85.37 ± 0.35d | 6.24 ± 0.26bc | 0.81 ± 0.02b | 0.48 ± 0.02bc | 20.69 ± 0.39bc | 382.08 ± 1.01a | 14.54 ± 1.26c | 73.04 ± 0.63d | 61.20 ± 1.58ab | 100.82 ± 5.25d |
| TBS | 4.88 ± 0.03i | 46.7 ± 0.35k | 5.01 ± 0.18cd | 0.63 ± 0.01d | 0.54 ± 0.01b | 23.61 ± 0.68a | 67.96 ± 1.82f | 13.71 ± 0.21c | 60.44 ± 0.58e | 73.42 ± 3.34a | 290.16 ± 4.36ab |
| CMRS | 5.36 ± 0.03e | 90.97 ± 0.15b | 4.68 ± 0.20cd | 0.62 ± 0.01d | 0.32 ± 0.01c | 18.43 ± 0.19c | 372.26 ± 6.57a | 23.45 ± 2.46ab | 23.25 ± 0.32h | 61.09 ± 0.96ab | 268.76 ± 12.25ab |
| CMBS | 5.31 ± 0.02e | 75.3 ± 0.00e | 3.55 ± 0.15d | 0.58 ± 0.01e | 0.33 ± 0.01c | 19.05 ± 0.51c | 232.85 ± 0.00c | 22.11 ± 0.70ab | 28.45 ± 1.18g | 64.10 ± 1.63a | 297.14 ± 32.62a |
| PRS | 5.00 ± 0.03h | 39.1 ± 0.44l | 2.75 ± 0.39d | 0.47 ± 0.02g | 0.43 ± 0.00bc | 24.33 ± 0.59a | 56.00 ± 0.00f | 13.04 ± 0.79c | 25.82 ± 0.13gh | 63.15 ± 2.88ab | 282.68 ± 6.01ab |
| PBS | 5.08 ± 0.02g | 63.37 ± 0.71h | 4.61 ± 0.04cd | 0.63 ± 0.03d | 0.51 ± 0.16bc | 21.3 ± 1.55b | 162.75 ± 7.63d | 13.42 ± 0.22c | 26.12 ± 0.98gh | 60.00 ± 1.60ab | 270.24 ± 8.68ab |
| ARS | 6.26 ± 0.06a | 62.73 ± 0.35hi | 5.99 ± 0.29c | 0.70 ± 0.03c | 0.60 ± 0.01ab | 22.92 ± 1.22ab | 78.46 ± 3.54f | 17.66 ± 0.57bc | 60.00 ± 2.04e | 65.53 ± 3.35a | 170.83 ± 41.78c |
| ABS | 5.95 ± 0.07b | 52.13 ± 0.31j | 4.25 ± 0.08cd | 0.69 ± 0.01c | 0.60 ± 0.01ab | 23.49 ± 0.20a | 119.00 ± 4.63e | 16.43 ± 0.21bc | 63.44 ± 0.96e | 71.84 ± 2.74a | 164.96 ± 36.37c |
| UNS | 4.63 ± 0.02j | 62.3 ± 0.40i | 25.49 ± 2.22a | 1.65 ± 0.01a | 0.44 ± 0.01bc | 14.81 ± 0.71d | 168.47 ± 6.78d | 23.95 ± 1.18a | 34.92 ± 0.49f | 65.50 ± 2.65a | 148.24 ± 12.42c |
| Risk screening value of heavy metal (GB15618-2018) | pH ≤ 5.5 | 50 | 70 | 200 | |||||||
| 5.5 < pH ≤ 6.5 | 90 | ||||||||||
† Ec = electric conductivity; SOC = soil organic carbon; TN = total nitrogen; TP = total phosphorus; TK = total potassium; AN = available nitrogen; AK = available potassium; ‡ CRS/CBS = rhizosphere soil/bulk soil of C. lanceolata; ZRS/ZBS = rhizosphere soil/bulk soil of Z. schneideriana; TRS/TBS = rhizosphere soil/bulk soil of T. ciliate; CMRS/CMBS = rhizosphere soil/bulk soil of C. myrsinifolia; PRS/PBS = rhizosphere soil/bulk soil of P. elliottii; ARS/ABS = rhizosphere soil/bulk soil of A. cremastogyne; UNS = uncontaminated soil. § Values with the same lower case letters in a row are not significantly different at p < 0.05.
Table 2.
Soil microbial functional diversity index.
| Samples | Shannon–Wiener Diversity Index | Pielou Evenness Index | Simpson Dominance Index | McIntosh Diversity Index | McIntosh Evenness Index |
|---|---|---|---|---|---|
| CRS † | 3.19 ± 0.02a ‡ | 0.93 ± 0.01a | 0.95 ± 0ab | 3.64 ± 0.17b | 0.96 ± 0a |
| CBS | 3.20 ± 0.02a | 0.94 ± 0a | 0.95 ± 0a | 4.17 ± 0.24a | 0.96 ± 0a |
| ZRS | 3.06 ± 0.09ab | 0.91 ± 0.01b | 0.95 ± 0ab | 2.58 ± 0.31cd | 0.95 ± 0ab |
| ZBS | 2.88 ± 0.04bc | 0.85 ± 0.01d | 0.93 ± 0b | 2.61 ± 0.1c | 0.91 ± 0bc |
| TRS | 2.96 ± 0.08b | 0.88 ± 0.02cd | 0.94 ± 0.01ab | 2.41 ± 0.1cd | 0.93 ± 0.02bc |
| TBS | 2.84 ± 0.05bc | 0.88 ± 0.01cd | 0.93 ± 0b | 2.08 ± 0.24d | 0.93 ± 0.01b |
| CMRS | 2.88 ± 0.07bc | 0.86 ± 0.01cd | 0.93 ± 0b | 1.57 ± 0.08e | 0.92 ± 0.01bc |
| CMBS | 2.97 ± 0.05b | 0.88 ± 0.01cd | 0.94 ± 0ab | 1.78 ± 0.2de | 0.92 ± 0.01bc |
| PRS | 2.76 ± 0.05bc | 0.84 ± 0.01d | 0.93 ± 0b | 1.42 ± 0.02e | 0.90 ± 0.01c |
| PBS | 2.73 ± 0.21c | 0.90 ± 0.03bc | 0.92 ± 0.03b | 1.40 ± 0.27e | 0.92 ± 0.04bc |
| ARS | 3.00 ± 0.04ab | 0.88 ± 0.01c | 0.94 ± 0ab | 2.12 ± 0.3d | 0.93 ± 0.01bc |
| ABS | 2.77 ± 0.39bc | 0.88 ± 0.01c | 0.92 ± 0.03b | 1.72 ± 0.79de | 0.92 ± 0.02bc |
| UNS | 2.89 ± 0.03bc | 0.86 ± 0.01cd | 0.93 ± 0b | 2.00 ± 0.08de | 0.91 ± 0.01bc |
† CRS/CBS = rhizosphere soil/bulk soil of C. lanceolata; ZRS/ZBS = rhizosphere soil/bulk soil of Z. schneideriana; TRS/TBS = rhizosphere soil/bulk soil of T. ciliate; CMRS/CMBS = rhizosphere soil/bulk soil of C. myrsinifolia; PRS/PBS = rhizosphere soil/bulk soil of P. elliottii; ARS/ABS = rhizosphere soil/bulk soil of A. cremastogyne; UNS = uncontaminated soil. ‡ The data are shown as the means ± SD (n = 3). Values with the same lower-case letters in a row are not significantly different at p < 0.05.
Publisher’s Note: MDPI stays neutral with regard to jurisdictional claims in published maps and institutional affiliations. |
© 2022 by the authors. Licensee MDPI, Basel, Switzerland. This article is an open access article distributed under the terms and conditions of the Creative Commons Attribution (CC BY) license (https://creativecommons.org/licenses/by/4.0/).
Share and Cite
MDPI and ACS Style
Wang, Q.; Sun, Q.; Wang, W.; Liu, X.; Song, L.; Hou, L. Effects of Different Native Plants on Soil Remediation and Microbial Diversity in Jiulong Iron Tailings Area, Jiangxi. Forests 2022, 13, 1106. https://doi.org/10.3390/f13071106
AMA Style
Wang Q, Sun Q, Wang W, Liu X, Song L, Hou L. Effects of Different Native Plants on Soil Remediation and Microbial Diversity in Jiulong Iron Tailings Area, Jiangxi. Forests. 2022; 13(7):1106. https://doi.org/10.3390/f13071106
Chicago/Turabian StyleWang, Qian, Qiwu Sun, Wenzheng Wang, Xiangrong Liu, Liguo Song, and Lingyu Hou. 2022. "Effects of Different Native Plants on Soil Remediation and Microbial Diversity in Jiulong Iron Tailings Area, Jiangxi" Forests 13, no. 7: 1106. https://doi.org/10.3390/f13071106
Note that from the first issue of 2016, this journal uses article numbers instead of page numbers. See further details here.