Article

Negative Density Restricts the Coexistence and Spatial Distribution of Dominant Species in Subtropical Evergreen Broad-Leaved Forests in China

1
Zhejiang Academy of Forestry, Hangzhou 310023, China
2
Zhejiang Hangzhou Urban Forest Ecosystem Research Station, Hangzhou 310023, China
*
Author to whom correspondence should be addressed.
Forests 2022, 13(8), 1227; https://doi.org/10.3390/f13081227
Submission received: 17 July 2022 / Revised: 29 July 2022 / Accepted: 30 July 2022 / Published: 2 August 2022
(This article belongs to the Special Issue Impacts of Climate Change on Forest by Using Growth Modeling)

Abstract

:
Negative densification affects the spatial distribution of species in secondary evergreen broad-leaved forests and is a key mechanism governing species coexistence. We investigated the effects of habitat heterogeneity and density on the spatial distribution of populations of dominant woody species in a secondary evergreen broad-leaved forest in Wuchaoshan using spatial univariate point pattern analyses. This 6 ha forest dynamic monitoring sample area in Hangzhou, China is a typical secondary subtropical evergreen broad-leaved forest. We found (1) a strong effect of habitat heterogeneity that led to the spatial aggregation of dominant species in the plot. Habitat heterogeneity had a strong impact on mature individuals at different life history stages and of different species on a large scale. (2) Negative density dependence (NDD) generally affected spatial distributions of most dominant species and decreased in magnitude with age class. Therefore, different species of subtropical evergreen broad-leaved forests in China have formed unique spatial structures due to their habitat preferences but are generally subjected to density-dependent effects.

1. Introduction

Negative density dependence (NDD) is the reduction in growth rate and increase in mortality rate of individuals through intra- and inter-specific interactions at small scales, thus providing space and resources for the survival of fewer individuals of multiple species [1,2,3]. In plants, the NDD hypothesis can have more effects, and those effects are predicted by the hypothesis. Those effects are: (1) the effects of density on shared use of limited resources (e.g., nutrients, light, water); (2) disease and pest effects that proximity conspecifics are likely to share pests, pathogens, and other harmful organisms, which is included under sparsity effects [3,4,5,6]. The low density of rare species makes them less susceptible to the influence of density restriction, which may increase the survival and fecundity of rare species relative to common species and promote species coexistence [7]. The NDD hypothesis has been used to explain species coexistence in tropical montane rainforest communities, with both abiotic (e.g., soil factors) and biotic (e.g., functional traits, species abundance) factors found to affect the intensity of negative density dependence [5,6,8].
The spatial distribution of a population refers to the geographic distribution of all individuals in the community at a certain point in time [9]. Generally, the spatial distribution of plant populations can be divided into three types: aggregated, uniform, and random [4,9,10,11,12,13]. Trends in spatial distributions over individual life history stages can be used to test aspects of the NDD hypothesis [4,10,11,12,13]. For example, Zhu et al. [14] found that both homogenous density dependence and phylogenetic density dependence affected the survival of tropical trees, but their relative importance varied with life history stage and species. NDD has also been shown to regulate the spatial distribution of individuals such that they become more uniform and decrease in aggregation as the diameter class increases [13,14]. The spatial distribution of plants in natural communities is usually characterized by aggregation, which is determined by large-scale habitat heterogeneity and small-scale effects, such as plant interactions [9,15]. It is difficult to distinguish the cause of local density increases because they can result from both habitat heterogeneity and plant interactions. Therefore, it is necessary to exclude or directly measure the effects of habitat heterogeneity when studying the effects of plant interactions on the spatial distribution of plant populations [4,12,16].
Evergreen broad-leaved forest is the most common natural ecosystem type in China by distribution range and area [17]. These forests have high biodiversity due to distinct communities at each forest level with different dominant species. Research in secondary evergreen broad-leaved forests has recently increased; however, studies of NDD remain relatively rare in this important ecosystem (but see Zhu et al. [12] and Luo et al. [4]). More research is needed to test the effects of NDD in secondary evergreen broad-leaved forests, especially in urban and suburban forests, to understand the spatial distribution of dominant species and the formation and maintenance of community structure and species coexistence. We explored NDD in a 6 ha suburban forest dynamic monitoring area in Wuchaoshan National Forest Park in China, typical of the secondary subtropical evergreen broad-leaved forest. We used null univariate point pattern analyses to test the effects of habitat heterogeneity on NDD, the spatial distributions of dominant species, and species coexistence. We specifically addressed the following questions: (1) Does habitat heterogeneity affect the spatial distribution of dominant species in secondary evergreen broad-leaved forests? (2) Does NDD affect the spatial distribution of dominant species? (3) How does NDD affect species coexistence and community construction at different life history stages?

2. Materials and Methods
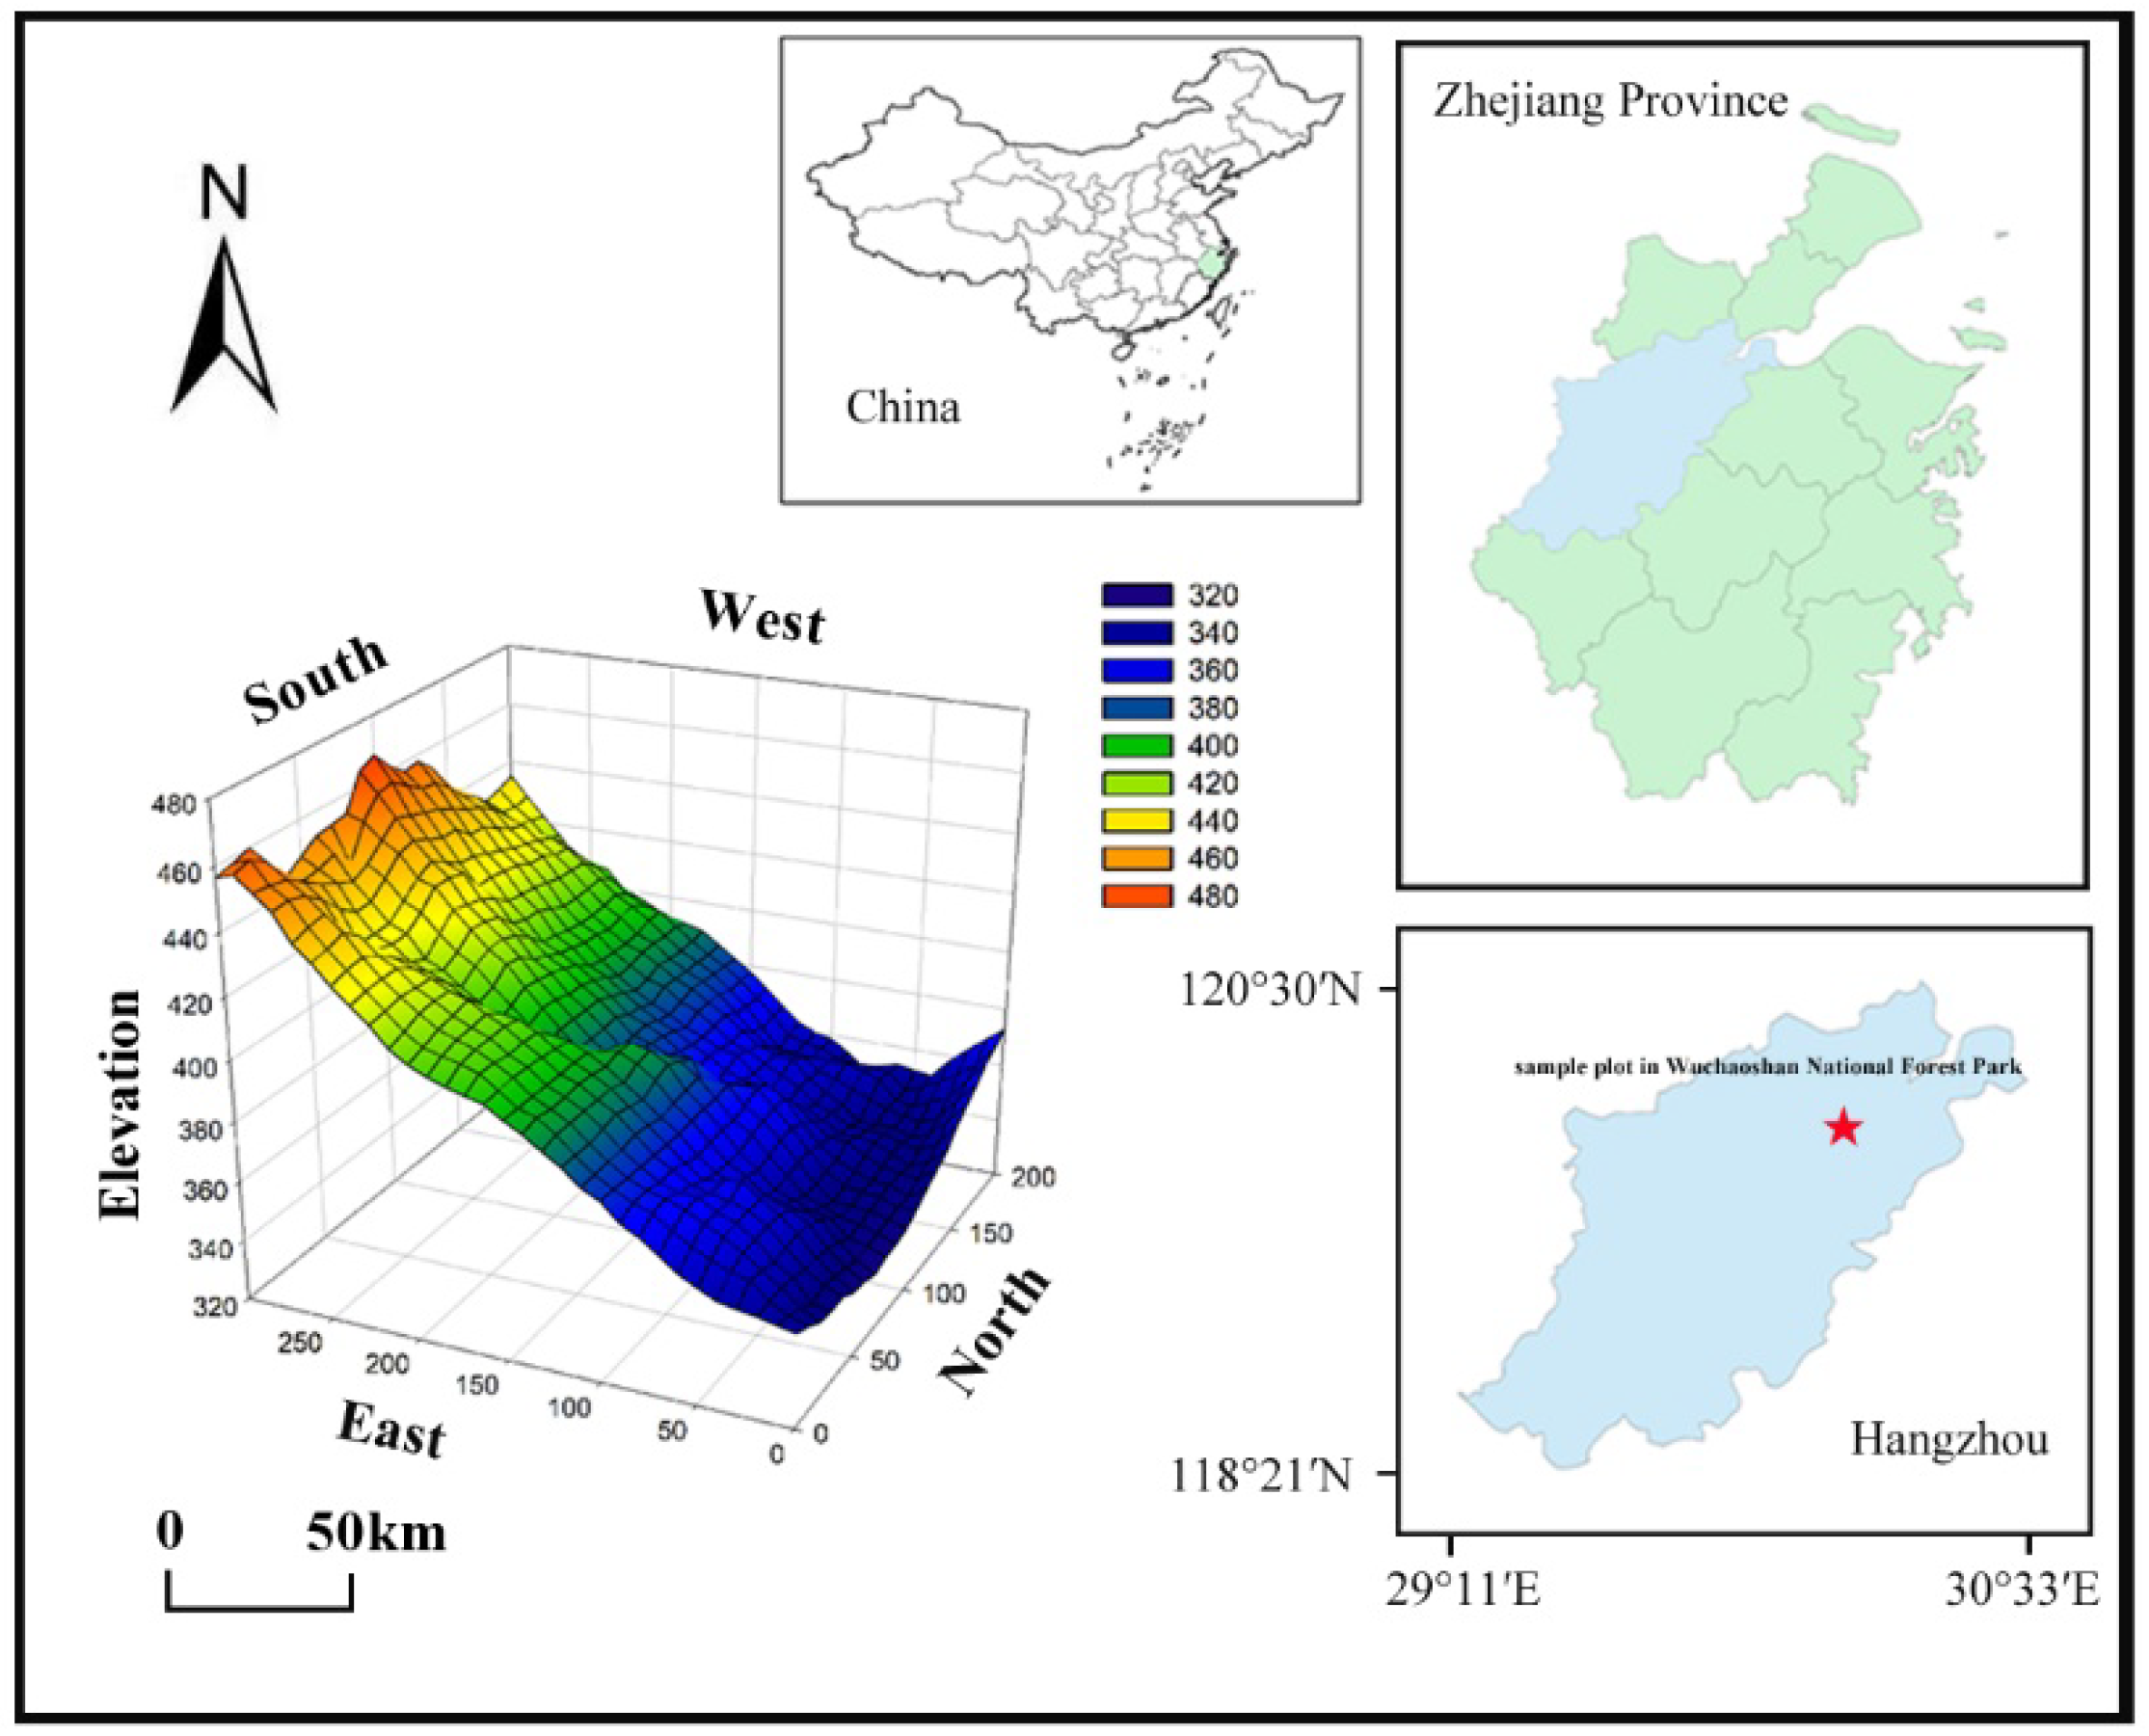
2.1. Study Site

Wuchaoshan National Forest Park is part of Tianmu Mountain, located in Xianlin Town, Yuhang District, Hangzhou City, Zhejiang Province (33°41′ N, 120°00′ E), China. It is about 20 km away from Hangzhou City, with a total area of 522 ha, an average altitude of 264 m, and a maximum altitude of 494.7 m. As a natural forest ecosystem in the suburbs of Hangzhou City, Wuchaoshan National Forest Park is in the central subtropical zone, with an annual average temperature of 16.1 °C, an average temperature of the coldest month (January) of 3.6 °C, and an average temperature of the hottest month (August) of 38.4 °C. The mean annual sunshine hours are 1970.6 h, and the mean plant growth period is 311 days; red soil and yellow soil are the main soil types. The forest coverage rate of Wuchaoshan National Forest Park is as high as 93% with high plant species richness. Evergreen broad-leaved forest is the regional vegetation, and high-frequency trees include: Cyclobalanopsis glauca, Castanopsis chinensis, Schima superba, and Castanopsis sclerophylla. Before the 1970s, the entire reserve experienced regular human interference, such as felling, but the forest has been completely closed to afforestation for 40 years [17].

2.2. Sample Setting and Community Survey

From October 2020 to June 2021, a well-recovered subtropical evergreen hardwood forest community was selected, and a 6 ha (200 m × 300 m) forest dynamic monitoring site was established according to the Center for Topical Forest Science (CTFS) standards. The 6 ha site was divided into 150 sample plots (each 20 m × 20 m), permanently marked with stainless steel tubes at 4 corners of each sample square (Figure 1). The origin coordinates of the sample site are (30°11′11.37″ N, 120°0′0.60″ E) and the elevation range is 340.1–467.4 m. Each 20 m × 20 m sample plot was divided into 16 sample squares (each 5 m × 5 m) to conduct a comprehensive survey of the sample plants. All woody plants with a diameter at breast height (DBH) ≥ 1 cm in each sample were numbered using aluminium plates and marked with red paint at 1.3 m above the tree height. Species names, DBH, tree height, coordinates, branching, and initiation status were recorded for all labelled woody plant individuals [17].
We studied the dominant tree species (3 trees and 6 shrubs) in the plot to explore the effects of habitat heterogeneity and NDD on the spatial distribution of dominant species. The magnitude of habitat heterogeneity is difficult to quantify; here, we assumed that with the growth of individual trees, habitat heterogeneity increased influence on the trees; then, the spatial structure of mature stands showed the stand space affected by habitat heterogeneity [11]. To test the effects of NDD on different individual growth stages, we used DBH as a proxy for tree age [4] and created three age classes for both trees and shrubs (total six classes): sapling tree, 1 cm ≤ tree DBH < 5 cm; juvenile tree, 5 cm ≤ DBH < 10 cm; adult tree, DBH ≥ 10 cm; sapling shrub, 1 cm ≤ DBH < 2.5 cm; juvenile shrub, 2.5 cm ≤ DBH < 5 cm; and adult shrub, DBH ≥ 5 cm [12].

2.3. Research Methods

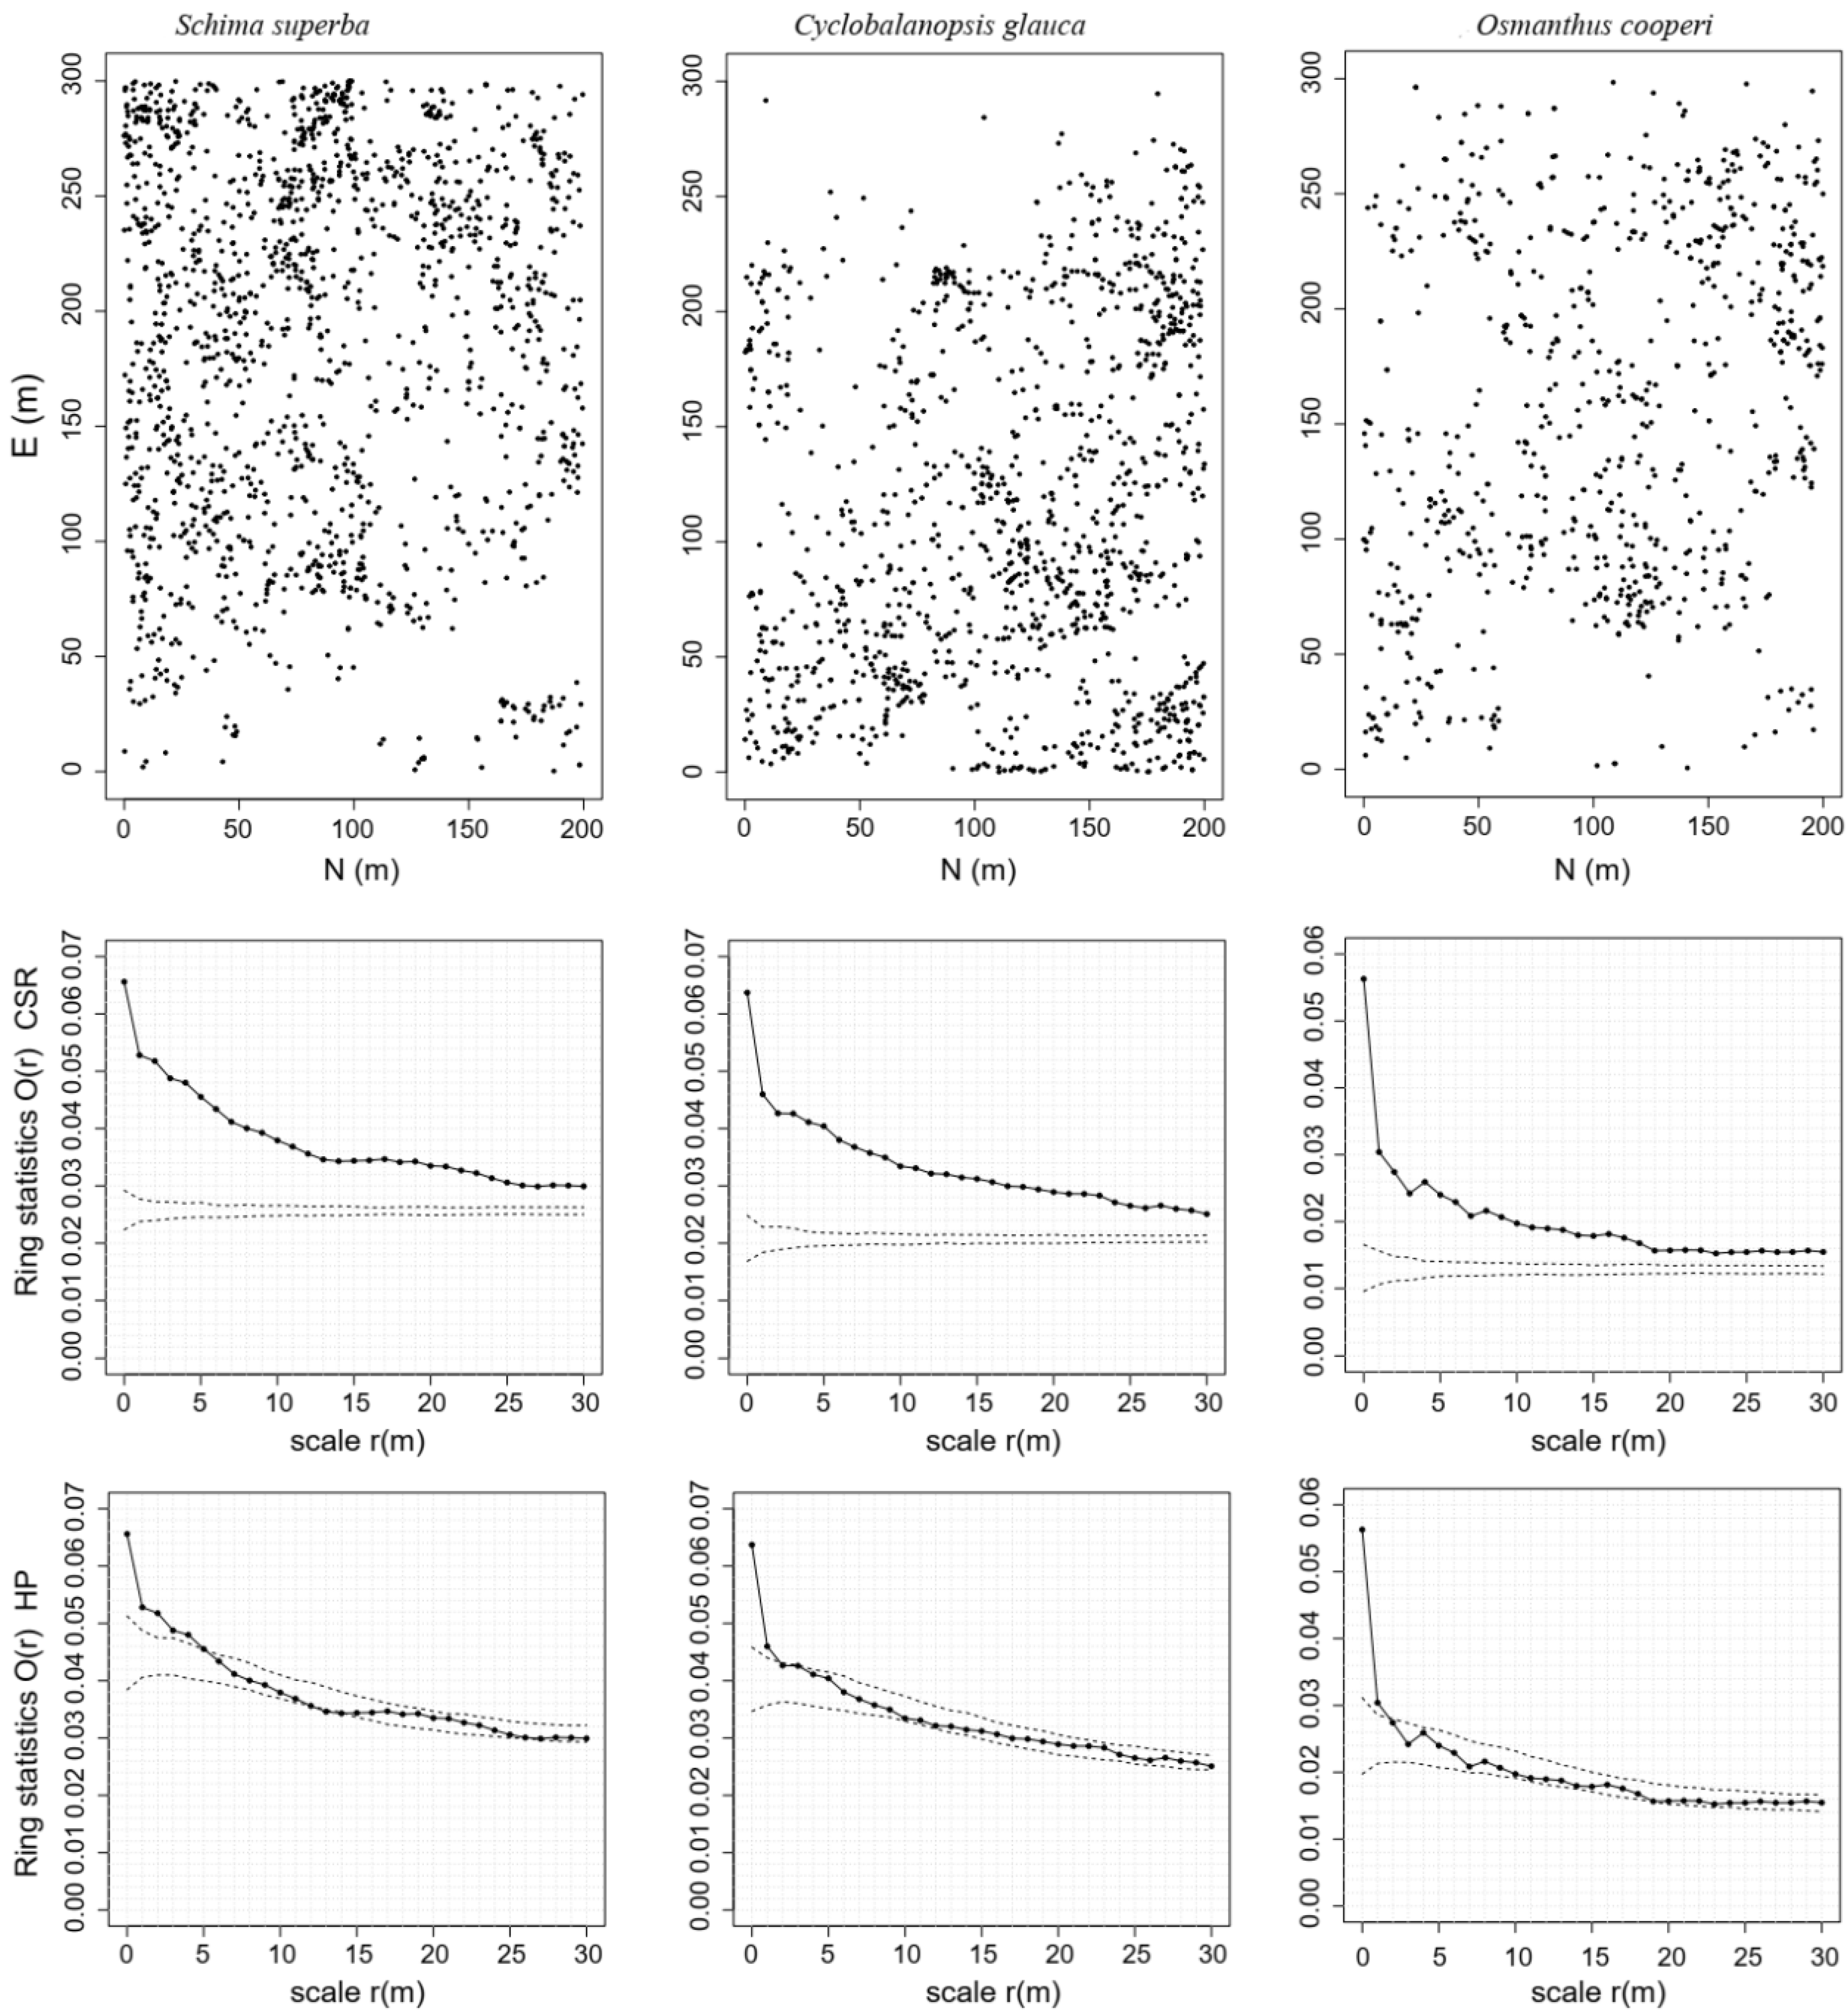
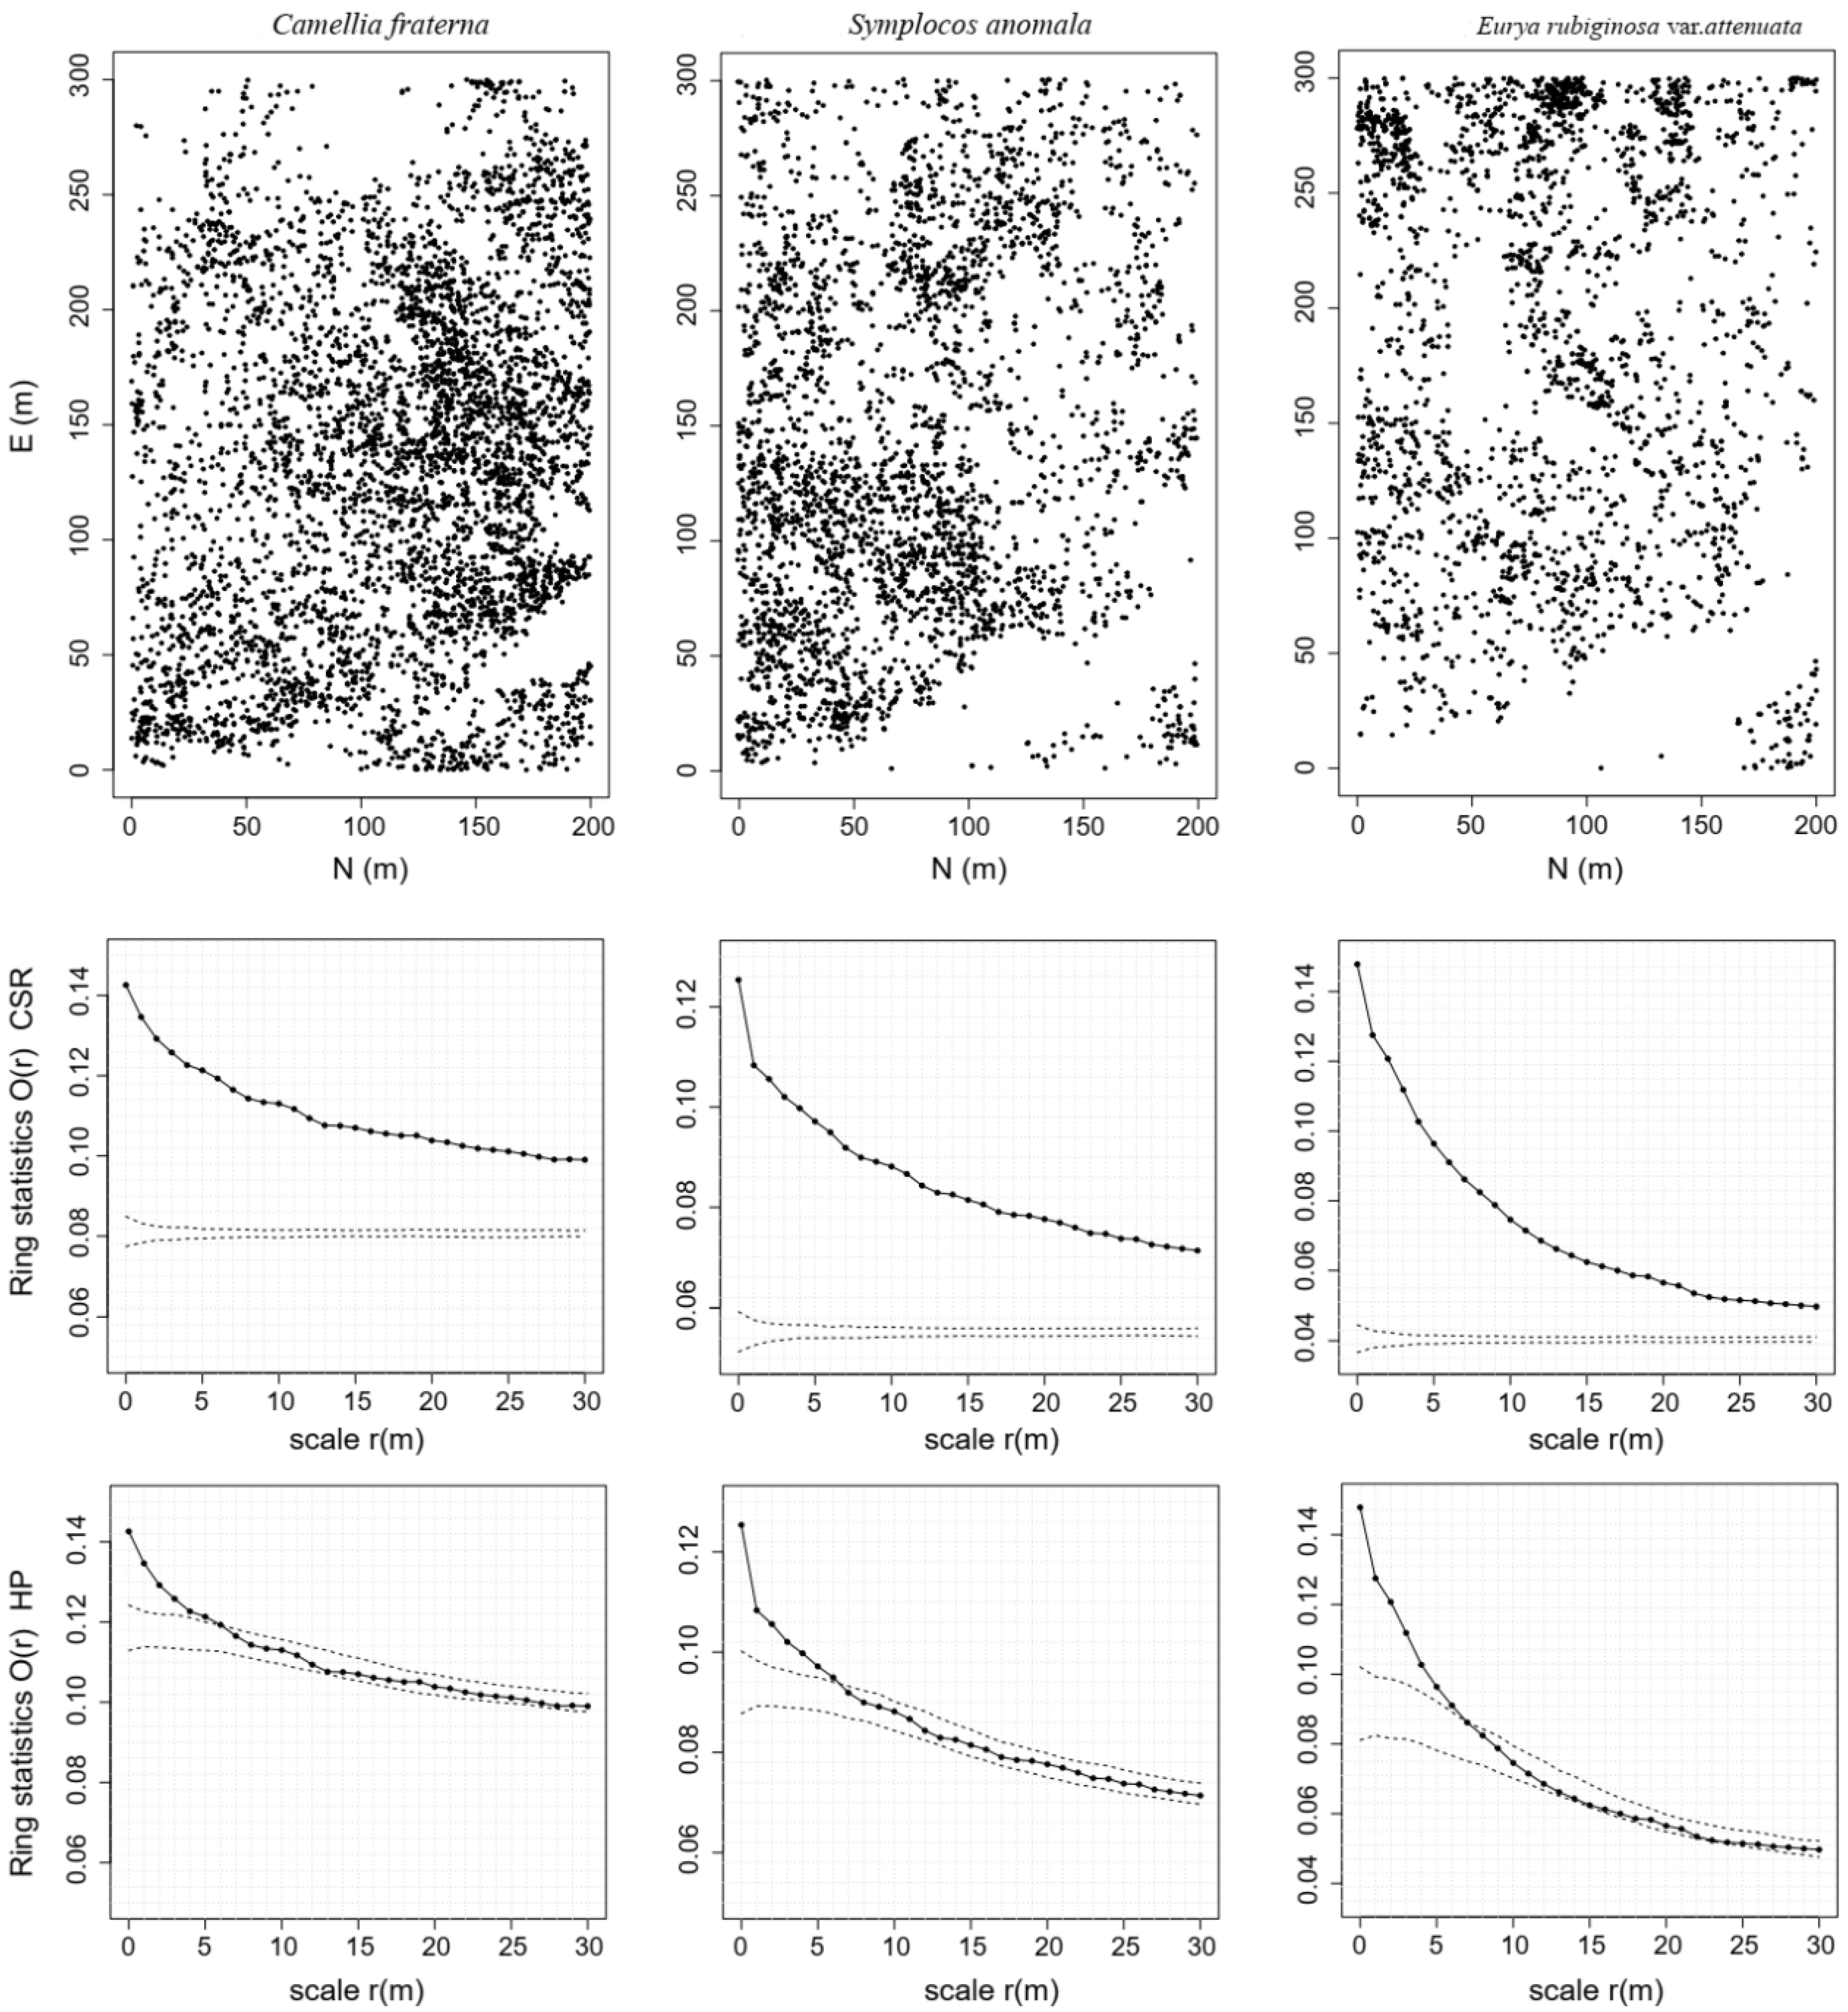
2.3.1. Testing Habitat Heterogeneity

We used the univariate point pattern analysis function derived from Ripley’s K function [9,12,18] to study species’ spatial distributions. The principle of Ripley’s function is to count the number of plant individuals in a circle centred in a sample plot with radius r. Based on K(r), the double correlation function g(r) further considers the cumulative effects of small-scale patterns on large-scale patterns. Using rings instead of circles can more sensitively distinguish the deviation from the expected value of the actual distribution of points at a certain scale, and further improves the accuracy of univariate point pattern analyses [15]. The O(r) function [19,20] was introduced as the expected value of g(r):
K r = A n 2 i = 1 n 1 j = 1 n 2 I r d i j W i j   i j          
g r = 1 2 π r d K r d r
O r = λ g r                
where A is the area of the sample plot; n is the number of trees in the sample plot; Ir(dij) is the indicator function, and dij is the distance between the centres of the ith and jth circles; when dijr, Ir(dij) = 1, and when dij > r, Ir(dij) = 0. Wij is the weight of edge correction; r is the distance scale and the expected number of points per unit area, which can also be understood as the distributed intensity in the study sample area. O(r) = λ in the case of completely random distribution, O(r) > λ in the case of aggregated distribution, and O(r) < λ in the case of uniform distribution.
To test the effects of habitat heterogeneity on population spatial distributions, we adopted two spatial distribution null models: complete spatial randomness (CSR) and heterogeneous Poisson process (HP). The HP model was a null model that excludes habitat heterogeneity. A grid of 1 m × 1 m was set to divide the whole plot, and the width of the sampling ring was set at 3 m. Simulation tests were carried out on a scale of 0–30 m, and 95% confidence intervals were obtained from the fifth lowest and fifth highest values of 199 Monte Carlo simulations. If O(r) of the empirical distribution was greater than the 95% confidence interval under the model condition, the distribution was considered aggregated; empirical O(r) less than the null model confidence interval was considered uniform, and empirical O(r) within the null model confidence interval was considered as random.

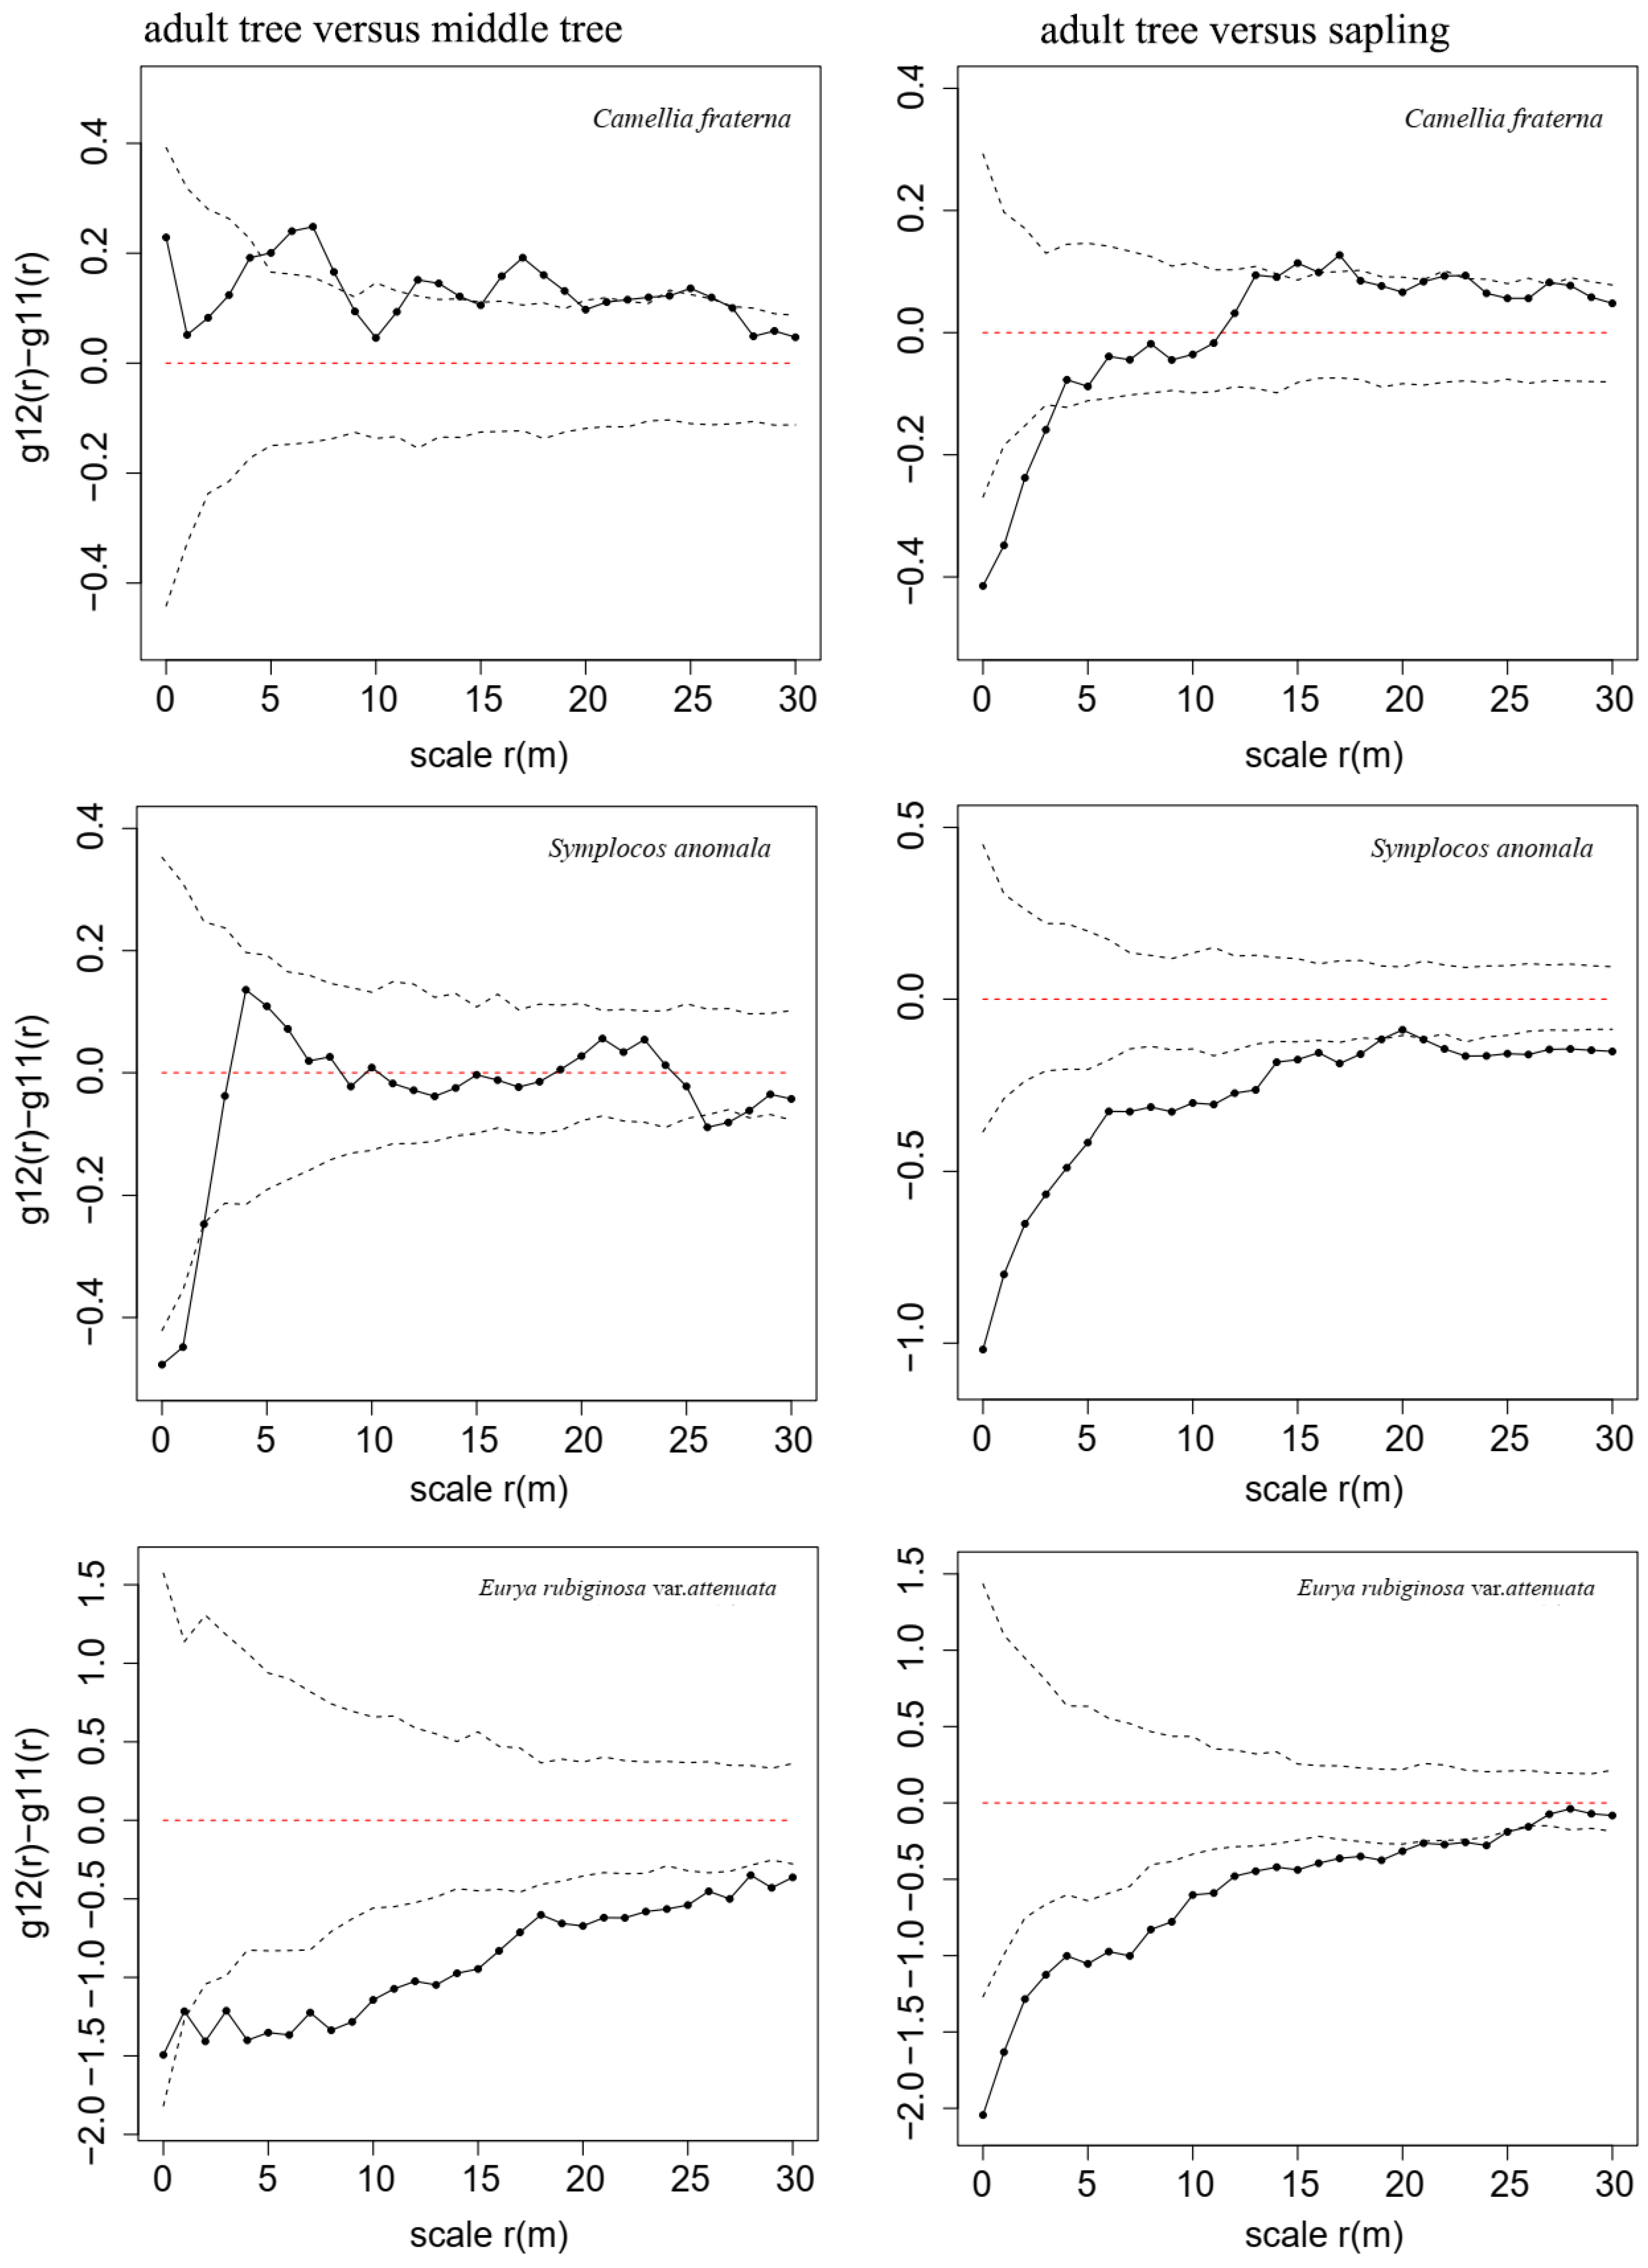
2.3.2. Testing Negative Density Dependence

Random labelling (RL) null models and case-control designs were used to test the effects of negative density dependence (NDD). The RL null model was added to exclude habitat heterogeneity. In a case–control design, small trees or saplings were used as the case (pattern 1) and adult trees as control (pattern 2) to represent the effect of habitat heterogeneity; g12(r) represented the distribution of control individuals around the case, and g11(r) represented the distribution of case individuals around the case. If g12(r) − g11(r) ≈ 0 and the empirical distribution falls within the confidence interval, the case showed no additional pattern compared with the control and conforms to the null hypothesis. If g12(r) − g11(r) falls outside the confidence interval, the frequency of points appearing around the case is different than that of the control, indicating that saplings and adult trees have different distributions. With the increase in diameter class, the aggregation degree of individual trees decreased due to the density-dependent effect. Simulations were designed as above; all grid analyses were conducted using Programita 2018 and mapping was performed using R version 3.2.4 [21].

3. Results

3.1. Effects of Habitat Heterogeneity

Under the heterogeneous Poisson process (HP) null model, Schima superba, Cyclobalanopsis glauca, and Osmanthus cooperi showed aggregated distributions at 0–5 m, 0–2 m, and 0–2 m scales, respectively, but were randomly distributed at other scales. Under the complete spatial randomness (CSR) null model, the six dominant shrub species tended to shift from aggregated at small scales to random at large scales (Figure 2 and Figure 3). When the HP model was used as the null hypothesis, the distributions of Camellia fraterna, Symplocos anomala, and Eurya rubiginosa var. attenuata were aggregated at 0–5 m, 0–6 m, and 0–7 m scales, respectively, but random at other scales. The distribution of Rhododendron ovatum was aggregated at 0–6.5 m scales, weakly uniform at 20–24 m scales, and random at other scales. Symplocos anomala was aggregated at 0–5 m scales and randomly distributed at other scales. Loropetalum chinense was aggregated at 0–4 m scales and randomly distributed at other scales (Figure 4).

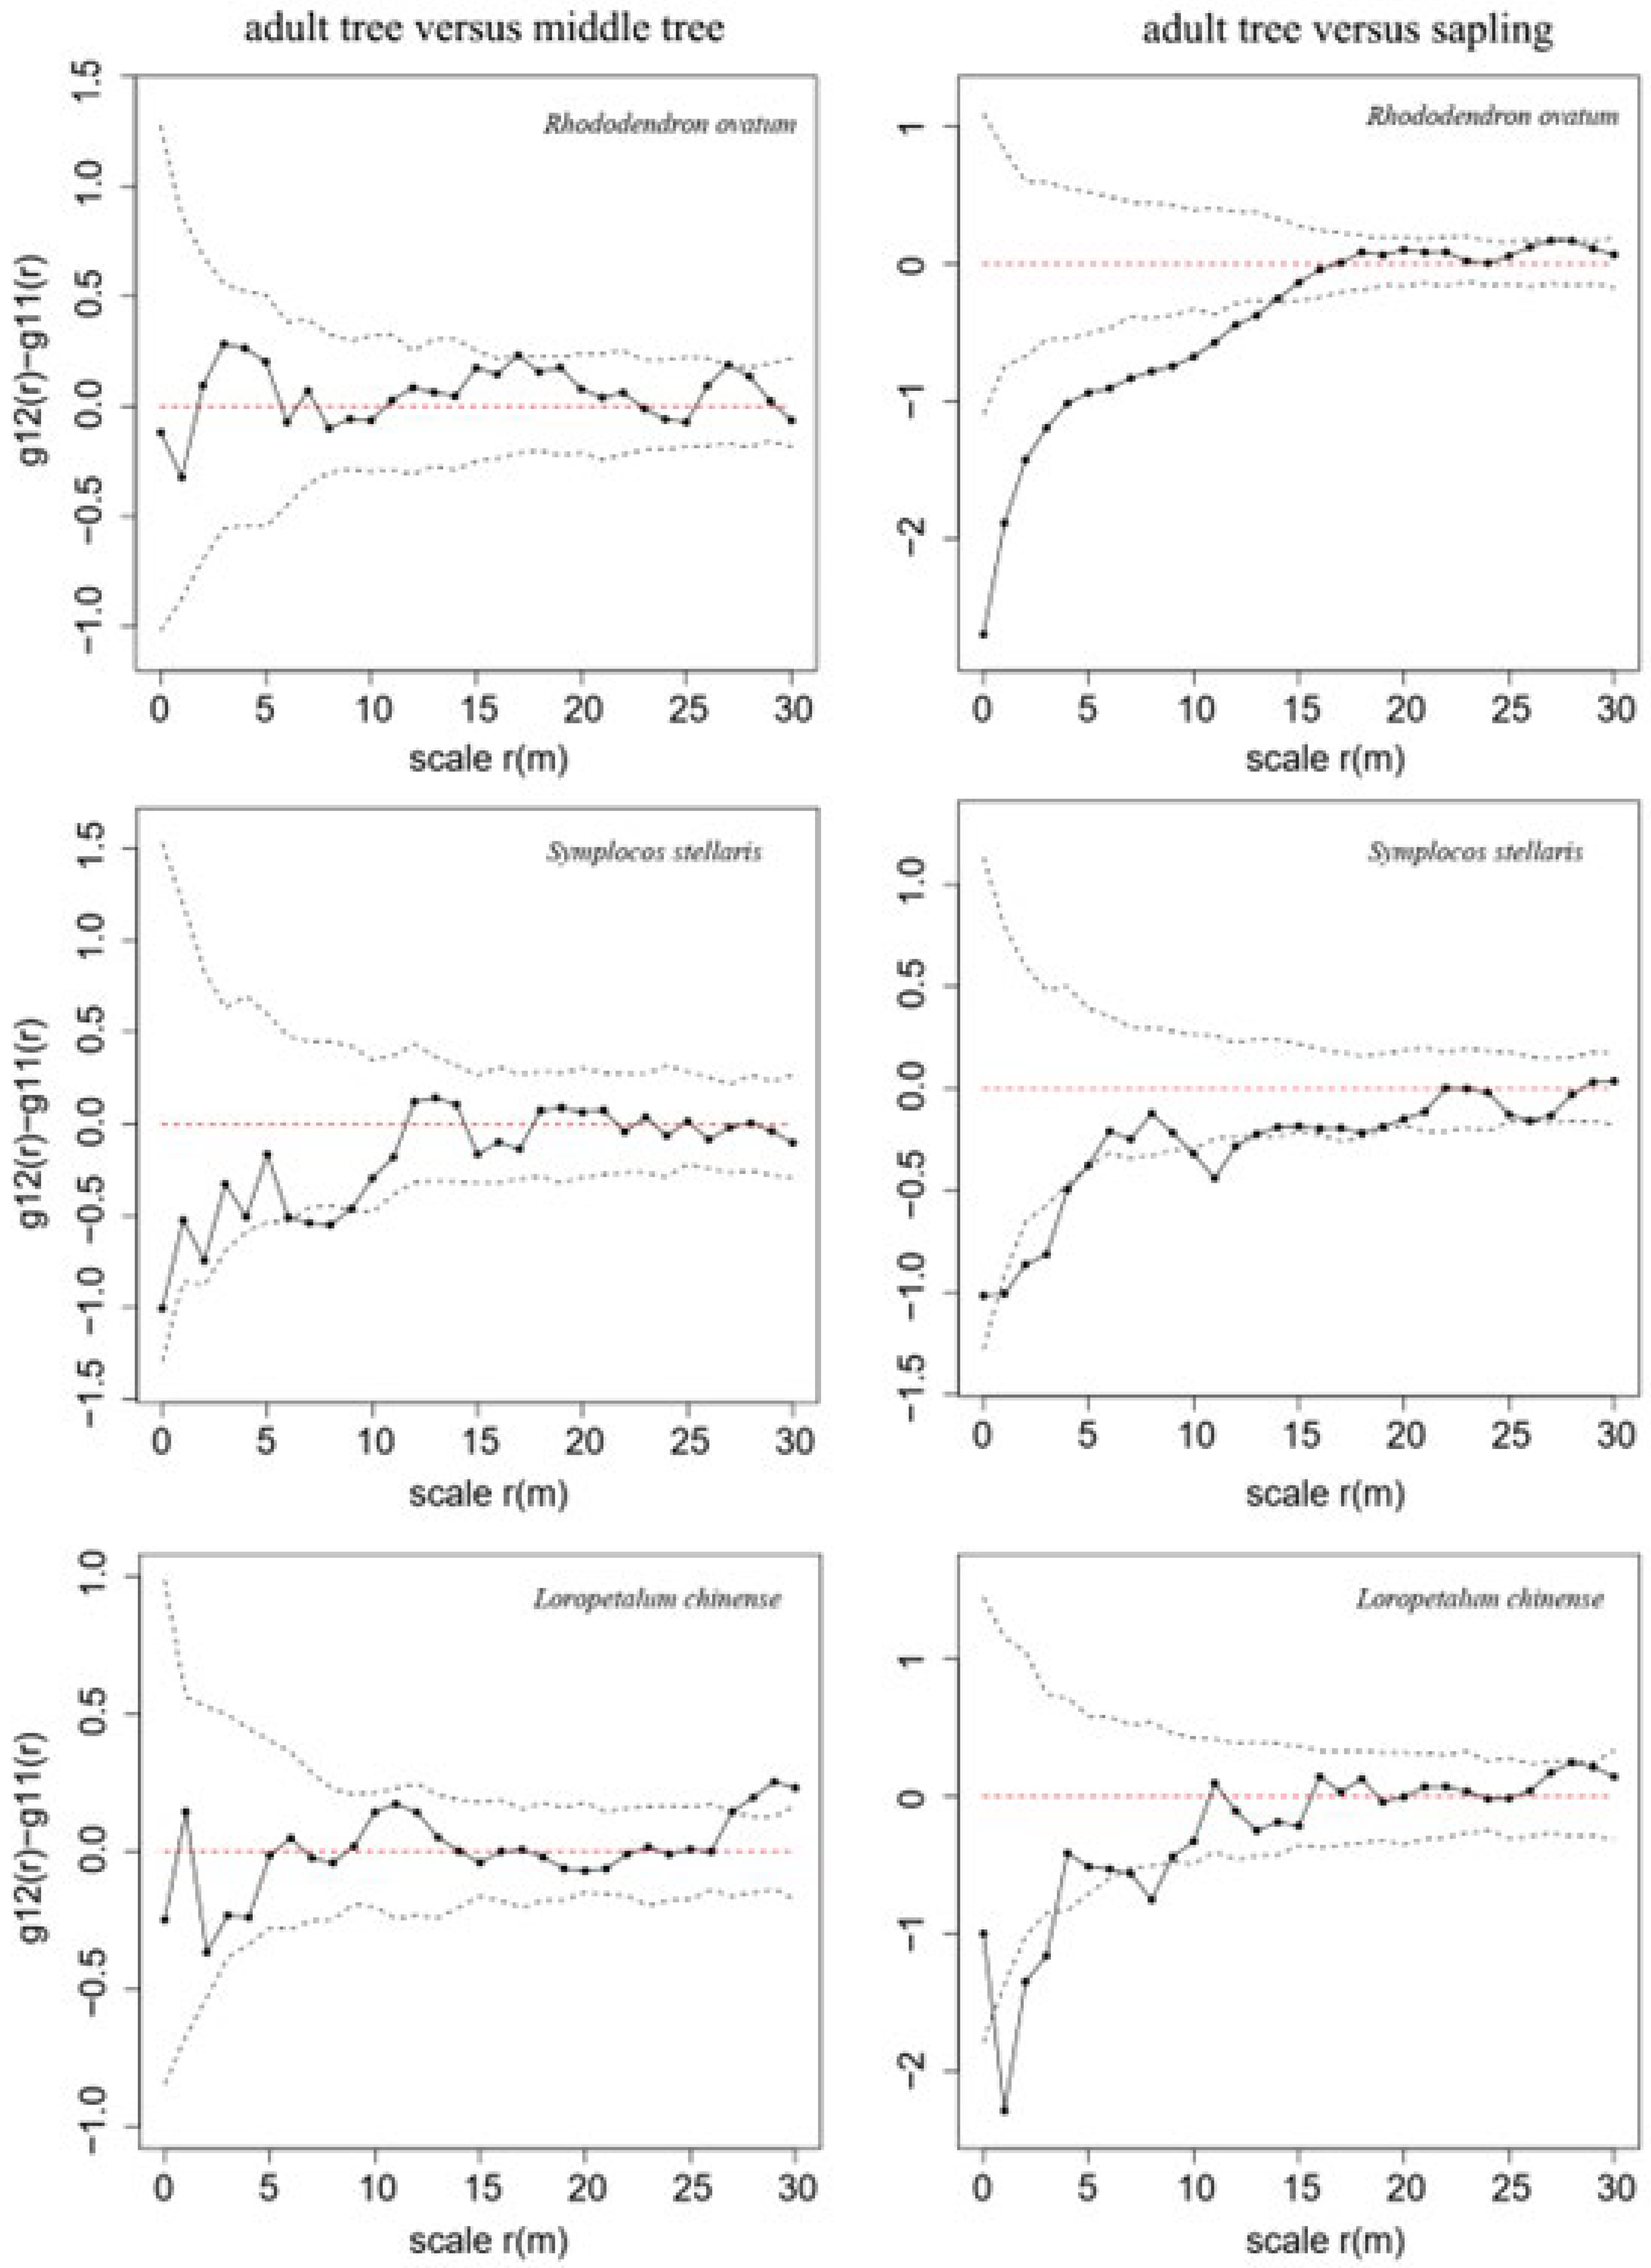
3.2. NDD Effects in a Secondary Evergreen Broad-Leaved Forest

Distributions were affected by plant age as well as habitat heterogeneity. Juvenile individuals of Schima superba were more aggregated at 0–17 m scales compared with adult trees but showed random distributions at other scales. Juvenile Cyclobalanopsis glauca were also aggregated compared to adult individuals at 0–1.9 m scales and randomly distributed at other scales. There were no age-structured trends in Osmanthus cooperi. Schima superba saplings were more aggregated than adults at 0–18 m and 22.5–27 m scales and randomly distributed at other scales. Similarly, saplings of Cyclobalanopsis glauca were more aggregated than adults at 0–6.9 m and 11.7–14 m scales and randomly distributed at other scales. There were no additional age-structured patterns in Osmanthus cooperi at any scale.
We also found age-structured spatial distributions in dominant shrub species (Figure 5 and Figure 6). The distribution of Camellia fraterna juveniles was more uniform than adults at small scales but random at most scales. Comparisons between adult and juvenile Symplocos anomala found mostly random distributions, but slightly higher aggregation in juveniles on a few scales. We found greater aggregation in juveniles of Eurya rubiginosa var. attenuata relative to adults at most scales (1–30 m). Rhododendron ovatum juveniles were randomly distributed at all scales, and Symplocos stellaris juveniles were more aggregated than adults only at 6–9 m scales. Loropetalum chinense juveniles were more uniform than adults at 27–30 m scales and randomly distributed at other scales.
Comparisons between saplings and adults of Camellia fraterna revealed greater sapling aggregation at 0–3.5 m scales, greater uniformity on some intermediate scales, but generally, randomness at most scales. In Symplocos anomala, saplings were more aggregated than adults on most scales, and only randomly distributed at the 20 m scale. Similarly, Eurya rubiginosa var. attenuate saplings were more aggregated than adults at 0–25 m scales but otherwise random. Rhododendron ovatum saplings were more aggregated than adults at 0–14 m scales and randomly distributed at other scales. Saplings of Symplocos stellaris were also more aggregated than adults at 0.9–5 m and 9.9–12.9 m scales, but more uniform at other scales. Saplings of Loropetalum chinense showed greater aggregation than adults at 0.5–3.4 m and 7–8.9 m scales, and random distributions at other scales (Figure 7).

4. Discussion

4.1. The NDD Hypothesis Explains Spatial Distributions of Woody Species in a Secondary Evergreen Broad-Leaved Forest

Habitat heterogeneity has large effects on species’ spatial distributions, but NDD has been found to further regulate population structure after controlling for habitat heterogeneity [4,12]. Early studies of NDD focused on tropical forests [6,7]; for example, Wills et al. [6] found that most tree species in Panama (79.8%) were affected by NDD. This research has been gradually extended to subtropical [4,5,7] and temperate forests [22,23]. In subtropical forests, Zhu et al. [4] found a similar proportion of tree species affected by NDD (83.0%), as did Lambers et al. [23] in temperate deciduous forests. However, in Pinus koraiensis of Changbaishan broad-leaved forests, Kuang et al. [12] and Piao et al. [24] found that only a few species were affected by NDD. In this study, we used ecological simulations to control for the potential effects of habitat heterogeneity, and spatial univariate point pattern analyses to quantify the effects of NDD on the spatial distributions of multiple tree and shrub species at different life history stages. Our results showed that all nine common, dominant tree and shrub species were affected by NDD, at least at some scales. This high proportion may be due to the secondary relative to satisfy the sample size of tree species in evergreen broad-leaved forests, late-succession less tropical or subtropical forests, and secondary evergreen broad-leaved forest in the community succession stage being less stable [17]. The NDD hypothesis has been a useful framework for understanding forests at different succession stages and in the regulation of species’ coexistence [12,22]. Our study verified that NDD is not a unique effect of tropical forests but also plays a key role in governing species’ coexistence in communities during secondary succession [25].
The effects of NDD on species abundance have become a popular topic in forest ecology research [3,26]. Previous studies have found negative correlations between NDD and species abundance [26]; specifically, the maximum intensity (Dmax) of NDD was stronger for tree species with low species abundance than for tree species with high species abundance. In addition, it was observed that the maximum intensity (Gmax) of conspecific aggregation was greater for tree species with low species abundance than for tree species with high species abundance [26], consistent with Zhu et al. [4]. In our study of dominant woody species of Wuchaoshan National Forest Park, NDD affected all species to varying degrees, similar to the findings of Zhu [12]. Our findings also demonstrate that the NDD hypothesis is a useful framework for understanding species’ coexistence in suburban subtropical evergreen broad-leaved forests [25]. The magnitude of NDD in our experimental plot tended to decrease with increasing age class, which is consistent with hypothesized demographic changes caused by specialized pathogens and herbivores described in the NDD hypothesis [13,14].
The NDD hypothesis is a useful framework for understanding dominant species’ populations, but other factors also substantially influence species’ spatial distributions, such as life history stage. For example, saplings of Eurya rubiginosa var. attenuata were more strongly spatially aggregated compared with adult trees at most scales, while NDD was mostly scale-free in other species, such as Osmanthus cooperi. Luo et al. [4] noted that, in Baishanzu subtropical evergreen broad-leaved forests, NDD played a more limited role in maintaining species diversity than habitat filtration and diffusion restriction. We hope to expand our study of NDD in the secondary evergreen broad-leaved forest in Wuchaoshan to all common species, assess the universality of the results presented here, and further dissect the ecological mechanisms responsible for community composition and spatial distribution [27].

4.2. Habitat Heterogeneity Strongly Affects Population Spatial Distribution

In the evergreen broad-leaved forest of our Wuchaoshan National Forest Park experimental plot, we found that species had aggregated spatial distributions under a complete spatial randomness (CSR) null model. However, after controlling for habitat heterogeneity by using a heterogeneous Poisson process (HP) null model, we generally observed spatial aggregation at small scales but random distributions at large scales, suggesting that habitat heterogeneity strongly affected the spatial distribution of dominant tree and shrub species. Lin et al. [28] also found that habitat heterogeneity, in addition to seed dispersal limitation, was the main factor affecting tree spatial distribution. This may be because the dominant tree and shrub species in Wuchaoshan were spatially aggregated at small scales. Small and young individuals may be more susceptible to interspecific competition [23,29], which explains why aggregation decreases amongst old, larger individuals, which tended to be randomly distributed.
Removing the effects of habitat heterogeneity helps us to assess the relative importance of negative density dependence (NDD) in regulating population structure [30,31]. For example, at large spatial scales, as diameter class size increases, the decrease in aggregation may be caused by unfavourable habitat or NDD, while at small scales, favourable habitat may increase aggregation, thereby counterbalancing the decrease in conspecific trees caused by NDD [31]. Zhu et al. [12] used the spatial pattern of mature trees to control for the possible large spatial scale habitat heterogeneity and found that the proportion of tree species showing NDD was higher at small scales. Without considering habitat heterogeneity, there was no difference between the proportion of tree or shrub species showing NDD at small and large scales; however, the distribution of mature trees and shrubs showed strong large-scale heterogeneity. To detect the effects of NDD on dominant species within our experimental plot, it was necessary to first consider the effects of habitat heterogeneity [27].

5. Conclusions

In this study, we analysed the spatial distributions of nine dominant woody species of the evergreen broad-leaved forest of Wuchaoshan National Forest Park in the context of the negative density dependence (NDD) hypothesis. We found that by controlling for habitat heterogeneity, we could assess the strength and spatial scale of NDD as a mechanism regulating the population structure of temperate forest tree species. The saplings could be more random than adults, but both adults and saplings may still be aggregated (but to different degrees). We found that the intensity of NDD was positively correlated with the maximum intensity of conspecific aggregation of subforest and shrub species. This study provides empirical support for the NDD hypothesis in temperate forests and holds great significance for community structure construction and sustainable management of secondary forests in China.

Author Contributions

J.J. and L.Y. designed this study and improved the English language and grammatical editing. L.Y. wrote the first draft of the manuscript and performed the data analysis. Z.W., J.Z., S.Y. and T.L. conducted the fieldwork. B.J., W.Y. and C.W. gave guidance and methodological advice. All the co-authors contributed to the discussion, revision, and improvement of the manuscript. All authors have read and agreed to the published version of the manuscript.

Funding

This research was financially supported by “Pioneer” and “Leading Goose” R&D Program of Zhejiang (2022C02053); Zhejiang Provincial Scientific Research Institute special project (2022F1068-2); the Major Collaborative Project between Zhejiang Province and the Chinese Academy of Forestry (2019SY08) and the Major Collaborative Project between Zhejiang Province and the Chinese Academy of Forestry (2021SY08).

Institutional Review Board Statement

Not applicable.

Informed Consent Statement

Not applicable.

Data Availability Statement

The data presented in this study are available in the article.

Acknowledgments

We would like to thank Gilman lan for assistance with English language editing of this manuscript.

Conflicts of Interest

This is the first submission of this manuscript, and no parts of this manuscript are being considered for publication elsewhere. All authors have read and approved the content of the manuscript. No financial, contractual, or other interest conflicts exist for the study.

References

  1. Sterner, R.W.; Ribic, C.A.; Schatz, G.E. Testing for Life Historical Changes in Spatial Patterns of Four Tropical Tree Species. J. Ecol. 1986, 74, 621. [Google Scholar] [CrossRef]
  2. Barot, S.; Gignoux, J.; Menaut, J.C. Demography of a Savanna Palm Tree: Predictions from Comprehensive Spatial Pattern Analyses. Ecology 1999, 80, 1987–2005. [Google Scholar] [CrossRef]
  3. Carson, W.P.; Anderson, J.T.; Leigh, J.E.G.; Schnitzer, S.A. Challenges Associated with Testing and Falsifying the Janzen-Connell Hypothesis: A Review and Critique. 2008, pp. 210–241. Available online: https://www.scienceopen.com/document?vid=2157da60-b422-4670-b88c-4c07d59f7d1a (accessed on 12 July 2022).
  4. Luo, Z.; Mi, X.; Chen, X.; Ye, Z.; Ding, B. Density Dependence Is Not Very Prevalent in a Heterogeneous Subtropical Forest. Oikos 2012, 121, 1239–1250. [Google Scholar] [CrossRef]
  5. Zang, L.; Xu, H.; Li, Y.; Zang, R. Conspecific Negative Density Dependence of Trees Varies with Plant Functional Traits and Environmental Conditions across Scales in a 60-ha Tropical Rainforest Dynamics Plot. Biotropica 2021, 53, 693–702. [Google Scholar] [CrossRef]
  6. Wills, C.; Condit, R.; Foster, R.B.; Hubbell, S.P. Strong Density- and Diversity-Related Effects Help to Maintain Tree Species Diversity in a Neotropical Forest. Proc. Natl. Acad. Sci. USA 1997, 94, 1252–1257. [Google Scholar] [CrossRef] [Green Version]
  7. Connell, J.H.; Tracey, J.G.; Webb, L.J. Compensatory Recruitment, Growth, and Mortality as Factors Maintaining Rain Forest Tree Diversity. Ecol. Monogr. 1984, 54, 141–164. [Google Scholar] [CrossRef]
  8. Peters, H.A. Neighbour-Regulated Mortality: The Influence of Positive and Negative Density Dependence on Tree Populations in Species-Rich Tropical Forests. Ecol. Lett. 2003, 6, 757–765. [Google Scholar] [CrossRef] [Green Version]
  9. Yao, L.; Xu, Y.; Jiang, B.; Wu, C.; Yuan, W.; Zhu, J.; Li, T.; Wang, Z. Competition Restricts the Growth, Development, and Propagation of Carpinus Tientaiensis: A Rare and Endangered Species in China. Forests 2021, 12, 503. [Google Scholar] [CrossRef]
  10. Condit, R.; Ashton, P.S.; Baker, P.; Bunyavejchewin, S.; Gunatilleke, S.; Gunatilleke, N.; Hubbell, S.P.; Foster, R.B.; Itoh, A.; LaFrankie, J.V.; et al. Spatial Patterns in the Distribution of Tropical Tree Species. Science 2020, 288, 1414–1418. [Google Scholar] [CrossRef] [PubMed]
  11. Getzin, S.; Wiegand, T.; Wiegand, K.; He, F. Heterogeneity Influences Spatial Patterns and Demographics in Forest Stands. J. Ecol. 2008, 96, 807–820. [Google Scholar] [CrossRef]
  12. Zhu, Y.; Comita, L.S.; Hubbell, S.P.; Ma, K. Conspecific and Phylogenetic Density-Dependent Survival Differs across Life Stages in a Tropical Forest. J. Ecol. 2015, 103, 957–966. [Google Scholar] [CrossRef]
  13. Janzen, D.H. Herbivores and the Number of Tree Species in Tropical Forests. Am. Nat. 1970, 104, 501–528. [Google Scholar] [CrossRef]
  14. Connell, J.H. On the Role of Natural Enemies in Preventing Competitive Exclusion in Some Marine Animals and in Rain Forest Trees. Dyn. Popul. 1971, 298, 312. [Google Scholar]
  15. Wiegand, T.; Moloney, K.A. Rings, Circles, and Null-Models for Point Pattern Analysis in Ecology. Oikos 2004, 104, 209–229. [Google Scholar] [CrossRef]
  16. Liu, H.; Johnson, D.J.; Yang, Q.; Xu, M.; Ma, Z.; Fang, X.; Shang, Y.; Wang, X. The Dynamics of Conspecific Tree and Seedling Neighbors on Seedling Survival in a Subtropical Forest. For. Ecol. Manag. 2021, 483, 118924. [Google Scholar] [CrossRef]
  17. Yao, L.; Wang, Z.; Zhan, X.; Wu, W.; Jiang, B.; Jiao, J.; Yuan, W.; Zhu, J.; Ding, Y.; Li, T.; et al. Assessment of Species Composition and Community Structure of the Suburban Forest in Hangzhou, Eastern China. Sustainability 2022, 14, 4304. [Google Scholar] [CrossRef]
  18. Ripley, B.D. Modelling Spatial Patterns. J. R. Stat. Soc. Ser. B 1977, 39, 172–192. [Google Scholar] [CrossRef]
  19. MacKay, D.B.; Ripley, B.D. Spatial Statistics. J. Mark. Res. 1982, 19, 279. [Google Scholar] [CrossRef]
  20. Howroyd, J.D.; Stoyan, D.; Stoyan, H. Fractals, Random Shapes and Point Fields: Methods of Geometrical Statistics. Biometrics 1996, 52, 377. [Google Scholar] [CrossRef]
  21. R Foundation for Statistical Computing. R: A Language and Environment for Statistical Computing; R Foundation for Statistical Computing: Vienna, Austria, 2016. [Google Scholar]
  22. Liu, P.; Wang, W.; Bai, Z.; Guo, Z.; Ren, W.; Huang, J.; Xu, Y.; Yao, J.; Ding, Y.; Zang, R. Competition and Facilitation Co-Regulate the Spatial Patterns of Boreal Tree Species in Kanas of Xinjiang, Northwest China. For. Ecol. Manag. 2020, 467, 118167. [Google Scholar] [CrossRef]
  23. Hille Ris Lambers, J.; Clark, J.S.; Beckage, B. Density-Dependent Mortality and the Latitudinal Gradient in Species Diversity. Nature 2002, 417, 732–735. [Google Scholar] [CrossRef] [PubMed]
  24. Piao, T.; Comita, L.S.; Jin, G.; Kim, J.H. Density Dependence across Multiple Life Stages in a Temperate Old-Growth Forest of Northeast China. Oecologia 2013, 172, 207–217. [Google Scholar] [CrossRef] [PubMed] [Green Version]
  25. Du, Y.; Queenborough, S.A.; Chen, L.; Wang, Y.; Mi, X.; Ma, K.; Comita, L.S. Intraspecific and Phylogenetic Density-Dependent Seedling Recruitment in a Subtropical Evergreen Forest. Oecologia 2017, 184, 193–203. [Google Scholar] [CrossRef] [PubMed]
  26. Xu, M.; Wang, Y.; Yu, S. Conspecific Negative Density Dependence Decreases with Increasing Species Abundance. Ecosphere 2015, 6, art257. [Google Scholar] [CrossRef]
  27. LaManna, J.A.; Walton, M.L.; Turner, B.L.; Myers, J.A. Negative Density Dependence Is Stronger in Resource-rich Environments and Diversifies Communities When Stronger for Common but Not Rare Species. Ecol. Lett. 2016, 19, 657–667. [Google Scholar] [CrossRef] [PubMed]
  28. Lin, Y.-C.; Chang, L.-W.; Yang, K.-C.; Wang, H.-H.; Sun, I.-F. Point Patterns of Tree Distribution Determined by Habitat Heterogeneity and Dispersal Limitation. Oecologia 2011, 165, 175–184. [Google Scholar] [CrossRef] [PubMed]
  29. Foster, J.R.; Finley, A.O.; D’Amato, A.W.; Bradford, J.B.; Banerjee, S. Predicting Tree Biomass Growth in the Temperate–Boreal Ecotone: Is Tree Size, Age, Competition, or Climate Response Most Important? Glob. Change Biol. 2016, 22, 2138–2151. [Google Scholar] [CrossRef]
  30. Magee, L.; Wolf, A.; Howe, R.; Schubbe, J.; Hagenow, K.; Turner, B. Density Dependence and Habitat Heterogeneity Regulate Seedling Survival in a North American Temperate Forest. For. Ecol. Manag. 2021, 480, 118722. [Google Scholar] [CrossRef]
  31. Wright, J.S. Plant Diversity in Tropical Forests: A Review of Mechanisms of Species Coexistence. Oecologia 2002, 130, 1–14. [Google Scholar] [CrossRef] [PubMed]
Figure 1. Location and topographic map of the forest dynamic monitoring plot in Wuchaoshan National Forest Park reprinted/adapted with permission from Ref. [17]. 2022, Liangjin Yao.
Forests 13 01227 g001
Figure 2. Spatial distribution scatters diagram and univariate point pattern analyses of Schima superba, Cyclobalanopsis glauca, and Osmanthus cooperi. Note: Black lines indicate the g11(r) function, and dotted lines indicate the upper and lower limits of the 99% confidence interval. Observed values above the upper limits indicate aggregation, within the intervals indicate random distributions, and below the lower limits indicate a regular/hyperdispersed pattern. The same is below.
Forests 13 01227 g002
Figure 3. Spatial distribution scatter diagram and univariate point pattern analyses of Camellia fraterna, Symplocos anomala, and Eurya rubiginosa var. attenuata.
Forests 13 01227 g003
Figure 4. Spatial distribution scatter diagram and univariate point pattern analyses of Rhododendron ovatum, Symplocos stellaris, and Loropetalum chinense.
Forests 13 01227 g004
Figure 5. Juvenile–adult (left) and sapling–adult (right) comparative analyses of Schima superba, Cyclobalanopsis glauca, and Osmanthus cooperi with random labelling case–control design.
Forests 13 01227 g005
Figure 6. Juvenile–adult (left) and sapling–adult (right) association analyses of Camellia fraterna, Symplocos anomala, and Eurya rubiginosa var. attenuata with a random labelling case–control design.
Forests 13 01227 g006
Figure 7. Juvenile–adult (left) and sapling–adult (right) comparative analyses of Rhododendron ovatum, Symplocos stellaris, and Loropetalum chinense with a random labelling case–control design.
Forests 13 01227 g007
Publisher’s Note: MDPI stays neutral with regard to jurisdictional claims in published maps and institutional affiliations.

