Article

Evidence of a Climate-Change-Induced Shift in European Beech Distribution: An Unequal Response in the Elevation, Temperature and Precipitation Gradients

Department of Forestry and Renewable Forest Resources, Biotechnical Faculty, University of Ljubljana, Jamnikarjeva 101, 1000 Ljubljana, Slovenia
*
Author to whom correspondence should be addressed.
Forests 2022, 13(8), 1311; https://doi.org/10.3390/f13081311
Submission received: 29 June 2022 / Revised: 12 August 2022 / Accepted: 15 August 2022 / Published: 17 August 2022
(This article belongs to the Special Issue Climate Change Effect on Mixed-Species Forest Management)

Abstract

:
Climate is a strong predictor of the geographic distribution of tree species, and thus climate change may trigger shifts in the distribution of a tree species and/or its demographic structure. In the study, we aim to comprehensively compare the distributions of four life stages of European beech (Fagus sylvatica) (i.e., regeneration, recruitment, young trees and mature trees) in forests in Slovenia, Central Europe, which are characterized by strong gradients of elevation (ELV), temperature (TEMP) and precipitation (PREC) to detect possible shifts in distribution and demography. Beech life stages were surveyed on 3366 plots. To depict disparities between ELV, TEMP and PREC distributions of beech life stages, we applied several non-parametric methods: basic statistical tests to study differences in medians, means, and 1st and 9th deciles; generalized additive models to study shifts in the optimum; and extreme value analysis to study shifts at the trailing and leading edges. A substantial shift in juvenile beech stages upward and toward colder sites was detected. However, the shift was not uniform along the distributions; the most significant shift was detected at the leading edge of ELV (+73 m) and TEMP (−2.6 °C), but surprisingly there was no beech movement identified at the trailing edge. The observed shift may be a result of the interplay between climate change, high spatial variability in microclimate, unexceptional droughts in the recent past, changes in forest use and possible limitations in the migration ability of beech and its adaptation capacity.

1. Introduction

Climate is a strong predictor of the geographic distribution of tree species [1], impacting regeneration and recruitment patterns, growth and mortality [2,3]. Thus, climate change may considerably alter the spatial distribution of tree species [4,5,6] and the demographic structure of their populations [7,8,9,10], which may cause the alteration of the species composition of forest vegetation [4,11]. It may also alter the growth rate and growth patterns [12,13] or tree species phenology [14]. All these changes in tree species populations are more distinct in areas subjected to intense changes in long-term climate [15].
Given that global climate change is well under way [16,17] and that several modeling projections based on bioclimatic scenarios predict serious changes in species spatial distributions [18,19], the impact of climate change should already be reflected in changes in species distribution and/or the demographic structure of tree species populations. Changes in species spatial distribution polewards or upwards have most often been reported [10,20,21,22,23,24], but downward shifts have also been observed for certain tree species [7,8,10]. Renwick and Rocca [25] reported that only about half of the tree species analyzed show evidence of elevational range shifts.
Studies on shifts along different climate parameter gradients are quite rare [24,26]. Both temperature and precipitation are closely related to elevation (and latitude). Thus, the reported species shifts along their gradients were similar to the elevational shifts observed. As with elevational shifts, shifts along the temperature gradient, for example, were also observed to happen into both directions, towards colder and warmer conditions [24].
Climate change may not only affect the spatial distribution of a tree species, but also its abundance within the distribution range. However, evidence for the latter is scarce [9,27]. Changes in demographic structure can be assessed based on the distribution of the life stages of tree species. Tree development experiences several successional life stages, namely seedling, sapling, young tree, adult tree and mature tree. Juvenile life stages reflect the current and most recent environmental (climate) conditions that influence tree growth, while adult and mature trees reflect environmental growth conditions that took place several decades, and in many cases over a century, ago. Comparing the observed distributions of a particular environmental (climate) parameter for the juvenile and adult life stages of the same tree species in a large forest area may reveal early signals in the shifting of tree species distribution [7,28]. Differences in the presence or relative abundance of life stages may indicate the movement of the species optimum or even of the entire distribution range. Moreover, if the distribution edges are observed, a declining relative abundance of regeneration compared to (adult and mature) trees may reflect a potential spatial contraction of a species distribution range, while an increasing relative abundance may indicate its potential expansion [28].
When examining such early signals, it is therefore important to focus on the entire distribution of tree species along the gradient of the observed environmental parameter (i.e., elevation, latitude, long-term mean temperature and long-term mean annual precipitation) [7]. The crucial fingerprints of climate change are mostly associated with changes at the species distribution margins (i.e., the trailing and leading edges) [23,24]; however, recognizing changes in the species optimum (i.e., maximum occurrence probability and maximum abundance) is also essential. Focusing on the extremes may detect changes at only one point or within the truncated and narrow observation window of the observed environmental gradient, while possible changes elsewhere along the entire distribution may be overlooked [7]. Thus, only a comprehensive analysis encompassing the entire distribution with all of its crucial parts can reliably detect signals of tree species shift along elevation or climate gradients.
European beech (Fagus sylvatica L., hereafter beech) is widely distributed across Europe [29], but its potential distribution range is even much larger [30]. In Central and Southeastern Europe, beech can be found in an altitudinal gradient of less than 100 m to approximately 1700 m a.s.l., in areas with mean annual temperature of at least 4.5 °C and mean annual precipitation of more than 600 mm [31,32]. In this part of Europe, there is a low risk of human interference in its distribution through artificial regeneration owing to the early introduction of close-to-nature silviculture in the area [33]. Here, beech was considered as an important site-adapted tree species and thus tolerated or often even promoted in the past. However, as in many parts of Europe, Picea abies was promoted in many beech sites [34]; thus, there is still a possible risk of a narrowed distribution of beech in this area as well because of its suppression due to the introduction of Picea abies.
In general, beech is considered as a highly plastic and adaptable tree species and is quite drought sensitive closer to its xeric distribution limits [35]. More frequent droughts in recent decades due to higher growing season temperatures and reduced summer precipitation [17] may have impacted beech more than has been recently assumed [36,37]. It is likely that beech will be impacted to an even greater extent since drought events are predicted to be of even higher frequency and severity in the near future [16,38]. Accordingly, beech seems an appropriate Central-European tree species to study a possible climate-change-induced shift in tree species distribution.
Although beech shifting along different gradients has been studied across Europe [7,8,12,20,39], such a study has never been conducted in an area where many different (i.e., continental, sub-Mediterranean and alpine) climates intersect in a relatively small area and where beech is the dominant species in the natural and current tree species composition of forest stands [31]. In addition, the reviewed studies only considered a shift along elevation, but not along other environmental gradients. Thus, the objective of our study is to compare the distributions of four life stages of beech, namely regeneration, recruitment, young (thin) trees and mature (large-sized) trees, in forests in Slovenia, Central Europe, which are characterized by strong gradients of elevation, temperature and precipitation to detect possible shifts due to climate change. While most previous studies have focused on changes in the optimum [7,8,10] or at the margins of a tree species distribution along the observed environmental gradient [40], we aim to comprehensively study the entire distributions of the life stages of beech, focusing on both the optimum and the leading and trailing edges. We hypothesized that, due to climate change, the optimum, the leading edge and especially the trailing edge of the distribution of the juvenile (regeneration) and middle-age (recruitment, young trees) life stages of beech have shifted to higher elevations and to colder and moister sites (considering the same long-term average for a site) compared to the distribution of mature beech trees.

2. Materials and Methods
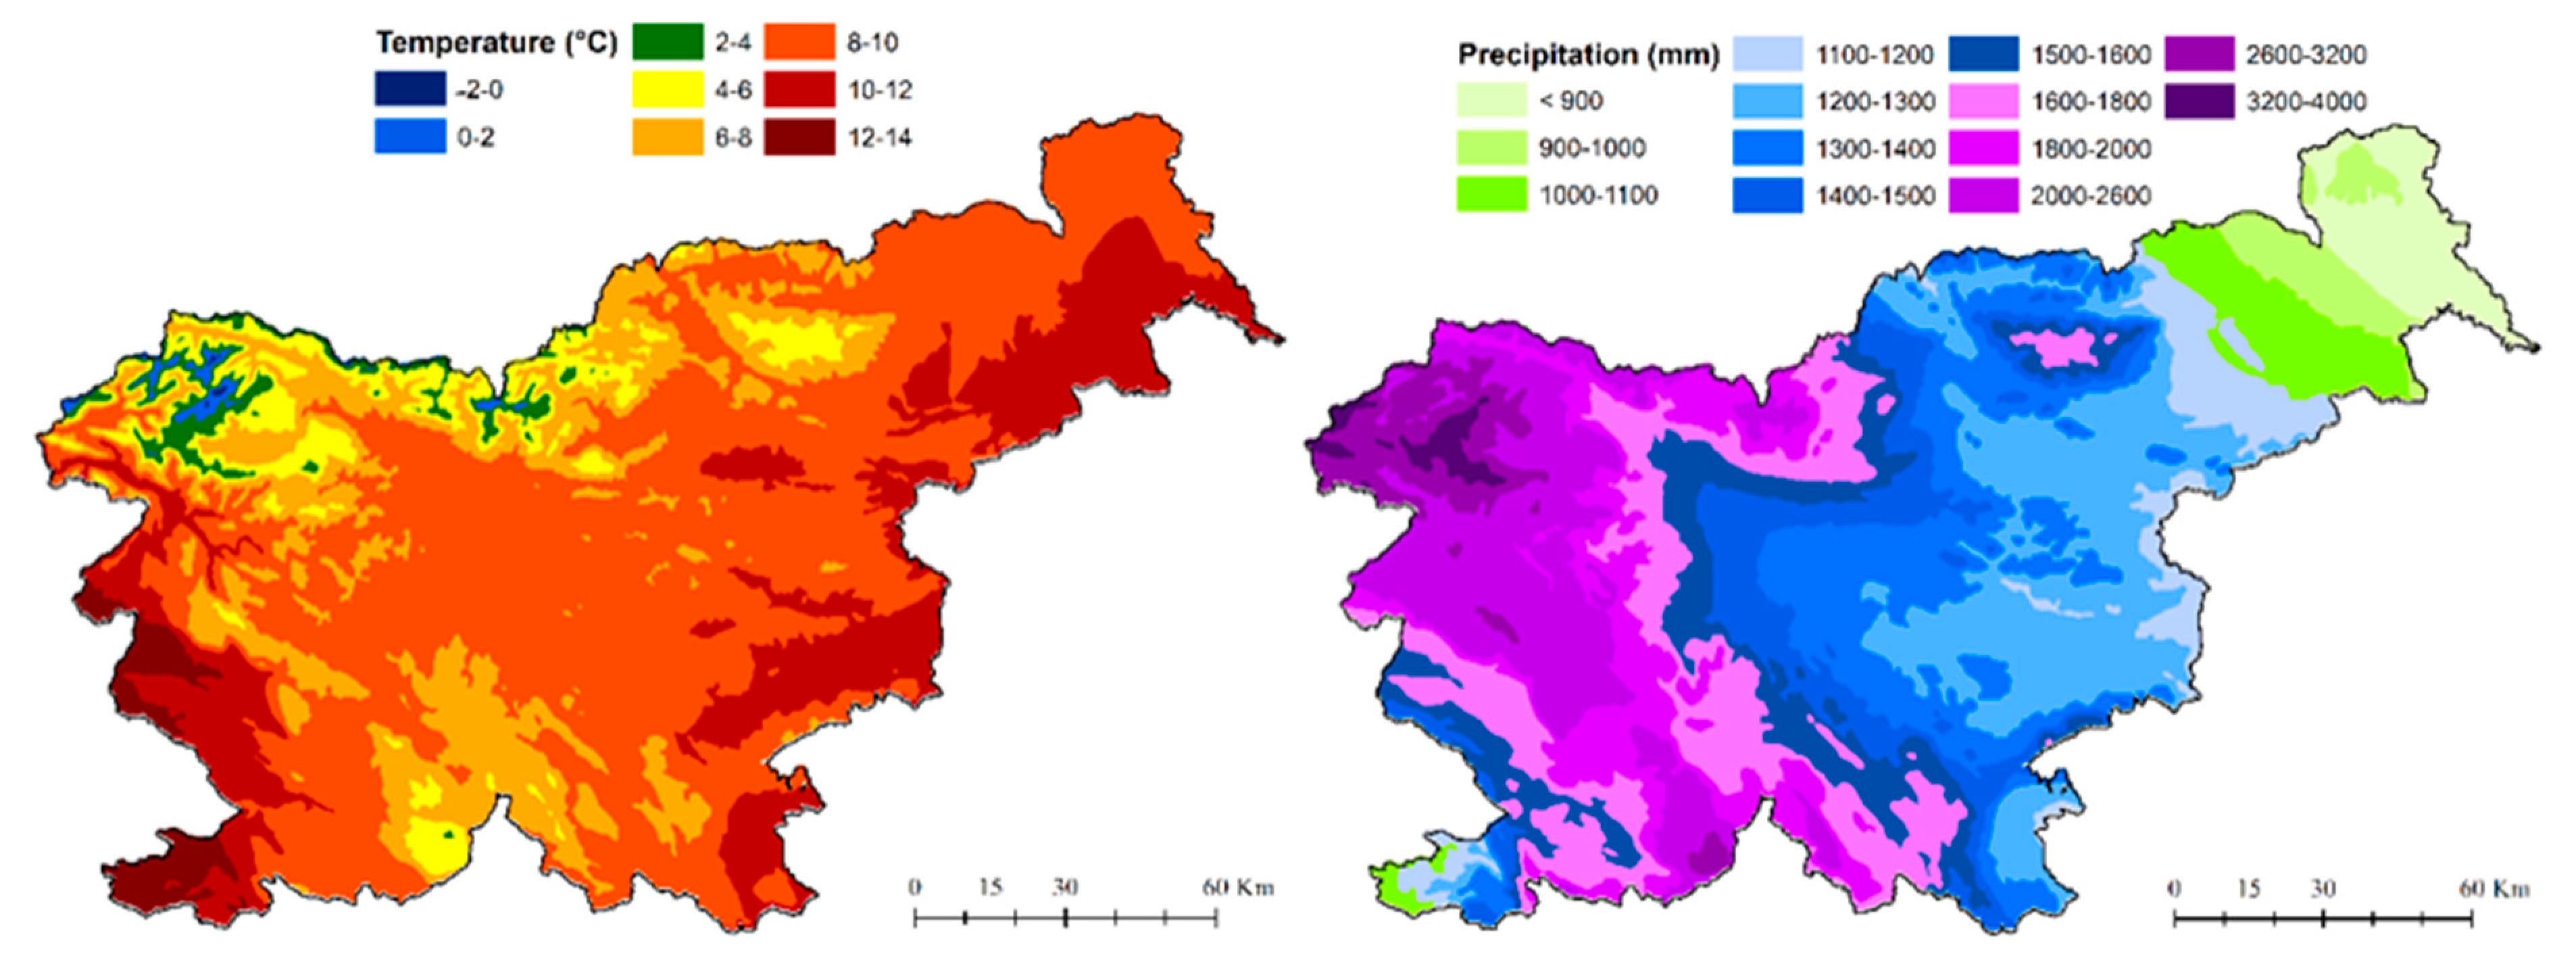
2.1. Study Area

Slovenia lies at the crossroads of the Alps, the sub-Mediterranean area, the Dinaric Mountains and the lowlands of the Pannonian basin, with the majority of its area (20,271 km2) characterized by hilly topography. Accordingly, within this small (forest) area, sub-Mediterranean, oceanic, continental and alpine climates intersect. Both characteristics create significant elevation and climate gradients within the study area, enabling research on species shifts. Forests cover as much as 59% of the entire area. The elevation ranges from 0 to 2864 m a.s.l., while the majority of forests lie between 200 and 1000 m, but can be found up to 2000 m a.s.l. [31]. European beech is present on 89% of the forest area in Slovenia (Figure 1). On almost 60% of this area, beech represents >25% of the growing stock, while it is the dominant species (>50% of growing stock) on 28% of the forest area [41]. Beech can be found in forests in an elevation range of several 10 m a.s.l. up to 1600 m a.s.l., and even higher in certain (rather small) areas.

2.2. Data

2.2.1. Successional Life Stages

Considering the study objective to compare the distribution of the juvenile, middle-age and mature life stages of beech, we examined four successional life stages, namely regeneration, recruited young trees, young (thin) trees and mature (large-sized) trees. To distinguish between life stages, the age–size relationship was used. Regeneration was defined as seedlings and saplings 15–150 cm tall. Small seedlings < 15 cm tall and germination were excluded from the analyses since they are very sensitive to climate variations [7] as well as dependent on the regeneration strategy of other tree species [43]. Recruited young trees, hereafter named recruitment, were defined as young trees crossing the measurement threshold of 10 cm dbh during the last 10 y inventory period. Young thin trees were defined as trees with dbh < 10th percentile of all tallied trees with dbh ≥ 10 cm, and mature adult trees as trees with dbh > 75th percentile of all tallied trees with dbh ≥ 10 cm. For beech, the 10th and 75th percentiles amounted to 13 cm and 38 cm, respectively. Successional life stages as defined in this study enable the direct comparison of mature trees established far before the considered period of mean annual precipitation and temperature (>50 y ago), when temperatures were significantly lower and precipitation significantly higher than currently [38], young and recruited trees established approximately in the first half of the considered time period (20–50 y ago) and saplings established at the end of the considered time period (<10 y).
The study was performed using the forest inventory database of the Slovenia Forest Service [42]. It includes approximately 98,000 permanent sampling plots (PSP), each 500 m2, which are systematically located across the entire forest area of Slovenia (≈11,760 km2). On each PSP, trees of dbh ≥ 10 cm are surveyed every 10 years; approximately 10% of plots are surveyed each year. The first inventory of PSPs was performed in the period 1995–2004, and trees on each PSP have since been measured 2–3-times. Regeneration (i.e., seedlings and saplings) is inventoried only on a small sub-sample of PSPs in a separate inventory performed every 4 years, and all plots are surveyed within a year. The PSP sub-sample with data on regeneration consisted of 3366 randomly selected plots (Figure 1) for which we have data from the period 2005–2020. For these PSPs, data for all life stages of trees are available. Since all life stages were inventoried on the same plots or in their close vicinity, comparative analyses can be treated as unbiased due to spatial variation.

2.2.2. Environmental Data

For each PSP, elevation (ELV), mean annual temperature in the period 1961–2010 (TEMP) and mean annual precipitation in the period 1961–2010 (PREC) were compiled. Data on ELV were compiled from a 12.5 m digital relief model [44]. An ELV value for each PSP was depicted on its central position. The PSP database occupies a large ELV range of 10–1830 m a.s.l. In addition to the strong ELV gradient, the study area is also characterized by strong TEMP (1.5–13.5 °C) and PREC gradients (780–3800 mm) (Figure 2). Data on TEMP and PREC for each PSP were derived from GIS layers prepared by the Slovenian Environment Agency [45]. The basic TEMP and PREC GIS layers were derived from long-term observation data from 60 meteorological stations covering the entire country. The method of optimal spatial interpolation was applied to these data, which considers the relation of temperature or precipitation with altitude, but also takes into account the influence of microlocation through the selected surroundings [45]. When finalized, the raster GIS layers of TEMP and PREC with a spatial resolution of 100 m × 100 m were produced and used in our study. The NW-SE mountain barrier in the western part of the country causes a significant decline in annual precipitation in the SW–NE direction towards the interior and eastern part of the country. The mean annual temperature for the period 1961–2010, on the other hand, is more related to meso-relief and is generally higher in the lowlands of the eastern and southeastern sub-Pannonian and the southwestern sub-Mediterranean part of the country.

2.3. Statistical Analyses

To depict disparities between ELV, TEMP and PREC distributions of regeneration, recruitment, thin trees and mature trees, we applied a non-parametric approach with the presence/absence and abundance data of beech at each life stage. Across beech life stages, we compared the 1st, 5th and 9th deciles of the ELV, TEMP and PREC distributions [10]. Using this approach, an analysis of the overall range of distribution with strong assumptions on the median position is enabled and more robust indices of the distribution edges are provided [7]. Statistical differences in medians between life stages were tested with the non-parametric Mood’s median (MM) test [46]. If significant differences in medians were observed, the post hoc median’s pairwise comparison were additionally applied to detect pairwise differences between life stages. In addition to medians, we also compared the mean positions of the environmental distributions across life stages using the parametric ANOVA [47] with Tukey’s HSD test for post hoc pairwise comparisons. The comparison between medians and means of the ELV, TEMP and PREC distributions indicated their skewness—the larger the difference, the more skewed the distribution.
We modeled the presence/absence probability of beech life stages as a univariate function of ELV, TEMP and PREC using Generalized Additive Models (GAM) [48]. GAMs are a non-parametric extension of Generalized Linear Models in which smooth curves are fitted to the observed data using local smoothing functions (Equation (1)):
g ( E ( Y ) ) = β 0 + f 1 ( x 1 ) + f 2 ( x 2 ) + + f m ( x m ) ,
where Y is the response variable, x1, x2xm are the explanatory variables, f1, f2fm the local smoothing functions, and β0 the constant. GAMs are especially flexible in dealing with complex models and large datasets with no assumptions on the actual relationship between the response variable and explanatory variables [8]. Presence/absence data were used to acquire the probability models of each life stage occurrence along the gradient of a given predictor. We assumed a binomial distribution of the response variable and a logit link function. We assumed a beech life stage to be present on a plot if at least one individual was surveyed. For each life stage, three univariate GAM models were developed using ELV, TEMP and PREC as predictors. In addition, we similarly calculated the abundance models for beech life stages by assuming a Poisson distribution and a log link function. The models were computed using the R environment [49] and the mgcv R package [50]. GAM as a non-parametric method enables the comparison of the optimums of the distributions of the life stages of beech, which was defined as the predictor value at which the modeled probability distribution reaches the maximum [7,8].
Since major changes in the distribution of a tree species are expected to occur at its edges, e.g., [12,23], it is crucial to investigate the tails of the distribution along the gradient of the observed environmental variable. GAMs are less appropriate for such comparative analysis of distribution tails; therefore, we additionally applied Extreme Value Analysis (EVA) [51,52]. EVA is a statistical tool for estimating the occurrence probability of extreme values. It has a broad specter of application, from finance to engineering and environmental modeling [51]. It treats extremes as its own random variable and not just as an outlier in the overall data; most usually, extremes are defined as values larger than a given threshold [53]. Extremes, also called exceedances-over-the-threshold (i.e., the differences between the observed values and a given threshold), are often assumed to be distributed in a Generalized Pareto Distribution (GPD) (Equation (2)):
G P ξ ( x / σ ) = : G P ξ , σ ( x ) C D F ,   σ > 0 ,  
where GPξ means the following distribution (Equation (3)):
G P ξ ( x ) = { 1 ( 1 + ξ x ) 1 / ξ , 1 + ξ x > 0 , x > 0 ,   i f   ξ 0 , 1 exp ( x ) ,   x > 0 ,   i f   ξ = 0
where ξ is the shape parameter and σ the scaling parameter [53]. We adjusted the GPD to both the left and right tails of the ELV, TEMP and PREC distributions for the regeneration and mature trees. The differences between these two life stages were assumed to show best the possible shift due to environmental (climate) change that had already occurred. Following duMouchel [54], we subsampled the observed presence values for beech regeneration and mature trees below the 10th percentile and above the 90th percentile of ELV, TEMP and PREC. Since Scarrott and MacDonald [55] criticized such an approach, we also checked the MRL and the Hill plot approach. Since they provided similar threshold values as the 10th/90th percentile, we retained the approach of duMouchel [54]. Based on the adjusted GPD, we calculated the occurrence probability for beech regeneration and mature trees at the left and right tail of the ELV, TEMP and PREC distributions. The occurrence probability at the threshold value (i.e., the 10th and 90th percentile) was considered as 1 (i.e., 100%). The calculated probability distributions for both beech life stages were tested for significant differences by applying the non-parametric Kolmogorov–Smirnov (KS) test [47]. The EVA analyses were performed using the R environment [49] and the extRemes [52] and evir [56] R packages.

3. Results

By comparing the medians of ELV between beech life stages, a difference of +13 m was observed between regeneration and mature trees (Table 1). Medians for recruitment and thin trees were even higher than those for regeneration (+32 m and +28 m, respectively); however, statistical differences between life stages were insignificant (MM test, p = 0.151). Median differences in TEMP between life stages were also insignificant (MM test, p = 0.11); the largest difference was found between regeneration and mature trees, amounting to +0.18 °C. In contrast, median differences were statistically significant for PREC (MM test, p < 0.01). Post hoc pairwise tests showed significant differences between mature trees and other life stages (p < 0.05); the medians for regeneration, recruitment and young trees were 78 mm, 86 mm and 111 mm larger, respectively.
When the distribution means were compared, significant differences between beech life stages were observed only for TEMP (p < 0.01). For ELV and PREC, right-skewed distributions (i.e., mean higher than median) were determined for all life stages, while for TEMP, left-skewed distributions (i.e., median higher than mean) were observed for all life stages.
The GAM smoothing functions of ELV, TEMP and PREC were statistically significant (p < 0.05) in all models for beech life stages, with the exception of the PREC model for recruitment in which the approximate significance of the smooth term was 0.103. The estimated response curves mostly showed asymmetrical and nonparametric shapes (Figure 3), with only some exceptions illustrating nearly symmetrical shapes. This result supports the use of GAM models.
The ELV probability response curves signified differences in the optimum ELV (i.e., ELV exhibiting maximum probability for occurrence) for beech life stage occurrence. The optimum ELV for regeneration, recruitment, young trees and mature trees amounted to 978 m, 929 m, 858 m and 360 m a.s.l., respectively (Figure 3). The response curves for regeneration and mature trees were of similar bimodal shape, but with two local maximums at different ELV. For regeneration and mature trees, the first local maximums were at 352 and 360 m a.s.l., respectively, and the second at 978 and 714 m a.s.l., respectively. The maximum abundance of beech regeneration, however, was, in contrast to its occurrence probability, much lower at 340 m a.s.l. (Figure 4). Similarly, the maximum abundance of mature trees was at 354 m a.s.l., while the maximum abundance of recruitment and thin trees appeared at higher elevations.
The EVA analysis of ELV showed that the probability of the occurrence of mature beech trees at the upper ELV edge (i.e., right tail above the 90th percentile) is constantly lower than that of beech regeneration (Figure 5); this result was additionally supported by differences in the values of the 90th percentile (Table 1). Considering only the right tails of the distributions, the probability of occurrence of mature trees dropped below 1% (if the probability of beech occurrence at the threshold ELV is assumed to be 100%) at 1457 m a.s.l., while this threshold is 73 m higher for regeneration. Significant differences between both probability distributions were determined (KS test, p < 0.001). In contrast, at the lower ELV edge (i.e., the left tail below the 10th percentile), the probability of occurrence of mature beech trees is also constantly lower than that of beech regeneration, but the differences between probability distributions were not significant (KS test, p = 0.576). The ELV value with the 1% occurrence probability was almost the same for regeneration and mature trees, being 153 and 156 m a.s.l., respectively. The values of the 10th percentile showed similarly small differences between life stages (Table 1).
The TEMP response curves indicated that the beech optimum shifted to colder sites based on the long-term average (Figure 3). The maximum probability of regeneration occurrence was observed at 2.62 °C and that of recruitment occurrence at 2.05 °C lower than that of mature trees (8.88 °C). The optimum for young trees (8.94 °C) was very similar to that of mature trees, however.
Similar results were obtained by the EVA analyzing the tails of TEMP distributions for regeneration and mature trees, showing the higher probability of regeneration occurrence at lower TEMP (Figure 5). Statistical differences between the probability distributions were insignificant for both tails (both p > 0.05), though the difference was more pronounced at the left distribution tail (below the 10th percentile). Furthermore, the values of the 10th/90th percentiles signified the same finding.
The PREC response curves, however, indicated no shift of beech along its gradient. The maximum probability for all life stages was observed at the maximum PREC value of 3607 mm (Figure 3). However, significant differences were found only between the left tail probability distributions for regeneration and mature trees (KS test, p = 0.003), but the results do not support the expected shift. The probability for regeneration occurrence was found to be greater in areas with lower PREC than for mature trees (Figure 5). At the right distribution tail no significant differences were found.

4. Discussion

Since climate warming is evidently well under way in Central and Southeastern Europe [38] and the beech is a widely distributed tree species in the study area [29,31], we expected that beech has already responded to climate change, with juveniles growing at higher ELV than mature trees and in colder and moister sites if the long-term averages of TEMP and PREC are considered, respectively. Yet, our results do not unambiguously support these expectations, and no clear pattern of beech climate-change-induced shift can be distinguished.
According to the GAMs, a substantial upward movement in the optimum ELV of beech regeneration and recruitment compared to mature trees was detected (also young trees indicated such a shift, but less evidently); the TEMP optimum shift towards colder sites additionally supported this finding. Moreover, a statistically significant upward movement of +73 m was detected at the upper (colder) edge of beech distribution (i.e., the right tail). This evidently identified the upward shift of beech at the upper leading edge of its distribution, which is in synchrony with the current climate warming in this part of Europe [38] and has also been detected in other mountain areas across Europe. Similar shifts of beech have been reported in the Spanish Pyrenees, e.g., [12,20], France [7], the Swiss Alps [40] and the Carpathians [57], but not yet in the Eastern Alps (Central Europe) and the Dinaric Mountains (Southeastern Europe). Alpine late-successional tree species, such as the beech, often exhibit an upward shift as a consequence of climate warming [18]. However, the opposite was also reported by Rabasa et al. [8], who found the beech regeneration optimum to be 150 m lower than that of mature trees when studying various species on several sites across Europe from Spain to Sweden.
In contrast, no obvious shift in beech population was detected when the abundance of individuals per life stages along the ELV gradient was analyzed. Additionally, differences between the life stage medians and means of ELV were statistically insignificant. Furthermore, no upward retreat of beech regeneration in the low-elevation trailing edge of the distribution was detected, although it was expected to a greater extent than an upward shift at its upper leading edge. When analyzing TEMP, a shift of beech regeneration towards colder sites was detected, but with significant extension only at the “colder” leading edge and almost without it at the “warmer” trailing edge where it was expected to a greater extent. This largely coincides with an elevational shift, as the temperature decreases with elevation. Conversely, in the temperate forests of Japan, tree species abundances changed directionally along a temperature gradient [26]. With respect to PREC, no significant shift was detected, which was also surprising.
Increased air temperature has often been cited as the main reason for such an upward shift of tree species [22,25], which may be especially true for temperature sensitive species such as the beech [58]. In Slovenia, an increase of 0.36 °C per decade during the last five decades was reported [38], which is high enough to trigger movements in tree species populations. If related to lower precipitation and consequent droughts, its impact may be even more pronounced [3]. According to Matyas et al. [36], a one degree increase in temperature should be followed by a 170 m upward movement of tree species. Even a detected significant upward shift at the upper leading edge seems to be insufficiently large considering the average temperature increase of about 1.5 °C in the period 1961–2011 [59]. An upward shift of 250–260 m would be needed to follow the observed temperature change.
However, in our case, an upward shift in beech extent may also be a consequence of a natural “return” of beech to forests with altered tree species composition due to the favoring of Picea abies in the past [34,60]. Such forests are mainly located at an elevation above 1000 m a.s.l., representing the leading edge of beech distribution. In Slovenia, beech is potentially present up to 1700–1800 m a.s.l., while the highest elevation at which beech trees were found in our study was less than 1500 m a.s.l. At such elevations, beech fructification is not frequent and abundant. In addition, beech expansion might be limited by the presence and size of seed trees, with its heavy seed not able to disperse over a very long distance [18,61]. However, Vitasse et al. [40] argued that beech should not be limited in its expansion upwards due to climate change by a limitation in reproduction (e.g., seed availability, germination) or by seedling establishment, which is also supported by our results. Seedling establishment can, however, be substantially limited by drought [3]. However, the alpine climate in the Slovenian mountains is moist with high annual and summer precipitation [45], and thus drought should not pose a threat. A much larger threat to the upward retreat of beech (and other species) may be the (forest) soil, which is not evolved enough in the subalpine vegetation belt for late-successional tree species, such as the beech, to thrive [62].
In our case, beech regeneration was also found on plots without potential seed trees detected, even as high as 1755 m a.s.l. However, since our plots were small, seed trees might be located in the close vicinity of the plots. Our data did not allow us to separate the edging dispersal effect from mid- and long-distance dispersal. In addition, the small size of the forest inventory plots may contribute to an unfair representativeness between beech life stages. However, the large number of randomly selected plots from a systematic grid alleviates this shortcoming. Due to the factors mentioned, the detected upward shift in beech regeneration compared to mature trees cannot be declared to be unambiguously related to climate change only, but it may be influenced by other factors as well.
The contraction at the trailing edge of beech distribution, represented by low-elevation (<200 m a.s.l.) warmer and dryer sites, was expected since they might represent the sub-Mediterranean xeric limit of beech distribution in southwestern Slovenia and the continental xeric limit in eastern Slovenia. The most pronounced contractions of beech distribution were expected at these limits [36] since beech shifted its range from the Holocene onwards and currently occupies the warmest sites [39]. Severe and frequent droughts should be the main reason for such a retreat of beech, e.g., [13,27]; however, our results do not support this hypothesis. The reason may be the high enough annual precipitation distributed accordingly also during the growing season [45]. This resulted in infrequent droughts that were not severe enough to damage beech in the study area. According to Matyas et al. [36], a probability of >75% for beech occurrence takes place if annual precipitation is higher than 739 mm and mean spring temperatures are ≤14 °C. Such an amount of precipitation (and required spring temperatures) was attained or exceeded in the vast majority of our study area in the previous and also the last decade [38,45]. As Mellert et al. [37] pointed out, most regions in Central Europe are far from the xeric limit of beech, which was also supported in our study. However, during the last decade, there have still been four years that exhibited a lower annual precipitation than the long-term average shown in Figure 1 [45]. Together with the observed increased (summer) temperature, this may indicate potentially more frequent and severe drought events.
According to Dobrowski [63], an additional reason for migration lags at the low-elevation warm trailing edge of beech distribution can arise in areas with high spatial variability in microclimate. The study area is characterized by a high topographic complexity, which may create climate microrefugia enabling small populations of trees to persist beyond the optimal climate niche [7,64]. Favorable climate conditions for beech regeneration can also be sustained by adequate forest management since canopy cover can moderate and buffer climate extremes at the forest floor [64]. The continuous-cover forestry practiced in Slovenia [33] may have such an effect [29], fostering the abundant regeneration and recruitment of beech [43]. Additionally, climate-mediated changes in species competitiveness within phytosociological communities can be a possible reason for this observed migration lag [11,28]. In this interaction, beech regeneration may have recently increased its competitiveness in relation to other tree, shrub and herbaceous species, but this may not remain the case in the long run. Beech competitiveness at the low-elevation warmer trailing edge may also decrease in Slovenia, as has already occurred in Spain [12,20].
A shift of tree species due to climate change can also be indicated by other signs and parameters. Potential shifts of beech have often been indicated based on changes in growth patterns, e.g., [12,13]. Across most of the area covered by European beech in Europe, there has been a notable decline in growth during the last 60 years [65], suggesting a potential shift in beech population and extent. Diameter distribution is an important indicator of the demographic structure of tree species populations. Its changes may imply a possible shift if, for example, there is a trend towards an increasing number of large-sized trees with a concurrent decrease of small-sized young trees and recruitment. Damage rate and natural mortality may also be such parameters. Ogris and Skudnik [66] reported an increasing trend of defoliation of beech crowns in the recent past due to natural disturbances and some as yet unknown reasons. This may be an early signal of beech being in trouble and of a possible retreat of beech from some sites, since more severe and frequent droughts [17,38] may intensify this process [67]. However, it has to be considered that beech is a highly plastic tree species with a potentially extendable ecological niche in a changeable environment. Its adaptive responses of migration or phenology may substantially influence the future shift in beech distribution. A comprehensive large-scale analysis of all parameters indicating a potential shift in the beech population is needed in order to definitively answer this important research and management question for European forestry.

5. Conclusions

We determined a substantial shift of beech in the juvenile and middle-age stages upward and toward colder sites compared to mature trees. However, unequal responses were detected along the ELV and TEMP distribution with any shift disclosed in the PREC distribution. The observed shift of beech regeneration compared to mature trees at its upper (+73 m) and colder leading edge (−2.6 °C) of ELV and TEMP distributions and the shift in their optimums were not followed by movement at its lower and warmer trailing edge.
The shift rate of beech does not correspond completely to the rate of climate change. It is evidently insufficient considering the observed change in climate. Such a result was partly expected since trees and forests are long-living organisms and thus respond with a certain delay to such external stimuli.
The observed shift and the movement lag are likely a result of the interplay of various factors, such as climate change, high spatial variability in microclimate, unexceptional droughts in the recent past, changes in forest use and possible limitations in the migration ability of beech and its adaptation capacity.
For temperature-sensitive tree species, such as beech, ELV and TEMP seem to be more relevant environmental variables for studying climate-change-induced shifts compared to PREC. This may be especially true if water availability is not a limiting factor of species thrift.
The further continuous investigation of the response of beech to climate change is needed to elucidate its adaptive response and potential to extend its ecological niche as well as to identify the influential factors in beech’s shift in the environmental gradients in addition to climate change.

Author Contributions

Conceptualization, A.B. and M.K.; data preparation: A.R. and M.K.; methodology, M.K.; formal analysis, M.K.; writing—original draft preparation, M.K.; writing—review and editing, A.B., A.R. and M.K.; visualization, M.K. All authors have read and agreed to the published version of the manuscript.

Funding

The authors acknowledge the financial support from the Slovenian Research Agency (ARRS) through the project J4-1765 “Forest ecosystem dynamics under climate change: effects of severe disturbance and climate warming” and the research core funding P4-0059 “Forest, forestry and renewable forest resources”. The study was additionally supported by the infrastructure center “Research forest” being a part of the MRIC UL (infrastructure program IO-0022).

Institutional Review Board Statement

Not applicable.

Informed Consent Statement

Not applicable.

Data Availability Statement

Not applicable.

Acknowledgments

The authors would like to thank the Slovenia Forest Service for providing forest inventory data. The authors are also grateful to Vasilije Trifković for his help in data management and creating some of the figures and to Jan Nagel for proofreading and editing the manuscript.

Conflicts of Interest

The authors declare no conflict of interest. The funders had no role in the design of the study; in the collection, analyses, or interpretation of data; in the writing of the manuscript; or in the decision to publish the results.

References

  1. Morin, X.; Augspurger, C.; Chuine, I. Process-based modeling of species’ distributions: What limits temperate tree species’ range boundaries? Ecology 2007, 88, 2280–2291. [Google Scholar] [CrossRef]
  2. Woodward, F.I. Climate and Plant Distribution; Cambridge University Press: Cambridge, UK, 1986. [Google Scholar]
  3. Khaine, I.; Woo, S.Y. An overview of interrelationship between climate change and forests. For. Sci. Technol. 2015, 11, 11–18. [Google Scholar] [CrossRef]
  4. Dolanc, C.; Safford, H.; Dobrowski, S.; Thorne, J. Twentieth century shifts in abundance and composition of vegetation types of the Sierra Nevada, CA, US. Appl. Veg. Sci. 2014, 17, 442–455. [Google Scholar] [CrossRef]
  5. Serra-Diaz, J.; Franklin, J.; Dillon, W.; Syphard, A.; Davis, F.; Meentemeyer, R. California forests show early indications of both range shifts and local persistence under climate change. Glob. Ecol. Biogeogr. 2016, 25, 164–175. [Google Scholar] [CrossRef]
  6. Boisvert-Marsh, L.; de Blois, S. Unravelling potential northward migration pathways for tree species under climate change. J. Biogeogr. 2021, 48, 1088–1100. [Google Scholar] [CrossRef]
  7. Lenoir, J.; Gegout, J.; Pierrat, J.; Bontemps, J.; Dhote, J. Differences between tree species seedling and adult altitudinal distribution in mountain forests during the recent warm period (1986–2006). Ecography 2009, 32, 765–777. [Google Scholar] [CrossRef]
  8. Rabasa, S.; Granda, E.; Benavides, R.; Kunstler, G.; Espelta, J.; Ogaya, R.; Penuelas, J.; Scherer-Lorenzen, M.; Gil, W.; Grodzki, W.; et al. Disparity in elevational shifts of European trees in response to recent climate warming. Glob. Chang. Biol. 2013, 19, 2490–2499. [Google Scholar] [CrossRef]
  9. Wason, J.; Dovciak, M. Tree demography suggests multiple directions and drivers for species range shifts in mountains of Northeastern United States. Glob. Chang. Biol. 2017, 23, 3335–3347. [Google Scholar] [CrossRef]
  10. O’Sullivan, K.; Ruiz-Benito, P.; Chen, J.; Jump, A. Onward but not always upward: Individualistic elevational shifts of tree species in subtropical montane forests. Ecography 2021, 44, 112–123. [Google Scholar] [CrossRef]
  11. Jantsch, M.; Fischer, A.; Fischer, H.; Winter, S. Shift in Plant Species Composition Reveals Environmental Changes during the Last Decades: A Long-Term Study in Beech (Fagus sylvatica) Forests in Bavaria, Germany. Folia Geobot. 2013, 48, 467–491. [Google Scholar] [CrossRef]
  12. Jump, A.; Hunt, J.; Penuelas, J. Rapid climate change-related growth decline at the southern range edge of Fagus sylvatica. Glob. Chang. Biol. 2006, 12, 2163–2174. [Google Scholar] [CrossRef]
  13. Dulamsuren, C.; Hauck, M.; Kopp, G.; Ruff, M.; Leuschner, C. European beech responds to climate change with growth decline at lower, and growth increase at higher elevations in the center of its distribution range (SW Germany). Trees-Struct. Funct. 2017, 31, 673–686. [Google Scholar] [CrossRef]
  14. Morin, X.; Lechowicz, M.; Augspurger, C.; O’ Keefe, J.; Viner, D.; Chuine, I. Leaf phenology in 22 North American tree species during the 21st century. Glob. Chang. Biol. 2009, 15, 961–975. [Google Scholar] [CrossRef]
  15. Gottfried, M.; Pauli, H.; Futschik, A.; Akhalkatsi, M.; Barancok, P.; Alonso, J.; Coldea, G.; Dick, J.; Erschbamer, B.; Calzado, M.; et al. Continent-wide response of mountain vegetation to climate change. Nat. Clim. Chang. 2012, 2, 111–115. [Google Scholar] [CrossRef]
  16. Lindner, M.; Fitzgerald, J.; Zimmermann, N.; Reyer, C.; Delzon, S.; van der Maaten, E.; Schelhaas, M.; Lasch, P.; Eggers, J.; van der Maaten-Theunissen, M.; et al. Climate change and European forests: What do we know, what are the uncertainties, and what are the implications for forest management? J. Environ. Manag. 2014, 146, 69–83. [Google Scholar] [CrossRef]
  17. IPCC. Climate Change 2022: Impacts, Adaptation and Vulnerability; Summary for Policymakers; Working Group II Contribution to the Sixth Assessment Report of the Intergovernmental Panel on Climate Change; Cambridge University Press: Cambridge, UK, 2022.
  18. Saltré, F.; Duputie, A.; Gaucherel, C.; Chuine, I. How climate, migration ability and habitat fragmentation affect the projected future distribution of European beech. Glob. Chang. Biol. 2015, 21, 897–910. [Google Scholar] [CrossRef]
  19. Stojanovic, D.; Krzic, A.; Matovic, B.; Orlovic, S.; Duputie, A.; Djurdjevic, V.; Galic, Z.; Stojnic, S. Prediction of the European beech (Fagus sylvatica L.) xeric limit using a regional climate model: An example from southeast Europe. Agric. For. Meteorol. 2013, 176, 94–103. [Google Scholar] [CrossRef]
  20. Penuelas, J.; Boada, M. A global change-induced biome shift in the Montseny mountains (NE Spain). Glob. Chang. Biol. 2003, 9, 131–140. [Google Scholar] [CrossRef]
  21. Lenoir, J.; Gegout, J.; Marquet, P.; de Ruffray, P.; Brisse, H. A significant upward shift in plant species optimum elevation during the 20th century. Science 2008, 320, 1768–1771. [Google Scholar] [CrossRef]
  22. Jump, A.; Matyas, C.; Penuelas, J. The altitude-for-latitude disparity in the range retractions of woody species. Trends Ecol. Evol. 2009, 24, 694–701. [Google Scholar] [CrossRef]
  23. Boisvert-Marsh, L.; Perie, C.; de Blois, S. Shifting with climate? Evidence for recent changes in tree species distribution at high latitudes. Ecosphere 2014, 5, art83. [Google Scholar] [CrossRef]
  24. Monleon, V.; Lintz, H. Evidence of Tree Species’ Range Shifts in a Complex Landscape. PLoS ONE 2015, 10, e0118069. [Google Scholar] [CrossRef]
  25. Renwick, K.; Rocca, M. Temporal context affects the observed rate of climate-driven range shifts in tree species. Glob. Ecol. Biogeogr. 2015, 24, 44–51. [Google Scholar] [CrossRef]
  26. Suzuki, S.; Ishihara, M.; Hidaka, A. Regional-scale directional changes in abundance of tree species along a temperature gradient in Japan. Glob. Chang. Biol. 2015, 21, 3436–3444. [Google Scholar] [CrossRef]
  27. Silva, D.; Mazzella, P.; Legay, M.; Corcket, E.; Dupouey, J. Does natural regeneration determine the limit of European beech distribution under climatic stress? For. Ecol. Manag. 2012, 266, 263–272. [Google Scholar] [CrossRef]
  28. Lenoir, J.; Gegout, J.; Guisan, A.; Vittoz, P.; Wohlgemuth, T.; Zimmermann, N.; Dullinger, S.; Pauli, H.; Willner, W.; Svenning, J. Going against the flow: Potential mechanisms for unexpected downslope range shifts in a warming climate. Ecography 2010, 33, 295–303. [Google Scholar] [CrossRef]
  29. Von Wühlisch, G. EUFORGEN Technical Guidelines for Genetic Conservation and Use for European Beech (Fagus sylvatica); Bioversity International: Rome, Italy, 2008. [Google Scholar]
  30. Ellenberg, H.; Leuschner, C. Vegetation Mitteleuropas mit den Alpen in ökologischer, Dynamischer und Historischer Sicht, 6th ed.; Verlag Eugen Ulmer: Stuttgart, Germany, 2010; p. 1334. [Google Scholar]
  31. Bončina, A.; Rozman, A.; Dakskobler, I.; Klopčič, M.; Babij, V.; Poljanec, A. Forest Site Types in Slovenia. Vegetation, Stand and Management Characteristics; University of Ljubljana, Biotechnical Faculty, Department of Forestry and Renewable Forest Resources; Slovenia Forest Service: Ljubljana, Slovenia, 2021. [Google Scholar]
  32. Pezzi, G.; Ferrari, C.; Corazza, M. The Altitudinal Limit of Beech Woods in the Northern Apennines (Italy). Its Spatial Pattern and Some Thermal Inferences. Folia Geobot. 2008, 43, 447–459. [Google Scholar] [CrossRef]
  33. Boncina, A. History, current status and future prospects of uneven-aged forest management in the Dinaric region: An overview. Forestry 2011, 84, 467–478. [Google Scholar] [CrossRef]
  34. Johann, E. Traditional forest management under the influence of science and industry: The story of the alpine cultural landscapes. For. Ecol. Manag. 2007, 249, 54–62. [Google Scholar] [CrossRef]
  35. Kocher, P.; Gebauer, T.; Horna, V.; Leuschner, C. Leaf water status and stem xylem flux in relation to soil drought in five temperate broad-leaved tree species with contrasting water use strategies. Ann. For. Sci. 2009, 66, 101. [Google Scholar] [CrossRef]
  36. Mátyás, C.; Berki, I.; Czúcz, B.; Gálos, B.; Móricz, N.; Rasztovits, E. Future of Beech in Southeast Europe from the Perspective of Evolutionary Ecology. Acta Silv. Lignaria Hung. 2010, 6, 91–110. [Google Scholar]
  37. Mellert, K.; Ewald, J.; Hornstein, D.; Dorado-Linan, I.; Jantsch, M.; Taeger, S.; Zang, C.; Menzel, A.; Kolling, C. Climatic marginality: A new metric for the susceptibility of tree species to warming exemplified by Fagus sylvatica (L.) and Ellenberg’s quotient. Eur. J. For. Res. 2016, 135, 137–152. [Google Scholar] [CrossRef]
  38. Bertalanič, R.; Dolinar, M.; Draksler, A.; Honzak, L.; Kobold, M.; Kozjek, K.; Lokošek, N.; Medved, A.; Vertačnik, G.; Vlahović, Ž.; et al. Assessment of Climate Change in Slovenia until the End of the 21st Century; Ministry of the Environment and Spatial Planning, Slovenian Environmental Agency: Ljubljana, Slovenia, 2018. [Google Scholar]
  39. Cheddadi, R.; Araujo, M.; Maiorano, L.; Edwards, M.; Guisan, A.; Carre, M.; Chevalier, M.; Pearman, P. Temperature range shifts for three European tree species over the last 10,000 years. Front. Plant Sci. 2016, 7, 1581. [Google Scholar] [CrossRef]
  40. Vitasse, Y.; Hoch, G.; Randin, C.; Lenz, A.; Kollas, C.; Korner, C. Tree recruitment of European tree species at their current upper elevational limits in the Swiss Alps. J. Biogeogr. 2012, 39, 1439–1449. [Google Scholar] [CrossRef]
  41. Ficko, A.; Klopčič, M.; Matijašič, D.; Poljanec, A.; Bončina, A. The distribution of beech and structural characteristics of beech stands in Slovenia. Res. Rep. For. Wood Sci. Technol. 2008, 87, 45–60. (In Slovene) [Google Scholar]
  42. SFS. Forest Inventory Databases; Slovenia Forest Service: Ljubljana, Slovenia, 2018. [Google Scholar]
  43. Klopcic, M.; Simoncic, T.; Boncina, A. Comparison of regeneration and recruitment of shade-tolerant and light-demanding tree species in mixed uneven-aged forests: Experiences from the Dinaric region. Forestry 2015, 88, 552–563. [Google Scholar] [CrossRef]
  44. GURS. Digital Relief Model; Surveying and Mapping Authority of the Republic of Slovenia: Ljubljana, Slovenia, 2021. [Google Scholar]
  45. ARSO. Databases and Maps of the Slovenian Environment Agency (ARSO); Slovenian Environment Agency: Ljubljana, Slovenia, 2022. [Google Scholar]
  46. Mood, A.M. On the asymptotic efficiency of certain nonparametric 2-sample tests. Ann. Math. Stat. 1954, 25, 514–522. [Google Scholar] [CrossRef]
  47. Zuur, A.F.; Ieno, E.N.; Smith, G.M. Analyzing Ecological Data; Springer: Berlin/Heidelberg, Germany, 2007. [Google Scholar]
  48. Hastie, T.; Tibshirani, R. Generalized additive models. Stat. Sci. 1987, 1, 297–318. [Google Scholar]
  49. R Core Development Team. R: A Language and Environment for Statistical Computing; R Foundation for Statistical Computing: Vienna, Austria, 2021. [Google Scholar]
  50. Wood, S.N. Generalized Additive Models: An Introduction with R; Chapman & Hall/CRC: Boca Raton, FL, USA; London, UK; New York, NY, USA, 2006. [Google Scholar]
  51. Coles, S. An Introduction to Statistical Modeling of Extreme Values; Springer: Berlin/Heidelberg, Germany; London, UK, 2004. [Google Scholar]
  52. Gilleland, E.; Katz, R. extRemes 2.0: An Extreme Value Analysis Package in R. J. Stat. Softw. 2016, 72, 1–39. [Google Scholar] [CrossRef]
  53. Gomes, M.; Guillou, A. Extreme Value Theory and Statistics of Univariate Extremes: A Review. Int. Stat. Rev. 2015, 83, 263–292. [Google Scholar] [CrossRef]
  54. DuMouchel, W.H. Estimating the stable index-alpha in order to measure tail thickness—A critique. Ann. Stat. 1983, 11, 1019–1031. [Google Scholar] [CrossRef]
  55. Scarrott, C.; MacDonald, A. A review of extreme value threshold estimation and uncertainty quantification. Revstat-Stat. J. 2012, 10, 33–60. [Google Scholar]
  56. Pfaff, B.; Zivot, E.; McNeil, A.; Stephenson, A. Package ‘evir’. 2018. Available online: https://cran.r-project.org/web/packages/evir/evir.pdf (accessed on 1 June 2022).
  57. Gazda, A.; Koscielniak, P.; Hardy, M.; Muter, E.; Kedra, K.; Bodziarczyk, J.; Fraczek, M.; Chwistek, K.; Rozanski, W.; Szwagrzyk, J. Upward expansion of distribution ranges of tree species: Contrasting results from two national parks in Western Carpathians. Sci. Total Environ. 2019, 653, 920–929. [Google Scholar] [CrossRef]
  58. Walthert, L.; Meier, E.S. Tree species distribution in temperate forests is more influenced by soil than by climate. Ecol. Evol. 2017, 7, 9473–9484. [Google Scholar] [CrossRef]
  59. Vertačnik, G.; Dolinar, M.; Bertalanič, R.; Klančar, M.; Dvoršek, D.; Nadbath, M. Climatic Variability of Slovenia. Main Characteristics of Air Temperature Trends in the Period 1961–2011; Ministry of the Environment and Spatial Planning, Slovenian Environment Agency: Ljubljana, Slovenia, 2013. (In Slovene) [Google Scholar]
  60. Klopcic, M.; Boncina, A. Stand dynamics of silver fir (Abies alba Mill.)-European beech (Fagus sylvatica L.) forests during the past century: A decline of silver fir? Forestry 2011, 84, 259–271. [Google Scholar] [CrossRef]
  61. Axer, M.; Martens, S.; Schlicht, R.; Wagner, S. Modelling natural regeneration of European beech in Saxony, Germany: Identifying factors influencing the occurrence and density of regeneration. Eur. J. For. Res. 2021, 140, 947–968. [Google Scholar] [CrossRef]
  62. Henne, P.; Elkin, C.; Reineking, B.; Bugmann, H.; Tinner, W. Did soil development limit spruce (Picea abies) expansion in the Central Alps during the Holocene? Testing a palaeobotanical hypothesis with a dynamic landscape model. J. Biogeogr. 2011, 38, 933–949. [Google Scholar] [CrossRef]
  63. Dobrowski, S. A climatic basis for microrefugia: The influence of terrain on climate. Glob. Change Biol. 2011, 17, 1022–1035. [Google Scholar] [CrossRef]
  64. Chen, J.Q.; Franklin, J.F.; Spies, T.A. Contrasting microclimates among clear-cut, edge, and interior of old-growth Douglas-fir forest. Agric. For. Meteorol. 1993, 63, 219–237. [Google Scholar] [CrossRef]
  65. Del Castillo, E.; Zang, C.; Buras, A.; Hacket-Pain, A.; Esper, J.; Serrano-Notivoli, R.; Hartl, C.; Weigel, R.; Klesse, S.; de Dios, V.; et al. Climate-change-driven growth decline of European beech forests. Commun. Biol. 2022, 5, 163. [Google Scholar] [CrossRef]
  66. Ogris, N.; Skudnik, M. Beech defoliation in Slovenia is increasing. Slov. J. For. 2021, 79, 226–237. (In Slovene) [Google Scholar]
  67. Ognjenovic, M.; Seletkovic, I.; Potocic, N.; Marusic, M.; Tadic, M.; Jonard, M.; Rautio, P.; Timmermann, V.; Lovreskov, L.; Ugarkovic, D. Defoliation Change of European Beech (Fagus sylvatica L.) Depends on Previous Year Drought. Plants 2022, 11, 730. [Google Scholar] [CrossRef]
Figure 1. Forest distribution and grid of permanent sampling plots in Slovenia on which trees and regeneration (black dots) were inventoried (n = 3366) [42].
Forests 13 01311 g001
Figure 2. Mean annual temperature and mean annual precipitation across Slovenia in the period 1961–2010 (based on [45]).
Forests 13 01311 g002
Figure 3. Elevation (a), temperature (b) and precipitation (c) response curves derived with GAM models per life stages of the European beech; the optimums are highlighted by marks related to the life stage.
Forests 13 01311 g003
Figure 4. Predicted number of individuals per life stages of the European beech along an elevation gradient; the optimums are highlighted by vertical lines and all gathered at the bottom chart for comparison purposes.
Forests 13 01311 g004
Figure 5. Occurrence probability of beech regeneration (black line) and mature beech trees (red line) at the lower (<10th percentile; left sub-figures) and upper tails (>90th percentile; right sub-figures) of the (a) ELV, (b) TEMP and (c) PREC distributions; the occurrence probability at the selected threshold for each life stage is assumed to be 1.
Forests 13 01311 g005
Table 1. Characteristic values of European beech life stage presence distributions along elevation (ELV), long-term mean annual temperature (TEMP) and long-term mean annual precipitation (PREC) gradients; p-values indicate the significance in median (Mood’s median test) and means (ANOVA), respectively; superscript letters indicate group membership according to post hoc median pairwise comparisons or Tukey’s HSD test.
European Beech Life Stagep-Value
RegenerationRecruitmentThin TreesMature Trees
ELV
(m)
median6096286245960.151
mean6406356486180.090
min81134182134
max1755142414721472
10th percentile289292308295
90th percentile10249891008982
TEMP
(°C)
median8.288.288.318.460.110
mean8.09 a8.15 a,b8.11 a,b8.28 b0.001
min3.113.853.663.66
max12.2812.1511.4412.15
10th percentile6.036.276.156.29
90th percentile9.839.879.739.88
PREC
(mm)
median1573 a1581 a1606 a,b1495 b0.009
mean16321645167316050.050
min807840875825
max3607316032473607
10th percentile1177117412071190
90th percentile2276230923532249
Publisher’s Note: MDPI stays neutral with regard to jurisdictional claims in published maps and institutional affiliations.

