Article

Highlighting a New Morphospecies within the Dialium Genus Using Leaves and Wood Traits

1
Forest Is Life, TERRA Teaching and Research Centre, Gembloux Agro-Bio Tech, University of Liege, B-5030 Gembloux, Belgium
2
Laboratoire Electrophysiologie-Pharmacologie, Unité de recherche Agrobiologie, Université des Sciences et Techniques de Masuku, Franceville B-901, Gabon
3
Centre Wallon de Recherche Agronomique (CRA-W), B-5030 Gembloux, Belgium
*
Authors to whom correspondence should be addressed.
Forests 2022, 13(8), 1339; https://doi.org/10.3390/f13081339
Submission received: 1 July 2022 / Revised: 12 August 2022 / Accepted: 16 August 2022 / Published: 22 August 2022

Abstract

:
During inventories of lesser-known timber species in eastern Gabon, a new Dialium morphospecies was discovered. To discriminate it from the two other 2–5 leaflets Dialium species, 25 leaf traits were measured on 45 trees (16 Dialium pachyphyllum, 14 Dialium lopense, 15 Dialium sp. nov.). Nine wood chemical traits, as well as infrared spectra, were also examined on harvestable trees (four Dialium pachyphyllum and four Dialium sp. nov.). This study revealed seven discriminant leaf traits that allowed to create a field identification key. Nine significant differences (five in sapwood and four in heartwood) in terms of wood composition were highlighted. The use of the PLS-DA technique on FT-IR wood spectra allowed to accurately identify the new morphospecies. These results provide strong support for describing a new species in this genus. Implications for sustainable management of its populations are also discussed.

1. Introduction

Despite efforts implemented by Central African countries in sustainable forest management, a progressive depletion of some timber flagship species has been observed [1,2]. This is mainly due to an extremely selective exploitation that focuses on a dozen species [3]. Most of them are light-demanding and logging impacts (canopy openness of less than 10% every cutting cycle of 25 years) are too small to positively influence their regeneration [4,5]. This depletion of species jeopardizes forest biodiversity and the future of productive forests.
The timber sector that covers 53 million ha (29 million with sustainable management plan) contributes significantly to employment and to the Gross National Product (GNP), 4% on average [3]. Apart from conservation areas, legal selective logging appears to be the least degrading use of forest ecosystems [6,7]. Moreover, some certified companies (totaling five million ha for the label Forest Stewardship Council, FSC [3]) go further by bringing significant improvement to life condition of workers, implementing Reduce Impact Logging (RIL) techniques, regulating hunting or enriching the forest [8,9,10]. By assigning an economic value to a forest, while having a limited impact on it, production forests can strengthen the network of 18 million hectares of protected area [6,7,11] and thus prevent land-use conversion.
Central African states plan to increase areas allocated to timber production and the intensity of logging by 50% by 2030 [3], with a an average logging intensity of 8.7–9.5 m3/ha. In order to avoid depleting those forests, it is more necessary than ever to reduce the pressure on traditional species and to redirect the exploitation towards lesser-known timber species [2,10,12] with: (i) a high wood quality, (ii) lower light requirements, and thus, a better regeneration than traditional light-demanding timber species.
Some species of the genus Dialium could meet such requirements [13]. They reach high densities in evergreen forests, have sustained regeneration, and very durable wood. However, the systematics of the genus remains unclear [14]. In the forests of central and eastern Gabon, two species of Dialium can reach large dimensions and could interest the logging industry: Dialium pachyphyllum Harms and Dialium lopense Breteler [14]. In the FSC-certified concession of Precious Woods operating in this region, a group of similar individuals appears to have differences in morphological traits from previously known species, especially on the leaves. [15]. Those morphological distinctions suggest the presence of an undescribed Dialium morphospecies [16].
The species identification issue is not a recent topic and many tree species continue to be discovered in Central Africa [17,18,19]. Recently, a species from the same genus, Dialium heterophyllum M. J. Falção & Mansano, was discovered in the South Amazonian Basin [20]. An accurate identification of species is crucial to understand their ecology and their timber properties. Therefore, the aim of this study is to evaluate the feasibility of differentiation between closely related species based on vegetative characteristics. More specifically, it aims to: (i) objectify morphological leave traits that discriminate the new morphospecies from the others, (ii) to determine chemical composition variation in the wood of harvestable species, and (iii) to verify whether this chemical composition, using Fourier Transformed Infrared (FT-IR) Spectra and chemometrics, can allow discriminating this new morphospecies.

2. Materials and Methods

2.1. Study Genus

Although there is no consensus among botanists, the Dialium genus (Fabaceae, Dialioideae) could include 44 species, 22 of which are endemic to the Guinean-Congolese region. The differences between species are sometimes tenuous, and descriptions are based on a limited number of individuals. All are hermaphroditic and dispersed by animals with abundant regeneration in the understory of evergreen forests [14]. Some species can reach 40 m in height and a meter in diameter. These species are generally grouped in Gabon under the name of “omvong” and typically have 3–5 leaflets. They have durable woods, resistant to fungi, termites, marine borers, and insects [13,21]. The wood can be used in parquetry, cabinetry, for exterior cladding, bridge construction and other heavy industrial uses [14].

2.2. Study Area

The study was performed in in the logging concession granted to Precious Woods-Compagnie Equatoriale des Bois A.S. (PW-CEB). This FSC-certified logging company is located in Bambidie, Lastoursville (Gabon) (0°41.65′ S–12°59.01′ E). The average temperature and precipitation are 25 °C and 1700 mm, respectively [22]. The forest is evergreen and its canopy is dominated by Aucoumea klaineana Pierre, Scyphocephalium mannii (Benth.) Warb., and Julbernardia pellegriniana Troupin. PW-CEB wishes to diversify its production to guarantee the maintenance of these activities in the long term. From this perspective, the possibility of valorizing Dialium wood has been analyzed. During field inventories, 3 morphospecies of “omvong” have been observed: Dialium pachyphyllum, Dialium lopense, and a new one Dialium sp. nov. All are present in the dynamic observation permanent plots set up by the Dynafac network (https://www.dynafac.org (accessed on 1 July 2022)).

2.3. Herbarium Collection and Description

Samples (Figure 1) of D. pachyphyllum, D. lopense, and D. sp. nov. were collected in the field. In addition, reference herbaria from the botanical garden of Meise (Belgium) were studied (Appendix A). They were selected based on the quality of their identification by botanists specialized in the Fabaceae family. A total of 45 individuals were analyzed, including 29 individuals (diameter measured at 1.3 m, height >10 cm) collected in the field and 16 individuals from the Meise collection. For each sample, 25 leaf morphological traits were observed (Table 1). All traits were not systematically visible and/or available (e.g., absence of basal leaflet).

2.4. Wood Material

For each of the studied species, D. pachyphyllum and D. sp. nov., four trees were cut following national regulations. Observed stems of D. lopense did not reach the legal minimum cutting diameter of 70 cm. Its wood properties were therefore not investigated. For each tree, altitude, floor slope, stem perimeter at the base of the log (measured at 1.3 m height when possible or above buttresses), position in the stand, and tree height were recorded (Table 2). Tree position in the stand was assessed from the ground. A tree with a completely shaded crown was considered as “dominated”, a crown situated in the canopy and partially lit as “canopy”, and a fully sunny crown above the canopy as “emergent”. Wood disk samples, 10 cm thick, were collected at two different heights: at the bottom of the stem, corresponding to base of the log after felling and removing buttresses which are too important for the sawing or rotten heart (h1), and at the top of the stem corresponding to the first living branch (h2). To avoid sample contamination by fuel and oil of the chainsaw, wooden disk faces were planned in the society carpentry. Finally, 100 g of both sapwood and heartwood (taken at least 15 cm away from the pith and 10 cm away from sapwood, to avoid both juvenile wood and potential transition wood) were cut in each disk.

2.5. Wood Sample Preparation

2.5.1. For Chemical Analyses and Moisture Content

Wood samples were first planed using an electric hand planer Black et Decker© DN 710 and shavings were collected by a dust collector. Shavings were then ground into <1 mm powder using a Fritsch Pulverisette universal cutting mill and stored at −18 °C before extraction. Moisture Content (MC) was assessed before each experiment by measuring the mass loss of 1 g of powder drying at 105 °C; this loss of mass was expressed as a percentage of initial mass.

2.5.2. For FTIR Measurements

For each of the 8 trees (4 D. pachyphyllum and 4 D. sp. nov.) described in Table 1, thin shavings were collected on 5 radially distributed heartwood strips (section 15 × 25 mm). Those strips were cut at the lower sampling height (h1). Shavings were produced using a Veritas© low-angle jack plane and a shooting board. Those thin shavings were then stored in a standard atmosphere of 20 ± 2 °C and 65 ± 5% air relative moisture.

2.6. Wood Primary Metabolites Content and Mineral

For each morphospecies, the variation of primary metabolites was investigated between heartwood and sapwood. Samples were collected at two heights h1 and h2 (Table 2). For each species, wood and sampling height combinations, experimental repetitions are presented in Table 3. All metabolites are expressed as a percentage of wood dry matter (DM). DM was calculated by subtraction of MC.

2.6.1. Cellulose, Hemicellulose and Lignin Content

Fibers and lignin content were assessed following the Van Soest method [23,24,25] using a FOSS© FT 122 FiberTech tm. This method consists in successive matter treatments to remove sequentially soluble hemicellulose, cellulose, and lignin.

2.6.2. Ash Content

Ash content was determined as the mass residue of 1 g wood anhydrous powder after calcining. The calcining was processed according to [26]. It consisted in a first ramp from 21 °C to 575 °C within 2 h, including two temperature stages (102 °C for 12 min and 250 °C for 30 min). Then, a constant heating was processed at the reached temperature during 3 h.

2.6.3. Nitrogen Content

Wood nitrogen content was measured with the Kjeldahl method [27]. A hundred mg of wood powder was weighted on a Nitrogen-free paper and placed into the test tube FOSS Tecator digester for the mineralization. The digestion took place during 2 h, at 360 °C with 7.2 mL of concentrate H2SO4 and a Kjeltabs tablette (1.5 g K2SO4 + 0.045 g CuSO4.5H2O + 0.045 g TiO2). Tubes were then cooled and titrated with H2SO4 0.02 N in a FOSS© Kjeltec 2300.

2.6.4. Silica Content

The silica content was measured on 1 g of wood ash (see the Ash content protocol) by the gravimetric measure after hydrofluoric acid (HF) attack on HClO4/HNO3 acid-insoluble compounds [28]. Due to economic issues, this test was only applied on 3 samples (from 3 different trees) of sapwood and heartwood, at the lowest sample height (h1), for both D. sp. nov. and D. pachyphyllum.

2.7. Ethanol-Water Extracts Charaterisation

Extracts were prepared by maceration. After a preliminary test based on the Oreopoulou et al., (2019) review [29], the following extraction parameters were used: five grams of wood powder (WM) (with a known MC) were incorporated into 100 mL of an ethanol-water (70–30, v/v) solution. Extraction was processed at 50 °C, using a rotary table for 2 h. Extracts were then vacuum filtered using a Büchner funnel and a Whatman© cellulose filter, 11 µm pore size. The ethanol was then evaporated using a rotary evaporator and the filtrate was finally freeze-dried and the dry mass of extracts was recorded (EDM). The extraction yields were finally measured using EDM. All extractions were processed once for each combination of variables modalities (species, heartwood and sapwood, and sampling height) for each tree.

2.7.1. Phenolic Content

The Phenolic Content (PC) was measured using the Folin–Ciocalteu method [30] with some modifications. The tested solution was prepared by dissolving 50 µg of dry extracts into 10 mL of a methanol-water (70–30, v/v) solution. A volume of 100 µL of the tested solution was added into 500 µL of the Folin–Ciocalteau diluted in water (1:10, v/v). After 2 min, 2 mL of a 20% Na2CO3 solution was added. The mixture was then stirred and kept in a dark place at local temperature for 30 min. Finally, the mixture absorbance was recorded at 750 nm. The PC is expressed as mg gallic acid equivalent per g of dry extract (GAE). The GAE was obtained from a calibration curve of standard gallic acid dilution (from 0.5 g/L to 0.05 g/L). The PC determination was processed in triplicate for each extract.

2.7.2. Condensed Tannins Content

The Condensed Tannins Content (CTC) was measured using the Vanillin assay as mentioned by [31] with some modifications. The tested solution was prepared by dissolving 50 µg of dry extract into 10 mL of a methanol-water solution (70–30, v/v). In a cuvette, 500 µL of tested solution was added to 1500 µL of a vanillin-methanol solution (4–96, m–v). Then, 750 µL of HCl 37% was added. After stirring the mixture, the reaction took place in a dark place at 20 °C for 20 min. Finally, the absorbance of the solution was recorded at 550 nm. The CTC is expressed as mg catechin Equivalent per g of dry extract (CE). The CE was obtained from a calibration curve of standard catechin dilution (from 0.5 g/L to 0.05 g/L). The CTC determination was processed in triplicate for each extract.

2.8. FT-IR Acquisition

FT-IR spectra acquisition was processed using a Bruker VERTEX 70 paired to a Bruker Platinum Attenuated Total Reflectance (ATR) accessory. ATR principle is based on a reflectance measurement; then, roughly prepared samples such as wood transversal shavings can be used. These have been therefore directly pressed under the crystal diamond of the device for the scans. Spectra were obtained by averaging 32 scans with a resolution of 2 cm−1 in a range of 4000 cm−1 to 400 cm−1. For each tested heartwood strip, 3 different wood shavings were scanned and considered as 3 repetitions. Spectra were then preprocessed using first a standard normal variate and, then, the first derivative with the Savitzky–Golay algorithm (polynomic order = 1; window = 7) using the mdatools package [32]. Regions of 800–1775 and 2810–3000 cm−1 were chosen to focus the analyses on relevant spectral information [33,34]. Average preprocessed spectra were calculated for each species and, then, D. sp. nov. spectra were subtracted from that of D. pachyphyllum to highlight the average differences between species.

2.9. Statistical Analyses

All statistical analyses and graphics were produced using RStudio (v 1.2.5001) [35]. Before the analyses, aberrant values (5 for lignin and 2 for hemicellulose) due to manipulation errors were removed from the datasets.

2.9.1. Conditional Inference Tree
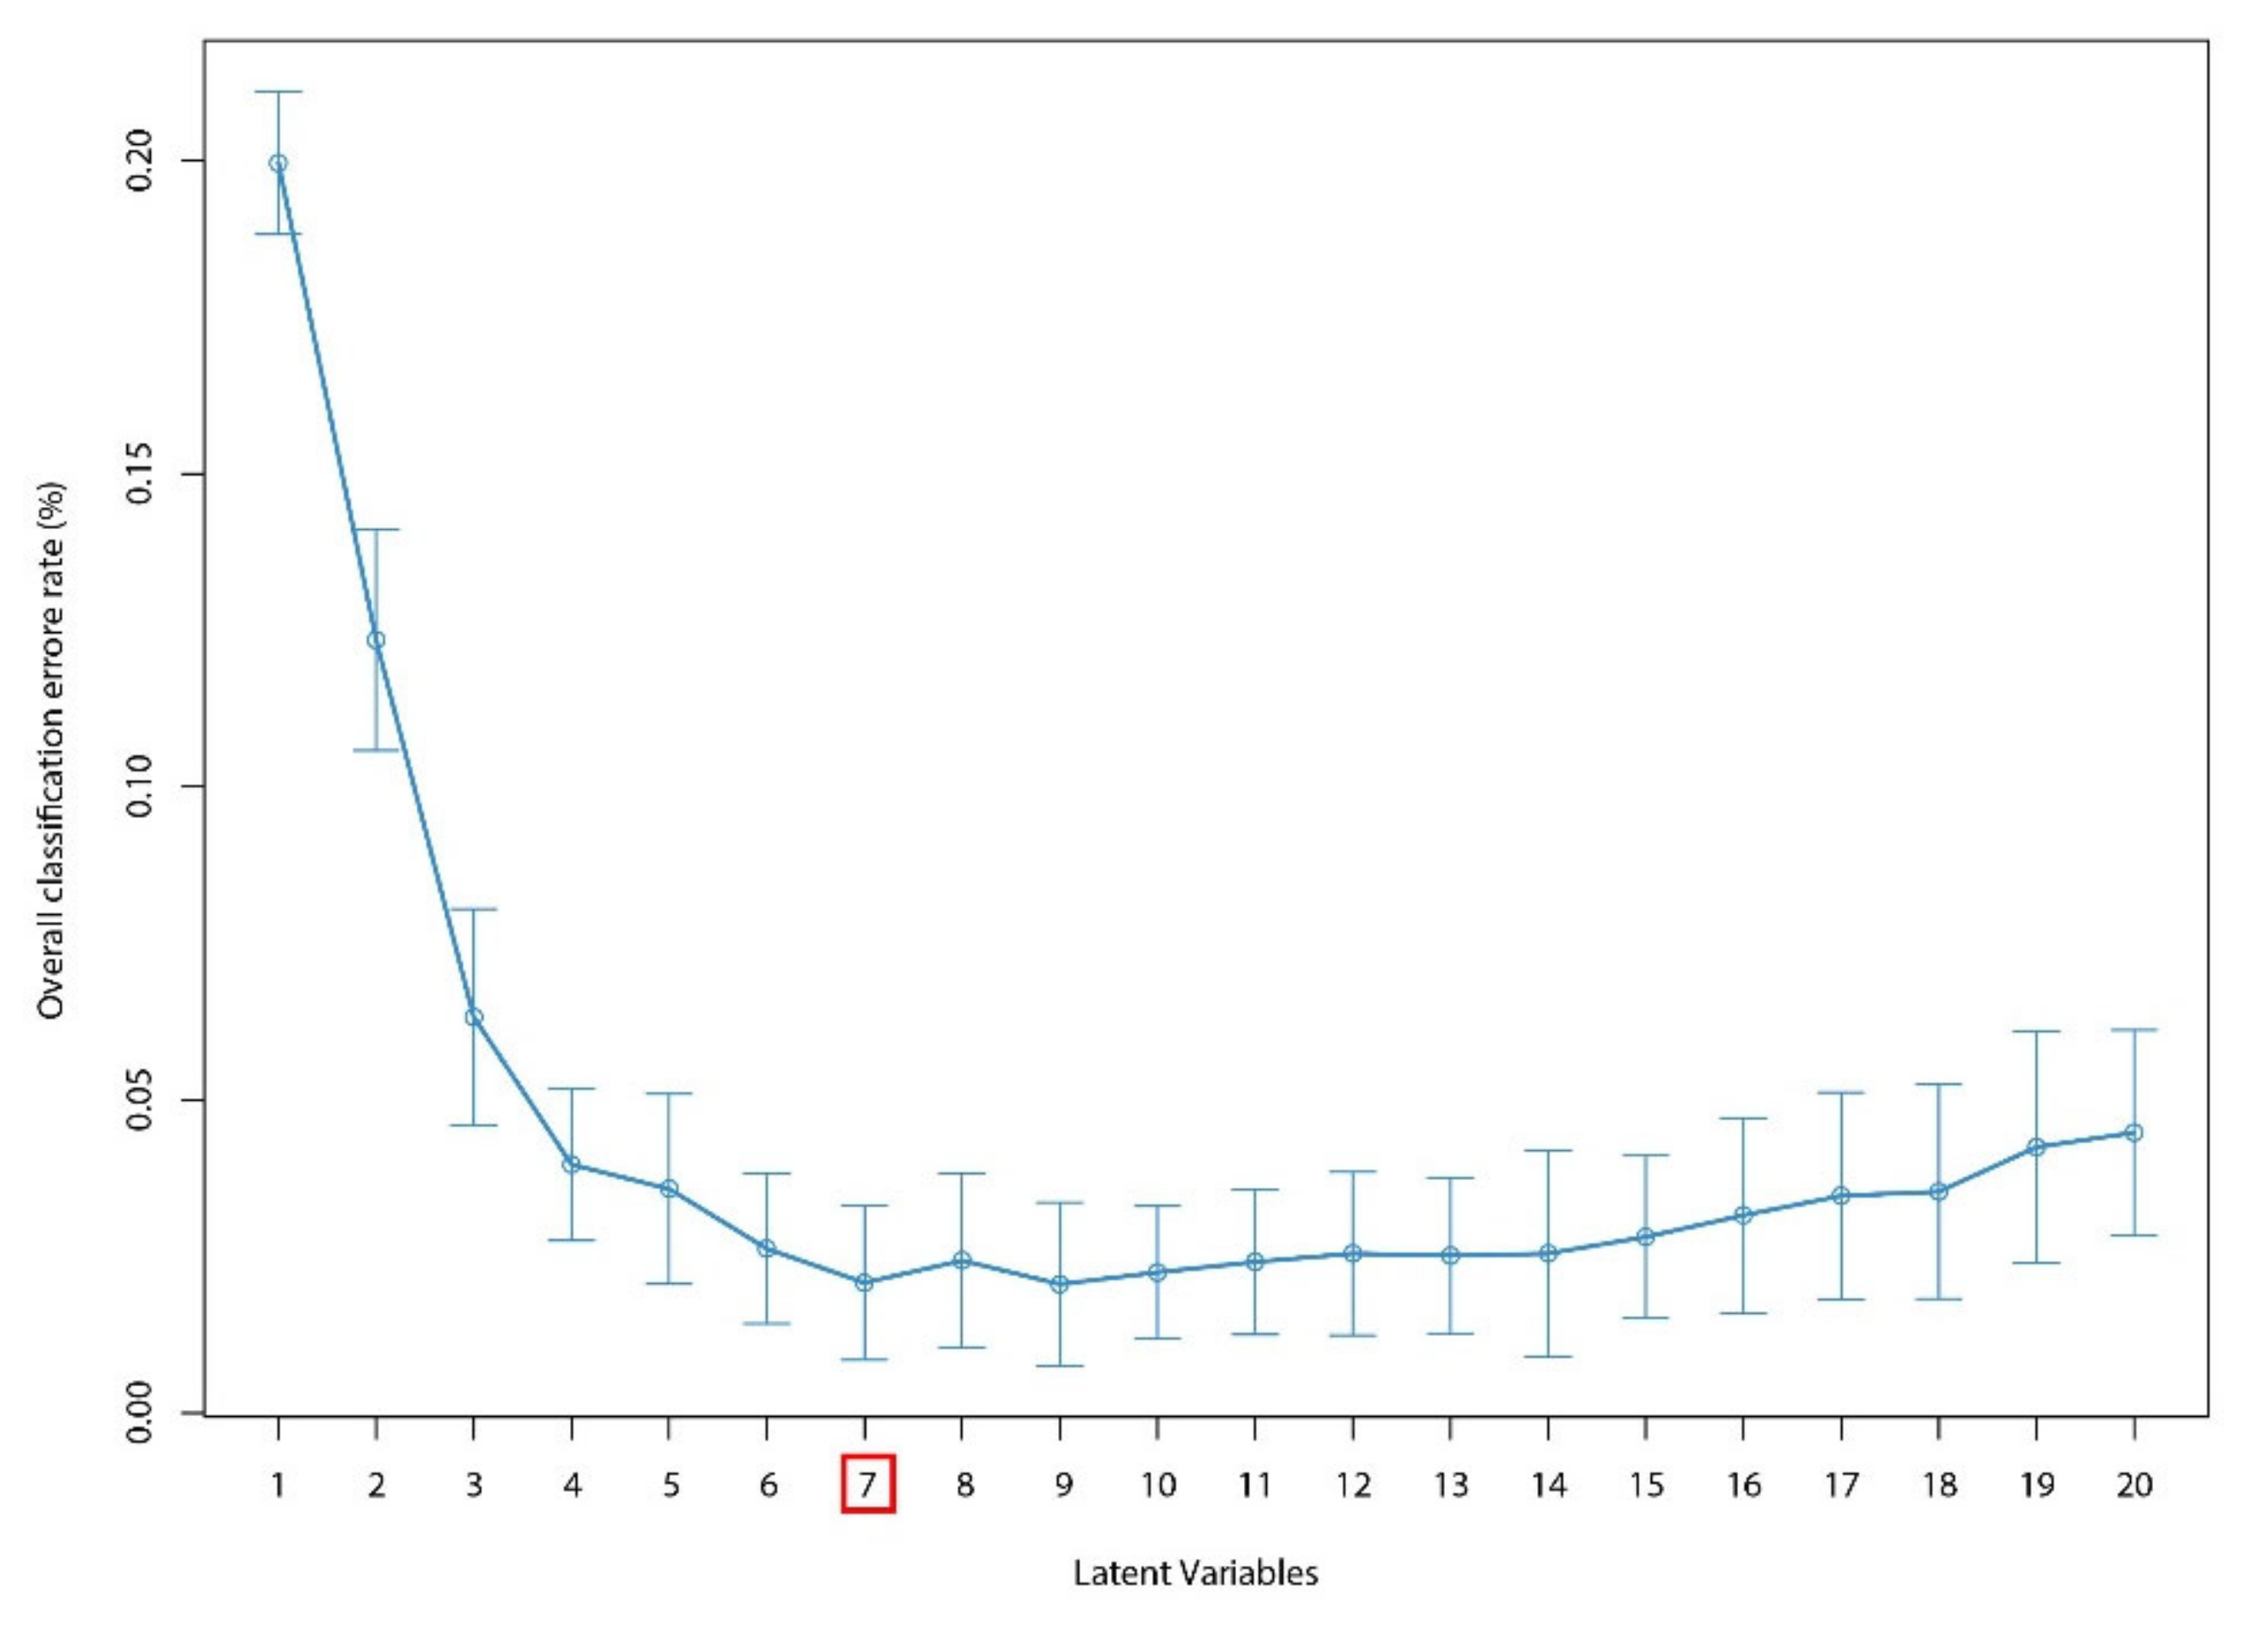
To highlight most discriminant leaf morphological traits that allow morphospecies identification, the Conditional Inference Tree (CIT) was used (ctree function from the partykit package [36]). This recursive partitioning method consists in testing the independence of all explicative variables (25 measured leaf traits) and the response variable (species determination) at each partitioning step. The variable that had the strongest association to the response value, and an association test p-value lower than the selected alpha (0.05), was selected and the population was segmented. Each subpopulation was submitted to the same procedure until getting homogenous populations (null hypothesis of the independence test accepted for all variables in each subpopulation). To counteract the negative effect of the “multiple comparisons problem” due to inferences, the Bonferroni correction was systematically applied.

2.9.2. PLS-DA

The Partial Least Square Regression Discriminant Analysis (PLS-DA) was used to discriminate D. pachyphyllum and D. sp. nov. based on their wood shaving FT-IR spectra. The outlier detection was carried out using Principal Component Analysis (PCA). Spectra were projected on PCs, score distance, and orthogonal distance were measured on the 5 first PCs accounting for 81.5% of the total variance. The region of acceptance proposed by [37] was used on distances and no outliers were found. Then, the dataset was divided into a training set (containing all preprocessed spectra from 3 trees of each species) and a validation set (containing the remaining spectra from the last trees of each species). Each set was composed by an explicative X matrix (FT-IR spectra) and a response Y matrix (species affiliation). To process PLS on a categorical Y, the matrix was first coded as dummy blocks. Then, using plsda and perf functions from the mixomics package [38], a PLS-DA model was fitted. The PLS-DA procedure aims to create a linear combination of variable from X, called Latent Variables (LVs), that maximize the covariance with Y. Scores of samples are calculated for those new variables and projected on the new LVs n-dimensional space, where n corresponds to the number of LVs. For each Y modality (D. sp. nov. and D. pachyphyllum) parameter (such as centroids) of the n-dimensional scores, a distribution is calculated. Using those parameters and a distance metric, it is possible to measure the distribution proximity of a new sample projected in the LVs space. Those distances to distributions are finally used to classify the samples. In this study, the Mahalanobis distance metric, which takes into account the shape of the distribution [39], was chosen. The optimal number of LVs to select (that explain most of the Y variance while avoiding overfitting) was assessed using a k-fold (fold = 5) cross-validation repeated a hundred times. This cross-validation processed tree operations for a hundred times: (i) five samples were randomly selected in the training set, (ii) the PLS-DA model was fitted on the remaining dataset for 20 LVs, (iii) the five samples were predicted by the model and the Overall Classification Error rate (OCE) is computed for each LVs of the model. After all repetitions, mean and standard deviation of OCE were measured for each LV. The lowest LV number that minimized the OCE was selected. During this procedure, the Variable Importance in Projection score (VIP score) confidence interval (α = 0.05) was calculated from its distribution for each variable on each selected LV. This interval was used to verify whether variable VIP scores were significantly higher than 1, the commonly used threshold to assess the importance of a variable in prediction [40]. Within LVs, VIP scores’ 95th percentile were also measured to identify variables that were situated among the 5% most important in the considered LV. After fitting the model on the training dataset, the validation set was predicted by it and a confusion matrix has been built. A confusion matrix allows to measure model accuracy and classes sensitivity/specificity.

2.9.3. Variance Analyses

Analysis of variance (ANOVA) was used to investigate leave trait differences between morphospecies but also the influence of wood (sapwood and heartwood) and sampling height (h1 and h2) on wood chemical properties. To confirm ANOVA preconditions, normality and homoscedasticity, the Ryan–Joiner and the Levene tests were used, respectively. If means were unequal, they were compared by using the post-HOC t-test (t). If the homoscedasticity precondition was not met, the non-parametric test of Kruskall–Wallis (χ2) was used and medians were compared by using the Wilcoxson–Mann–Whitney (W) test. The selected α was 0.05 for all analyses excepted when variable modalities to compare were superior to two. In this case, the Bonferroni correction was applied to limit the family-wise error rate. Those analyses were conducted using the rstatix package [41].

3. Results

3.1. Leaf Morphological Traits

3.1.1. Conditional Inference Tree

The algorithm only selected qualitative variables for the CIT construction (Figure 2). The first partition, based on venation type (variable independence test: p < 0.001) allowed discriminating all 15 D. pachyphyllum individuals that had a discrete tertiary venation from the 25 other trees. The second partition, based on terminal leaflet’s acumen shape (variable independence test: p = 0.024) produced a pure node with only D. lopense and a node with 68% of D. sp. and 32% of D. lopense. All individuals that presented leaves with a tight, prominent tertiary nervation and an obtuse/no acumen can therefore be predicted as D. lopense. However, trees which presented leaves with tight, prominent tertiary venation and a sharp, tapered or retuse acumen had 68% probability to belong to the D. sp. and 32% to D. lopense.

3.1.2. Variance Analyses

Variance analyses on quantitative variables highlighted many significant differences between D. lopense and D. sp. nov. (Figure 3). The mean width/length ratio of the basal leaflet was the most significant (t = 3.31, p = 0.0043), with 0.54 ± 0.08 and 0.45 ± 0.06 for D. lopense and D. sp. nov., respectively. The mean terminal leaflet width also differed (t = 2.96, p = 0.0073) between the two morphospecies, 51.93 ± 13.48 mm and 39.4 ± 8.63 mm respectively. The mean width/length ratio on terminal leaflet is higher (t = 2.64, p= 0.015) for D. lopense (0.44 ± 0.084) than for D. sp. nov. (0.37 ± 0.05). The median petiole/rachis ratio is lower (W = 38, p = 0.01) for D. lopense (0.25 ± 0.24) than for D. sp. nov. (0.49 ± 0.44). The mean length of terminal petiolule/length of terminal leaflet ratio is lower (t= −2.68, p = 0.012) for D. lopense (0.06 ± 0.02) than for D. sp. nov. (0.07 ± 0.02).
D. pachyphyllum only differed significantly (W = 59.5, p = 0.018) from D. sp. nov. based on a lower petiole/rachis ratio median (0.22 ±0.18 for D. pachyphyllum). It however varied from D. lopense in two traits. D. pachyphyllum had a higher (t = −2.24, p = 0.034) mean length of the terminal petiolule/length of terminal leaflet ratio (0.072 ± 0.022 and 0.057 ± 0.016, respectively, for D. pachyphyllum and D. lopense) and a higher (W = 35, p =0.013) basal leaflet length/terminal leaflet length ratio median (0.67 ± 0.11 and 0.58 ± 0.08, respectively, for D. pachyphyllum and D. lopense).

3.2. Chemical Composition

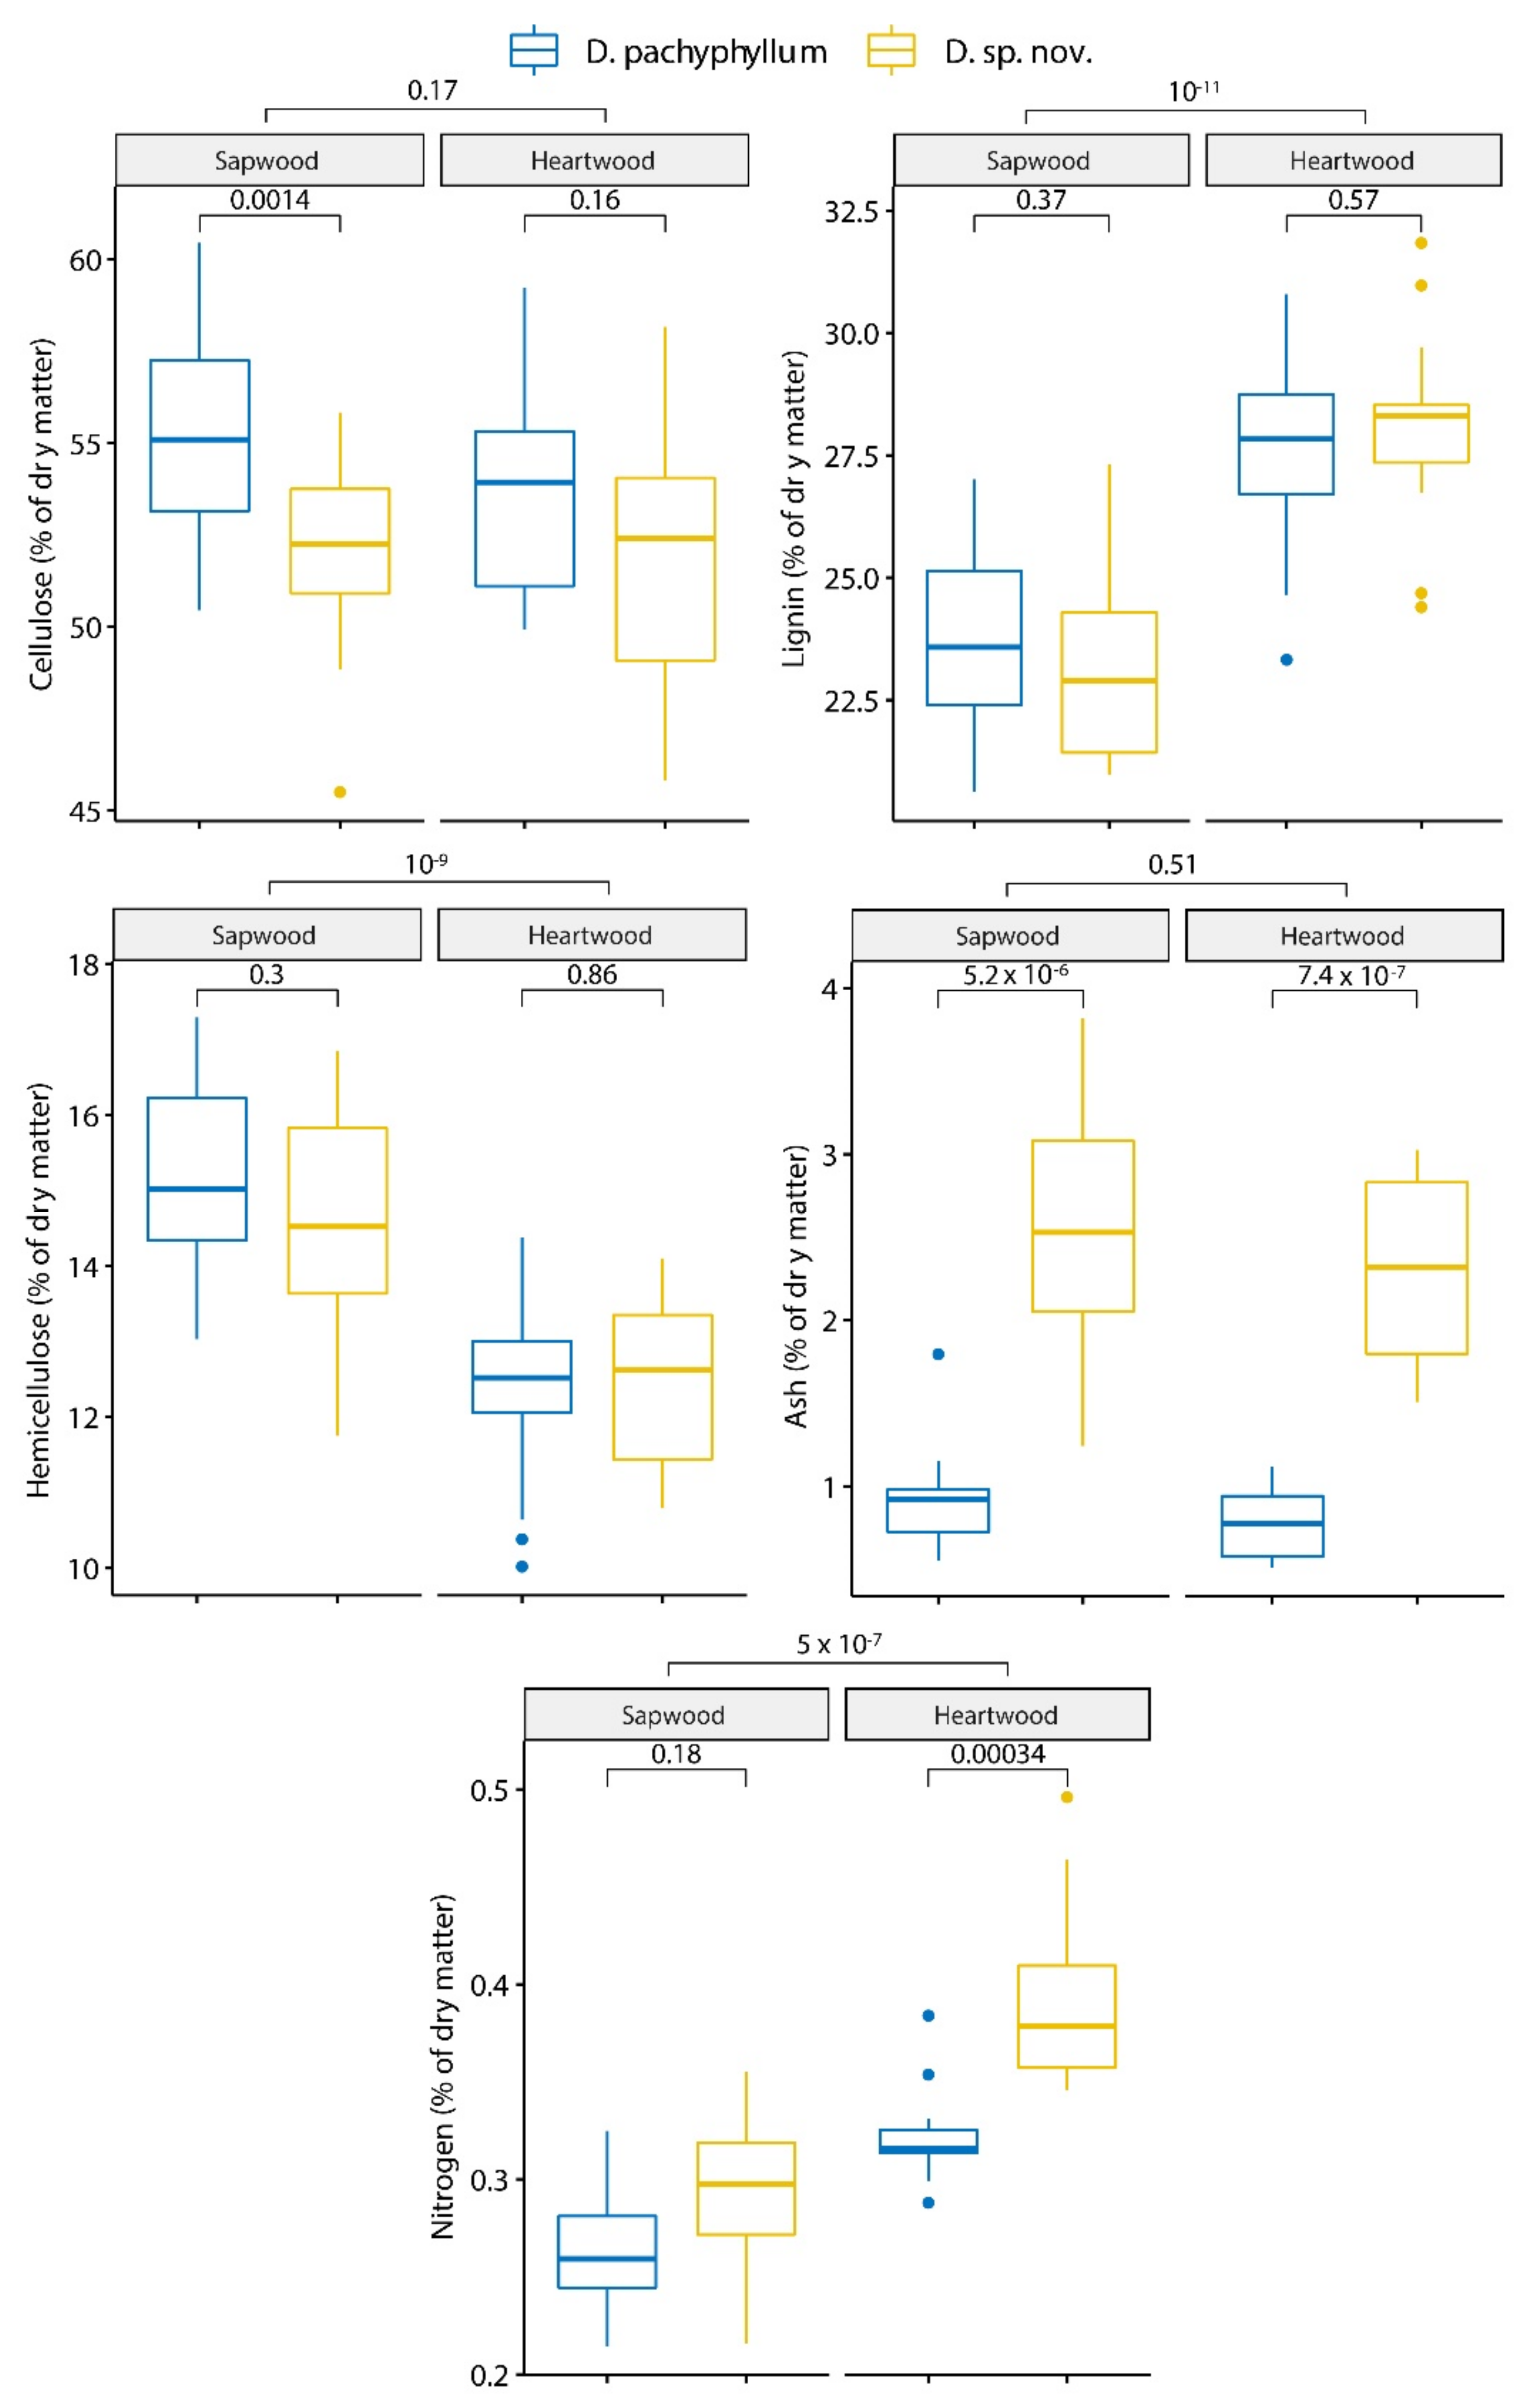
3.2.1. Primary Metabolites and Minerals

No significant effect of the sampling height was observed on primary metabolites. The mean cellulose content significantly differed (F = 3.56, p = 0.0014) between sapwood of D. pachyphyllum (55.4 ± 2.98%DM) and D. sp. nov. (52.0 ± 2.52%DM). The mean lignin content was significantly different between heartwood and sapwood (F = 72.3, p < 0.001) with a higher content in heartwood (27.9 ± 2.01%DM) than sapwood (23.5 ± 1.93%DM). As for lignin, the mean hemicellulose content was only significantly different between heartwood and sapwood (F = 54.4, p < 0.001). However, heartwood had a lower hemicellulose content (12.4 ± 1.14%DM) than sapwood (14.9 ± 1.4%DM).
The median ash content was significantly different (χ2 = 25.9, p < 0.001) between species (2.46 ± 0.78%DM and 0.90 ± 0.282%DM for D. sp. nov. and D. pachyphyllum, respectively). The median nitrogen content was significantly (χ2 = 25.9, p < 0.001) different within sapwood (0.28 ± 0.04%DM) and heartwood (0.35 ± 0.05%DM). The median of this metabolite also significantly differed (χ2 = 6.65, p= 0.009) between species: 0.31 ± 0.04%DM for D. pachyphyllum and 0.35 ± 0.07 for D. sp. nov. However, this difference between species was due to samples from heartwood for which species differentiation (0.32 ± 0.03%DM for D. pachyphyllum and 0.39 ± 0.05%DM for D. sp. nov.) was very significant (W = −4.53, p < 0.001) unlike sapwood (Figure 4).
The mean silicate content was higher in D. sp. nov. (2.42 ± 0.57%DM and 2.64 ± 0.59%DM for sapwood and heartwood, respectively) than D. pachyphyllum (1.23 ± 0.39%DM and 0.92 ± 0.22%DM for sapwood and heartwood, respectively).

3.2.2. Ethanol Extracts

Median extraction yields differed significantly (W = 698, p < 0.001) with the sampling height. Samples from the top of the stem had higher extraction yields (2.6 ± 1.0%DM) than samples at the bottom (2.2 ± 0.6%DM). D. sp. nov. sapwood (2.7 ± 0.7%DM) had a higher extraction yield (W = 158, p = 0.007) than D. pachyphyllum sapwood (2.13 ± 0.36%DM).
The mean PC was significantly affected by the three studied variables: for sampling height (F = 5.0, p = 0.028), for heartwood and sapwood (F = 77.4, p < 0.001), and for the species (F = 37.5, p < 0.001). The mean PC was lower at the lower sampling height (330 ± 84 GAE) than top of the stem (359 ± 11 GAE). The mean PC was higher for heartwood (402 ± 82 GAE) than sapwood (280 ± 72 GAE). Finally, it was lower for D. pachyphyllum (304 ± 93 GAE) than D. sp. nov. (384 ± 82 GAE). Figure 5 emphasizes the significant difference of mean PC between the two species for both sapwood (253 ± 72 GAE for D. pachyphyllum; 320 ± 57 GAE for D. sp. nov.) and heartwood (355 ± 83 GAE for D. pachyphyllum; 448 ± 4.6 GAE for D. sp. nov.).
The three variables also induced a significant variation of mean CTC: for sampling height (F = 4.5, p = 0.037), for heartwood and sapwood (F = 22.3, p < 0.001), and for species (F = 35.3, p < 0.001). The same PC variation pattern was observed: the mean CTC was lower at the lower sampling height (585 ± 265 CE and 677 ± 275 CE for lower and higher sampling height, respectively), higher for the heartwood (733 ± 248 CE and 528 ± 259 CE for heartwood and sapwood, respectively), and lower for D. pachyphyllum (502 ± 287 CE and 760 ± 185 CE for D. pachyphyllum and D. sp. nov., respectively). Figure 5 highlights the difference of mean CTC between the two species for both sapwood (385 ± 241 CE for D. pachyphyllum; 672 ± 190 CE for D. sp. nov.) and heartwood (619 ± 285 CE for D. pachyphyllum; 848 ± 132 CE for D. sp. nov.).

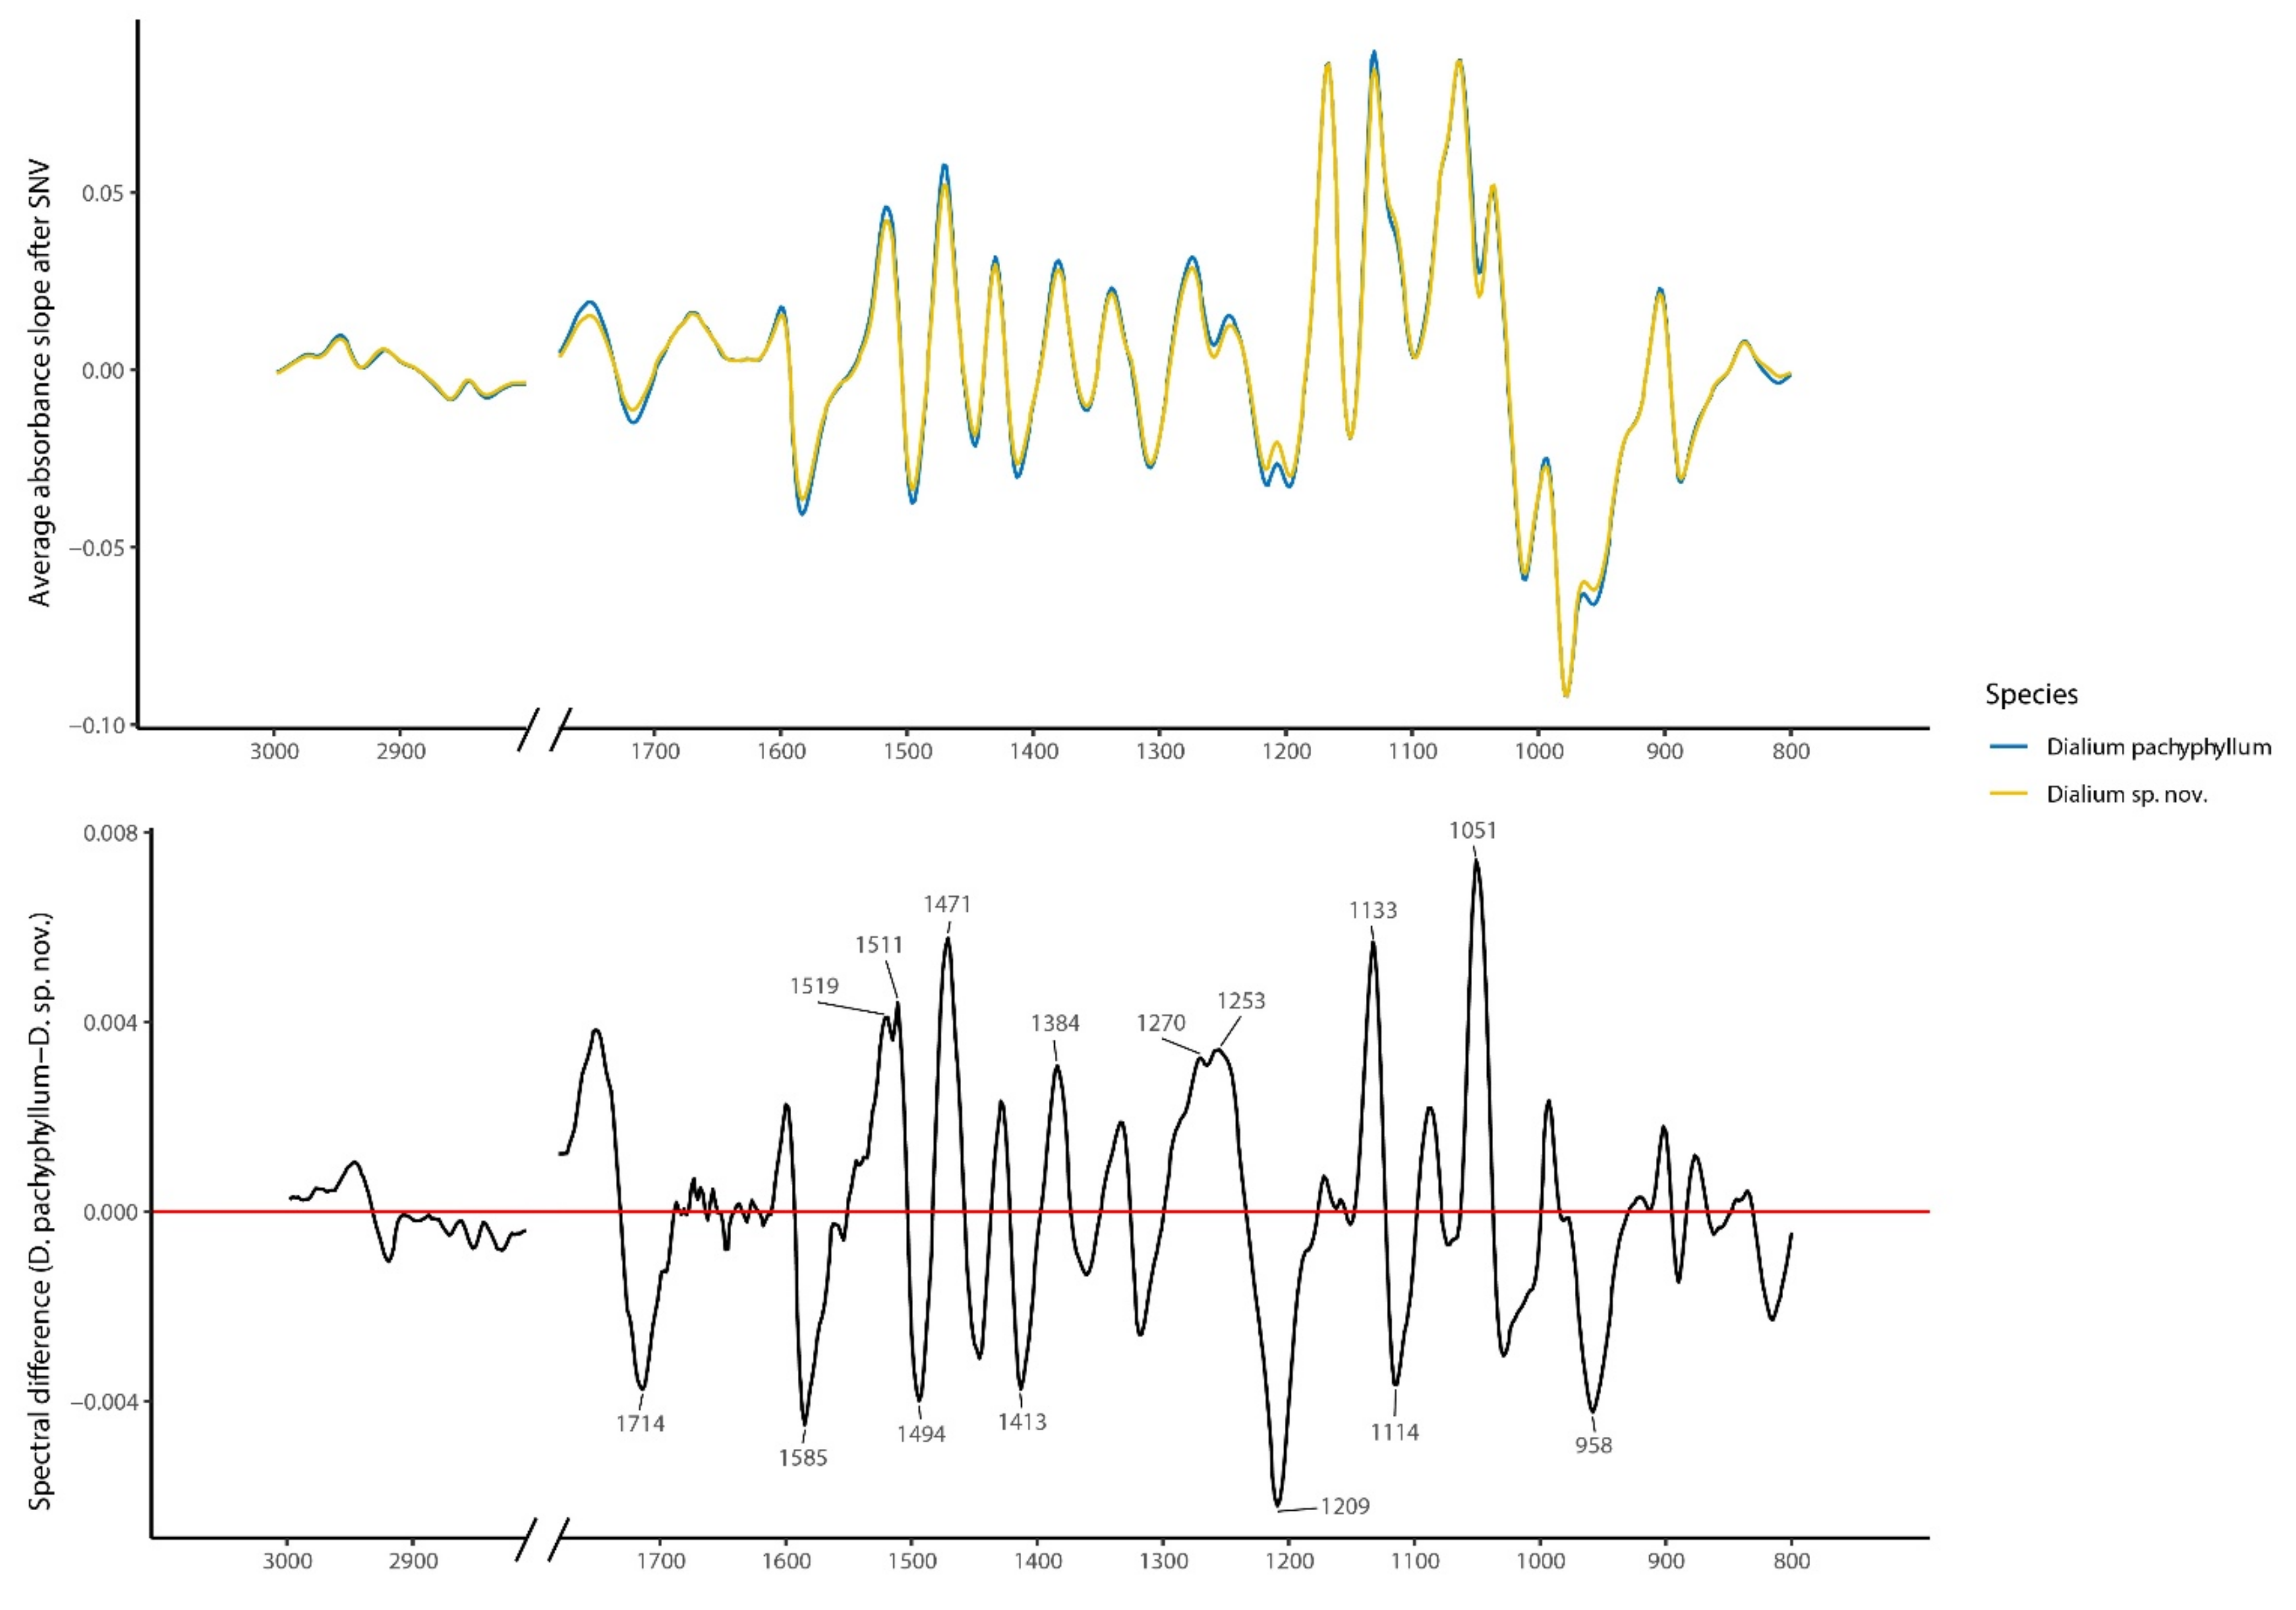
3.2.3. Wood FT-IR Distinction

Average preprocessed spectra for each species are presented in Figure 6. The spectral differences (Δ) highlight 15 wavenumbers that present high peaks. The PLS-DA model was fitted using 7 LVs which reached an average OCE of 2% during the cross-validation procedure (Figure 7). After predicting the validation set, composed with an independent tree of each species, the accuracy (29/30) of 96.6% is close to cross-validation (Table 4). The sensitivity and specificity of D. pachyphyllum are, respectively, 93.8% and 100%. For D. sp. nov., specificity and sensitivity are 100% and 87.5%, respectively. Those results highlight a high accuracy of the model and a low risk of predicting D. sp. nov. as D. pachyphyllum.
Table 5 compares the wavenumbers identified by the spectral difference (Δ) and their importance in the prediction model. The 1051 cm−1 shows the largest peak difference and reaches the top 5% of VIP scores for each LV. This variable therefore highly participated to species distinction. According to the literature, this band can be attributed to the C-H stretching bond from tannins (Terminalia chebula (Gaertner) Retz., Caesalpinia spinosa (Molina) Kuntze, and Schinopsis lorentzii Engl. tannin extracts in their study [42]). The 1114 cm−1 peak, although not the highest Δ, reaches top 5% VIP scores of 6 LVs and strongly contributes to the predictive model. As for the previous band, this wavenumber can be attributed to tannins (C-H bending observed in S. lorentzii and Castanea sativa Mill. extracts [42]). In opposition, the 1253 cm−1 and 1270 cm−1 peaks did not show VIP scores significantly higher than 1, except for LV1 and 2, respectively. Those wavenumbers, assigned to lignin bonds, are not important in the discriminant model. Wavenumbers from 1714 cm−1 to 1511 cm−1 were assigned to bonds in lignin or phenols. Except the 1511 cm−1 band for LV5 and LV6, this range presents a significant importance in species differentiation. Peaks at 1413, 1471, and 1494 cm−1 had VIP scores higher than 1 and reached the top 5% for 1413 cm−1 on LV1 and 1471 cm−1 on LV1 and LV2. Those bands are associated to lignin bonds. The 1209 band, assigned to a cellulose bond, has a high Δ and a significant importance in all LVs. The two last bands investigated, 1133 and 958 cm−1, are less important in the model (VIP scores around 1 or not higher) while presenting a medium Δ.

4. Discussion

4.1. Species Distinction in Forest Inventories

Species discrimination criteria based on leaf morphology is frequently used in the Fabaceae family [53,54] and, particularly in the Dialium genus [55]. Furthermore, during field surveys, reproductive characteristics are generally not visible and only trunks and leaves can be observed. Leaves in Dialium can contribute to distinguishing species from each other [56]. For example, distinction of Dialium heterophyllum from other species in the Amazonian Basin is done by its reduced rachis and unifoliate to trifoliate leaves [20]. Using the 7 significant leaf traits to classify this species seems therefore relevant. Table 6 presents the identification key for the 3–5 leaflets Dialium species that occur in the study area.

4.2. Wood Chemical Properties and Their Variation

4.2.1. Primary Metabolites and Minerals

As Mbagou (2017) already observed, sampling height has no influence on structural primary metabolites [57]. However, many differences can be observed considering the radial position of the sample. Indeed, considering both species, the lignin content was 4.4%DM higher in heartwood than sapwood. This pattern was already observed by many authors [58,59,60]. Hemicellulose varies oppositely and, considering both species, is on average 2.5%DM lower in heartwood than sapwood. The difference is less pronounced but remains encountered in the literature [60].
The highest cellulose content (55.4%DM) was obtained from the sapwood of D. pachyphyllum which appears to reach higher values than generally observed in African tropical woods. According to Gérard et al., (2019), the average is 42.2%DM, and the maximum observed is 58.1%DM [28]. For instance, Aucoumea klaineana present a cellulose content of 46.1%DM [61], Lophira alata Banks ex C.F. Gaertn. of 40.0%DM [28]. This difference could be explained by the cellulose determination method. Heartwood lignin content (27.9%DM in average) did not significantly differ between species and was a bit lower than in other tropical woods for both species. Gérard et al., (2019) measured an average lignin content of 29.2%DM for 549 tropical species tested [28]. Nuopponen et al., (2006) reported that the lignin content of tropical hardwoods can exceed that of softwoods and reach between 29%DM and 41%DM [62]. Hemicellulose did not differ between species. Heartwood hemicellulose content seems comparable to the average pentosane content (major constituent of hemicellulose) for tropical hardwood of 15.9%DM [28]. Ash content was significantly higher in D. sp. nov. which had a high value (2.46%DM) compared to other tropical species that, on average, have 1.1%DM [28]. Concerning nitrogen content, D. sp. nov. heartwood has the highest value which is almost twice the average of 0.24%DM observed for 59 Panamanian tree species [63]. Results about silica content follow the same pattern. D. sp. nov. has twice more silica content in sapwood (2.42%DM) and nearly three times more in heartwood (2.64%DM) than D. pachyphyllum. Both species had a very high silica content according to the 0.1%DM average silica content of 599 hardwoods [28].

4.2.2. Ethanol-Water Extracts

Extract yields were higher at the top of the stem for both species. Gérardin et al., (2020) also obtained higher yields for water-ethanol extracts at the top of the trees [64]. Concerning species distinction, extracts yields were higher in D. sp. nov. sapwood. However, using the same extraction method, several authors obtained higher yields than observed for both species. Saha Tchinda (2015), using hot water as solvent, obtained 8.4%DM from Baillonella toxisperma Pierre heartwood and 3.8%DM for Distemonanthus benthamianus Baill. heartwood. PC and CTC are significantly higher in the heartwood than sapwood. Those results are probably species-dependent since Engozogho et al., (2020) reported higher polyphenol and tannin levels in sapwood (2 ± 0.8%DM) than heartwood (0.7 ± 0.1%DM) of Aucoumea klaineana, whereas Mbagou et al., (2017) bring out significant higher PC in heartwood than sapwood for Tessmania Africana Harms, and Bikoro et al., (2018) had significantly more PC in sapwood but significantly more CTC in heartwood of Khaya ivorensis A. Chev. [65]. Considering species variation, D. sp. nov. has higher PC and CTC than D. pachyphyllum. According to Nisca et al., (2021), those metabolite are interesting to discriminate species [66]. D. sp. nov. heartwood PC is comparable to Pterocarpus soyauxii Hooker acetone extract (430 GAE) and both species have higher PC than Baillonella toxisperma for the acetone extract [67].

4.3. FT-IR Wood Distinction

The high accuracy of the PLS-DA model (96.6%) on two independent trees of the training set added to the significant differences in analytical metabolite measurements, and proves the difference in wood composition between the two species. As already highlighted by Wang et al., (2016), spectroscopy is an adapted tool to discriminate closely related species as Dalbergia spp. [34]. However, the interpretation of the spectra without the use of statistical techniques can be hazardous. Indeed, as it has been shown, the peak differences observed on the average spectra are not always associated to discriminant bands. This can come from a high intra-species variation being greater than inter-species variation. Knowing this, it is likely that the peaks at 1270 and 1253 cm−1, despite a high Δ, present a large inter-species variation that do not allow discrimination. The peak at 1114 cm−1 assigned to tannin bonds, has the same delta but its importance in the predictive model might be due to low intra-species variations. The higher Δ peak at 1051 cm−1 is the most interesting because it represents the greatest average difference between the species and participates very strongly in the PLS-DA model. Added to the significant difference in CTC between Dialium species, those results are in lines with Nisca et al., (2021) to highlight the efficiency of this class of molecule in the distinction of closely related species.

4.4. Impacts on Tree Ecology, Forest Management, and Wood Production

Leaf traits are highly correlated to tree ecology [68]. For instance, venation density significantly influences water management [69] and, therefore, tree light strategy. According to Martin A. et al., (2014), wood nitrogen content is negatively correlated to the relative growth rate and higher values could correspond to late successional species [63]. As those two traits significantly discriminate the studied Dialium species, their ecology might differ. Consequently, D. sp. nov. should be discriminated in annual monitoring plots on the study site and its population dynamic should be separately modelled from the other species. Once population dynamic parameters will be known, management practices should be adapted. Moreover, before any valuation of the wood, the conservation status of the species, in relation to its distribution area, should be specified.
Wood properties are directly related to chemical composition [70]. The cellulose proportion variation between D. sp. nov. and D. pachyphyllum could therefore lead to differences in mechanical properties [71]. The silica content increases resistance to marine borers [72] while PC, CTC, and suberin increase durability against fungi [73,74,75]. However, silica content is highly abrasive and increases sawing difficulties [14]. To know if the species should be promoted to a different timber sector, it will be interesting to check whether the difference in chemical properties induces a significant difference in wood properties and processing.
Dialium pachyphyllum has a wide distribution in Central Africa while Dialium lopense is restricted to Gabon [14]. As this new species has not yet been described, its area of occurrence as well as its exploitation potential are not known. If those are restricted, it may be interesting to control the production of this species. This control can be done through customs checks before export. In view of the ease of preparation of shavings chips and the accuracy of the model, these techniques could be used routinely to identify wood packages. However, this requires a large increase in the number of individuals to train the model to capture inter-specific variation. In addition, the model should favor a sensibility of 100% for D. sp. nov. to avoid classifying the samples into another species.

5. Conclusions

This study brought out many results that support the existence of a new Dialium species. Using 7 significant leaf traits to discriminate D. sp. nov. from other 3–5 Dialium leaflets, an identification key was proposed for forest inventories. A total of nine significant differences in chemicals properties were highlighted (five in sapwood and four in heartwood). The PLS-DA model trained on heartwood shavings FT-IR spectra accurately discriminate D. sp. nov. from D. pachyphyllum. Those outcomes may have consequences on the newly discovered morphospecies ecology, population dynamic, wood properties, and timber production potential. It is therefore advisable to investigate those aspects along with the study of its reproductive system before considering its large-scale logging.

Author Contributions

Conceptualization, R.D., G.B.B., M.R. and J.-L.D.; methodology, A.R., J.-L.D. and I.V.D.V.; FT-IR data acquisition, R.D.; FT-IR data statistical analysis, R.D.; chemical data collection, R.D. and I.V.D.V.; chemical data statistical analysis, R.D.; leaves traits data collection, M.R., R.D., J.-L.D. and G.B.B.; leaves traits statistical analysis, M.R.; validation, A.R., B.L., J.-L.D., J.A.F.P. and A.S.; formal analysis, R.D.; writing—original draft preparation, R.D., G.B.B. and M.R.; writing—review and editing, A.R., B.L., J.-L.D., J.A.F.P., A.S., B.J. and P.L.; supervision, A.R., P.L., B.J. and J.-L.D.; funding acquisition, J.-L.D. All authors have read and agreed to the published version of the manuscript.

Funding

The research was supported by the Identification d’Essences à Haut Potential de Valorisation (EHPval) project, funded by the Programme de Promotion de l’Exploitation Certifiée des Forêts (PPECF).

Data Availability Statement

Datasets will be deposited on DRYAD after paper acceptance.

Acknowledgments

We are grateful to PW–CEB, especially Monnet Vincent, Nna Ekome Stévy, Assam Augustin, Bokomba Jean-Bosco, Mboulamab Jean Arnisse for harvesting/sending the wood material and for logistical support during herbarium collection. We are grateful to the Ministère des Eaux et Forêts du Gabon (MINEF) for delivering the export license, and to the Centre national de la Recherche Scientifique (CENAREST) for giving authorization to do research in Gabon. We are also grateful to the botanical garden of Meise for lending their herbarium and particularly to Janssens Steven, De Smedt Sofie, and Bogaerts Ann for their help. We thank the 1st master students of Gembloux Agro-Bio Tech (academic year 2020–2021) for their help in primary metabolites data collection. We more specifically thank Groignet Eric, Kammoun Maroua, Werrie Pierre-Yves, De Crane d’Heysselaer Simon, Berchem Thomas, Istasse Thibaut, Morin Sophie, and Dumoulin Lionel for their advices in chemical data collection and interpretation. We thank Maesen Philippe and the BEAGx lab for the silica dosage. We would also like to thank Kayoka Mukendi Nicaise, Baetten Vincent, Vincke Damien, Arnould Quentin, Stevens François, Plasman Lisa from CRA-W for their help in spectroscopy understanding and their support in spectral acquisition.

Conflicts of Interest

The work is all original research carried out by the authors. All authors agree with the content of the manuscript and its submission to the journal. No part of the research has been submitted nor published in any form in this journal or elsewhere. The manuscript is not being considered for publication elsewhere while it is being considered for publication in this journal. All sources of funding are acknowledged in the manuscript, and authors have no financial benefits that could result from publication.

Appendix A

Table A1. Herbarium information. Herbarium reference that mentions the “BR00000” prefix comes from the botanical garden of Meise (Belgium), “field” corresponds to the herbarium collected in PW-CEB forest for this study.
HarvesterHerbaria ReferenceDateIdentificationCountry
de WildeBR000001656450319-12-96Dialium lopenseGabon
BretelerBR000001656453423-01-99Dialium lopenseGabon
WieringaBR000001656458917-11-94Dialium lopenseGabon
WieringaBR000001656457202-04-04Dialium lopenseGabon
BretelerBR000001656452705-02-99Dialium lopenseGabon
BretelerBR000001656454117-02-99Dialium lopenseGabon
Doucet J-LBR000001656455801-05-96Dialium lopenseGabon
WilkBR000001656456517-05-87Dialium lopenseGabon
McPhersonBR000001656459622-11-93Dialium lopenseGabon
McPhersonBR000001656460218-05-92Dialium lopenseGabon
McPhersonBR000001656462615-05-92Dialium lopenseGabon
Bibang & Doucet J-L.field30-03-21Dialium lopenseGabon
Doucet R.field17-06-21Dialium lopenseGabon
Doucet R.fieldMay 2019Dialium lopenseGabon
McPhersonBR000001363601204-05-92Dialium pachyphyllumDRC
TshibambaBR000001363961701-07-11Dialium pachyphyllumDRC
van de BurgtBR000001363963112-09-11Dialium pachyphyllumGabon
WieringaBR000001363582416-11-94Dialium pachyphyllumGabon
WieringaBR000001363591631-10-03Dialium pachyphyllumGabon
Doucet R.fieldMay 2019Dialium pachyphyllumGabon
Doucet R.field16-06-21Dialium pachyphyllumGabon
Doucet R.field17-06-21Dialium pachyphyllumGabon
Doucet R.field19-06-21Dialium pachyphyllumGabon
Bibang & Doucet J-L.field30-03-21Dialium sp. nov.Gabon
Bibang & Doucet J-L.field31-03-21Dialium sp. nov.Gabon
Doucet R.fieldMay 2019Dialium sp. nov.Gabon
Doucet R.field17-06-21Dialium sp. nov.Gabon
Doucet R.field19-06-21Dialium sp. nov.Gabon

References

  1. Biwolé, A.B.; Ouédraogo, D.-Y.; Betti, J.L.; Picard, N.; Rossi, V.; Delion, S.; Lagoute, P.; Gourlet-Fleury, S.; Lejeune, P.; Doucet, J.-L. Dynamique des populations d’azobé, Lophira alata Banks ex C. F. Gaertn., et implications pour sa gestion durable au Cameroun. Bois Forets Des Trop. 2019, 342, 55–68. [Google Scholar] [CrossRef]
  2. Karsenty, A.; Gourlet-Fleury, S. Assessing Sustainability of Logging Practices in the Congo Basin’s Managed Forests: The Issue of Commercial Species Recovery. Ecol. Soc. 2006, 11, art26. [Google Scholar] [CrossRef]
  3. FRM. Vision Stratégique et Industrialisation de la Filière Bois dans les 6 Pays du Bassin du Congo, Horizon 2030; FRM: Montpellier, France, 2018. [Google Scholar]
  4. Doucet, J.-L. L’alliance Délicate de la Gestion Forestière et de la Biodiversité dans les Forêts du Centre du Gabon. Ph.D. Thesis, Université de Liège, Gembloux Agro-Bio Tech, Gembloux, Belgium, 2003. [Google Scholar]
  5. Kleinschroth, F.; Gourlet-Fleury, S.; Sist, P.; Mortier, F.; Healey, J.R. Legacy of logging roads in the Congo Basin: How persistent are the scars in forest cover? Ecosphere 2015, 6, 64. [Google Scholar] [CrossRef] [Green Version]
  6. Edwards, D.P.; Magrach, A.; Woodcock, P.; Ji, Y.; Lim, N.T.L.; Edwards, F.A.; Larsen, T.H.; Hsu, W.W.; Benedick, S.; Khen, C.V.; et al. Selective-logging and oil palm: Multitaxon impacts, biodiversity indicators, and trade-offs for conservation planning. Ecol. Appl. 2014, 24, 2029–2049. [Google Scholar] [CrossRef]
  7. Edwards, D.P.; Laurance, W.F. Biodiversity Despite Selective Logging. Science 2013, 339, 646–647. [Google Scholar] [CrossRef]
  8. Cerutti, P.O.; Lescuyer, G.; Tacconi, L.; Eba’a Atyi, R.; Essiane, E.; Nasi, R.; Tabi Eckbil, P.P.; Tsanga, R. Social impacts of the Forest Stewardship Council certification: An assessment in the Congo basin. Int. For. Rev. 2017, 19, 50–63. [Google Scholar] [CrossRef]
  9. Burivalova, Z.; Hua, F.; Koh, L.P.; Garcia, C.; Putz, F. A Critical Comparison of Conventional, Certified, and Community Management of Tropical Forests for Timber in Terms of Environmental, Economic, and Social Variables. Conserv. Lett. 2017, 10, 4–14. [Google Scholar] [CrossRef] [Green Version]
  10. FSC. FSC Forest Stewardship Council Standard for the Congo Basin; Forest Stewardship Council A.C.: Bonn, Germany, 2012. [Google Scholar]
  11. Putz, F.E.; Zuidema, P.A.; Synnott, T.; Peña-Claros, M.; Pinard, M.A.; Sheil, D.; Vanclay, J.K.; Sist, P.; Gourlet-Fleury, S.; Griscom, B.; et al. Sustaining conservation values in selectively logged tropical forests: The attained and the attainable. Conserv. Lett. 2012, 5, 296–303. [Google Scholar] [CrossRef] [Green Version]
  12. Sist, P.; Piponiot, C.; Kanashiro, M.; Pena-Claros, M.; Putz, F.E.; Schulze, M.; Verissimo, A.; Vidal, E. Sustainability of Brazilian forest concessions. For. Ecol. Manag. 2021, 496, 119440. [Google Scholar] [CrossRef]
  13. Gérard, J.; Guibal, D.; Paradis, S.; Cerre, J.-C. Tropical Timber Atlas; Quae: Versailles, France, 2017. [Google Scholar]
  14. Bengono, G.B.; Souza, A.; Tosso, F.; Doucet, R.; Richel, A.; Doucet, J.-L. Les Dialium de la région guinéo-congolaise (synthèse bibliographique). BASE 2021, 25, 172–191. [Google Scholar] [CrossRef]
  15. Ruwet, M. Caractérisations Morphologiques, Spectrales et Génétiques des Eyoum (Dialium spp.). Master’s Thesis, Université de Liège, Gembloux Agro-Bio Tech, Gembloux, Belgium, 2021. [Google Scholar]
  16. Allaby, M. A Dictionary of Ecology; Oxford University Press: Oxford, UK, 2010. [Google Scholar]
  17. Wieringa, J.J.; MacKinder, B.A. Novitates Gabonensis 79: Hymenostegia elegans and H. robusta spp. nov. (Leguminosae-Caesalpinioideae) from Gabon. Nord. J. Bot. 2012, 30, 144–152. [Google Scholar] [CrossRef]
  18. Kenfack, D.; Sainge, M.N.; Chuyong, G.B.; Thomas, D.W. The genus cola (Malvaceae) in Cameroon’s Korup national park, with two novelties. Plant Ecol. Evol. 2018, 151, 241–251. [Google Scholar] [CrossRef]
  19. Bissiengou, P.; Chatrou, L.W.; Wieringa, J.J.; Sosef, M.S.M. Taxonomic novelties in the genus Campylospermum (Ochnaceae). Blumea J. Plant Taxon. Plant Geogr. 2013, 58, 1–7. [Google Scholar] [CrossRef] [Green Version]
  20. De Azevedo Falcão, M.J.; De Freitas Mansano, V. Dialium heterophyllum (Fabaceae: Dialioideae), a new tree species from the Amazon. Phytotaxa 2020, 477, 47–59. [Google Scholar] [CrossRef]
  21. Gérard, J.; Guibal, D.; Paradis, S.; Vernay, M.; Beauchêne, J.; Brancheriau, L.; Châlon, I.; Daigremont, C.; Détienne, P.; Fouquet, D.; et al. Tropix 7; CIRAD: Montpelier, France, 2011. [Google Scholar]
  22. TerEA. Résumé du Plan D’aménagement. Compagnie Equatoriale des Bois. Precious Wood Gabon; TerEA (Terre Environnement Aménagement): Marseille, France, 2007. [Google Scholar]
  23. Van Soest, P.J.; Wine, R.H. Use of Detergents in the Analysis of Fibrous Feeds. IV. Determination of Plant Cell-Wall Constituents. J. AOAC Int. 1967, 50, 50–55. [Google Scholar] [CrossRef]
  24. Van Soest, P.J. Use of Detergents in the Analysis of Fibrous Feeds. II. A Rapid Method for the Determination of Fiber and Lignin. J. AOAC Int. 1990, 73, 491–497. [Google Scholar] [CrossRef]
  25. Chen, H.; Ferrari, C.; Angiuli, M.; Yao, J.; Raspi, C.; Bramanti, E. Qualitative and quantitative analysis of wood samples by Fourier transform infrared spectroscopy and multivariate analysis. Carbohydr. Polym. 2010, 82, 772–778. [Google Scholar] [CrossRef]
  26. Sluiter, A.; Hames, B.; Ruiz, R.O.; Scarlata, C.; Sluiter, J.; Templeton, D. Determination of Ash in Biomass; Renew; Energy Lab.: Golden, CO, USA; Laboratory Analytical Procedure (LAP): Golden, CO, USA, 2005. [Google Scholar]
  27. Sheppard, P.R.; Thompson, T.L. Effect of Extraction Pretreatment on Radial Variation of Nitrogen Concentration in Tree Rings. J. Environ. Qual. 2000, 29, 2037–2042. [Google Scholar] [CrossRef]
  28. Gérard, J.; Paradis, S.; Thibaut, B. Survey on the chemical composition of several tropical wood species. Bois Forets Des Trop. 2019, 342, 79–91. [Google Scholar] [CrossRef]
  29. Oreopoulou, A.; Tsimogiannis, D.; Oreopoulou, V. Extraction of Polyphenols from Aromatic and Medicinal Plants: An Overview of the Methods and the Effect of Extraction Parameters. In Polyphenols in Plants; Elsevier: Amsterdam, The Netherlands, 2019; pp. 243–259. [Google Scholar]
  30. Ainsworth, E.A.; Gillespie, K.M. Estimation of total phenolic content and other oxidation substrates in plant tissues using Folin-Ciocalteu reagent. Nat. Protoc. 2007, 2, 875–877. [Google Scholar] [CrossRef]
  31. Engozogho Anris, S.P.; Bi Athomo, A.B.; Safou Tchiama, R.; Santiago-Medina, F.J.; Cabaret, T.; Pizzi, A.; Charrier, B. The condensed tannins of Okoume (Aucoumea klaineana Pierre): A molecular structure and thermal stability study. Sci. Rep. 2020, 10, 1773. [Google Scholar] [CrossRef]
  32. Kucheryavskiy, S. mdatools—R package for chemometrics. Chemom. Intell. Lab. Syst. 2020, 198, 103937. [Google Scholar] [CrossRef]
  33. Hobro, A.J.; Kuligowski, J.; Döll, M.; Lendl, B. Differentiation of walnut wood species and steam treatment using ATR-FTIR and partial least squares discriminant analysis (PLS-DA). Anal. Bioanal. Chem. 2010, 398, 2713–2722. [Google Scholar] [CrossRef]
  34. Wang, S.N.; Da Zhang, F.; Huang, A.M.; Zhou, Q. Distinction of four Dalbergia species by FTIR, 2nd derivative IR, and 2D-IR spectroscopy of their ethanol-benzene extractives. Holzforschung 2016, 70, 503–510. [Google Scholar] [CrossRef]
  35. R Studio Team. RStudio: Integrated Development for R. RStudio; PBC: Boston, MA, USA, 2020. [Google Scholar]
  36. Hothorn, T.; Zeileis, A. Partykit: A modular toolkit for recursive partytioning in R. J. Mach. Learn. Res. 2015, 16, 3905–3909. [Google Scholar]
  37. Pomerantsev, A.L. Acceptance areas for multivariate classification derived by projection methods. J. Chemom. 2008, 22, 601–609. [Google Scholar] [CrossRef]
  38. Rohart, F.; Gauthier, B.; Signh, A.; Lê Cao, K.A. mixOmics: An R package for omics feature selection and multiple data integration. PLoS Comput Biol. 2017, 13, e1005752. [Google Scholar] [CrossRef] [Green Version]
  39. Mahalanobis, P.C. On the Generalised Distance in Statistics. Proc. Natl. Inst. Sci. India 1936, 2, 49–55. [Google Scholar]
  40. Chong, I.G.; Jun, C.H. Performance of some variable selection methods when multicollinearity is present. Chemom. Intell. Lab. Syst. 2005, 78, 103–112. [Google Scholar] [CrossRef]
  41. Kassambara, A. rstatix: Pipe-Friendly Framework for Basic Statistical Tests; (v 0.7.0); R Project for Statistical Computing: Vienna, Austria, 2021. [Google Scholar]
  42. Grasel, F.D.S.; Ferrão, M.F.; Wolf, C.R. Development of methodology for identification the nature of the polyphenolic extracts by FTIR associated with multivariate analysis. Spectrochim. Acta—Part A Mol. Biomol. Spectrosc. 2016, 153, 94–101. [Google Scholar] [CrossRef] [PubMed]
  43. González-Peña, M.M.; Hale, M.D.C. Rapid assessment of physical properties and chemical composition of thermally modified wood by mid-infrared spectroscopy. Wood Sci. Technol. 2011, 45, 83–102. [Google Scholar] [CrossRef]
  44. Yap, M.G.S.; Que, Y.T.; Chia, L.H.L. FTIR characterization of tropical wood–polymer composites. J. Appl. Polym. Sci. 1991, 43, 2083–2090. [Google Scholar] [CrossRef]
  45. Popescu, C.-M.; Jones, D.; Kržišnik, D.; Humar, M. Determination of the effectiveness of a combined thermal/chemical wood modification by the use of FT–IR spectroscopy and chemometric methods. J. Mol. Struct. 2020, 1200, 127133. [Google Scholar] [CrossRef]
  46. Backa, S.; Brolin, A.; Nilsson, T. Characterisation of fungal degraded birch wood by FTIR and Py-GC. Holzforschung 2001, 55, 225–232. [Google Scholar] [CrossRef]
  47. Shen, D.; Liu, G.; Zhao, J.; Xue, J.; Guan, S.; Xiao, R. Thermo-chemical conversion of lignin to aromatic compounds: Effect of lignin source and reaction temperature. J. Anal. Appl. Pyrolysis 2015, 112, 56–65. [Google Scholar] [CrossRef]
  48. Trilokesh, C.; Uppuluri, K.B. Isolation and characterization of cellulose nanocrystals from jackfruit peel. Sci. Rep. 2019, 9, 16709. [Google Scholar] [CrossRef]
  49. Abdul Latif, M.H.; Attiya, H.G.; Al–Abayaji, M.A. Lignin FT-IR study of Iraqi date palm Phoenix dactylifera frond bases wood. Plant Arch. 2019, 19, 327–332. [Google Scholar]
  50. Nuopponen, M.H.; Wikberg, H.I.; Birch, G.M.; Jääskeläinen, A.S.; Maunu, S.L.; Vuorinen, T.; Stewart, D. Characterization of 25 tropical hardwoods with fourier transform infrared, ultraviolet resonance raman, and13C-NMR cross-polarization/magic- angle spinning spectroscopy. J. Appl. Polym. Sci. 2006, 102, 810–819. [Google Scholar] [CrossRef]
  51. Huang, A.; Zhou, Q.; Liu, J.; Fei, B. Distinction of three wood species by Fourier transform infrared spectroscopy and two-dimensional correlation IR spectroscopy. J. Mol. Struct. 2008, 883–884, 160–166. [Google Scholar] [CrossRef]
  52. Özgenç, Ö.; Durmaz, S.; Boyaci, I.H.; Eksi-Kocak, H. Determination of chemical changes in heat-treated wood using ATR-FTIR and FT Raman spectrometry. Spectrochim. Acta—Part A Mol. Biomol. Spectrosc. 2017, 171, 395–400. [Google Scholar] [CrossRef]
  53. Pasquet, R.S. Classification infraspecifique des formes spontanees de Vigna unguiculata (L.) Walp. (Fabaceae) a partir de donnees morphologiques. Bull. Du Jard. Bot. Natl. Belg. 1993, 62, 127. [Google Scholar] [CrossRef]
  54. Vandrot, H. Nomenclature of the new caledonian genera arthroclianthus Baill. and nephrodesmus schindl. (Fabaceae-Desmodieae). Adansonia 2018, 40, 103–129. [Google Scholar] [CrossRef]
  55. Rojo, J.P. Studies in the Genus Dialium (Cassieae-Caesalpinioideae). Ph.D. Thesis, Oxford University, Oxford, UK, 1982. [Google Scholar]
  56. Zimmerman, E.; Prenner, G.; Bruneau, A. Floral ontogeny in Dialiinae (Caesalpinioideae: Cassieae), a study in organ loss and instability. S. Afr. J. Bot. 2013, 89, 188–209. [Google Scholar] [CrossRef] [Green Version]
  57. Bosco Mbagou, J. Variabilité Intra-Arbre des Propriétés Physico-Mécaniques Et Chimiques du Tessmania Africana en Provenance du Gabon. Ph.D. Thesis, Université de Laval, Québec, QC, Canada, 2017. [Google Scholar]
  58. Lourenço, A.; Neiva, D.M.; Gominho, J.; Marques, A.V.; Pereira, H. Characterization of lignin in heartwood, sapwood and bark from Tectona grandis using Py–GC–MS/FID. Wood Sci. Technol. 2015, 49, 159–175. [Google Scholar] [CrossRef]
  59. Adamopoulos, S.; Voulgaridis, E.; Passialis, C. Variation of certain chemical properties within the stemwood of black locust (Robinia pseudoacacia L.). Eur. J. Wood Wood Prod. 2005, 63, 327–333. [Google Scholar] [CrossRef]
  60. Lhate, I.; Cuvilas, C.; Terziev, N.; Jirjis, R. Chemical composition of traditionally and lesser used wood species from Mozambique. Wood Mater. Sci. Eng. 2010, 5, 143–150. [Google Scholar] [CrossRef]
  61. Doat, J. Etude papetière de l’Okoumé. Essais de laboratoire, semi-industriels et industriels (1re partie). Bois Forets Des Trop. 1972, 146, 31–52. [Google Scholar]
  62. Nuopponen, M.H.; Birch, G.M.; Sykes, R.J.; Lee, S.J.; Stewart, D. Estimation of wood density and chemical composition by means of diffuse reflectance mid-infrared fourier transform (DRIFT-MIR) spectroscopy. J. Agric. Food Chem. 2006, 54, 34–40. [Google Scholar] [CrossRef]
  63. Martin, A.R.; Erickson, D.L.; Kress, W.J.; Thomas, S.C. Wood nitrogen concentrations in tropical trees: Phylogenetic patterns and ecological correlates. N. Phytol. 2014, 204, 484–495. [Google Scholar] [CrossRef]
  64. Gérardin, P.; Fritsch, C.; Cosgun, S.; Brennan, M.; Dumarçay, S.; Colin, F.; Gérardin, P. Effet de la hauteur de prélèvement sur la composition quantitative et qualitative des polyphénols de l’écorce d’Abies alba Mill. Rev. For. Française 2020, 72, 411–423. [Google Scholar] [CrossRef]
  65. Bikoro Bi Athomo, A.; Engozogho Anris, S.P.; Safou-Tchiama, R.; Santiago-Medina, F.J.; Cabaret, T.; Pizzi, A.; Charrier, B. Chemical composition of African mahogany (K. ivorensis A. Chev) extractive and tannin structures of the bark by MALDI-TOF. Ind. Crops Prod. 2018, 113, 167–178. [Google Scholar] [CrossRef]
  66. Nisca, A.; Ștefănescu, R.; Stegăruș, D.I.; Mare, A.D.; Farczadi, L.; Tanase, C. Comparative Study Regarding the Chemical Composition and Biological Activity of Pine (Pinus nigra and P. sylvestris) Bark Extracts. Antioxidants 2021, 10, 327. [Google Scholar] [CrossRef]
  67. Tchinda Saha, J.-B.; Abia, D.; Dumarç Ay, S.; Kor Ndikontar, M.; Gérardin, P.; Noah, J.N.; Perrin, D. Antioxidant activities, total phenolic contents and chemical compositions of extracts from four Cameroonian woods: Padouk (Pterocarpus soyauxii Taubb), tali (Erythrophleum suaveolens), moabi (Baillonella toxisperma), and movingui (Distemonanthus benthamianus). Ind. Crops Prod. 2012, 41, 71–77. [Google Scholar]
  68. Poorter, L. Leaf traits show different relationships with shade tolerance in moist versus dry tropical forests. N. Phytol. 2009, 181, 890–900. [Google Scholar] [CrossRef]
  69. Sack, L.; Cowan, P.D.; Jaikumar, N.; Holbrook, N.M. The ‘hydrology’ of leaves: Co-ordination of structure and function in temperate woody species. Plant. Cell Environ. 2003, 26, 1343–1356. [Google Scholar] [CrossRef] [Green Version]
  70. Barnett, J.; Jeronimidis, G. Wood Quality and Its Biological Basis; Blackwell Publishing Ltd.: Carlton, VIC, Australia, 2003. [Google Scholar]
  71. Cruz, N.; Bustos, C.; Aguayo, M.G.; Cloutier, A.; Castillo, R. THM densification of wood. BioResources 2018, 13, 2268–2282. [Google Scholar]
  72. Dirol, D.; Deglise, X. Durabilité des Bois et Problèmes Associés; Hermès Science: Paris, France, 2001. [Google Scholar]
  73. Anouhe, B.J.S.; Niamké, F.B.; Faustin, M.; Virieux, D.; Pirat, J.L.; Adima, A.A.; Kati-Coulibaly, S.; Amusant, N. The role of extractives in the natural durability of the heartwood of Dicorynia guianensis Amsh: New insights in antioxydant and antifungal properties. Ann. For. Sci. 2018, 75, 15. [Google Scholar] [CrossRef] [Green Version]
  74. Scalbert, A. Tannins in Woods and Their Contribution to Microbial Decay Prevention. In Plant Polyphenols; Springer: Boston, MA, USA, 1992; pp. 935–952. [Google Scholar]
  75. Akai, S.; Fukutomi, M. Preformed Internal Physical Defenses. In How Plants Defend Themselves; Horsfall, J.G., Cowling, E.B., Eds.; Elsevier: Amsterdam, The Netherlands, 1980; pp. 139–159. [Google Scholar]
Figure 1. Field herbarium examples of Dialium pachyphullum Harms (a), Dialium sp. nov. (b) and Dialium lopense Breteler (c).
Forests 13 01339 g001
Figure 2. Conditional inference tree using the 25 leaf morphological variables to discriminate the 40 individuals for which all leaf traits could be measured.
Forests 13 01339 g002
Figure 3. Significant leaf morphological trait variations between Dialium pachyphyllum, Dialium sp. nov., and Dialium lopense. p-values for species comparison are related to t-tests (ratio w/l of the basal leaflet, terminal leaflet width, ratio length of terminal leaflet/length of petiolule) and Wilcoxon tests (ratio petiol/rachis, ratio basal leaflet length/terminal leaflet length).
Forests 13 01339 g003
Figure 4. Primary metabolite’s variation in heartwood and sapwood among the different studied species; p-values concerning heartwood and sapwood are related to ANOVA test (Cellulose, Lignin and Hemicellulose) and Kruskal–Wallis test (Ash and Nitrogen); p-values that compare species are related to the t-test (Cellulose, Lignin and Hemicellulose) and Wilcoxon’s test (Ash and Nitrogen).
Forests 13 01339 g004
Figure 5. Extract yields and extract composition variation in heartwood and sapwood among the different studied species. p-values concerning heartwood and sapwood are related to ANOVA test (Phenolic content and Condensed tannin content) and Kruskal–Wallis test (Extraction yields); p-values that compare species are related to the t-test (Phenolic content and Condensed tannin content) and Wilcoxon’s test (Extraction yields).
Forests 13 01339 g005
Figure 6. Upper plot presents average preprocessed (SNV + first derivatitive) spectrum of each species. The lower graph represents the difference (D. pachyphyllum-D. sp. nov.) between the average spectra. The 15 wavenumbers correspond to 15 high peaks of difference between the species.
Forests 13 01339 g006
Figure 7. Overall classification error rate from the cross-validation procedure. The number of LVs selected is red-circled.
Forests 13 01339 g007
Table 1. Leaf morphological traits investigated.
TraitUnits/Modalities
Petiole type“cylindrical”; “bulged”;
“canaliculated”
Petiole lengthmm
Rachis lengthmm
Foliole number-
Pilosity on the upper face“pubescent”; “glabrous”
Pilosity on the above face“pubescent”; “glabrous”
Curved margin“yes”; “no”
Acumen shape“oblong”; “elliptical”; “lanceolate”; “ovate”; “obovate”; “oblanceolate”; “falciform”
Asymmetric leaflet base“yes”; “no”
Tertiary venation“tight and prominent”; “discrete”
Translucent dots“yes”; “no”
Terminal leaflet lamina shape“no acumen”; “sharp”; “tapered”; “retuse”; “obtuse”; “truncated”; “emarginated”
Terminal leaflet lamina lengthMm
Terminal leaflet lamina widthmm
Basal leaflet lamina shape“no acumen”; “sharp”; “tapered”; “retuse”; “obtuse”; “truncated”; “emarginated”
Basal leaflet lamina lengthMm
Basal leaflet lamina widthMm
Coriaceous lamina“yes”; “no”
Twisted lamina“yes”; “no”
Petiolule lengthmm
Ratio petiole/rachis-
Ratio length/width of terminal leaflet-
Ratio length/width of basal leaflet-
Ratio basal leaflet length/terminal leaflet length-
Ratio terminal leaflet length/petiolule length-
Table 2. Dendrometric and environmental parameters of selected trees. Position: Em = “Emergent” and Can = “Canopy”; altitude (m); slope (°); p is stem perimeter (m); hp is the height at which the perimeter was measured (m); h1 is the sampling height at the base of the stem (m); h2 is the sampling height at the top of the stem (m); ht is the total tree height (m).
SpeciesTreePositionAltitudeSlopephph1h2ht
D. pachyphyllum1Em36903.302.21.312.043.0
2Can35853.103.11.610.241.0
3Em36002.906.12.017.142.0
4Em36502.861.31.714.046.5
D. sp. nov.1Can34803.605.12.718.943.0
2Em34302.603.31.919.639.0
3Em347302.652.42.521.042.0
4Can34502.552.81.816.744.5
Table 3. Experimental iterations on the four selected trees for each species and each modality combination of the studied variables, i.e., wood and sampling height.
Experimental Repetition (n)
TreeHemicelluloseCelluloseLigninNitrogenAsh
122233
222233
3222--
4222--
Table 4. Confusion matrix obtained by predicting the independent validation dataset.
D. pachyphyllumD. sp. nov.
PredictedD. pachyphyllum150
D. sp. nov.114
Table 5. Wavenumbers (W), expressed in cm−1, that present 15 large peak differences (× 10−3) between average species spectrum (Δ); Mean VIP scores from of PLS-DA model, shaded scores are upper to the 95th percentile of vip score within the LV, scores with n are not significantly higher than 1 according to the confidence interval from the cross-validation process; Bond: chemical bond assignement to the wavenumber; Mol corresponds to the molecular class in which the chemical bonds are found (L = Lignin, H = Hemicellulose, C = Cellulose, P = Polyphenol, T = Tannin); Ref. corresponds to references that mention the bond assignment.
WΔVIP ScoresChemical Bond AssignmentMolRef.
LV1LV2LV3LV4LV5LV6LV7
1714381.471.191.141.121.101.081.091712 cm−1: C=O groupsL[43]
1585451.621.281.251.221.211.201.181585 cm−1: Aromatic ring stretchingL[44]
1519411.561.291.221.201.191.161.151517 cm−1: Aromatic skeletal vibrationL[43]
1511441.371.131.071.051.04 n1.02 n1.051508–1513 cm−1: Aromatic skeletal vibrationL, T[42,43]
1494401.601.311.241.231.221.191.191495 cm−1: aromatic vibrationP, T[45]
1471581.771.401.331.321.301.281.261460–1470 cm−1: C-H vibrationL[46,47]
1413831.931.531.461.431.411.381.371413 cm−1: C=C aromaticL[48]
1384311.491.201.141.131.141.111.101384 cm−1: -OH bending of phenolic bondL[49]
1270321.09 n1.141.091.071.05 n1.03 n1.01 n1265 cm−1: C-O vibrationL[50,51]
1253331.070.89 n0.85 n0.84 n0.83 n0.82 n0.81 n1250 cm−1: C-O-C asymmetric stretchL[34]
1209621.501.211.151.131.111.101.091203–1210 cm−1: O-H bending C[52]
1133571.180.94 n1.07 n1.111.101.091.081134 cm−1: C-O-C glycosidic vibration of xylanH[50]
1114371.541.641.631.621.601.561.541112–1113 cm−1: C-H bending in planeT[42]
1051981.731.641.561.531.511.501.481050 cm−1: C-H stretching in planeT[42]
958421.331.12 n1.121.131.111.091.08 n957–961 cm−1: C-H aromatic out of plane deformation-[45]
Table 6. Identification key for 3–5 leaflets Dialium species present in PW-CEB forests; on the left side of the table, the sections with the observable traits are presented; on the right side is either the species classification corresponding to the observed trait, or the reference of the section to continue the identification key; the range of values presented for the quantitative variables, in the third section, corresponds to the interval in which 50% of the observations made during this study occurs for each species.
1.
-
Tight and prominent tertiary venation
2.
-
Discrete tertiary venation
D. pachyphyllum
2.
-
Sharp, tapered or retuse terminal leaflet acumen
3.
-
No terminal leaflet acumen or obtuse acumen
D. lopense
3.
-
Ratio width/length of the basal leaflet: [0.42–0.48]
-
Terminal leaflet width: [33–44] mm
-
Ratio width/length of the terminal leaflet: [0.33–0.40]
-
Ratio petiole/rachis: [0.39–0.67]
-
Length of terminal leaflet/length of petiolule: [0.06–0.08]
D. sp. nov.
-
Ratio width/length of the basal leaflet: [0.49–0.57]
-
Terminal leaflet width: [42–62] mm
-
Ratio width/length of the terminal leaflet: [0.38–0.49]
-
Ratio petiole/rachis: [0.22–0.30]
-
Length of terminal leaflet/length of petiolule: [0.05–0.07]
D. lopense
Publisher’s Note: MDPI stays neutral with regard to jurisdictional claims in published maps and institutional affiliations.

