
Why Intra-Annual Density Fluctuations Should Be Formed at Night? Implications for Climate–Growth Relationships in Seasonally Dry Conifer Forests


Instituto Pirenaico de Ecología (IPE-CSIC), Avda. Montañana 1005, 50059 Zaragoza, Spain
Forests 2022, 13(9), 1425; https://doi.org/10.3390/f13091425
Submission received: 2 August 2022
/
Revised: 31 August 2022
/
Accepted: 2 September 2022
/
Published: 5 September 2022
(This article belongs to the Special Issue Tree Growth in Limiting Environments)
Abstract
:Trees grow at night, when the vapor pressure deficit (VPD) is low enough. Therefore, intra-annual density fluctuations (IADFs) should be formed when the VPD drops below a certain threshold. This idea is tested by assessing climate-latewood IADF relationships in six conifer species under Mediterranean climate conditions. Hourly climate and dendrometer data were analyzed for years with elevated IADF production in two species (Pinus halepensis, Juniperus thurifera). Lastly, climate–growth relationships were evaluated in two drought-prone sites to assess the relative role of minimum vs. maximum temperatures as growth drivers. Latewood IADF production was positively related to growth rate. IADFs were more abundant when monthly or 10-day long precipitation was high in the late growing season (August and September). According to dendrometer data, growth mainly occurred in early night (20–2 h) and early morning (6–8 h). This growth window corresponded to rainy periods with VPD below a minimum threshold associated with summer storms. Latewood IADFs are produced in response to these wet late-summer conditions, which could be related to bimodal growth. These associations are in line with correlations showing that high minimum (night) rather than maximum (day) temperatures reduce growth. This last idea should be further checked in drought-prone forests using global tree-ring databases.
1. Introduction
Forests play major roles in this planet as carbon and biodiversity reservoirs, but many of them, particularly in drought-prone areas, are increasingly stressed due to warmer conditions amplifying mortality rates and reducing productivity [1]. In the Anthropocene, forest productivity and tree radial growth are becoming increasingly more driven by water availability [2]. In this sense, a better understanding on how trees grow and respond to climate drivers at multiple temporal resolutions is needed. For instance, radial growth could be plastic enough and allow for trees adapting to changing climate conditions, including a more severe drought stress [3,4].
Dendrochronology has mainly focused on radial growth changes at annual to seasonal resolutions [5]. Xylogenesis studies have enabled reconstructing the growth phenology (amount of formed and developed cells) by repeatedly taking wood samples at weekly or biweekly periods [3,6,7]. Finally, modern, high-precision automatic dendrometers have enabled quantifying radial stem growth and water-related swelling/shrinkage dynamics at hourly and lower temporal resolutions [8,9]. However, we lack stronger linkages between growth and wood anatomy (Figure 1), and these connections should encompass several temporal scales, from the annual ring to intra-annual wood anatomical features.
Wood anatomical features are a promising tool to link intra-annual growth and related wood formation [10]. For instance, intra-annual density fluctuations (hereafter IADFs) or false rings have been widely studied as climate signals in many conifers, especially in areas subjected to seasonal drought such as the Mediterranean Basin [11,12,13,14,15,16,17,18,19,20] or North American regions [21,22,23,24,25,26,27]. Forests located in south-western USA or northern Mexico are important because they are subjected to strong seasonal drought [23,24,25,26,27]. In those forests, the main moisture source is the North American summer monsoon, which accounts for 30 to 50% of annual precipitation and it is characterized by abundant rainfall and storms from July to September after dry spring conditions [28]. Such episodic but potentially strong rainfalls can resume cambial growth, leading to the formation of latewood IADFs [26], as happens with late summer to early autumn precipitation in Mediterranean forests [16,17,18,20,29]. More importantly, monsoon rainfall can trigger bimodal growth [26], a pattern already described in Mediterranean conifers [3]. It should be stated that IADF formation and bimodal growth have been often related, but they are not necessarily linked, since bimodal growth can occur without latewood IADF production and vice versa [27].
In this study, I capitalize on the analogy between drought-prone conifer forests subjected to contrasting seasonal precipitation regimes where IADFs and bimodal growth have been observed. I compare Mediterranean forests, the main subject of this study, and north-western American forests affected by the summer monsoon. The study focuses on IADFs formed in the latewood, which can be defined as bands of earlywood-like tracheids formed in the latewood, i.e., tracheids with transversal wider lumen and thinner cell walls than latewood tracheids (Figure 1c). I assess the climate drivers of IADF formation at monthly to 10-day long scales in several sites and species. Then, I use dendrometer data to explore when growth occurs during the period of IADF formation in Mediterranean conifers (late summer to early autumn). Despite the fact that climate–IADFs relationships have been widely studied, we still lack a process-based approach showing when and how IADFs are formed in response to climate variability at multiple temporal scales. The main hypothesis is that IADF should form at night, when growth occurs [9]. Finally, I also test whether growth is more related to minimum (night) or maximum (day) temperatures at monthly scales in Mediterranean and north-western American drought-prone forests. I expect growth is more related to minimum temperatures in these sites, since growth occurs at night when a minimum value of evaporative demand or vapor pressure deficit (VPD) is not surpassed and turgor of enlarging xylem cells is high [9]. In contrast, maximum temperature may reduce soil moisture which seems to be less important to grow than VPD [9,30].
2. Materials and Methods
2.1. Study Sites and Tree Species
The production and climate drivers of latewood IADF formation were studied in six conifer species (Pinus pinaster Ait., Pinus halepensis Mill., Juniperus thurifera L., Abies pinsapo Boiss., Pinus sylvestris L. and Cedrus atlantica (Endl.) Manetti ex Carrière) inhabiting sites located across eastern Spain (Table 1, Figure S1). Study sites encompassed a wide gradient in latitude (36.65–41.78° N), longitude (4.93° W–1.89° E), elevation (300–1400 m a.s.l.) and climate conditions (mean annual temperature 9.2–13.9 °C, total annual precipitation 356–1180 mm). All study species are found in locations with Mediterranean climate conditions characterized by dry summers, wet–cool springs, autumn conditions, and cold winters, particularly in the case of inland sites. All study sites are natural forests except the P. pinaster Prades site, and the A. pinsapo, P. sylvestris and C. atlantica sites which are plantations. The P. pinaster and A. pinsapo sites are located on metamorphic substrates forming acid soils, whereas the P. halepensis, J. thurifera, P. sylvestris and C. atlantica sites are located in sites with basic soils. In the site with dendrometer data, P. halepensis and J. thurifera are the dominant tree species.
The sites where the effects of monthly climate data (minimum and maximum temperatures, total precipitation) on growth were studied are located in north-eastern Spain (41.3° N, 1.8° E, 300 m a.s.l.) and south-western USA (33.9° N, 108.5° W, 2140 m a.s.l.), respectively, and correspond to P. halepensis and Pinus edulis Engelm. stands, in that order. The mean annual temperatures and total annual precipitation are 14.7° and 11.0 °C and 588 and 393 mm in these dry-summer P. halepensis and wet-summer P. edulis sites, respectively. (Figure S2). These sites were selected because both IADF formation and bimodal growth were observed there [3,17,26].
2.2. Climate Data
In the case of the site with dendrometer data (Peñaflor), in situ meteorological data (air minimum and maximum temperatures, precipitation, and relative humidity) were obtained at hourly resolution for the period 2009–2020 using a weather station (HOBO RX3000, Onset, MA, USA). The station was located within a mixed P. halepensis–J. thurifera open forest. I calculated hourly VPDs (in kPa) using temperature and relative humidity data [30].
In the case of the sites with latewood IADF data, climate data (mean temperature, total precipitation) were obtained for the period 1970–2020 at monthly and 10-day temporal resolutions from a 1.1 km2 gridded Spanish dataset [31].
In the case of the sites from north-eastern Spain and south-western USA where climate–growth relationships were compared, I used 0.5° gridded monthly climate data (mean minimum and maximum temperatures, total precipitation) from the CRU climate dataset [32].
2.3. Field Sampling and IADF Data
In the field, mature, healthy, dominant, or co-dominant trees of each species were selected for sampling. A total of 15 to 33 trees were sampled per site (Table 2). Their diameter at breast height (dbh) was measured at 1.3 m using tapes. Two increment cores by tree were taken at the same height using 5.15 mm Pressler increment borers (Häglof, Sweden) and perpendicular to the maximum slope when appropriate. At least one of the cores reached the pith or the innermost rings so as to estimate tree age at 1.3 m.
Cores were air dried, mounted on wooden supports, and sanded with increasingly finer sandpaper until IADFs and ring boundaries were clearly visible under a microscope. Cores were visually cross-dated and annual ring widths were measured with a 0.01 mm resolution using a Lintab-TSAP system (Rinntech, Heidelberg, Germany). Visual cross dating was checked with the program COFECHA [33]. Detrending of ring-width data to remove age- or size-related trends was conducted by fitting either linear or exponential negative functions, then dividing measured by fitted ring-width values and obtaining ring-width indices. Then, a mean series of ring-width indices or chronology was calculated for each site using a bi-weight robust mean and the dplR package in R [34,35].
I used already developed chronologies for the sites located in north-eastern Spain and south-western USA [36,37]. The P. halepensis site in north-eastern Spain was located near Begues site (see Table 1). In the case of the P. edulis site, ring-width data were downloaded from the International Tree-Ring Data Bank corresponding to the site NM624 [38]. In these two sites, I considered the common and best-replicated 1950–2016 period.
Latewood IADFs (formed by earlywood-like cells within the latewood) were counted under the microscope. An annual frequency (%) of IADFs was calculated for each site and species by dividing the number of trees that formed IADFs by the total number of observed trees. The IADF was counted only when both cores from the tree showed it in the same annual ring [39].
2.4. Dendrometer Data
Changes in stem perimeter were recorded at hourly resolution in P. halepensis (n = 3 individuals, mean dbh =17 cm, mean age = 65 years) and J. thurifera (n = 3 individuals, mean dbh = 12.0 cm, mean age = 43 years) trees from the Peñaflor site during the 2009–2020 period. Automatic band dendrometers (DRL26C, EMS Brno, Czech Republic) were placed at 1.3 m after removing the dead bark. Dendrometers recorded variations in stem circumference every 30 min with 1 μm resolution. These values were converted into hourly radial increment rates assuming a circular stem shape. Stem diameter variation is composed of: (1) irreversible stem diameter growth, including cell division and cell enlargement, and (2) water-related processes (swelling/shrinkage) leading to contraction and expansion depending on the water potential gradient (Figure 1c). The zero-growth concept, which assumes zero growth during periods of stem shrinkage, was used to separate irreversible growth from stem diameter contraction and expansion [8]. The percentage of hours corresponding to each phase (contraction, expansion, and growth) was calculated.
I focused on August and September and the period of 2009–2011 because IADFs were formed in those two months and years [3,17,20]. On average, 12% and 9% of P. halepensis and J. thurifera individuals produced IADFs during that period, respectively, with maximum values observed in 2009 (35% and 21% of P. halepensis and J. thurifera individuals, respectively).
The frequency of hours with conditions favorable to growth according to [9], i.e., positive precipitation values and VPD < 0.24 kPa, were calculated. I also used climate and dendrometer data from other years (2015, 2021) to illustrate the punctual effects of late summer (August–September) storms and rainfall on climate conditions (air temperature, precipitation, VPD, relative air humidity) and changes in stem radius.
2.5. Climate–Growth Relationships
I used Pearson correlations and partial correlations to assess the relationships between monthly climate variables (mean minimum and maximum temperatures, precipitation) and growth rates (chronologies or mean series of ring-width indices) in the two sites from north-eastern Spain and south-western USA. Partial correlations were calculated between minimum and maximum temperatures to disentangle the relative contributions of each variable to explain year-to-year growth variability. Partial correlations were calculated only for months when either minimum or maximum temperatures showed significant (p < 0.05) correlations with ring-width indices. Correlations were calculated considering the window from prior to current October and the common 1950–2016 period.
2.6. Statistical Analyses
The Spearman correlation coefficient (rs) was used to evaluate the relationships between tree growth rate, tree age, climate variables (mean temperature, total precipitation), and the frequency of formed IADFs. Correlations between growth rate and IADF production were calculated considering all measured ring widths, whereas the age–IADF correlation was calculated considering the maximum age of each tree and the mean number of IADFs produced by that tree, i.e., the average of the IADFs observed in the two cores of the same individual.
Correlations between climate variables and IADFs were calculated from prior to current October. To account for the high spatial variability of precipitation in Mediterranean regions, climate–IADF relationships based on 10-day long precipitation amounts were only presented for sites where meteorological stations with long-term (>30 years) precipitation records were located less than 20 km away from sampled stands. Results for the other sites are shown in the Supplementary Materials.
3. Results
3.1. Formation of IADFs in Mediterranean Tree Species: Roles of Growth Rate and Tree Age
Some species and sites showed a high frequency (>50% of years) of IADFs such as P. pinaster in Bayubas and Prades sites, P. halepensis in Begues and Peñaflor sites, J. thurifera in Peñaflor and Retuerta de Pina sites, A. pinsapo in Orcajo site, and P. sylvestris in Sierra de las Nieves site (Table 2, Figure 2). IADFs were frequent in wet–cool periods such as the 1970s, but they were rarely formed in dry periods such as the mid-1990s and 2000s and early 2010s when the growth rates were low. In some species and sites, there was a decrease in IADF production, such as in the case of J. thurifera in the Retuerta de Pina site.
Radial growth rate was positively related to IADF production in all sites and species (Table 3). Tree age was negatively related to IADF production in two P. pinaster sites (Armuña, Bayubas) and in two P. halepensis sites (Peñaflor, Begues).
3.2. Climate Drivers of IADF Formation in Mediterranean Tree Species
Latewood IADF formation was enhanced by wet and cool conditions due to elevated precipitation in August and September and (Figure 3 and Figures S3–S7).
3.3. Dendrometer Data at Hourly Resolution
At hourly resolution, the highest relative contribution to growth occurred from 7 to 9 h and from 7 to 12 h in P. halepensis and J. thurifera, respectively (Figure 5 and Figure S9). Expansion also peaked in the night, whereas contraction was mainly observed from 14 to 17 h and from 16 to 21 h in P. halepensis and J. thurifera, respectively. Conditions favorable for growth were observed during night in both species, from 20 to 2 h and from 6 to 8 h (Figure 6 and Figure S10).
The hourly growth increments observed in August and September, when IADFs are formed, often corresponded to nigh or early morning storms with abundant rainfall (Figure S11). These late-summer storms lead to a sudden drop in air temperatures, increase the relative air humidity, and decrease the VPD (Figure S12).
3.4. Comparing Climate-Growth Relationships in Drought-Prone Sites
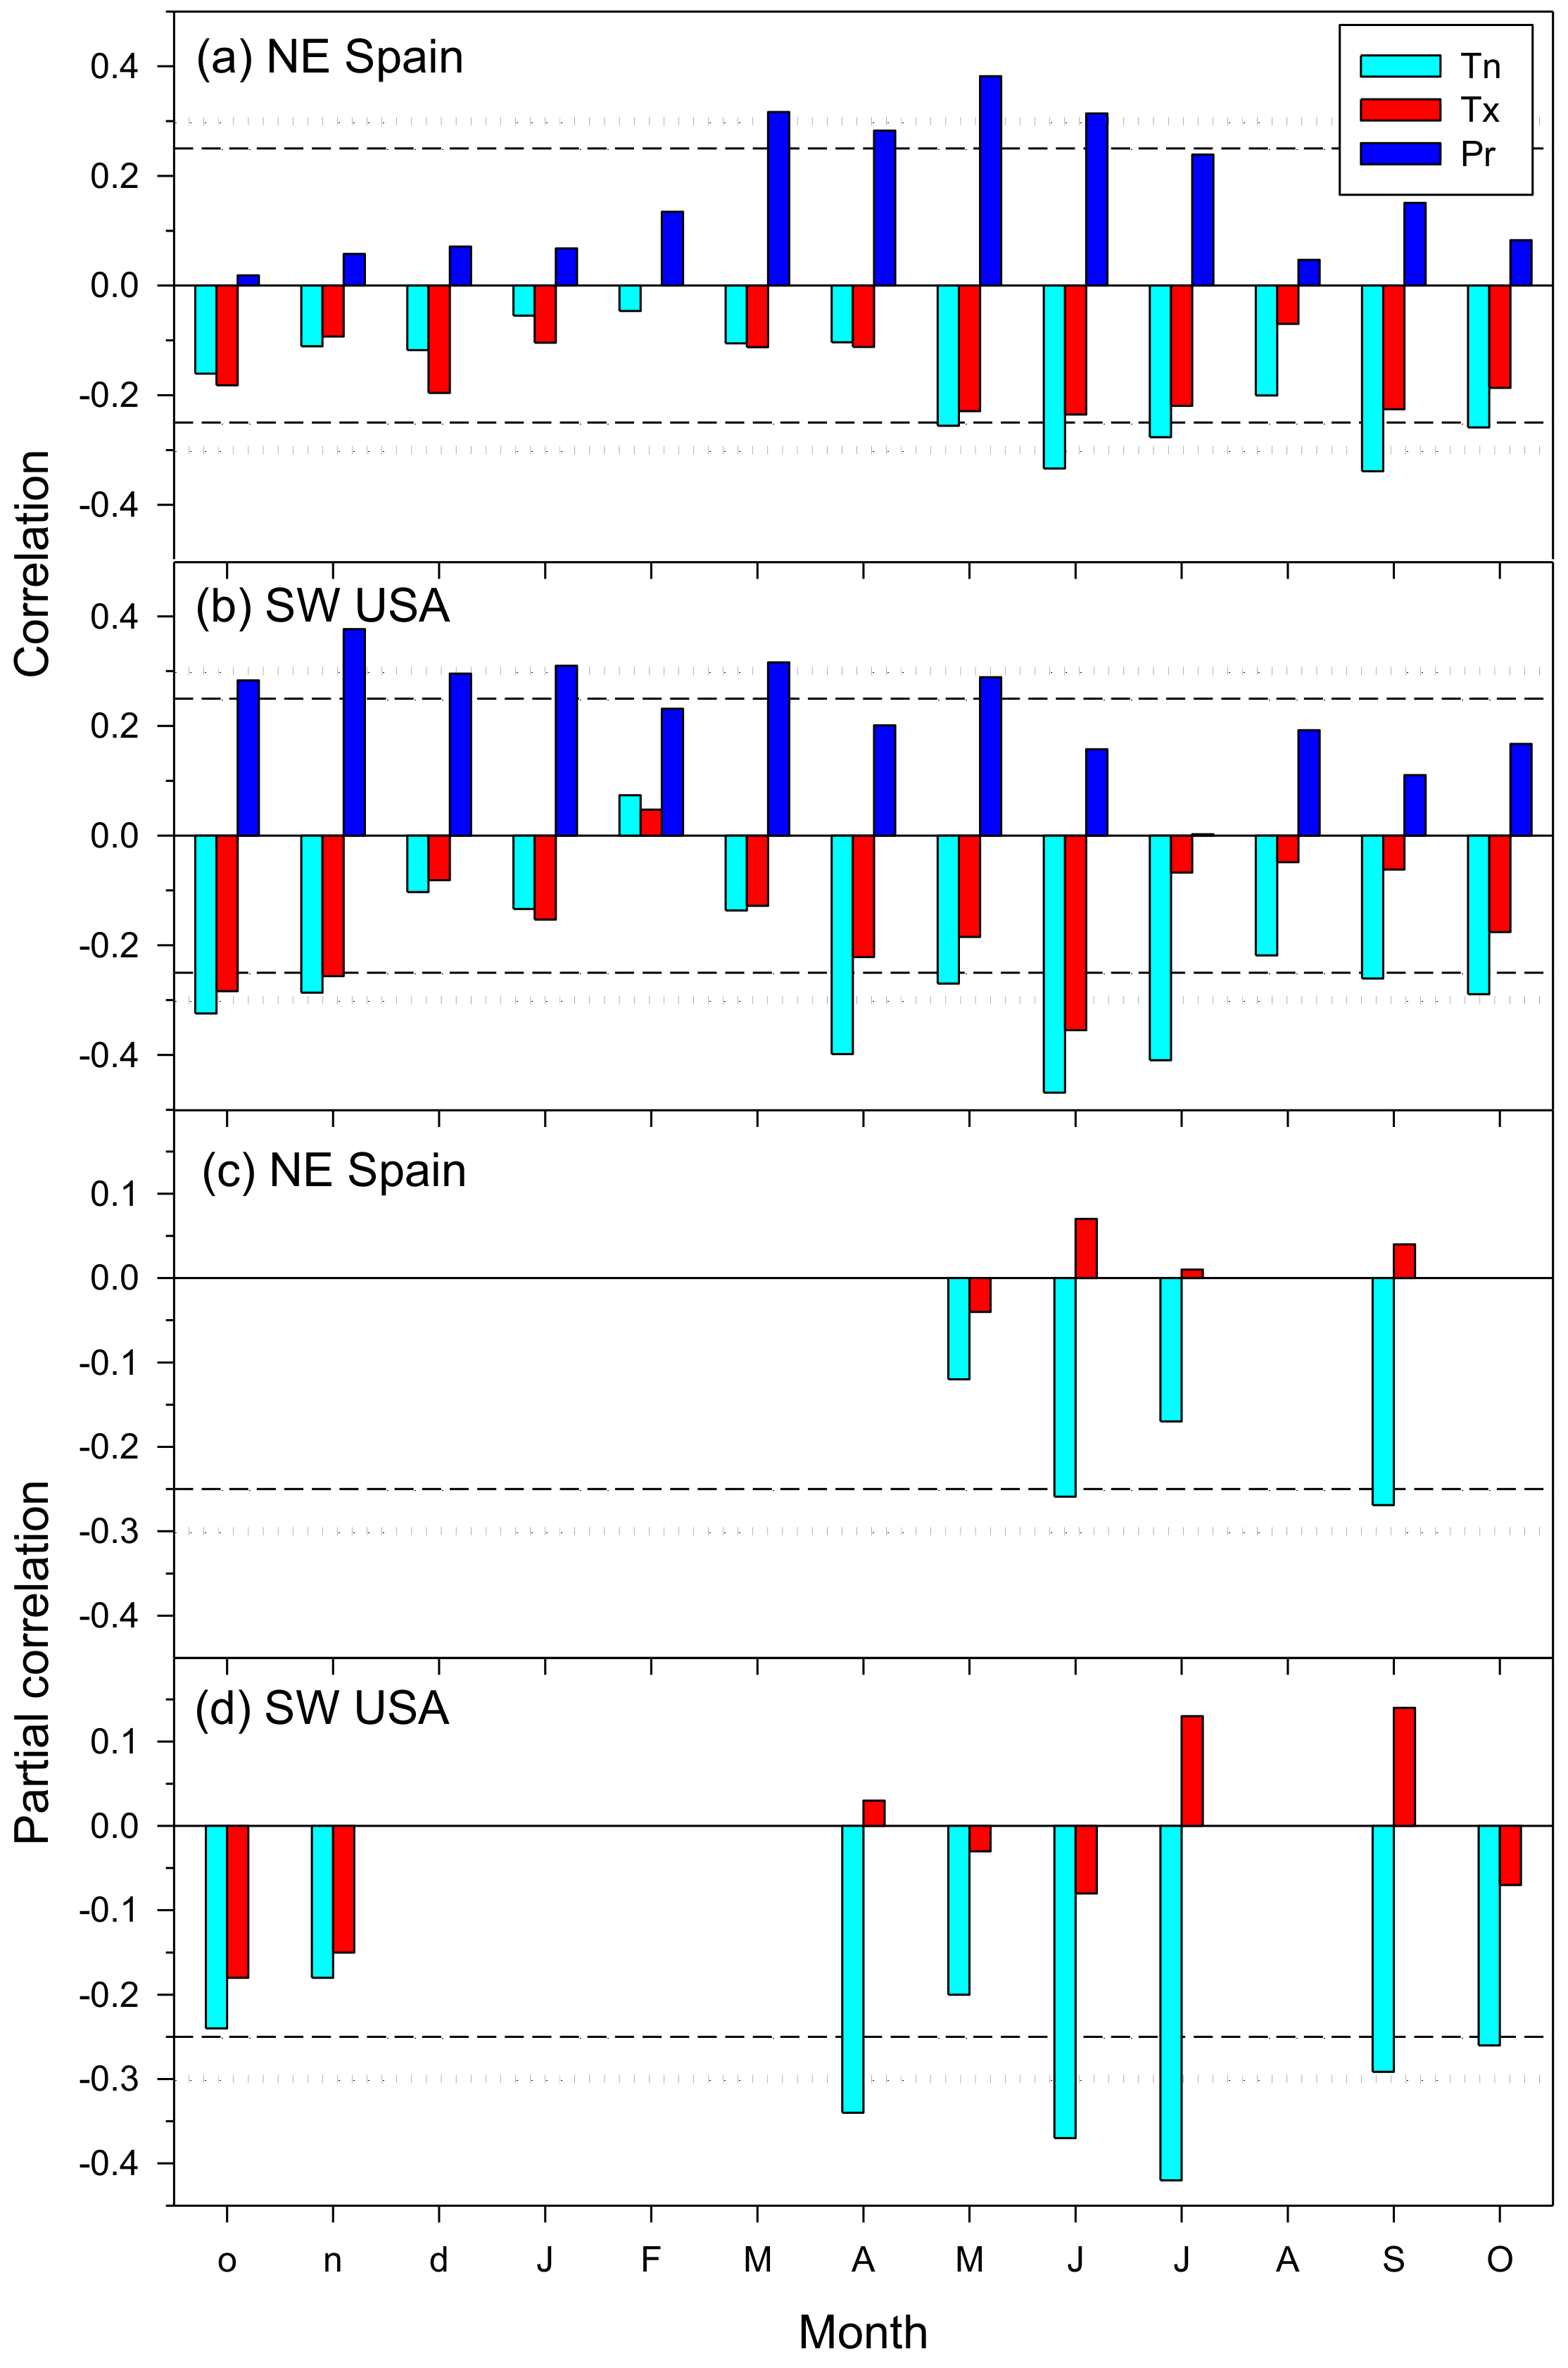
In the sites from north-eastern Spain and south-western USA, growth increased when current spring–summer or prior-to-winter and spring precipitation, respectively, did (Figure 7). Minimum and maximum temperatures showed negative associations with growth in those seasons as well as in in autumn. Partial correlations indicated that growth was negatively related to spring, summer, and early autumn minimum temperatures.
4. Discussion
4.1. IADFs Are Formed at Night and Early Morning in Response to Wet Conditions and Low VPD
In this paper, I tested the idea that latewood IADFs are formed when air temperatures and the VPD drop, i.e., during night and early morning. This hypothesis was supported by hourly climate and dendrometer taken in a P. halepensis–J. thurifera site where bimodal growth was also previously described [3]. This finding represents an addendum to recent studies showing that tree growth occurs at night when the VPD is below the 0.24 kPa threshold [9].
At monthly and 10-day temporal scales, latewood IADFs were produced in response to wet conditions in late summer and early autumn, which often correspond to night or early morning storms with abundant rainfall. In eastern Spain, these late-summer storms are generated by convective activity from the Mediterranean Sea [17]. They lead to a sudden drop in air temperatures, thus decreasing the VPD. The presented findings indicate that those conditions could reactivate cambial dynamics, increase the turgor of tracheids and their radial enlargement rate [41,42], and lead to the formation of latewood IADFs. In fact, a biophysical model of ring formation showed that changes in plant water status were the main driver of IADF formation through a direct effect on cell volume [43]. This has clear implications for forests’ responses to changing climate conditions in seasonally dry areas since shifts of the dry season could affect growth, IADF production, wood density, and the capacity of trees to uptake carbon as thick, latewood cell walls [44,45]. Functionally, the shifts in the occurrence of the dry and wet season could also impact the hydraulic conductivity of the tree since the earlywood and latewood show contrasting conductivity, vulnerability to embolism, and water storage capacity [46]. For instance, the formation of more or wider latewood IADFs would increase hydraulic conductivity in late summer but also reduce the latewood water storage capacity.
The formation of IADFs from night to early morning has been mainly discussed from a meristem (cambium) perspective but should be understood considering the diurnal or circadian regulation of carbon supply and growth [47,48]. Light, plant hormones, sugar metabolism (e.g., starch degradation), and the circadian clock interact to control diurnal patterns of plant growth and carbon use by meristems. Therefore, future research could address how the carbohydrates fixed during the day are used to grow and form IADFs during the night and disentangle which environmental signals trigger these processes.
4.2. Minimum (Night) Temperature Is a Major Driver of Growth in Seasonally Dry Areas
The comparison of climate–growth relationships between the seasonally dry Mediterranean and North American conifer forests revealed that growth was mainly constrained by high minimum or night temperatures. This agrees with the inferences on IADF formation based on dendrometer data and the recent study demonstrating that growth occurs when the VPD is low enough [9]. In both study sites, high night temperatures from spring to autumn lead to VPD drops and reduced radial growth. This occurs during the peak of the growing season in spring [3,26], but also during late summer and autumn when latewood is formed.
Consequently, a high VPD could reduce cambial activity and growth either in conifers showing unimodal (spring peak) growth or in conifers from seasonally dry areas showing bimodal growth (spring and autumn peaks). If bimodality provides some adaptive advantage by growing during two wet–cool seasons [3,26,49,50], warmer conditions during night leading to elevated VPD values could lessen that benefit. The presented analyses indicate that forecasting growth and IADF formation would require considering the seasonal trends of minimum temperatures. For example, an increase in April, June, and July minimum temperatures would be detrimental to conifer growth in regions such as south-western USA and northern Mexico under the influence of the North American monsoon, but it would not affect Mediterranean conifer forests subjected to dry summer conditions. Moreover, warmer night conditions could also impair the capacity of trees to recover after previous dry seasons such as spring in North American monsoonal forests or summer in the Mediterranean basin forests [51,52]. A rise in autumn minimum temperatures would reduce growth in both biogeographic regions and also decrease the formation of IADFs. Indeed, a significant (p < 0.05) increase in autumn temperatures was observed since 1950 in all study Spanish sites excepting Retuerta de Pina and Prades sites. A similar trend towards warmer autumn conditions, particularly in night, was also detected when analyzing minimum temperatures in the two compared sites from north-eastern Spain and south-western USA.
The proposed ideas on the links between tree growth and minimum temperature, a proxy of night VPD, could be further tested by comparing more conifer species and sites in seasonally dry regions. Furthermore, I also propose testing at a global scale if minimum (night) temperatures are a more important driver of tree radial growth than maximum (day) temperatures using international tree-ring databases.
5. Conclusions
Latewood IADFs were formed in response to wet conditions from late summer to early autumn in six conifer species inhabiting sites with Mediterranean climate conditions (dry summer). The formation of IADFs was also positively related to growth rate, indicating they tend to form during years with favorable (wet) climate conditions. Hourly dendrometer data taken in two species (P. halepensis, J. thurifera) showed that growth during the period of IADF formation (August–September) mainly happened in early night (20–2 h) and early morning (6–8 h), when the VPD was low enough due to summer storms. Warmer nigh temperatures would reduce wood production during the main growth peak in spring, but also during the second peaks in late summer and autumn, thus decreasing IADF production. Therefore, further research could investigate if growth rate and phenology (unimodal vs. bimodal patterns) are changing or shifting as a function of different seasonal increases in minimum temperature. Growth changes could be also linked to the variability in the formation of conspicuous, climate-driven, wood-anatomical features such as latewood IADFs.
Supplementary Materials
The following supporting information can be downloaded at: https://www.mdpi.com/article/10.3390/f13091425/s1, Figure S1: Map of study sites; Figure S2: Climate conditions in sites where latewood IADFs are formed; Figure S3: Example of climate–IADF relationships; Figure S4: Climate–IADF relationships in Pinus pinaster; Figure S5: Climate–IADF relationships in Pinus halepensis; Figure S6: Climate–IADF relationships in Juniperus thurifera; Figure S7: Climate–IADF relationships in Abies pinsapo, Pinus sylvestris, and Cedrus atlantica; Figure S8: Climate–IADF relationships based on 10-day long precipitation windows; Figure S9: Frequency of the phases of stem contraction, expansion, and growth; Figure S10: Hourly precipitation and VPD data in August and September; Figure S11: Hourly changes in stem radial increment rates in Pinus halepensis and Juniperus thurifera; Figure S12: Hourly changes of temperature, relative air humidity, and vapor pressure deficit.
Funding
This research was funded by the SPANISH MINISTRY OF SCIENCE, INNOVATION AND UNIVERSITIES, grant number RTI2018-096884-B-C31.
Institutional Review Board Statement
Not applicable.
Informed Consent Statement
Not applicable.
Data Availability Statement
Data are available upon request from the corresponding author.
Acknowledgments
I thank two reviewers and the editor for their comments. I also thank several colleagues for showing me some of the sampling sites and helping with data acquisition: Emilia Gutiérrez, Arturo Pacheco, Michele Colangelo, Antonio Gazol, José Bellosta, Carlos Castanao, Juan Carlos Linares, Maika Folch, and José Antonio Bonet, among others. This work is dedicated to the memory of Nemesio Camarero López who recently passed away.
Conflicts of Interest
The author declares no conflict of interest.
References
- Allen, C.D.; Breshears, D.D.; McDowell, N.G. On underestimation of global vulnerability to tree mortality and forest die-off from hotter drought in the Anthropocene. Ecosphere 2015, 6, art129. [Google Scholar] [CrossRef]
- Babst, F.; Bouriaud, O.; Poulter, B.; Trouet, V.; Girardin, M.P.; Frank, D.C. Twentieth century redistribution in climatic drivers of global tree growth. Sci. Adv. 2019, 5, eaat4313. [Google Scholar] [CrossRef] [PubMed]
- Camarero, J.J.; Olano, J.M.; Parras, A. Plastic bimodal xylogenesis in conifers from continental Mediterranean climates. New Phytol. 2010, 185, 471–480. [Google Scholar] [CrossRef] [PubMed]
- Tumajer, J.; Shishov, V.V.; Ilyin, V.A.; Camarero, J.J. Intra-annual growth dynamics of Mediterranean pines and junipers determines their climatic adaptability. Agric. For. Meteorol. 2021, 311, 108685. [Google Scholar] [CrossRef]
- Fritts, H.C. Tree Rings and Climate, 2nd ed.; The Blackburn Press: Caldwell, NJ, USA, 2001. [Google Scholar]
- Huang, J.-G.; Ma, Q.; Rossi, S.; Biondi, F.; Deslauriers, A.; Fonti, P.; Liang, E.; Mäkinen, H.; Oberhuber, W.; Rathgeber, C.B.K.; et al. Photoperiod and temperature as dominant environmental drivers triggering secondary growth resumption in Northern Hemisphere conifers. Proc. Nat. Acad. Sci. USA 2020, 117, 20645–20652. [Google Scholar] [CrossRef] [PubMed]
- Deslauriers, A.; Morin, H. Intra-annual tracheid production in balsam fir stems and the effect of meteorological variables. Trees Struct. Funct. 2005, 19, 402–408. [Google Scholar] [CrossRef]
- Zweifel, R.; Haeni, M.; Buchmann, N.; Eugster, W. Are trees able to grow in periods of stem shrinkage? New Phytol. 2016, 211, 839–849. [Google Scholar] [CrossRef]
- Zweifel, R.; Sterck, F.; Braun, S.; Buchmann, N.; Eugster, W.; Gessler, A.; Häni, M.; Peters, R.L.; Walthert, L.; Wilhelm, M.; et al. Why trees grow at night. New Phytol. 2021, 231, 2174–2185. [Google Scholar] [CrossRef]
- Wimmer, R. Wood anatomical features in tree-rings as indicators of environmental change. Dendrochronologia 2002, 20, 21–36. [Google Scholar] [CrossRef]
- Campelo, F.; Nabais, C.; Freitas, H.; Gutiérrez, E. Climatic significance of tree-ring width and intra-annual density fluctuations in Pinus pinea from a dry Mediterranean area in Portugal. Ann. For. Sci. 2007, 64, 229–238. [Google Scholar] [CrossRef] [Green Version]
- Bogino, S.; Bravo, F. Climate and intraannual density fluctuations in Pinus pinaster subsp. mesogeensis in Spanish woodlands. Can. J. For. Res. 2009, 39, 1557–1565. [Google Scholar]
- Vieira, J.; Campelo, F.; Nabais, C. Intra-annual density fluctuations of Pinus pinaster are a record of climatic changes in the western Mediterranean region. Can. J. For. Res. 2010, 40, 1567–1575. [Google Scholar] [CrossRef]
- De Luis, M.; Novak, K.; Raventós, J.; Gričar, J.; Prislan, P.; Čufar, K. Climate factors promoting intra-annual density fluctuations in Aleppo pine (Pinus halepensis) from semiarid sites. Dendrochronologia 2011, 29, 163–169. [Google Scholar] [CrossRef]
- DeSoto, L.; De la Cruz, M.; Fonti, P. Intra-annual patterns of tracheid size in the Mediterranean tree Juniperus thurifera as an indicator of seasonal water stress. Can. J. For. Res. 2011, 41, 1280–1294. [Google Scholar] [CrossRef]
- Rozas, V.; García-González, I.; Zas, R. Climatic control of intra-annual wood density fluctuations of Pinus pinaster in NW Spain. Trees Struct. Funct. 2011, 25, 443–453. [Google Scholar] [CrossRef]
- Pacheco, A.; Camarero, J.J.; Ribas, M.; Gazol, A.; Gutiérrez, E.; Carrer, M. Disentangling the climate-driven bimodal growth pattern in coastal and continental Mediterranean pine stands. Sci. Total Environ. 2018, 615, 1518–1526. [Google Scholar] [PubMed]
- Campelo, F.; Vieira, J.; Nabais, C. Tree-ring growth and intra-annual density fluctuations of Pinus pinaster responses to climate: Does size matter? Trees Struct. Funct. 2013, 27, 763–772. [Google Scholar] [CrossRef]
- De Micco, V.; Campelo, F.; De Luis, M.; Bräuning, A.; Grabner, M.; Battipaglia, G.; Cherubini, P. Intra-annual density fluctuations in tree rings: How, when, where, and why? IAWA J. 2016, 37, 232–259. [Google Scholar] [CrossRef]
- Pacheco, A.; Camarero, J.J.; Carrer, M. Linking wood anatomy and xylogenesis allows pinpointing of climate and drought influences on growth of coexisting conifers in continental Mediterranean climate. Tree Physiol. 2016, 36, 502–512. [Google Scholar]
- Copenheaver, C.A.; Pokorski, E.A.; Currie, J.E.; Abrams, M.D. Causation of false ring formation in Pinus banksiana: A comparison of age, canopy class, climate, and growth rate. For. Ecol. Manag. 2006, 236, 348–355. [Google Scholar] [CrossRef]
- Hoffer, M.; Tardif, J.C. False rings in jack pine and black spruce trees from eastern Manitoba as indicators of dry summers. Can. J. For. Res. 2009, 39, 1722–1736. [Google Scholar] [CrossRef]
- Edmonson, J.R. The meteorological significance of false rings in eastern redcedar (Juniperus virginiana L.) from the southern great plains. U.S.A. Tree-Ring Res. 2010, 66, 19–33. [Google Scholar] [CrossRef] [Green Version]
- Acosta-Hernández, A.C.; Camarero, J.J.; Pompa-García, M. Seasonal growth responses to climate in wet and dry conifer forests. IAWA J. 2018, 40, 311–330. [Google Scholar] [CrossRef]
- Belmecheri, S.; Wright, W.E.; Szejner, P.; Morino, K.A.; Monson, R.K. Carbon and oxygen isotope fractionations in tree rings reveal interactions between cambial phenology and seasonal climate: Tree ring isotopes aligned with cambial phenology. Plant Cell Environ. 2018, 41, 2758–2772. [Google Scholar] [CrossRef] [PubMed]
- Morino, K.; Minor, R.L.; Barron-Gafford, G.A.; Brown, P.M.; Hughes, M.K. Bimodal cambial activity and false-ring formation in conifers under a monsoon climate. Tree Physiol. 2021, 41, 1893–1905. [Google Scholar] [CrossRef]
- Ziaco, E.; Truettner, C.; Biondi, F.; Bullock, S. Moisture-driven xylogenesis in Pinus ponderosa from a Mojave Desert Mountain reveals high phenological plasticity. Plant Cell Environ. 2018, 41, 823–836. [Google Scholar]
- Adams, D.K.; Comrie, A.C. The North American monsoon. Bull. Am. Meteorol. Soc. 1997, 78, 2197–2213. [Google Scholar]
- Collado, E.; Camarero, J.J.; Martínez de Aragón, J.; Pemán, J.; Bonet, J.A.; de-Miguel, S. Linking fungal dynamics, tree growth and forest management in a Mediterranean pine ecosystem. For. Ecol. Manag. 2018, 422, 223–232. [Google Scholar]
- Grossiord, C.; Buckley, T.N.; Cernusak, L.A.; Novick, K.A.; Poulter, B.; Siegwolf, R.T.W.; Sperry, J.S.; McDowell, N.G. Plant responses to rising vapor pressure deficit. New Phytol. 2020, 226, 1550–1566. [Google Scholar]
- Vicente-Serrano, S.M.; Tomas-Burguera, M.; Beguería, S.; Reig-Gracia, F.; Latorre, B.; Peña-Gallardo, M.; Luna, M.Y.; Morata, A.; González-Hidalgo, J.C. A high resolution dataset of drought indices for Spain. Data 2017, 2, 22. [Google Scholar]
- Harris, I.; Osborn, T.J.; Jones, P.; Lister, D. Version 4 of the CRU TS monthly high-resolution gridded multivariate climate dataset. Sci. Data 2020, 7, 109. [Google Scholar] [CrossRef] [PubMed]
- Grissino-Mayer, H.D. Evaluating crossdating accuracy: A manual and tutorial for the computer program COFECHA. Tree-Ring Res. 2001, 57, 205–221. [Google Scholar]
- Bunn, A.G. A dendrochronology program library in R (dplR). Dendrochronologia 2008, 26, 115–124. [Google Scholar] [CrossRef]
- R Development Core Team. R: A Language and Environment for Statistical Computing; R Foundation for Statistical Computing: Vienna, Austria, 2021. [Google Scholar]
- Camarero, J.J.; Sánchez-Salguero, R.; Ribas, M.; Touchan, R.; Andreu-Hayles, L.; Dorado-Liñán, I.; Meko, D.M.; Gutiérrez, E. Biogeographic, atmospheric and climatic factors influencing tree growth in Mediterranean Aleppo pine forests. Forests 2020, 11, 736. [Google Scholar] [CrossRef]
- Peltier, D.M.P.; Guo, J.; Nguyen, P.; Bangs, M.; Wilson, M.; Samuels-Crow, K.; Yocom, L.L.; Liu, Y.; Fell, M.K.; Shaw, J.D.; et al. Temperature memory and non-structural carbohydrates mediate legacies of a hot drought in trees across the southwestern USA. Tree Physiol. 2022, 42, 71–85. [Google Scholar] [CrossRef] [PubMed]
- ITRDB Database. Available online: https://www.ncei.noaa.gov/pub/data/paleo/treering/measurements/correlation-stats/nm624.txt (accessed on 8 August 2022).
- Kuo, M.L.; McGinnes, E.A. Variation of anatomical structure of false rings in eastern red cedar. Wood Sci. 1973, 5, 205–210. [Google Scholar]
- Osborn, T.J.; Briffa, K.R.; Jones, P.D. Adjusting variance for sample-size in tree-ring chronologies and other regional timeseries. Dendrochronologia 1997, 15, 89–99. [Google Scholar]
- Abe, H.; Nakai, T.; Utsumi, Y.; Kagawa, A. Temporal water deficit and wood formation in Cryptomeria japonica. Tree Physiol. 2003, 23, 859–863. [Google Scholar] [CrossRef]
- Peters, R.L.; Steppe, K.; Cuny, H.E.; De Pauw, D.J.W.; Frank, D.C.; Schaub, M.; Rathgeber, C.B.K.; Cabon, A.; Fonti, P. Turgor—A limiting factor for radial growth in mature conifers along an elevational gradient. New Phytol. 2021, 229, 213–229. [Google Scholar] [CrossRef]
- Wilkinson, S.; Ogée, J.; Domec, J.C.; Rayment, M.; Wingate, L. Biophysical modelling of intra-ring variations in tracheid features and wood density of Pinus pinaster trees exposed to seasonal droughts. Tree Physiol. 2015, 35, 305–318. [Google Scholar] [CrossRef] [Green Version]
- Bouriaud, O.; Leban, J.-M.; Bert, D.; Deleuze, C. Intra-annual variations in climate influence growth and wood density of Norway spruce. Tree Physiol. 2005, 25, 651–660. [Google Scholar] [CrossRef] [PubMed]
- Cuny, H.E.; Rathgeber, C.B.K.; Frank, D.; Fonti, P.; Mäkinen, H.; Prislan, P.; Rossi, S.; del Castillo, E.M.; Campelo, F.; Vavrčík, H.; et al. Woody biomass production lags stem-girth increase by over one month in coniferous forests. Nat. Plants 2015, 1, 15160. [Google Scholar] [CrossRef] [PubMed]
- Domec, J.C.; Gartner, B.L. How do water transport and water storage differ in coniferous early wood and latewood? J. Exp. Bot. 2002, 53, 2369–2379. [Google Scholar] [CrossRef] [PubMed]
- Nozue, K.; Maloof, J. Diurnal regulation of plant growth. Plant Cell Environ. 2006, 29, 396–408. [Google Scholar] [CrossRef] [PubMed]
- Smith, A.M.; Stitt, M. Coordination of carbon supply and plant growth. Plant Cell Environ. 2007, 30, 1126–1149. [Google Scholar] [CrossRef]
- De Luis, M.; Gričar, J.; Čufar, K.; Raventós, J. Seasonal dynamics of wood formation in Pinus halepensis from dry and semi-arid ecosystems in Spain. IAWA J. 2007, 28, 389–404. [Google Scholar] [CrossRef]
- Camarero, J.J.; Rubio-Cuadrado, A.; Gazol, A. Climate windows of intra-annual growth and post-drought recovery in Mediterranean trees. Agric. For. Meteorol. 2021, 308–309, 108606. [Google Scholar] [CrossRef]
- Peltier, D.M.P.; Ogle, K. Legacies of La Niña: North American monsoon can rescue trees from winter drought. Glob. Chang. Biol. 2019, 25, 121–133. [Google Scholar] [CrossRef]
- Gazol, A.; Camarero, J.J.; Sánchez-Salguero, R.; Vicente-Serrano, S.M.; Serra-Maluquer, X.; Gutiérrez, E.; De Luis, M.; Sangüesa-Barreda, G.; Novak, K.; Rozas, V.; et al. Drought legacies are short, prevail in dry conifer forests and depend on growth variability. J. Ecol. 2020, 108, 2473–2484. [Google Scholar] [CrossRef]
Figure 1.
Temporal scales (month, 10-day intervals, hours) considered in the study of climate–IADFs relationships. Correlations were calculated considering (a) monthly, (b) 10-day, and (c) hourly climate data. In plot (a) the climate diagram of Daroca station showing typical Mediterranean conditions is presented with estimates of monthly potential evapotranspiration. In plot (b) symbols show mean (± SE) precipitation values and color lines show precipitation values in this station for years with a high frequency of IADFs (1999, 2015). In plot (c) the hourly phases of stem contraction, expansion, and assumed growth were obtained from dendrometers attached to a P. halepensis tree in the Peñaflor site (see Table 1). The image in (c) shows a latewood IADF (yellow arrow) in a cross-section showing an annual ring of P. halepensis.

Figure 2.
Mean annual frequency of latewood IADFs observed in the six study species: (a), P. pinaster; (b), P. halepensis; (c), J. thurifera; and (d), other species. Data correspond to the period 1950–2020.
Figure 2.
Mean annual frequency of latewood IADFs observed in the six study species: (a), P. pinaster; (b), P. halepensis; (c), J. thurifera; and (d), other species. Data correspond to the period 1950–2020.
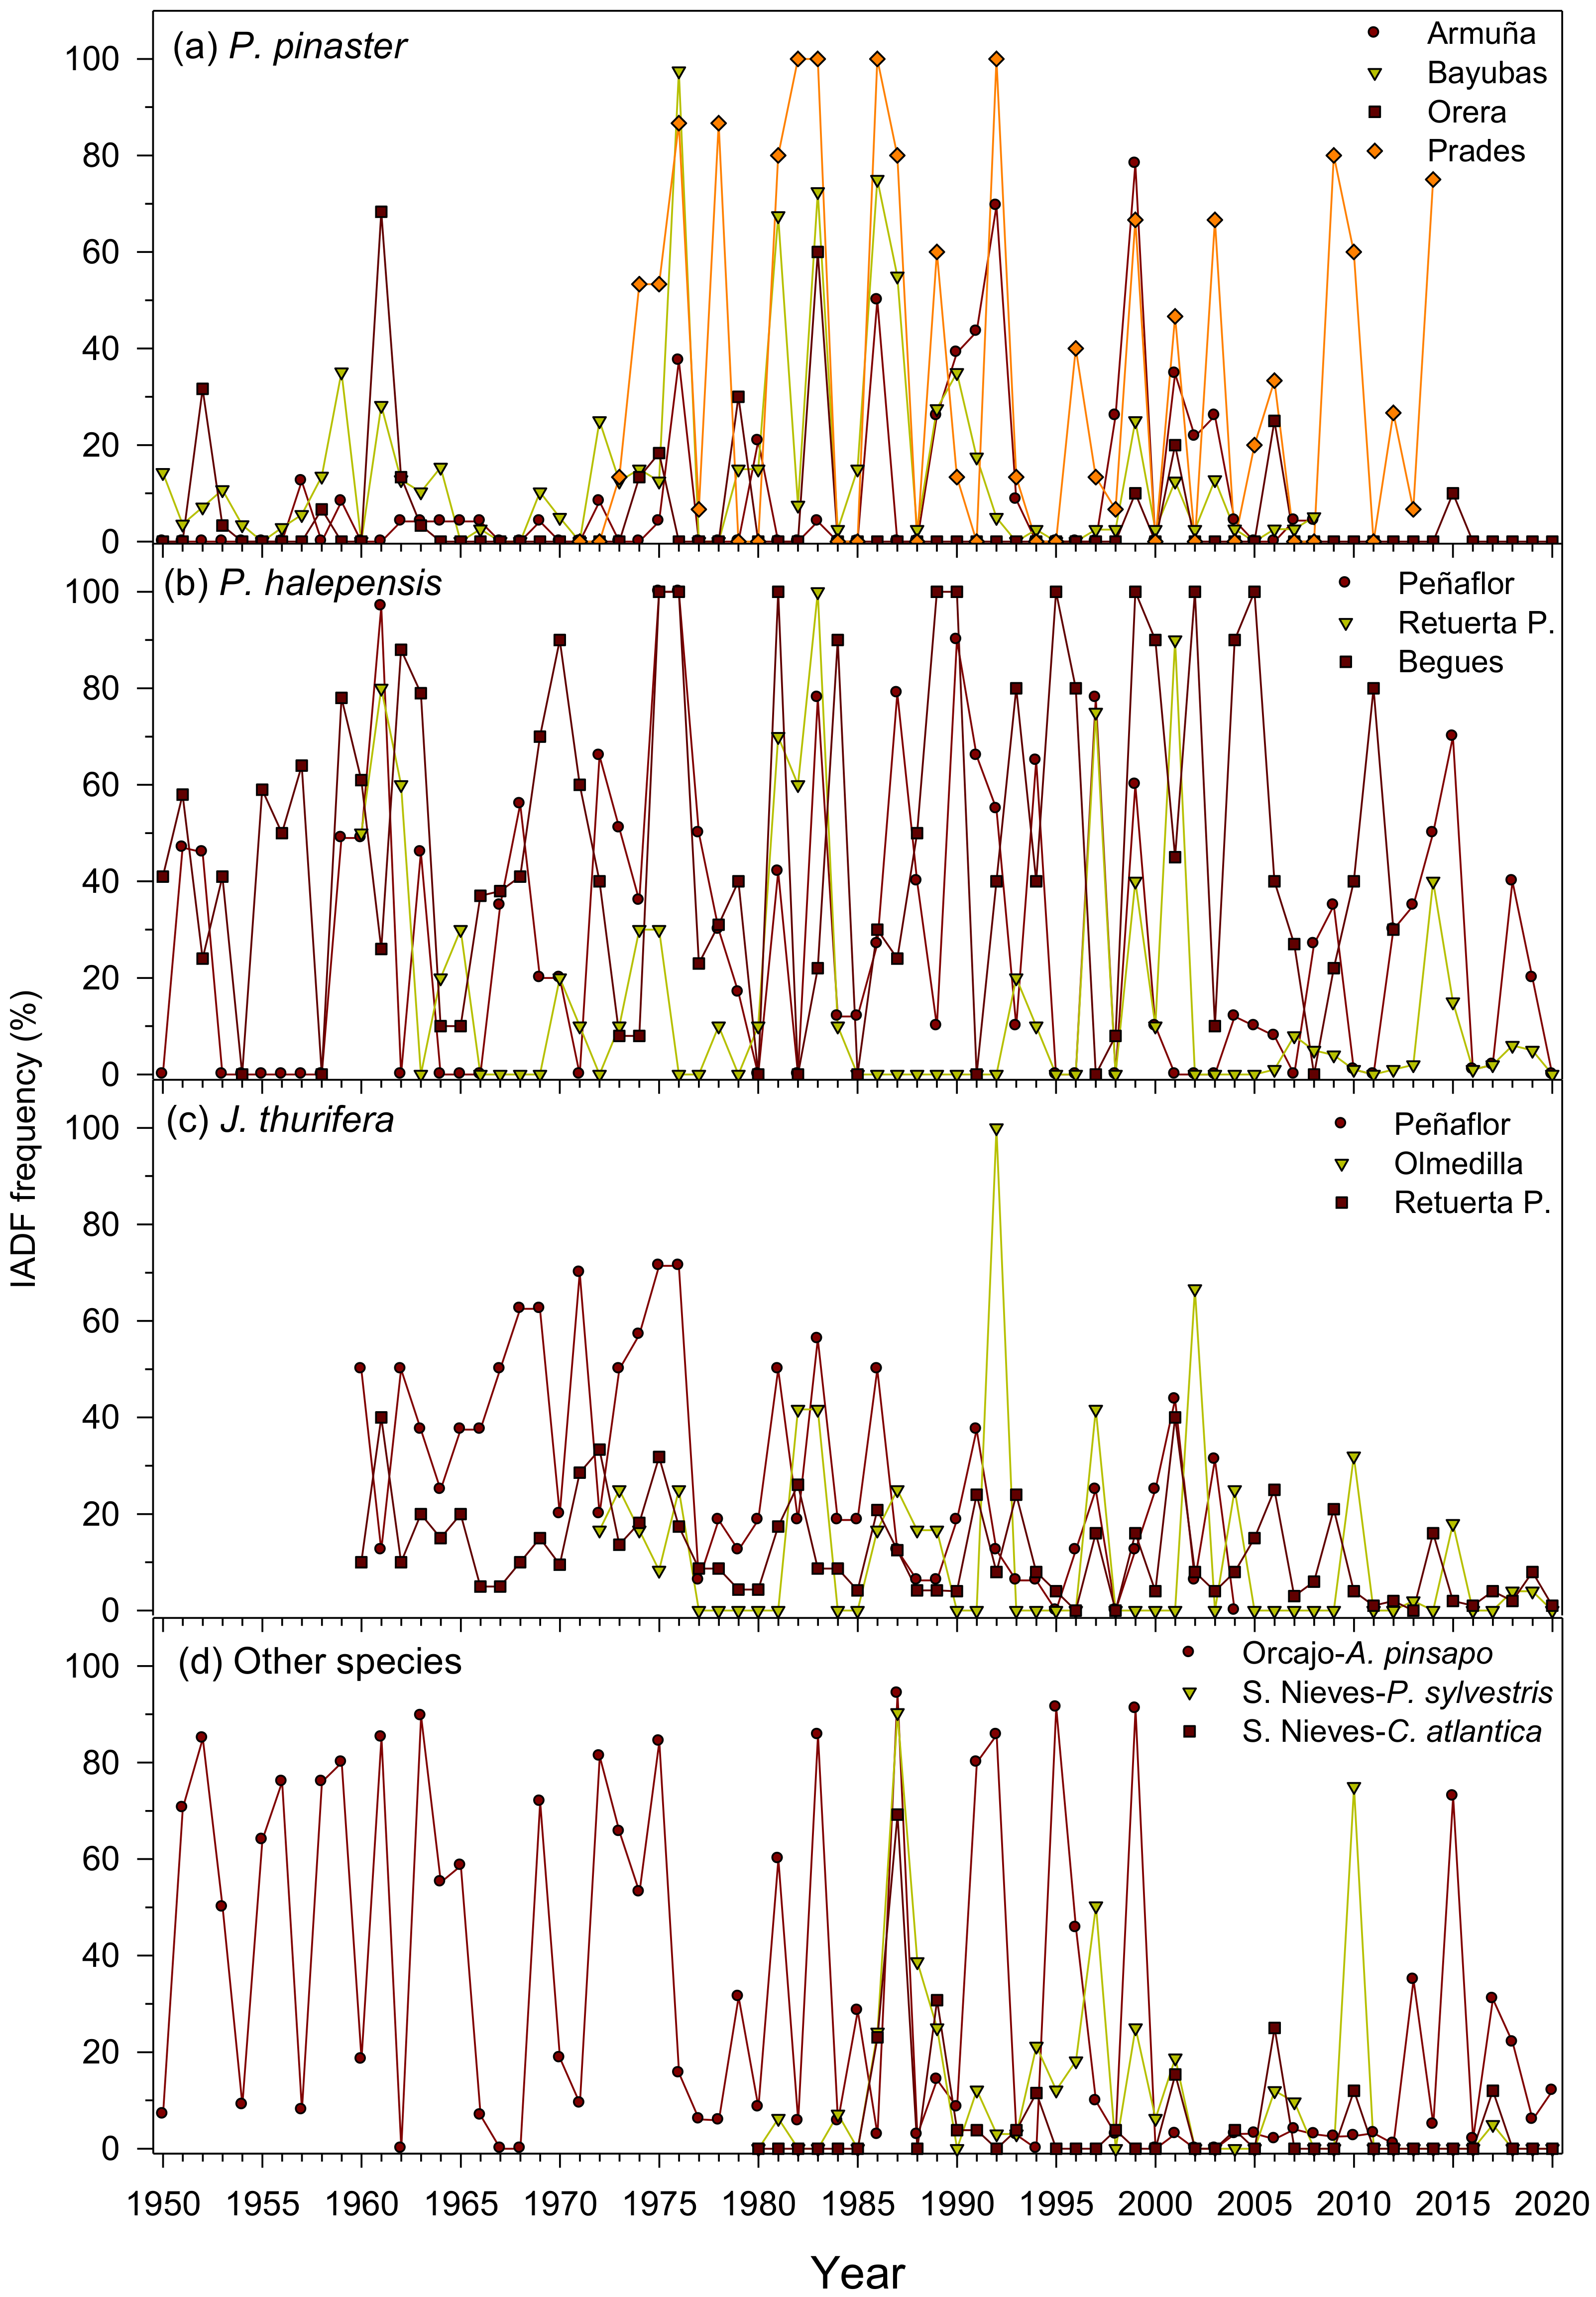
Figure 3.
Summary of climate–IADF relationships calculated at monthly scale in the six study tree species. Monthly climate variables are mean temperature (grey bars) and precipitation (blue bars). Months abbreviated by lowercase and uppercase letters correspond to the previous and current years, respectively. Wide and narrow bars correspond to Spearman correlations coefficients (rs) with significance levels lower or equal to 0.05 and 0.01, respectively.
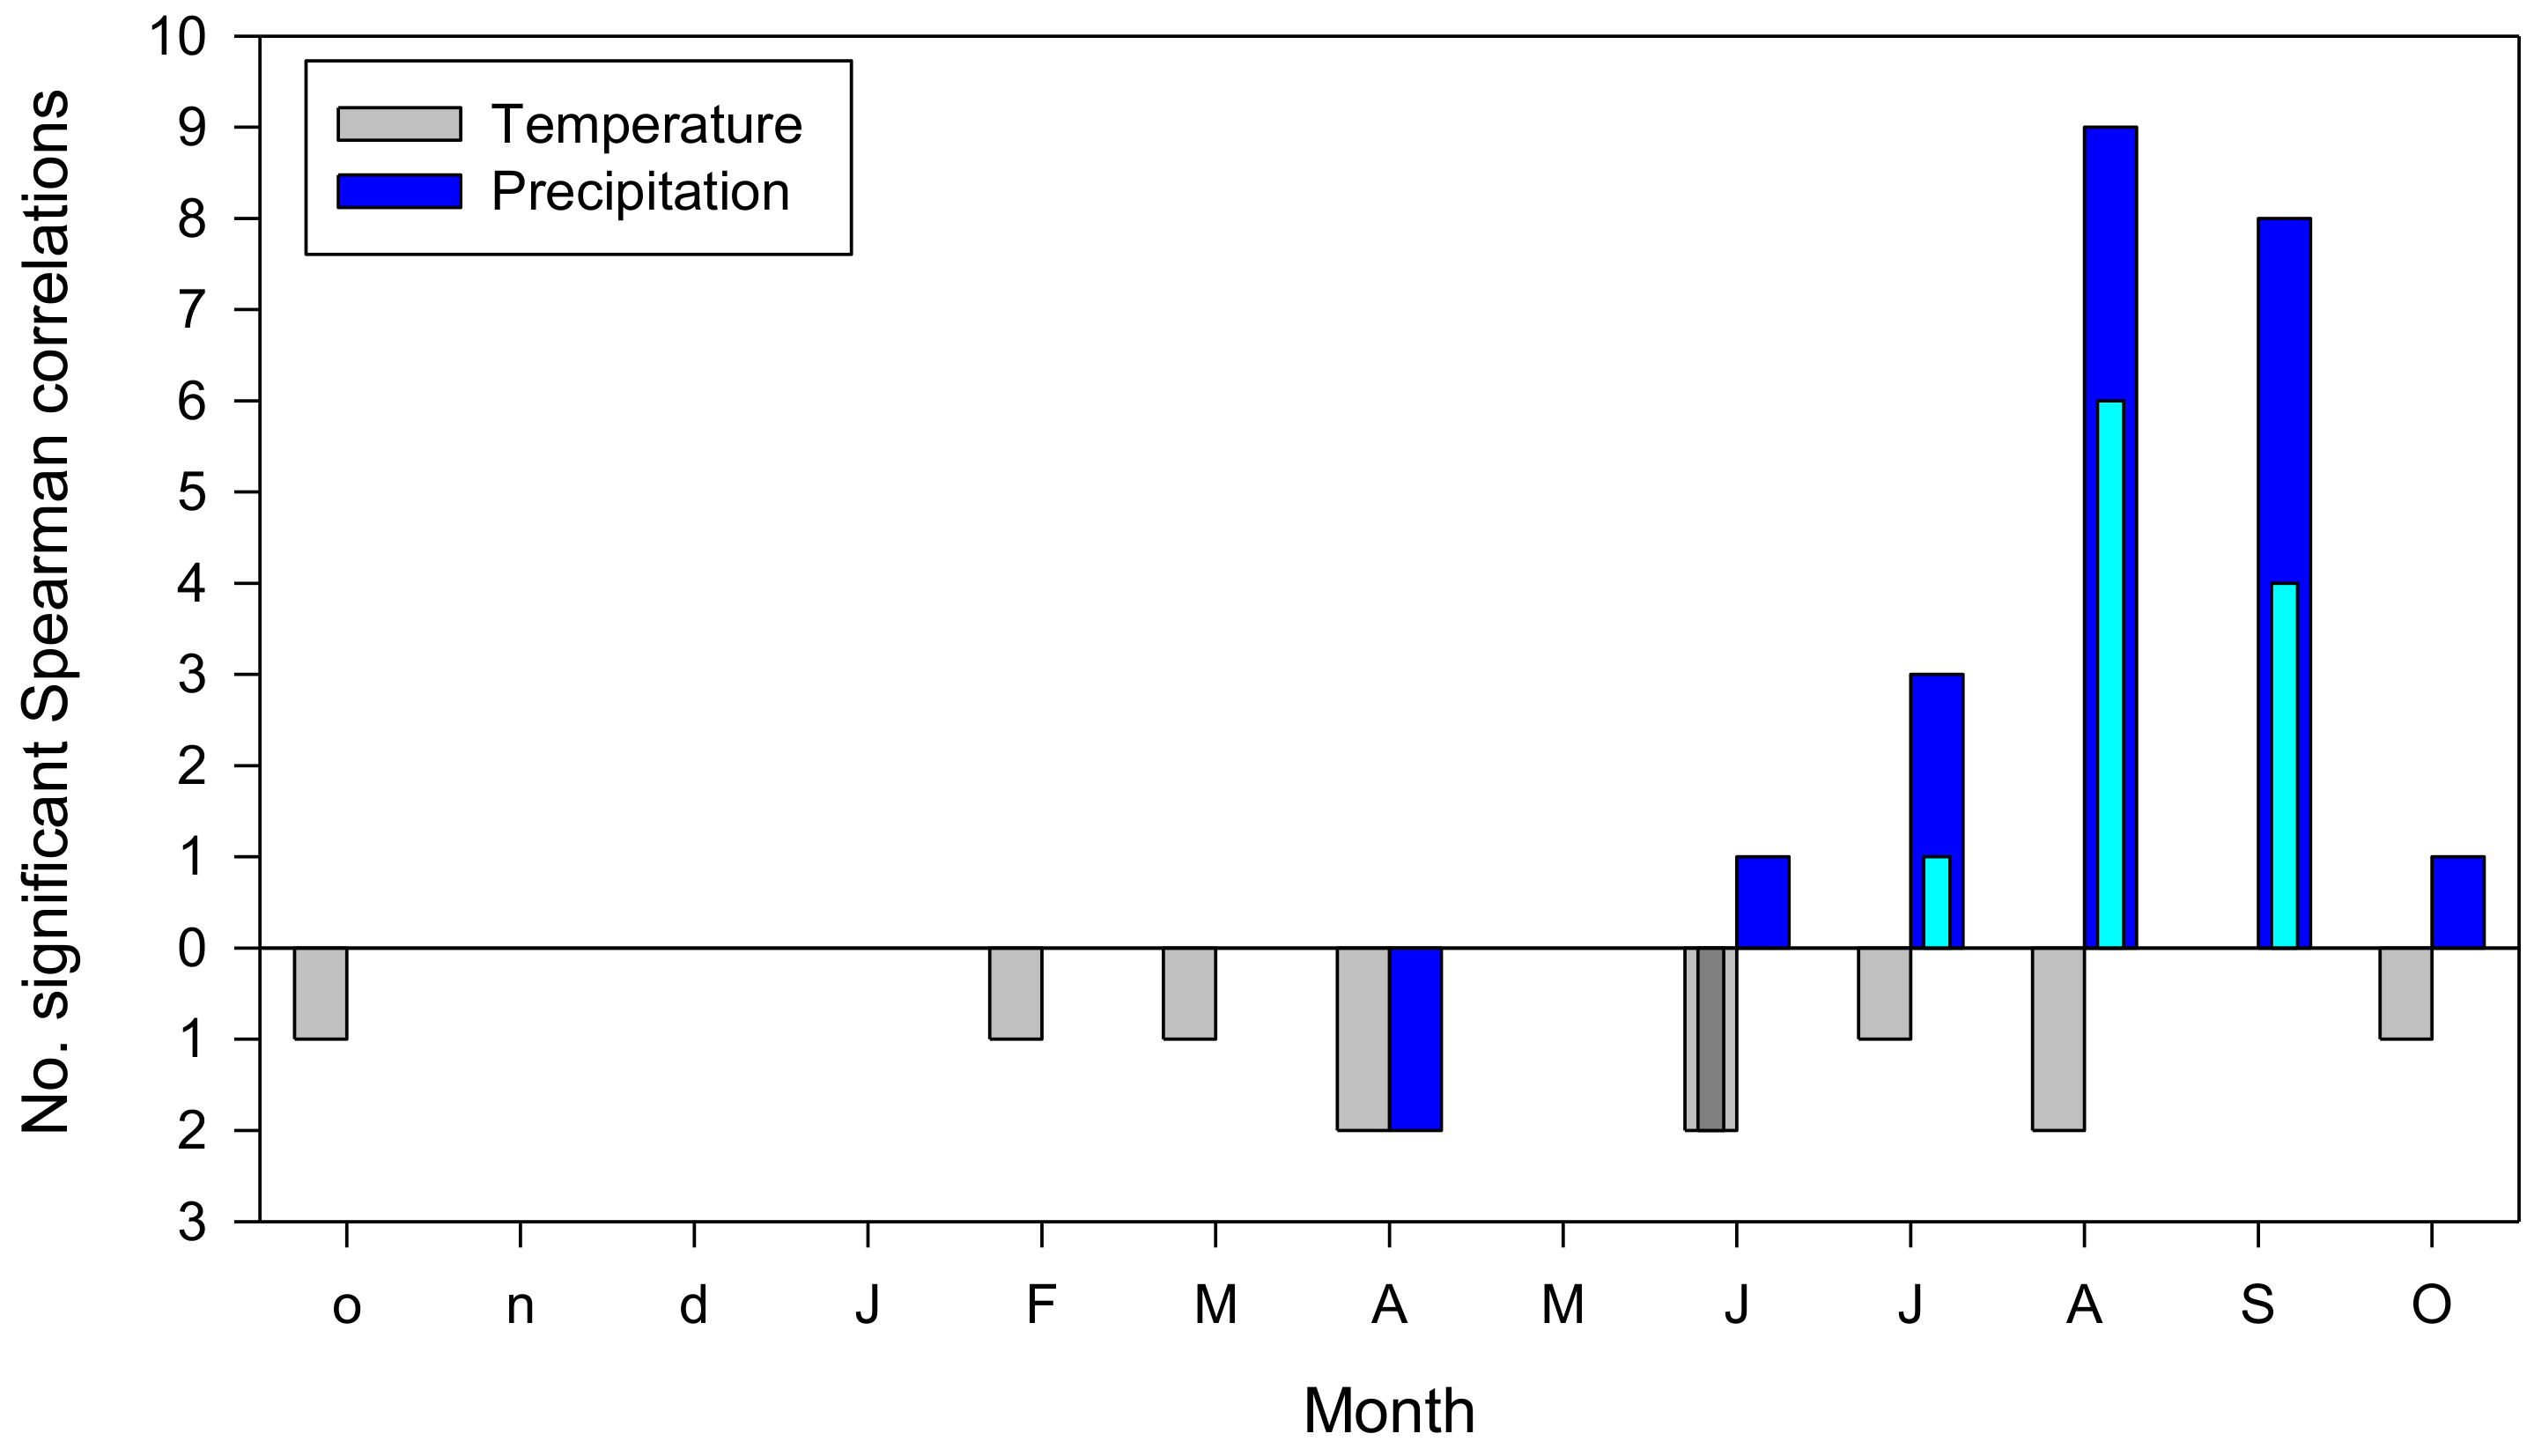
Figure 4.
Summary of climate–IADF relationships calculated with 10-day long precipitation windows in the six study tree species ((a), P. pinaster; (b), P. halepensis; (c,d), J. thurifera (black line and symbols), and A. pinsapo (blue line and symbols)). These correlations were only calculated in sites where there were meteorological stations with long-term (>30 years) precipitation records located less than 20 km away from sampled sites. Horizontal dashed and dotted lines show the 0.05 and 0.01 significance levels, respectively.
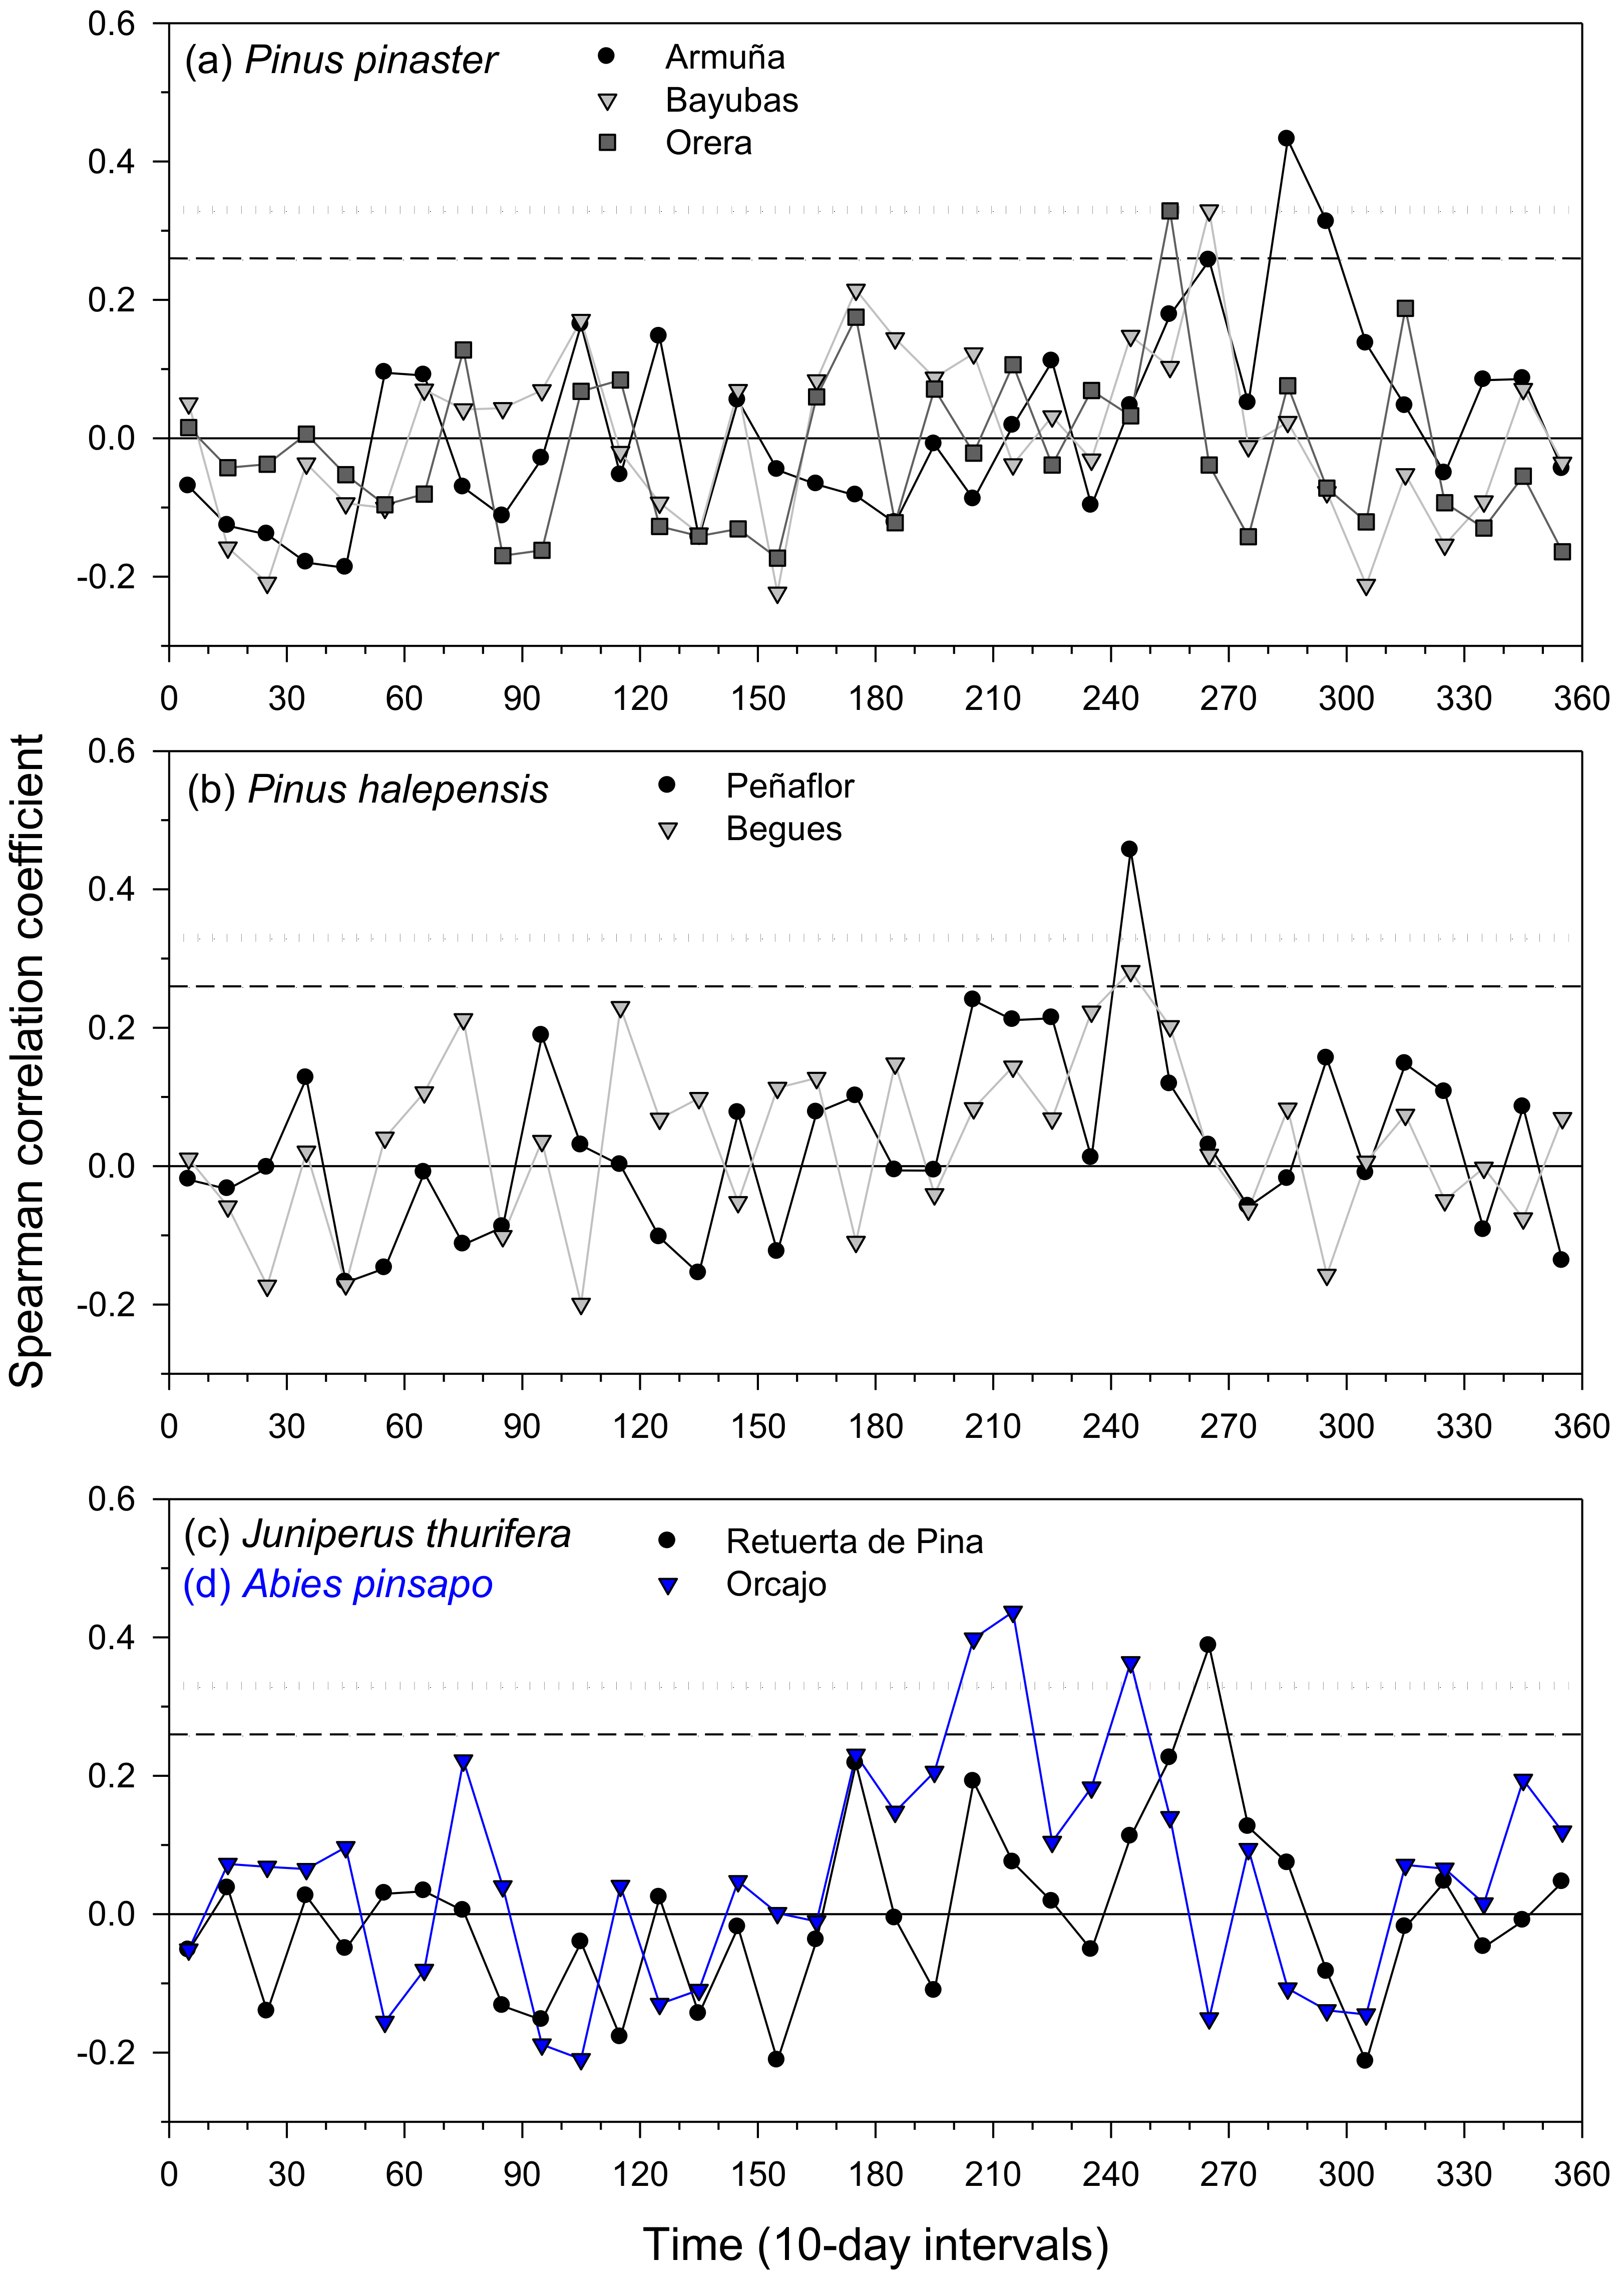
Figure 5.
Contraction, expansion, and growth hourly phases based on dendrometer data corresponding to two study species ((a), P. halepensis; (b), J. thurifera) from the Peñaflor study site. Data correspond to months when most IADFs are formed (August to September) and were obtained in the Peñaflor site during the period 2009–2011.
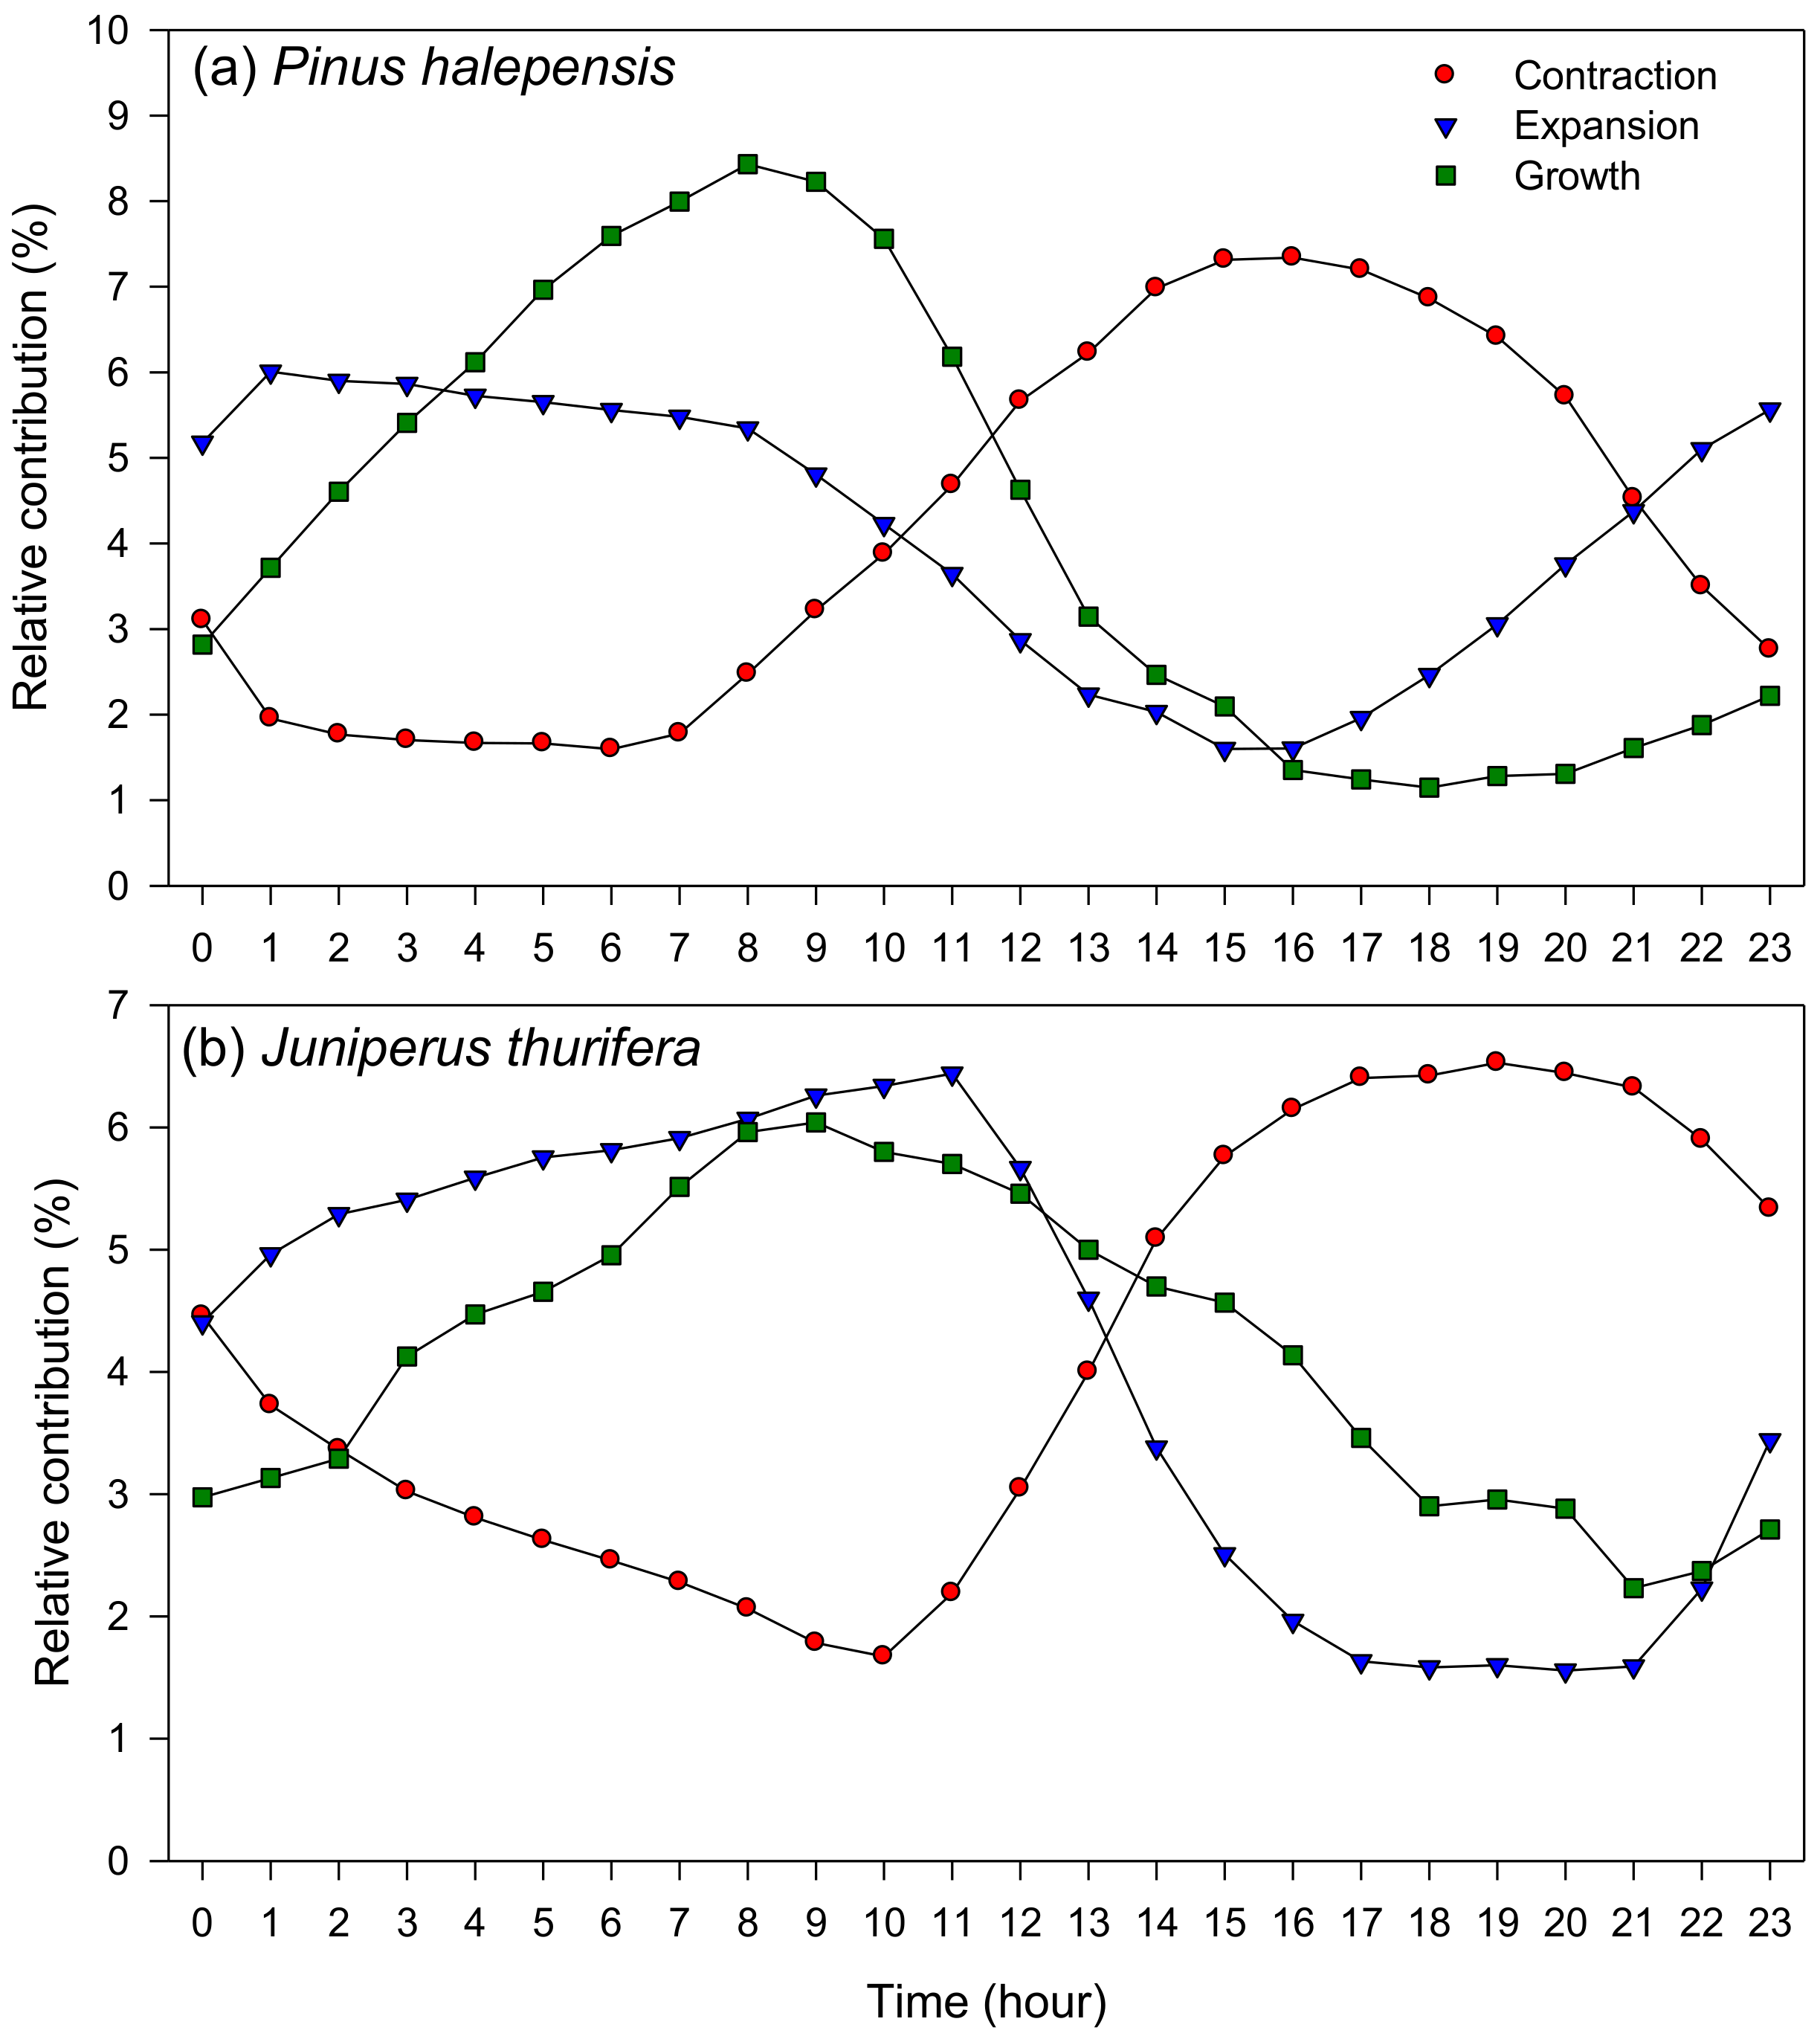
Figure 6.
Frequency of hours with conditions favorable to growth, i.e., positive precipitation values and VPD < 0.24 kPa. Values were binned with 2 h classes.
Figure 6.
Frequency of hours with conditions favorable to growth, i.e., positive precipitation values and VPD < 0.24 kPa. Values were binned with 2 h classes.
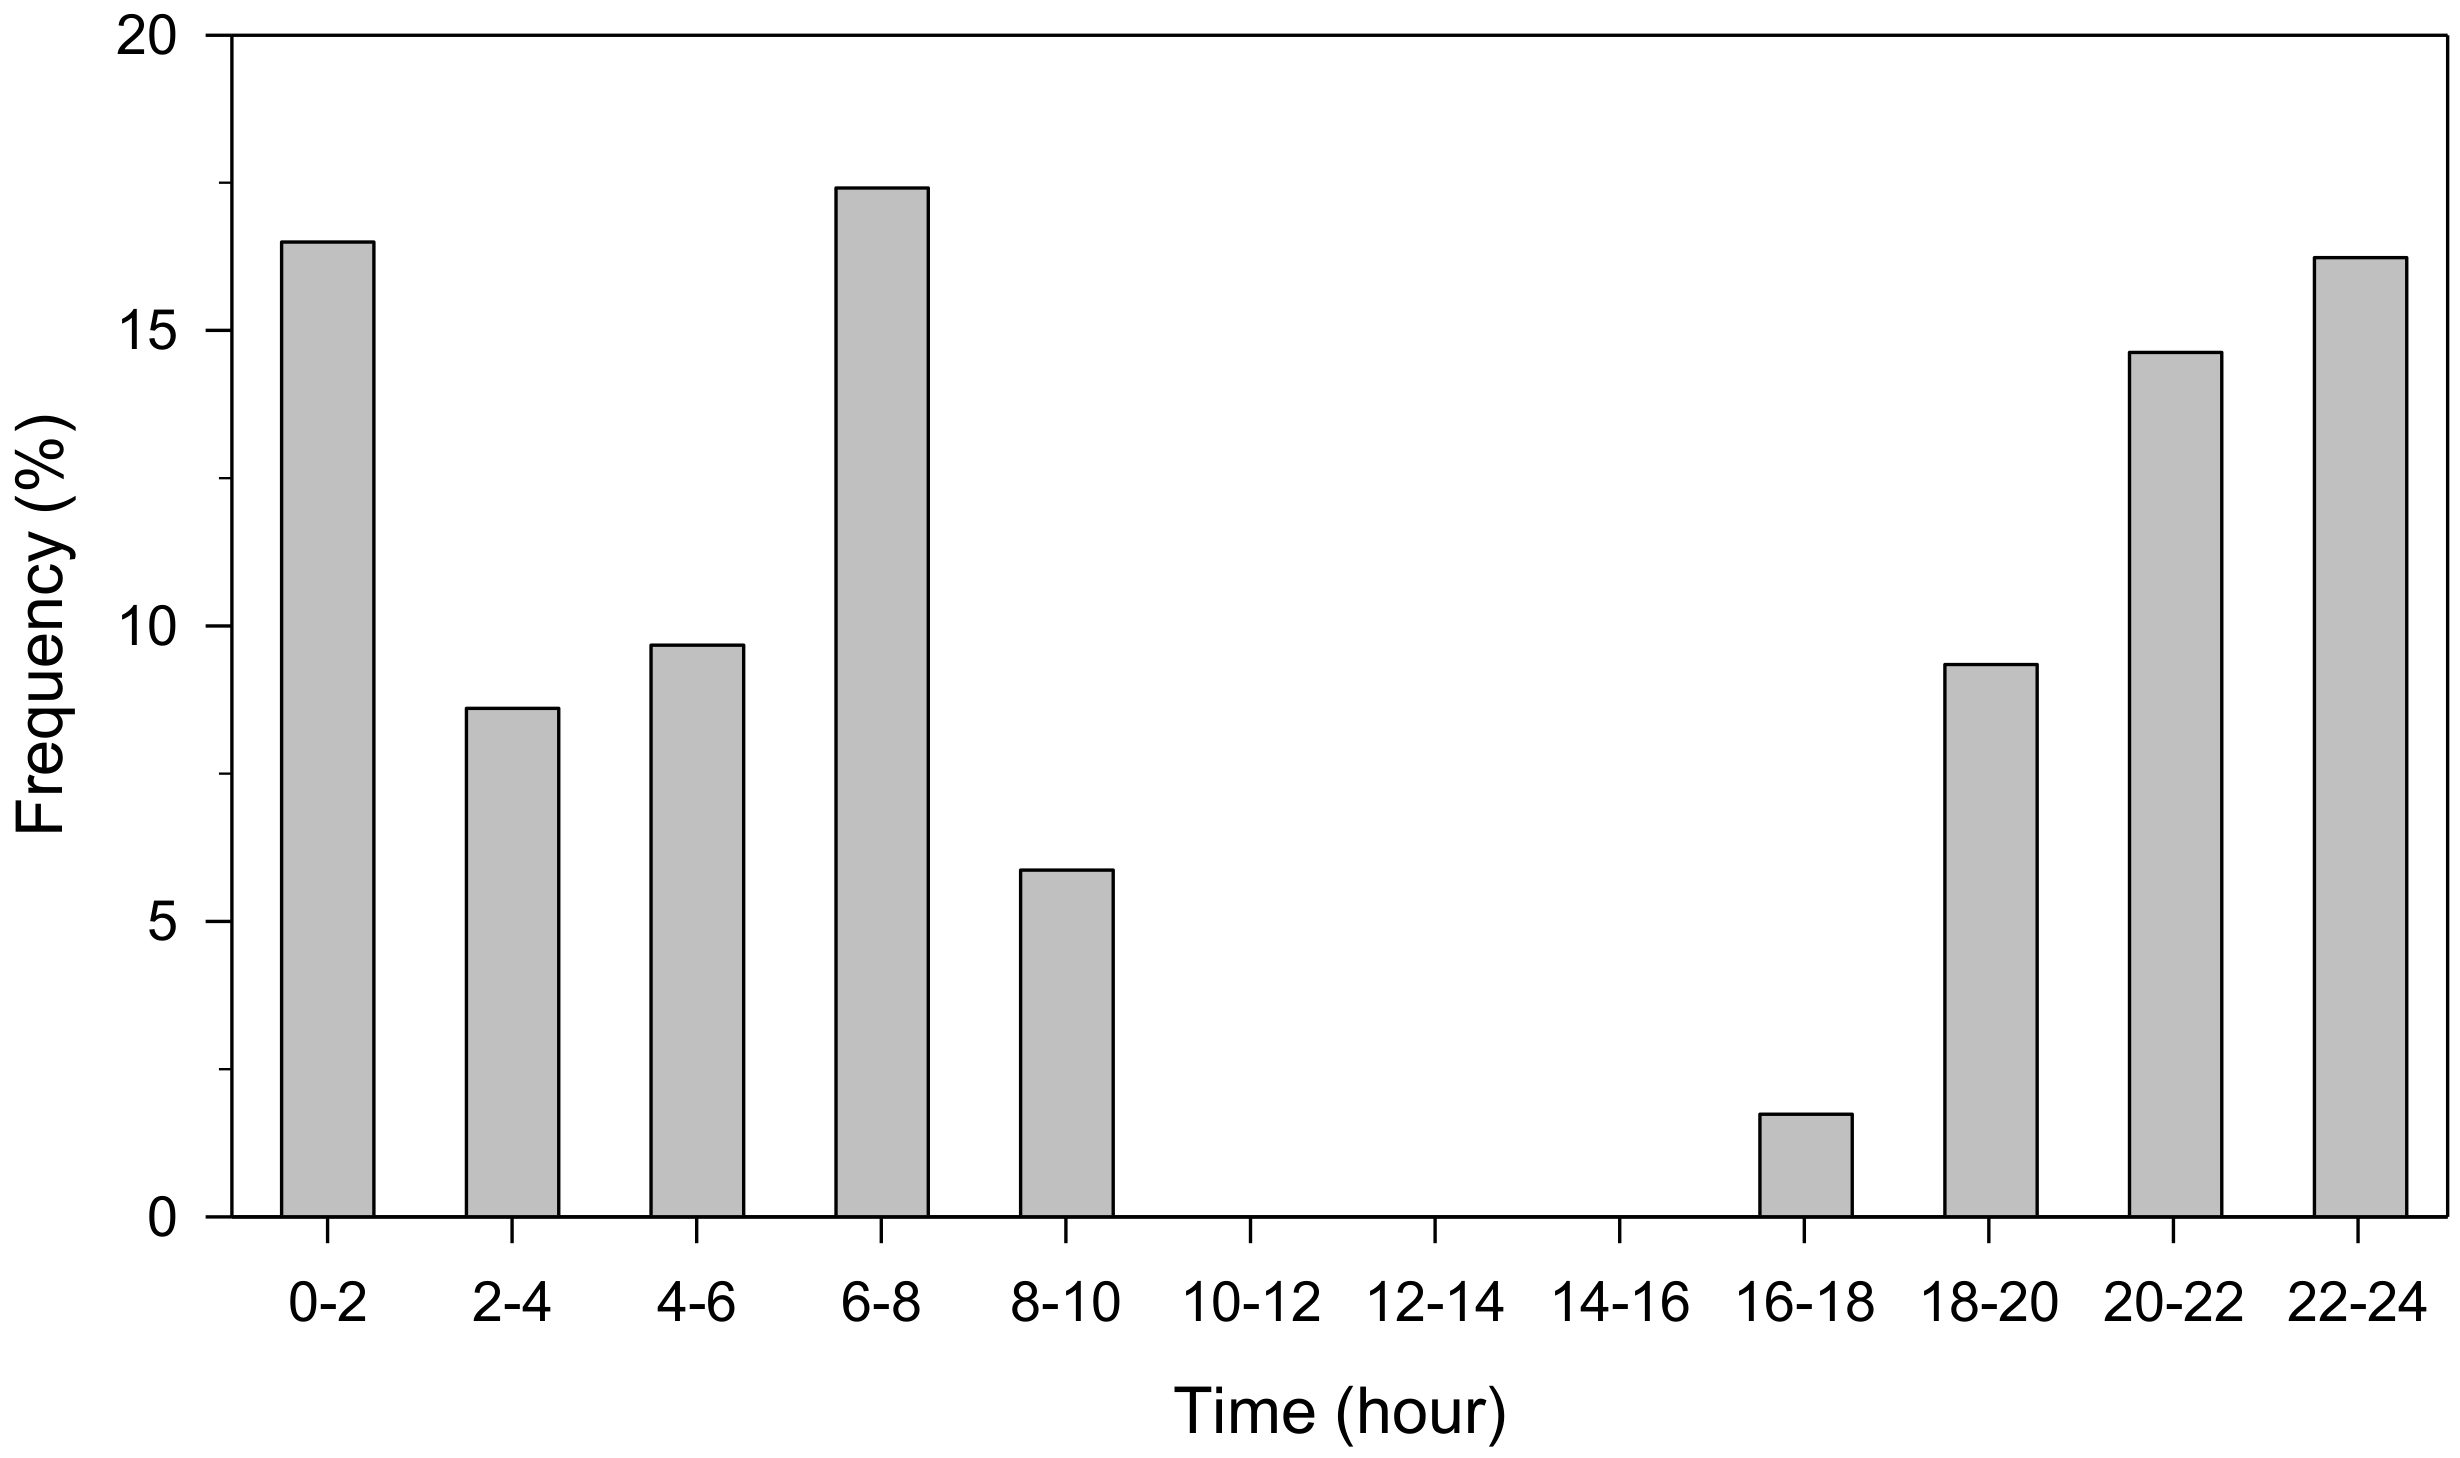
Figure 7.
Climate–growth relationships assessed in two sites with different climate conditions but presenting latewood IADFs and potential growth bimodality: (a,c), Pinus halepensis in north-eastern Spain; (b,d), Pinus edulis in south-western USA. Plots (a,b) show Pearson correlations calculated between ring-width indices and climate variables (Tn, mean minimum temperature; Tx, mean maximum temperature; Pr, precipitation). Plots (c,d) show partial Pearson correlations by relating growth and minimum temperature after controlling for the influence of maximum temperature (blue bars) and vice versa (red bars). Partial correlations are only presented for months when minimum or maximum temperatures showed significant (p < 0.05) correlations with ring-width indices (see plots (a,b)). Months abbreviated by lowercase and uppercase letters correspond to the previous and current years, respectively. Horizontal dashed and dotted lines correspond to the 0.05 and 0.01 significance levels, respectively.

Table 1.
Study species and sites where tree-ring chronologies were developed to quantify the annual percentage of IADF production in the latewood. The sites with asterisks (*) correspond to plantations. Dbh is the diameter at breast height (mean ± SD).
Table 1.
Study species and sites where tree-ring chronologies were developed to quantify the annual percentage of IADF production in the latewood. The sites with asterisks (*) correspond to plantations. Dbh is the diameter at breast height (mean ± SD).
| Tree Species | Site | Latitude N | Longitude (−W, +E) | Elevation (m a.s.l.) | Mean Temperature (°C) | Annual Precipitation (mm) | Dbh (cm) |
|---|---|---|---|---|---|---|---|
| Pinus pinaster | Armuña | 41.08 | −4.31 | 870 | 11.6 | 488 | 41.0 ± 2.3 |
| Bayubas | 41.53 | −2.89 | 850 | 10.5 | 527 | 31.2 ± 1.1 | |
| Orera | 41.30 | −1.46 | 884 | 13.0 | 412 | 28.3 ± 0.9 | |
| Prades * | 41.34 | 1.04 | 807 | 11.8 | 659 | 24.2 ± 2.6 | |
| Pinus halepensis | Peñaflor | 41.78 | −0.71 | 350 | 13.9 | 356 | 32.3 ± 4.6 |
| Retuerta de Pina | 41.48 | −0.26 | 360 | 13.2 | 378 | 29.6 ± 2.8 | |
| Begues | 41.34 | 1.89 | 300 | 13.2 | 673 | 24.0 ± 0.8 | |
| Juniperus thurifera | Peñaflor | 41.78 | −0.71 | 345 | 13.9 | 356 | 17.5 ± 2.9 |
| Olmedilla | 40.29 | −0.74 | 1350 | 9.8 | 496 | 29.0 ± 2.0 | |
| Retuerta de Pina | 41.48 | −0.26 | 360 | 13.2 | 378 | 25.0 ± 1.5 | |
| Abies pinsapo | Orcajo * | 41.09 | −1.51 | 1152 | 11.5 | 612 | 36.0 ± 1.9 |
| Pinus sylvestris | Sierra de las Nieves * | 36.65 | −4.93 | 1400 | 10.8 | 1180 | 33.2 ± 1.5 |
| Cedrus atlantica | Sierra de las Nieves * | 36.65 | −4.93 | 1400 | 10.8 | 1180 | 32.0 ± 2.0 |
Table 2.
Age and tree growth data and statistics calculated for the sampled sites. Variables’ abbreviations: AR1, first-order autocorrelation; MSx, mean sensitivity; IADF, percentage of years with latewood IADFs in the mean site series.
Table 2.
Age and tree growth data and statistics calculated for the sampled sites. Variables’ abbreviations: AR1, first-order autocorrelation; MSx, mean sensitivity; IADF, percentage of years with latewood IADFs in the mean site series.
| Tree Species | Site | Age at 1.3 m (Years) | No. Trees/No. Radii | Tree-Ring Width ± SD (mm) | AR1 | MSx | IADF (%) | Best-Replicated Period |
|---|---|---|---|---|---|---|---|---|
| Pinus pinaster | Armuña | 88 ± 3 | 15/41 | 2.42 ± 1.28 | 0.68 | 0.29 | 45.8 | 1898–2008 |
| Bayubas | 92 ± 4 | 22/46 | 1.48 ± 0.88 | 0.77 | 0.28 | 79.7 | 1876–2008 | |
| Orera | 87 ± 3 | 33/66 | 1.24 ± 1.11 | 0.73 | 0.47 | 19.7 | 1920–2019 | |
| Prades | 46 ± 2 | 25/50 | 1.30 ± 0.89 | 0.71 | 0.52 | 83.6 | 1975–2020 | |
| Pinus halepensis | Peñaflor | 89 ± 3 | 26/52 | 0.94 ± 0.27 | 0.52 | 0.44 | 62.5 | 1906–2020 |
| Retuerta de Pina | 75 ± 2 | 32/47 | 1.11 ± 0.21 | 0.72 | 0.36 | 47.8 | 1939–2020 | |
| Begues | 87 ± 3 | 22/43 | 0.98 ± 0.25 | 0.76 | 0.28 | 88.3 | 1941–2019 | |
| Juniperus thurifera | Peñaflor | 71 ± 2 | 21/42 | 1.21 ± 0.87 | 0.62 | 0.41 | 72.0 | 1941–2020 |
| Olmedilla | 88 ± 3 | 27/54 | 0.97 ± 0.47 | 0.65 | 0.32 | 44.0 | 1949–2019 | |
| Retuerta de Pina | 69 ± 3 | 32/55 | 1.09 ± 0.43 | 0.58 | 0.35 | 78.0 | 1964–2019 | |
| Abies pinsapo | Orcajo | 51 ± 2 | 17/35 | 2.37 ± 1.12 | 0.54 | 0.37 | 87.5 | 1970–2019 |
| Pinus sylvestris | Sierra de las Nieves | 40 ± 1 | 20/39 | 4.08 ± 1.67 | 0.75 | 0.22 | 56.7 | 1983–2019 |
| Cedrus atlantica | Sierra de las Nieves | 37 ± 1 | 18/34 | 5.02 ± 1.25 | 0.56 | 0.22 | 36.7 | 1986–2019 |
Table 3.
Relationships observed between tree growth rate (tree-ring width) or age and the amount of IADFs produced by trees assessed using the Spearman correlation coefficient (rs) and its significance level (p). Note that the correlations between growth rate and IADF production were calculated considering all measured rings.
| Tree Species | Site | Growth Rate | Age | |||
|---|---|---|---|---|---|---|
| rs | p | No. Rings | rs | p | ||
| Pinus pinaster | Armuña | 0.411 | <0.001 | 1123 | −0.381 | <0.001 |
| Bayubas | 0.383 | <0.001 | 1459 | −0.599 | <0.001 | |
| Orera | 0.453 | <0.001 | 2189 | −0.267 | 0.207 | |
| Prades | 0.351 | <0.001 | 820 | 0.152 | 0.521 | |
| Pinus halepensis | Peñaflor | 0.296 | <0.001 | 955 | −0.709 | 0.015 |
| Retuerta de Pina | 0.181 | <0.001 | 552 | −0.246 | 0.217 | |
| Begues | 0.130 | <0.001 | 1380 | −0.596 | 0.023 | |
| Juniperus thurifera | Peñaflor | 0.271 | <0.001 | 712 | −0.056 | 0.835 |
| Olmedilla | 0.158 | <0.001 | 748 | 0.320 | 0.338 | |
| Retuerta de Pina | 0.352 | <0.001 | 904 | −0.202 | 0.196 | |
| Abies pinsapo | Orcajo | 0.198 | <0.001 | 1708 | 0.275 | 0.210 |
| Pinus sylvestris | Sierra de las Nieves | 0.339 | <0.001 | 799 | 0.157 | 0.591 |
| Cedrus atlantica | Sierra de las Nieves | 0.141 | <0.001 | 691 | 0.241 | 0.223 |
Publisher’s Note: MDPI stays neutral with regard to jurisdictional claims in published maps and institutional affiliations. |
© 2022 by the author. Licensee MDPI, Basel, Switzerland. This article is an open access article distributed under the terms and conditions of the Creative Commons Attribution (CC BY) license (https://creativecommons.org/licenses/by/4.0/).
Share and Cite
MDPI and ACS Style
Camarero, J.J. Why Intra-Annual Density Fluctuations Should Be Formed at Night? Implications for Climate–Growth Relationships in Seasonally Dry Conifer Forests. Forests 2022, 13, 1425. https://doi.org/10.3390/f13091425
AMA Style
Camarero JJ. Why Intra-Annual Density Fluctuations Should Be Formed at Night? Implications for Climate–Growth Relationships in Seasonally Dry Conifer Forests. Forests. 2022; 13(9):1425. https://doi.org/10.3390/f13091425
Chicago/Turabian StyleCamarero, Jesús Julio. 2022. "Why Intra-Annual Density Fluctuations Should Be Formed at Night? Implications for Climate–Growth Relationships in Seasonally Dry Conifer Forests" Forests 13, no. 9: 1425. https://doi.org/10.3390/f13091425
Note that from the first issue of 2016, this journal uses article numbers instead of page numbers. See further details here.