Article

Predicting the Potential Distribution of the Endangered Plant Cremastra appendiculata (Orchidaceae) in China under Multiple Climate Change Scenarios

1
National Engineering Laboratory for Resource Development of Endangered Crude Drugs in Northwest of China, Key Laboratory of the Ministry of Education for Medicinal Resources and Natural Pharmaceutical Chemistry, College of Life Sciences, Shaanxi Normal University, Xi’an 710119, China
2
Fengxian Science and Technology Development Center, Baoji 721700, China
*
Authors to whom correspondence should be addressed.
Forests 2022, 13(9), 1504; https://doi.org/10.3390/f13091504
Submission received: 23 August 2022 / Revised: 13 September 2022 / Accepted: 13 September 2022 / Published: 16 September 2022
(This article belongs to the Section Forest Ecology and Management)

Abstract

:
Cremastraappendiculata (Orchidaceae) is a perennial medicinal herb, which is included in the national second-class protected plant catalog in China. Due to the influences of climate change and anthropogenic activities, in conjunction with soaring commercial prices, the wild sources of C. appendiculata have been drastically reduced and are in danger of extinction. Consequently, it is important to predict the distribution of potentially suitable growth/propagation areas for C. appendiculata under the backdrop of climate change for its protection and sustainable use. For this study, an optimized maximum entropy model was employed to analyze the distribution patterns and changes of potentially suitable regions for C. appendiculata during different periods since the Last Glacial Maximum (LGM, 18–24 ka). Based on multiple climate change scenarios (SSP1-2.6, SSP2-4.5, SSP3-7.0, and SSP5-8.5), the distribution range of C. appendiculata was predicted for the 2050s (average for 2041–2060), 2070s (average for 2061–2080), and 2090s (average for 2081–2100). The results revealed that during the LGM period, the highly suitable growth area for C. appendiculata was 0.28 × 10⁴ km2, which accounted for only 3.26% of the current highly suitable growth area. During the mid-Holocene (MH, 6 ka) period, the area of highly suitable regions increased to 8.38 × 10⁴ km2, which accounted for 99.30% of the present highly suitable growth area. Further, the cumulative existing potentially suitable growth area for C. appendiculata is 213.9 × 10⁴ km2, which accounts for 22.28% of China’s territory. Of these lands, the low, medium, and high suitable areas are 147.76 × 10⁴ km2, 57.71 × 10⁴ km2, and 8.44 × 10⁴ km2, respectively. The highly suitable areas are primarily distributed across Sichuan, Gansu, Shaanxi, Chongqing, Guizhou, Hubei, and Anhui Provinces. Moreover, in the future the potentially suitable growth areas for C. appendiculata will decrease to varying degrees. Further, the results of this study found that the relatively low impact areas for C. appendiculata were mainly distributed across Shaanxi, Sichuan, Chongqing, and Guizhou Provinces. Centroid transfer analysis indicated that the center of potentially suitable growth areas for C. appendiculata shifted to the northwest in SSP2-4.5 and SSP3-7.0, while they initially shifted to the northwest and then to the southeast in SSP1-2.6 and SSP5-8.5.

1. Introduction

Climate change/global warming has significantly impacted the distribution of various ecosystems, and the effects of future climate change will likely modify the habitat, scope, and distribution of myriads of species [1,2,3]. According to the Fifth Assessment Report (AR5) of the Intergovernmental Panel on Climate Change (IPCC), the average global surface temperature is anticipated to rise 0.3–4.8 °C by the end of this century [4,5]. Global warming has triggered an array serious of environmental issues, such as changes in the spatial patterns of species, which threatens species diversity and sustainable development [6]. A continually warming climate might lead to the extinction of geographically limited species and endemic species that are unable to adapt to unusual climatic conditions [7]. Increases in drought, heat stress, and extreme weather events may produce an unprecedented series of pressures for species [8,9]. As endangered plants have very specific habitat requirements [10], the determination of their current geographical distributions, population status, and identification of specific threats and extinction risks are key for their conservation. Therefore, an elucidation of the distribution dynamics of endangered plant species under climate change is beneficial toward the formulation of robust protection strategies.
The evolutionary trajectories, ecological habits, and terrestrial distribution of plant species are affected, restricted, and driven by climate change and human activities, which are also the key to the formation of ecosystem biodiversity [11,12,13,14]. The Last Glacial Maximum (LGM) refers to the most recent period in Earth’s history when the glaciers were at their thickest and sea levels at their lowest, roughly between 24,000–18,000 years ago [15]. Due to rapid climatic deterioration, some species became extinct, while the distribution areas of most surviving species also dropped sharply [16,17,18], as many surviving species migrated to glacier shelters [17,19]. With post-glacial warming (Holocene), surviving plant populations began to expand from these shelters to new suitable habitats.
Ecological niche models (ENMs) (also known as species distribution models), may be employed to predict the spatial distributions of target species, assess the potential responses of organisms to climate change, and determine species niches based on their environmental conditions [20,21]. The ENMs can forecast the potential terrestrial distribution of species in selected landscapes through pattern matching, or through effective statistical linking where species exist within certain environmental variables [22]. Its predictive results are stable and reliable, and the estimation accuracy of the distribution of endangered species is high, even for small sample sizes [23]. MaxEnt software analyzes climate data to estimate past and future species distribution for potentially suitable growth areas to determine sites for relatively stable species habitats, as well as their migration and dispersal pathways [14]. MaxEnt has been successfully employed for nature reserve design, endangered species surveys, infectious diseases, exotic species risk assessments, and climate change impact studies on plant habitats, for example, Semiliquidambar cathayensis [14], Bacillus anthracis [22], Ageratina adenophora [24], and Ziziphus spinosa [25].
Cremastra appendiculata (D. Don) Makino (Orchidaceae) is a perennial herb with underground pseudobulbs that are utilized as medicine, with narrow oval and long-stalked single leaves that emanate from the tops of the pseudobulbs. According to traditional Chinese medicine, C. appendiculata has the effect of clearing heat and detoxifying the body, moistening the lungs, and relieving cough, and activating blood circulation to relieve pain. It can be used externally to treat snake and insect bites and skin burns and taken internally to fight liver cancer and breast cancer. Cremastra appendiculata (D. Don) Makino typically grows in forest or ravine wetlands at altitudes of from 500–2900 m [26]. In China, it is distributed across the Gansu, Shaanxi, the Yangtze River Basin, as well as in Southwest and Southern China. Cremastra appendiculata grows well in humus soil, is a cross-pollination plant, and due to the unique structure of its flowers, the fruiting rate is only 1.3%–2% under natural conditions, as it must be fertilized with the help of insects [27]. It has been listed as a Grade-II state-protected plant by the central government. In addition to its excellent ornamental value, C. appendiculata is one of the sources of the traditional Chinese medicine “Shancigu”. Its pseudobulbs contain chemical compounds such as bibenzyl, phenanthrenes, and alkaloids [26], and studies have confirmed that the pseudobulbs have significant positive effects for the treatment of cancer. Thus, wild sources of C. appendiculata have been subject to predatory harvesting, coupled with the restriction of its own reproductive mechanisms and the destruction of its shaded habitats. Its habitat area has gradually dwindled, which has resulted in a sharp drop in the number of scattered and wild distributions, leading it to the verge of extinction. Thus, C. appendiculata has been added to the National Key Protected Wild Plants list, which means that it is in urgent need of protection. Therefore, accurate estimates of the distribution of potentially suitable habitats for C. appendiculata in the context of climate change are of great significance for the conservation and sustainable use of its resources.
This study employed an optimized maximum entropy model to analyze the distribution patterns and changes in potentially suitable growth regions for C. appendiculata in the LGM, MH, modern times (1970–2000), under multiple shared socioeconomic pathways (SSP1-2.6, SSP2-4.5, SSP3-7.0, and SSP5-8.5) over different periods (2050s, 2070s, and 2090s). The objectives of this research work were to: (1) predict the potential geographic distribution of C. appendiculata under different climate scenarios, (2) understand the relevant environmental factors that affect the geographical distribution of C. appendiculata, (3) predict the relatively stable habitats of C. appendiculata under climate change, and (4) provide a theoretical basis for the conservation of germplasm resources and the delineation of suitable artificial cultivation areas for C. appendiculata.

2. Materials and Methods

2.1. Study Area

Wild C. appendiculata is mainly distributed across the subtropical regions of central and southern China, including Hunan, Hubei, Guizhou, Sichuan, Chongqing, and Taiwan Provinces. Its distribution is bounded by Jinzhong City, Shanxi Province in the north, Chiayi City of Taiwan Province in the east, Linzhi City of the Tibet Autonomous Region in the west, and Honghe Prefecture of Yunnan Province in the south. The geographical coordinates of the natural range of C. appendiculata are 23°07′84″–36°89′53″ N and 95°8′67″–120°8′93″ E.

2.2. Species Distribution Point Data

From 2020 to 2021, the distribution data of 25 C. appendiculata in southern Shaanxi, Gansu, Shanxi, and Yunnan were systematically collected through field investigations. Furthermore, data for 97 C. appendiculata distribution points were obtained by consulting the scientific literature and public databases [China National Knowledge Infrastructure/CNKI (https://www.cnki.net (accessed on 10 January 2022)), China Digital Plant Herbarium/CVH (https://www.cvh.ac.cn (accessed on 10 January 2022)), and Global Biodiversity Information Facility/GBIF (https://www.gbif.org (accessed on 10 January 2022))]. To reduce the spatial autocorrelation of sample points, some relatively concentrated sample plots were excluded for this study to ensure that the spatial distance between any two sampling points was >10 km. Finally, 108 occurrence point datasets were selected for MaxEnt modeling [28], (Figure 1; Table S1).

2.3. Filtering of Environment Variables

Climate change/global warming is the most important environmental factor that impacts the distribution of suitable species habitats; thus, climate factors are often used in the development of plant habitat models [29,30]. The bioclimatic factors selected for this study were downloaded from the WorldClim website (https://www.worldclim.org (accessed on 22 March 2022)), which covered the past (LGM, MH), contemporary (1970–2000), and future (2050s, 2070s & 2090s).
Considering the influences of climate scenario selection on model prediction results, we selected four shared socioeconomic pathways (SSPs; SSP1-2.6, SSP2-4.5, SSP3-7.0, and SSP5-8.5), which corresponded to three general circulation models (GCMs; BCC-CSM2-MR, CNRM-CM6-1, and MIROC-ES2L GCMs) in the future chronological climate data, after which the prediction layers corresponding to each SSP were arithmetically averaged. Further analyses were arithmetically performed on the composite layers for each SSP to reduce the uncertainty of individual circulation patterns in predicting the distribution of potentially suitable species habitats. Therefore, a total of 37 sets of climate data were used in this study, including one set of contemporary and 36 sets of future climate data. The spatial resolution of these data was 2.5 arc min.
The selection of climatic factors has an important influence on the accuracy of model predictions. Based on the species distribution data and 19 bioclimatic factors, we analyzed the most important bioclimatic factors that affected the distribution of potential C. appendiculata habitats using Pearson’s correlation coefficient and the Jackknife method. Secondly, the Pearson correlation coefficients between the 19 bioclimatic factors were calculated, and |R| ≥ 0.8 was used as the threshold for determining the significant correlation between climatic factors. Finally, for each pair of significantly correlated variables, only the variable with the largest contribution was retained [28,31,32].

2.4. Model Building, Optimization, and Evaluation

For this study, MaxEnt v3.4.1 software [33] was employed to construct the maximum entropy model for C. appendiculata. To ensure that the distribution of C. appendiculata presented a probability that was close to a normal distribution, we selected 70% of the data for model training, and the remaining data for model testing. Further, for error reduction, the maximum number of parameter repetitions was 5000, each process was repeated 10 times, and other settings were defaults [34,35].
We optimized the feature class (FC) and regularization multiplier (RM) of the model using the <kuenm> language package [36] in the R v3.4.1 program. First, the RM was set to 0.1–4, with each interval at 0.1, for a total of 40 RM values. Next, the four FCs of the MaxEnt model [Linear (L), Quadratic (Q), Hinge (H), Product (P)] were combined to form 15 FC combinations [L, P, Q, H, LP, LQ, LH, LPQ, LPH, LQH, LPQH, PQH, PQ, PH, and QH], and a total of 600 FC and RM multiplication parameter combinations. We selected the model (OR_AICc) with a statistically significant omission rate below the threshold (0.05), and the delta AICc value was not higher than 2 as the basis for determining the optimal model [37,38].

2.5. Model Reliability Test and Suitable Habitats Classification

Once the model was developed, the area under the receiver operating characteristic curve (AUC) value was typically used to test its accuracy. The AUC value was (0, 1), and the higher the AUC value, the more credibility of distinguishing the suitable and unsuitable habitats, where the AUC ≥ 0.9 indicated a very accurate model prediction [39,40].
Further, the habitat suitability for a species was generally represented by a value between 0 and 1, with a larger value indicating that the species was more suitable for growth in a given area. Tang et al. [41] argued that the maximum test sensitivity plus specificity (MTSPS) threshold was superior to other threshold options for the ranking of suitable habitats. For this study, the MTSPS was also employed as a threshold to segregate the unsuitable areas below the threshold, and the value between the threshold and 1 was further divided into three parts: low, medium, and high suitable habitats [32,42].

2.6. Analysis of Relatively Stable Suitable Habitats and Changes in Spatial Patterns

Relatively stable suitable habitats refers to the areas where species are relatively unaffected by climate change [43], which are obtained by overlaying binary prediction maps of suitable habitats of different ages, and taking the completely overlapping part. First, DIVA-GIS v7.5 software (http://www.diva-gis.org (accessed on 20 April 2022)) was used to superimpose the distribution maps of potential suitable habitats of different generations, where the spatial units with probability values greater than the MTSPS threshold were redefined as suitable habitats for the species. The spatial units, whose probability values were less than the threshold, were considered as non-suitability zones, after which the unsuitability and suitability matrices of C. appendiculata were established. Finally, the overlapping portion of the overlaid layer was selected. For this study, we forecast the relatively stable suitable habitats for C. appendiculata in the past (LGM and MH) and present, under four different shared socioeconomic pathways (SSP2-4.5 and SSP5-8.5), as well as for the future (2050s, 2070s, and 2090s), respectively.
Spatial pattern variation refers to changes in the potential suitable habitats of species across generations, which were obtained by superimposing the bivariate prediction maps of suitable habitats across generations [44,45,46]. DIVA-GIS v7.5 software was used to superimpose the distribution maps of potentially suitable areas over different generations to establish the matrix of non-suitable and suitable areas of C. appendiculata. Based on the matrix, spatial pattern changes in the suitable distribution areas for C. appendiculata under past, contemporary, and future climate change scenarios were further analyzed. Finally, the past, present, and future potential habitats of C. appendiculata under different shared socioeconomic pathways were analyzed using spatial pattern changes.

2.7. Core Distributional Shifts

The SDMtoolbox v2.4 toolkit of ArcGIS v10.2 [47,48] was utilized to calculate the trends of different regions for C. appendiculata and to compare the central points of different regions. We considered the suitable habitats of C. appendiculata as a whole and simplified them to a vector particle, while using the variation of the centroid position to reflect the size and direction of its suitable habitats. Finally, the SDMtoolbox toolkit was used to trace the centroid of C. appendiculata over different time periods under various climatic conditions, and to assess the migration distance and elevation changes of the suitable habitats for C. appendiculata using latitudinal and longitudinal coordinates [46,49].

3. Results

3.1. Model Parameter Optimization and Accuracy Analysis

In this study, seven environmental variables were screened to construct a predictive model. These included the mean diurnal range (max temp-min temp) (BIO02), temperature seasonality (BIO04), mean temperature of wettest quarter (BIO08), mean temperature of coldest quarter (BIO11), precipitation of driest month (BIO14), precipitation seasonality (BIO15), and precipitation of warmest quarter (BIO18). The contribution percentages of these variables for model construction were BIO02 (51.1%) > BIO04 (38.5%) > BIO08 (3.8%) > BIO11 (2.3%) > BIO14 (2.3%) > BIO15 (1.2%) > BIO18 (0.8%) (Table 1; Figures S1 and S2).
Based on 108 distribution points for C. appendiculata and seven climatic variables, the MaxEnt model was used to predict the distribution of potentially suitable habitats for C. appendiculata in China. According to the model optimization results, the FC was QP, the RM was 0.3, the model omission rate was 0.0303, and the delta AICc value was 0. The mean value of the training AUC (AUCTRAIN) was 0.9589 ± 0.0023, the mean value of the test AUC (AUCTEST) was 0.9539 ± 0.0070, and the absolute value of the difference between the training AUC and the test AUC (|AUC DIFF|) was 0.005, which indicated that the model had an excellent prediction (Figure S3).
Based on the MTSPS threshold (0.1349), the spatial units for this study were divided as follows: 0–0.1349 unsuitable; 0.1349–0.4233 low suitability; 0.4233–0.7116 moderate suitability; 0.7116–1 high suitability.

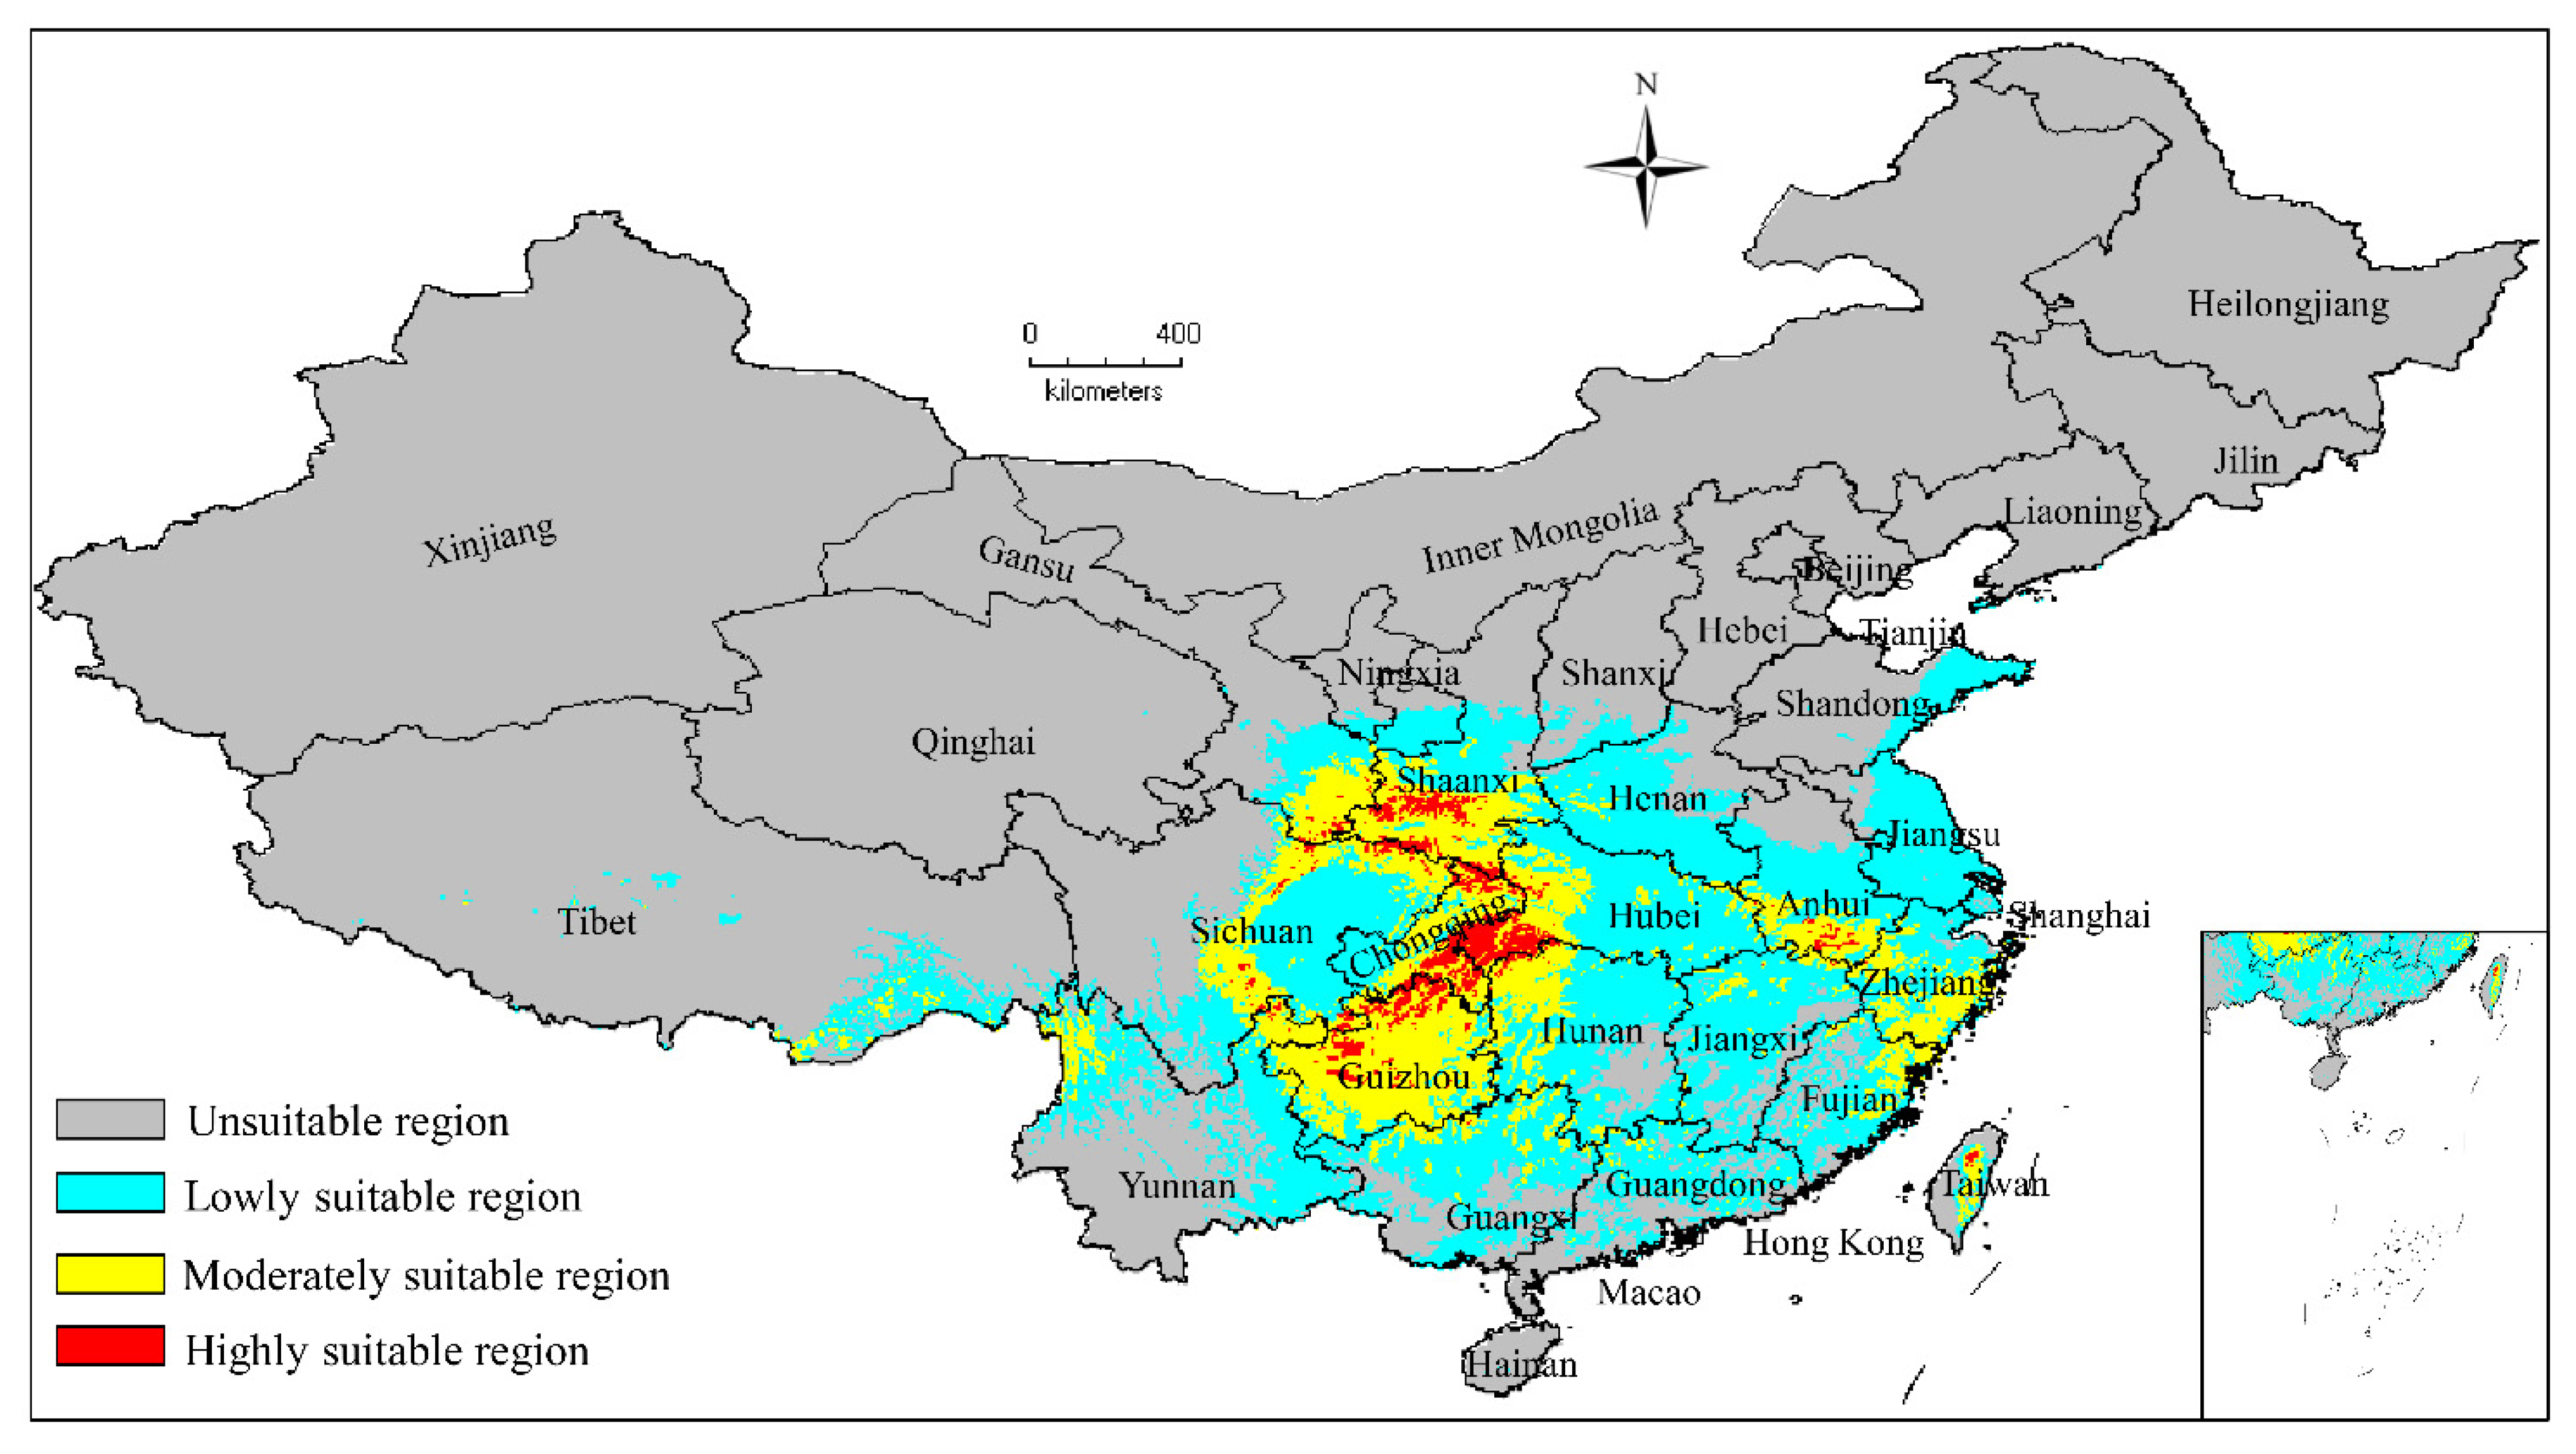
3.2. Current Potentially Suitable Regions

According to the results predicted by the model, the total present potentially suitable growth area for C. appendiculata was 213.9 × 10⁴ km2, which was mainly distributed across Sichuan, Guizhou, Chongqing, Anhui, Hubei, Taiwan, Zhejiang, Tibet, and Yunnan Provinces (Figure 2). The high, moderate, and low potential suitable areas were 8.44 × 10⁴ km2, 57.71 × 10⁴ km2, and 147.76 × 10⁴ km2, respectively. The highly suitable regions were mainly distributed across southern Anhui and Shaanxi, western Hubei, central and northern Guizhou, central Taiwan, and a few areas in Sichuan.

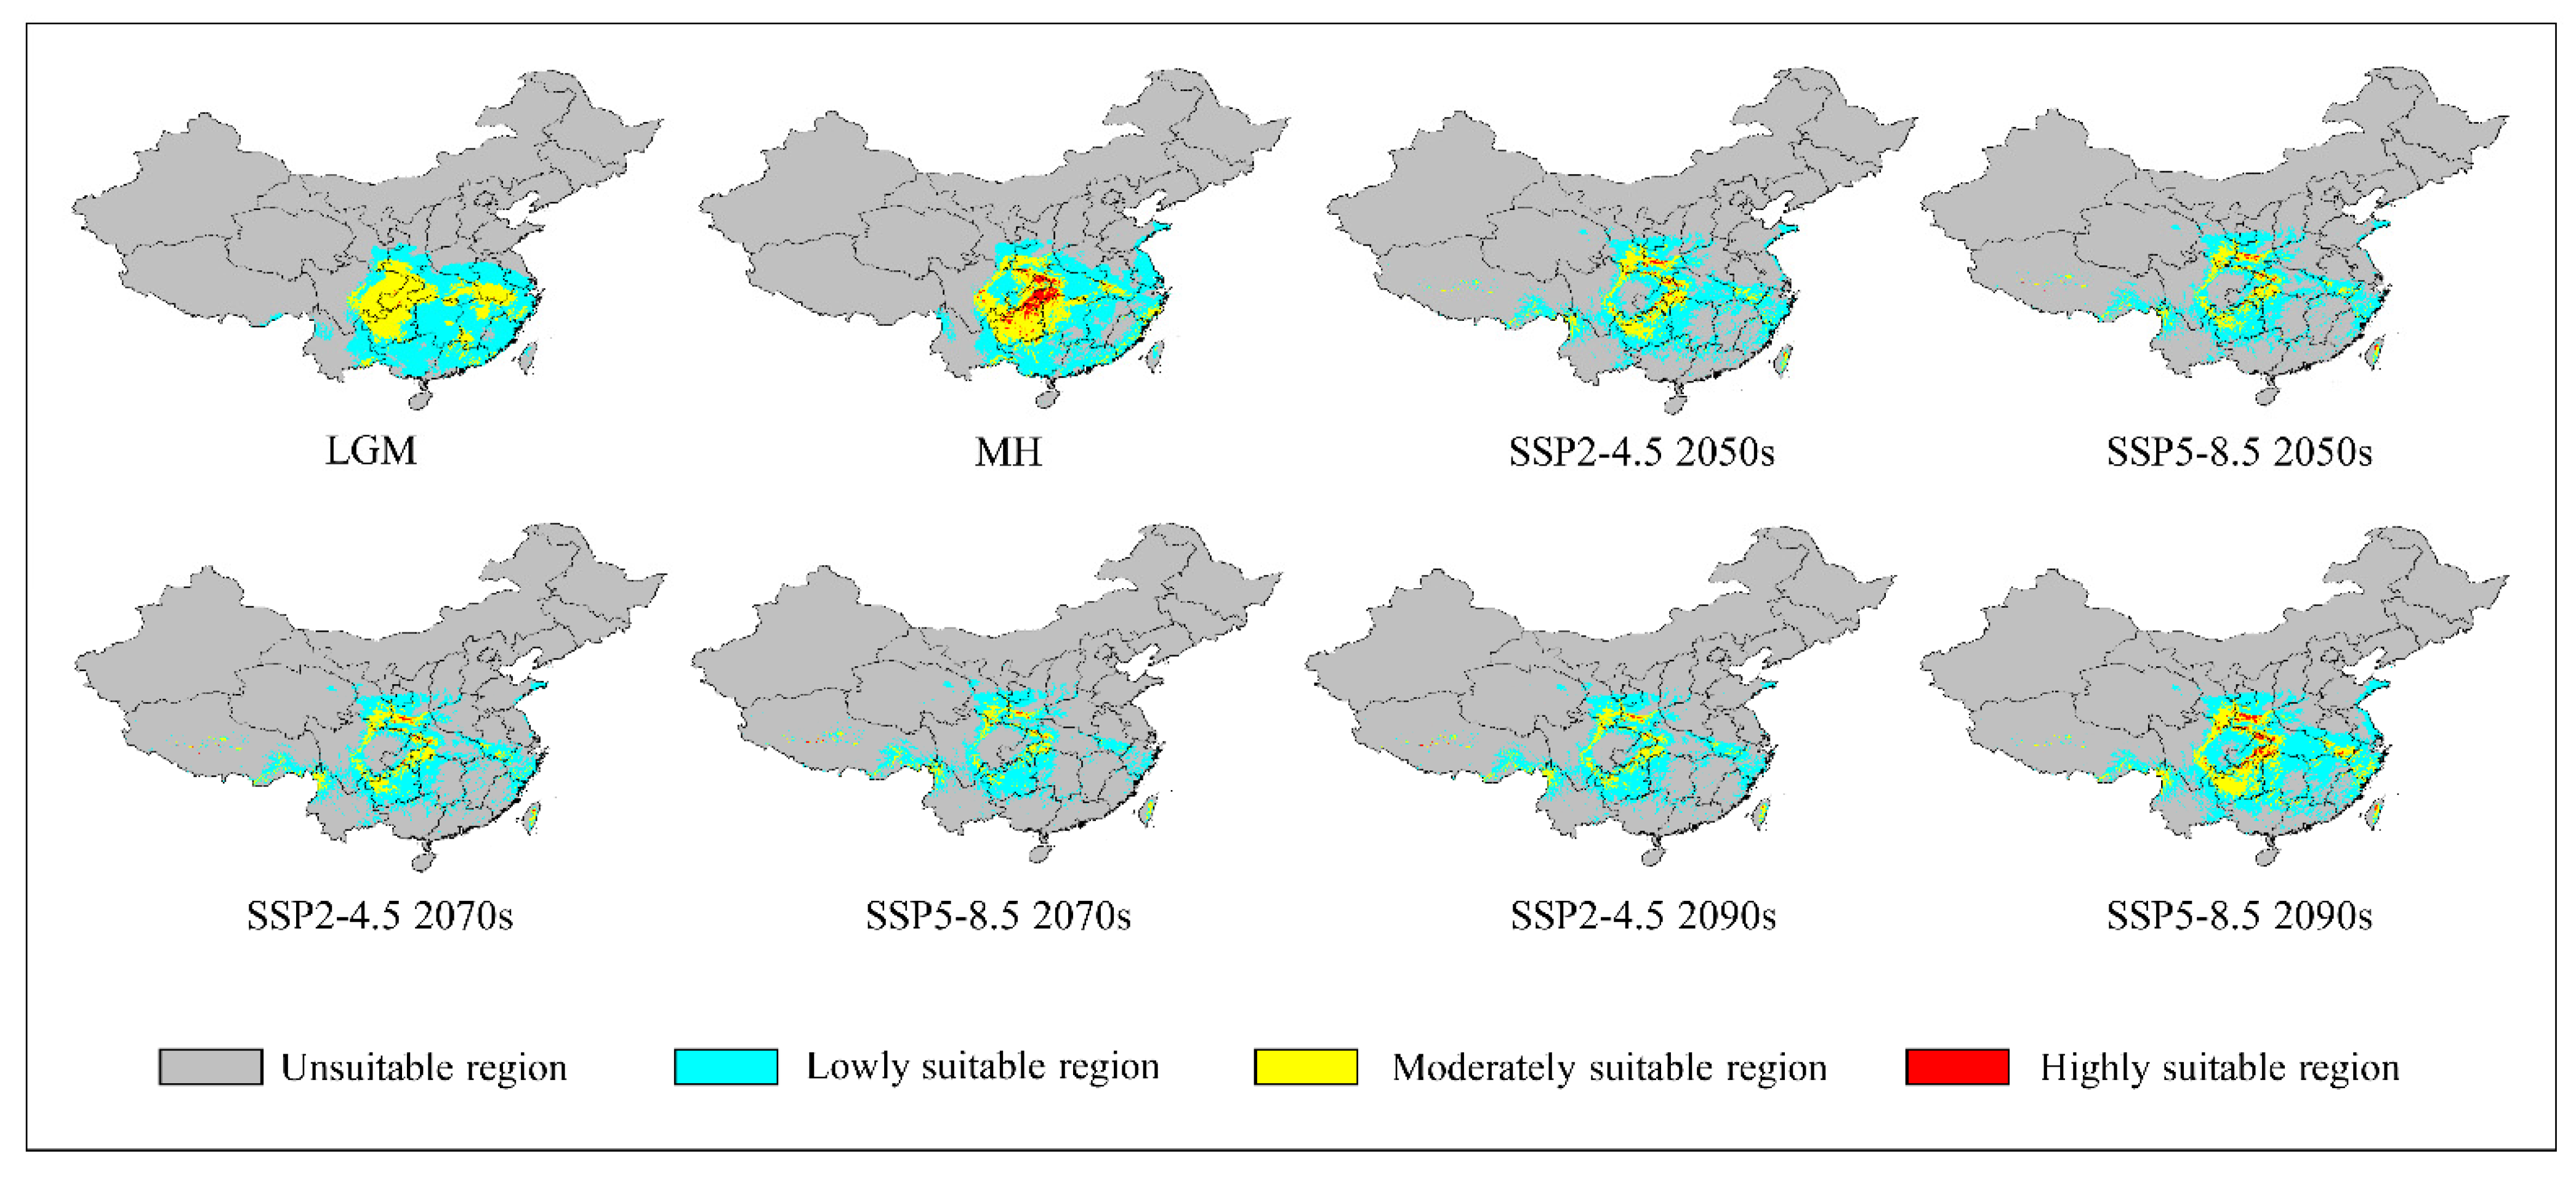
3.3. Potential Past Suitable Regions

Our models predicted that the highly suitable growth regions for C. appendiculata decreased significantly during the LGM compared to modern times. The area of the highly suitable area was only 0.28 × 10⁴ km2, accounting for 3.26% of the present highly suitable area, which included only central Chongqing, eastern Sichuan, and a very small portion of southern Anhui. In the MH, the highly suitable area for C. appendiculata was significantly increased compared with LGM, which was 8.38 × 10⁴ km2, accounting for 99.30% of the modern highly suitable area. The northern part of Taiwan transitioned from the moderately suitable regions in the MH period to the modern highly suitable regions. Compared with the MH, the highly suitable regions in southern Anhui also increased, and the low suitable regions in Guangxi decreased slightly in modern times.

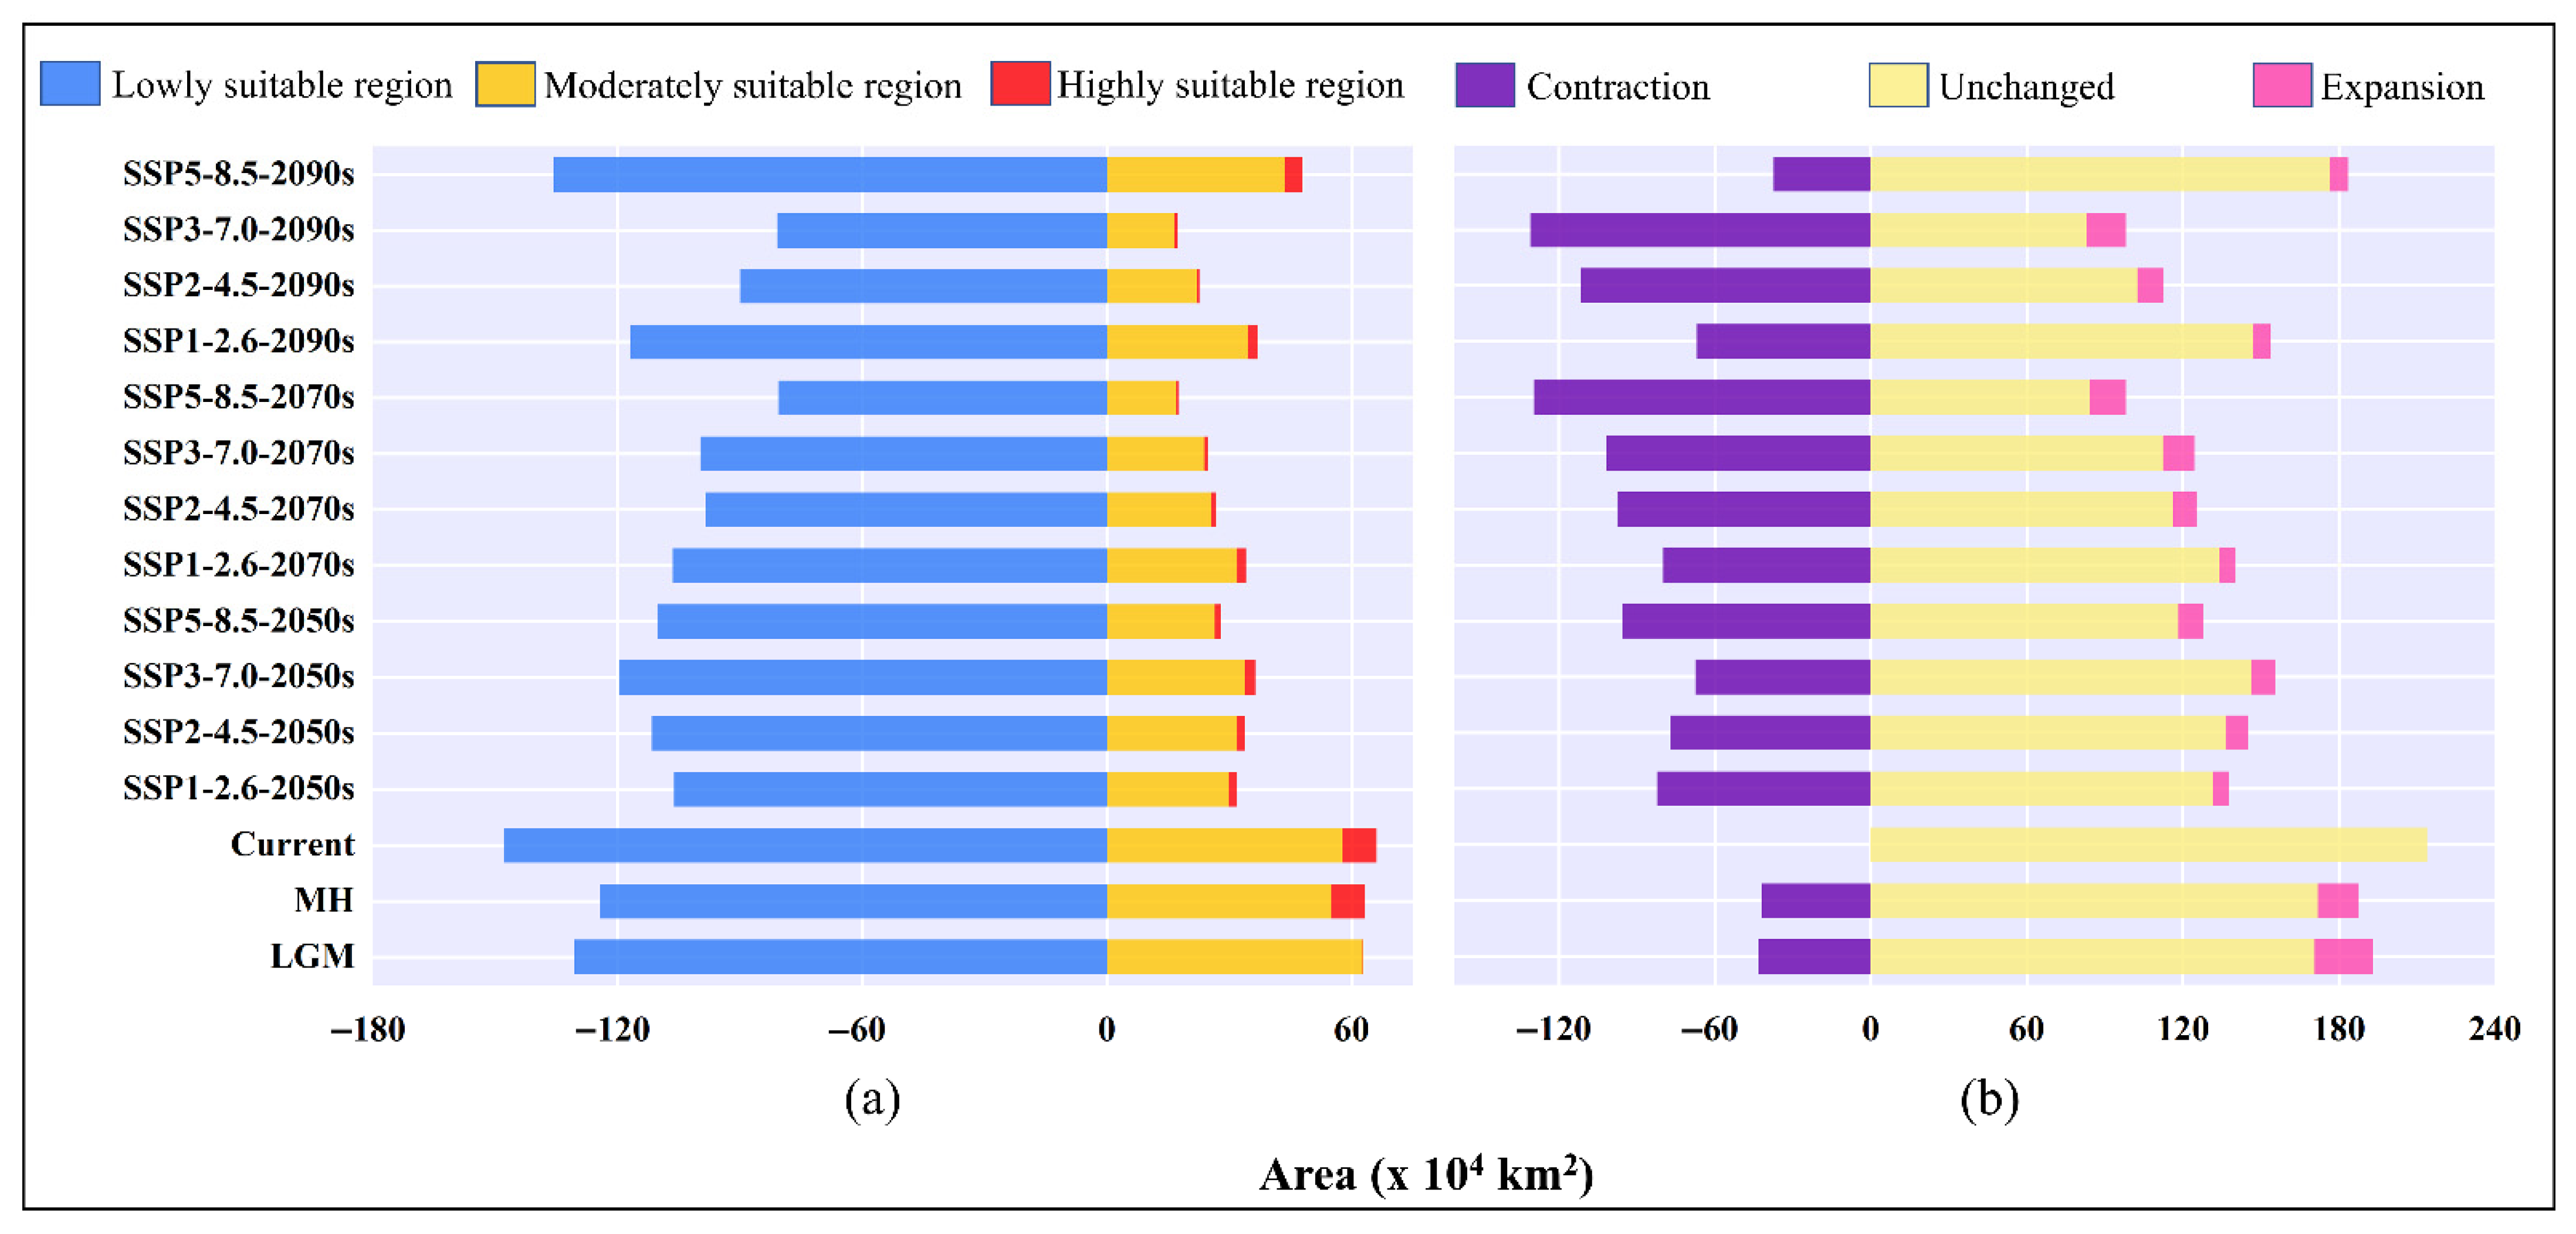
3.4. Potentially Suitable Areas in the Future

Overall, the potential C. appendiculata habitat area is estimated to decrease to varying degrees over the next three eras. Except for the 2090s, the potential habitat area of C. appendiculata was predicted to show a decreasing trend with intensifying climate severity (SSP2-4.5 → SSP5-8.5). (Figure 3, Figure 4 and Figure 5, Figures S4 and S5; Table 2).
Under the SSP2-4.5 scenario, the total area of potential suitable habitats for C. appendiculata revealed a shrinking trend (67.98%, 58.59%, and 52.66% of corresponding present values). From the 2050s to the 2090s, southeastern Shandong and eastern Jiangsu transitioned from originally low suitable habitats to unsuitable habitats for C. appendiculata growth. The highly suitable areas showed an obvious trend of contraction, accounting for 24.99% (2050s), 15.36% (2070s), and 9.47% (2090s) of the corresponding contemporary values, respectively. The highly suitable areas in northern Guizhou, central Chongqing, and southern Shaanxi gradually shifted to moderate or low suitable areas.
Under the SSP5-8.5 scenario, the total potential habitat area of C. appendiculata exhibited a trend of initially shrinking and then expanding over time. The percentages of contemporary corresponding values were 59.91% (2050s), 45.88% (2070s), and 85.86% (2090s). From the 2050s to 2070s, the coastal areas of Shandong and Jiangsu, eastern Hubei, and northeastern Fujian gradually shifted from low suitable habitats to non-suitable habitats. From the 2070s to 2090s, the low suitable habitats gradually recovered, and the area of high suitable habitats increased from 0.67 × 10⁴ km2 (2070′s) to 4.26 × 10⁴ km2 (2090s), which were still primarily distributed across Shaanxi, Chongqing, Hubei, Anhui, and Taiwan Province.

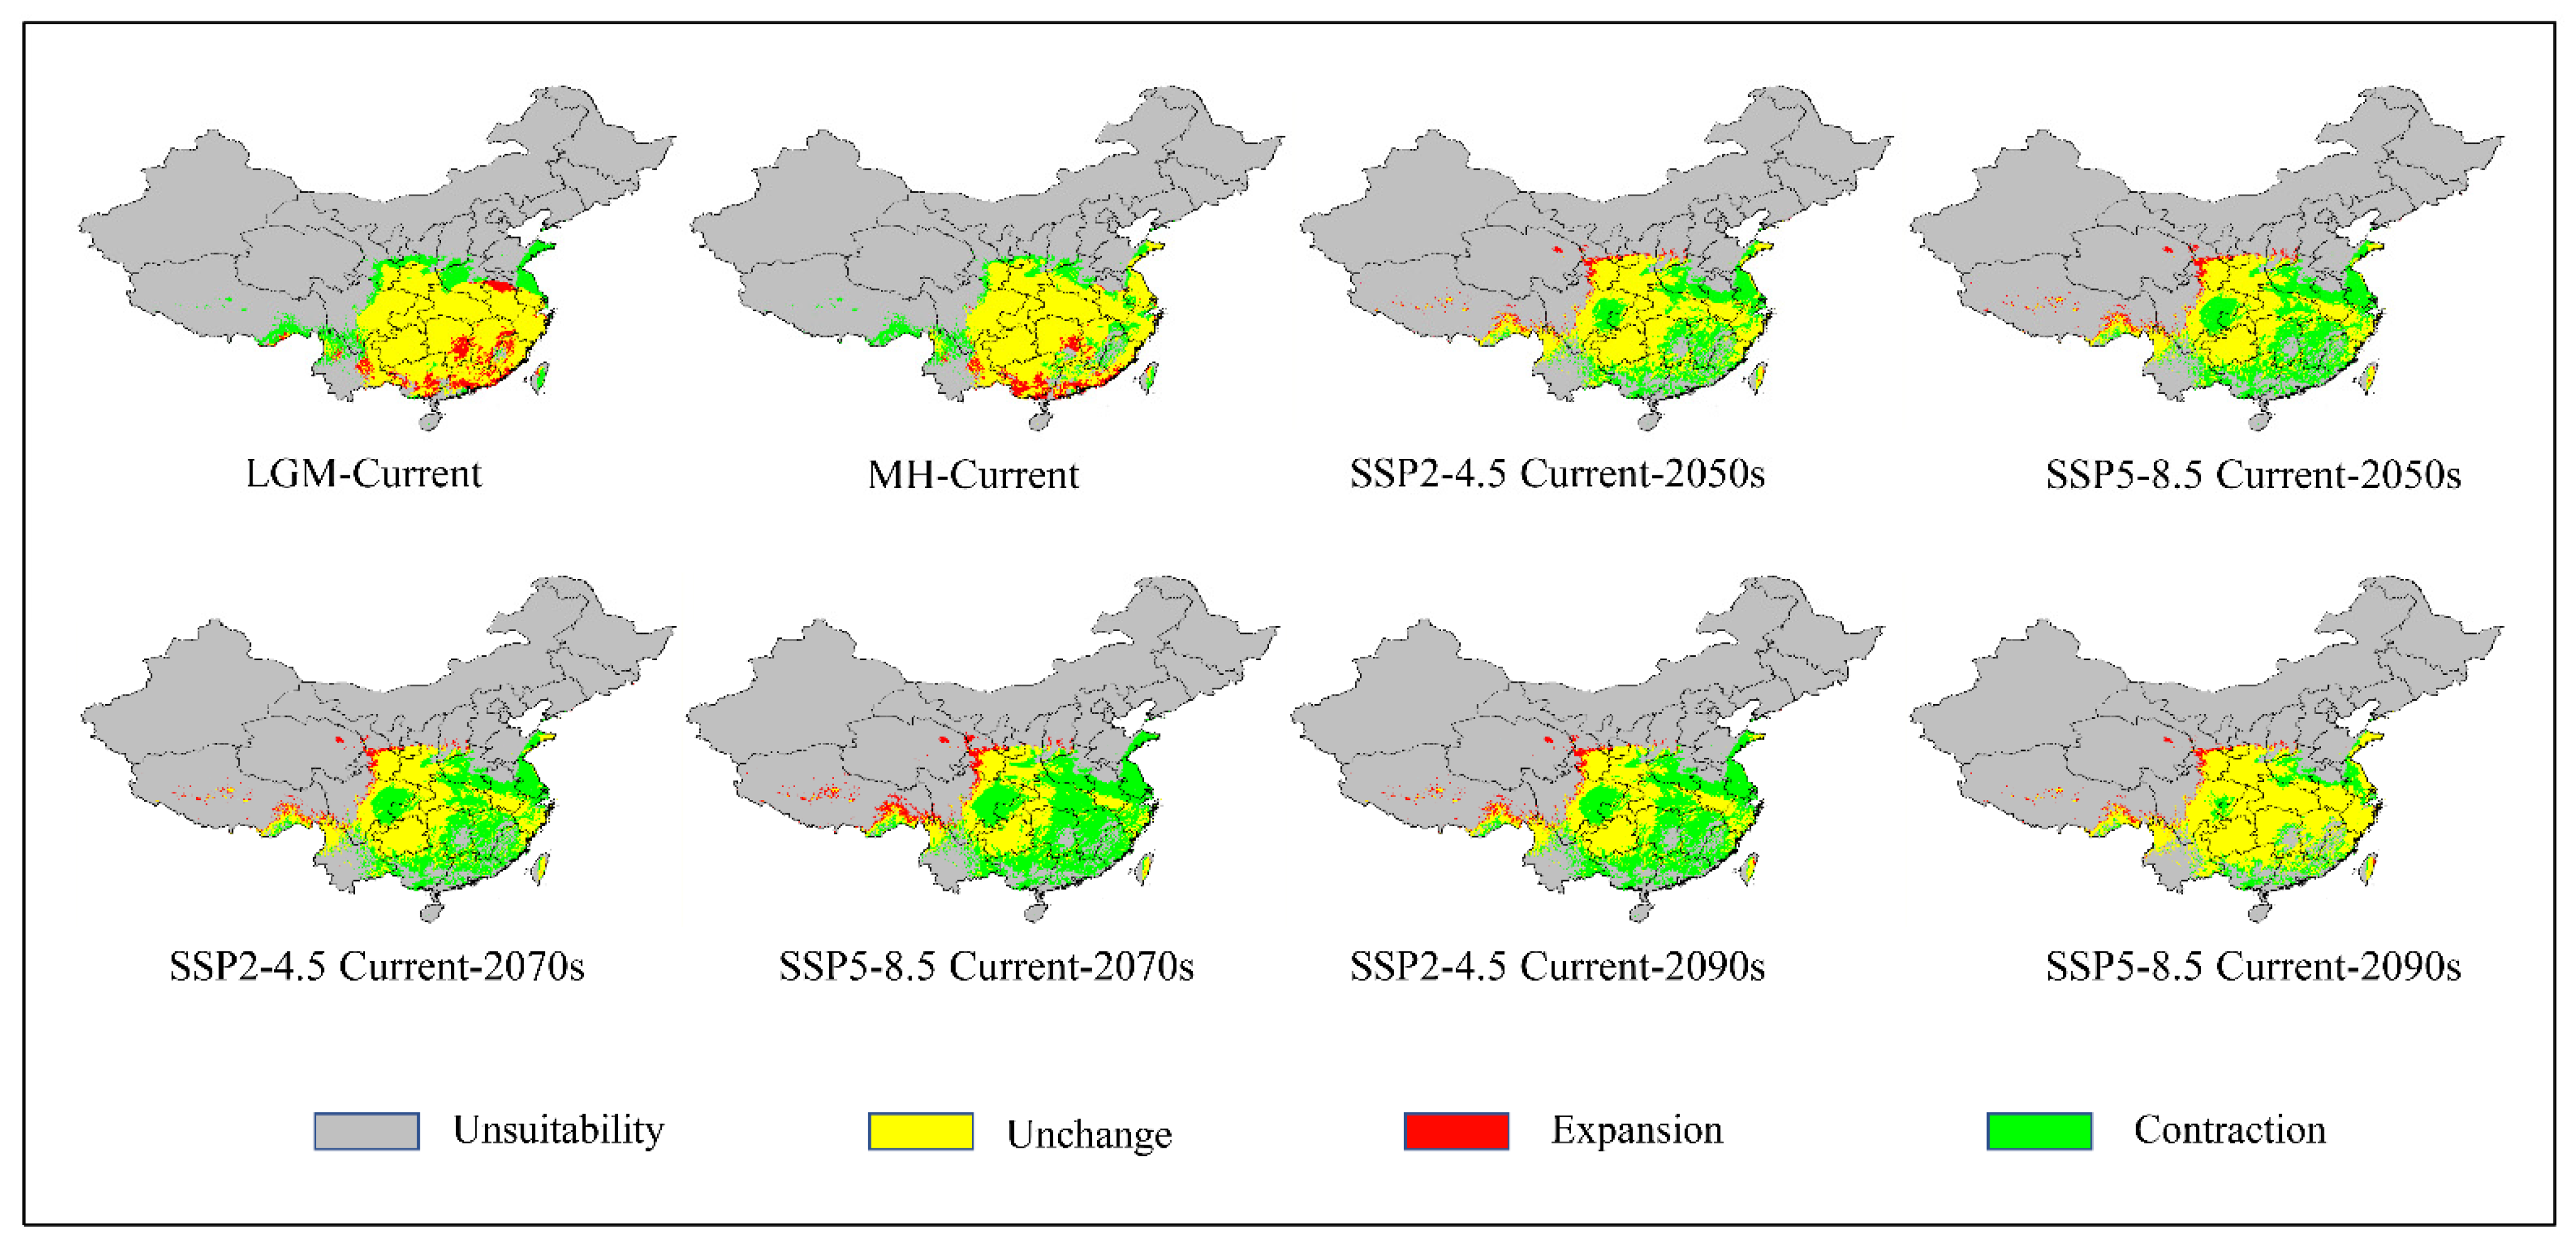
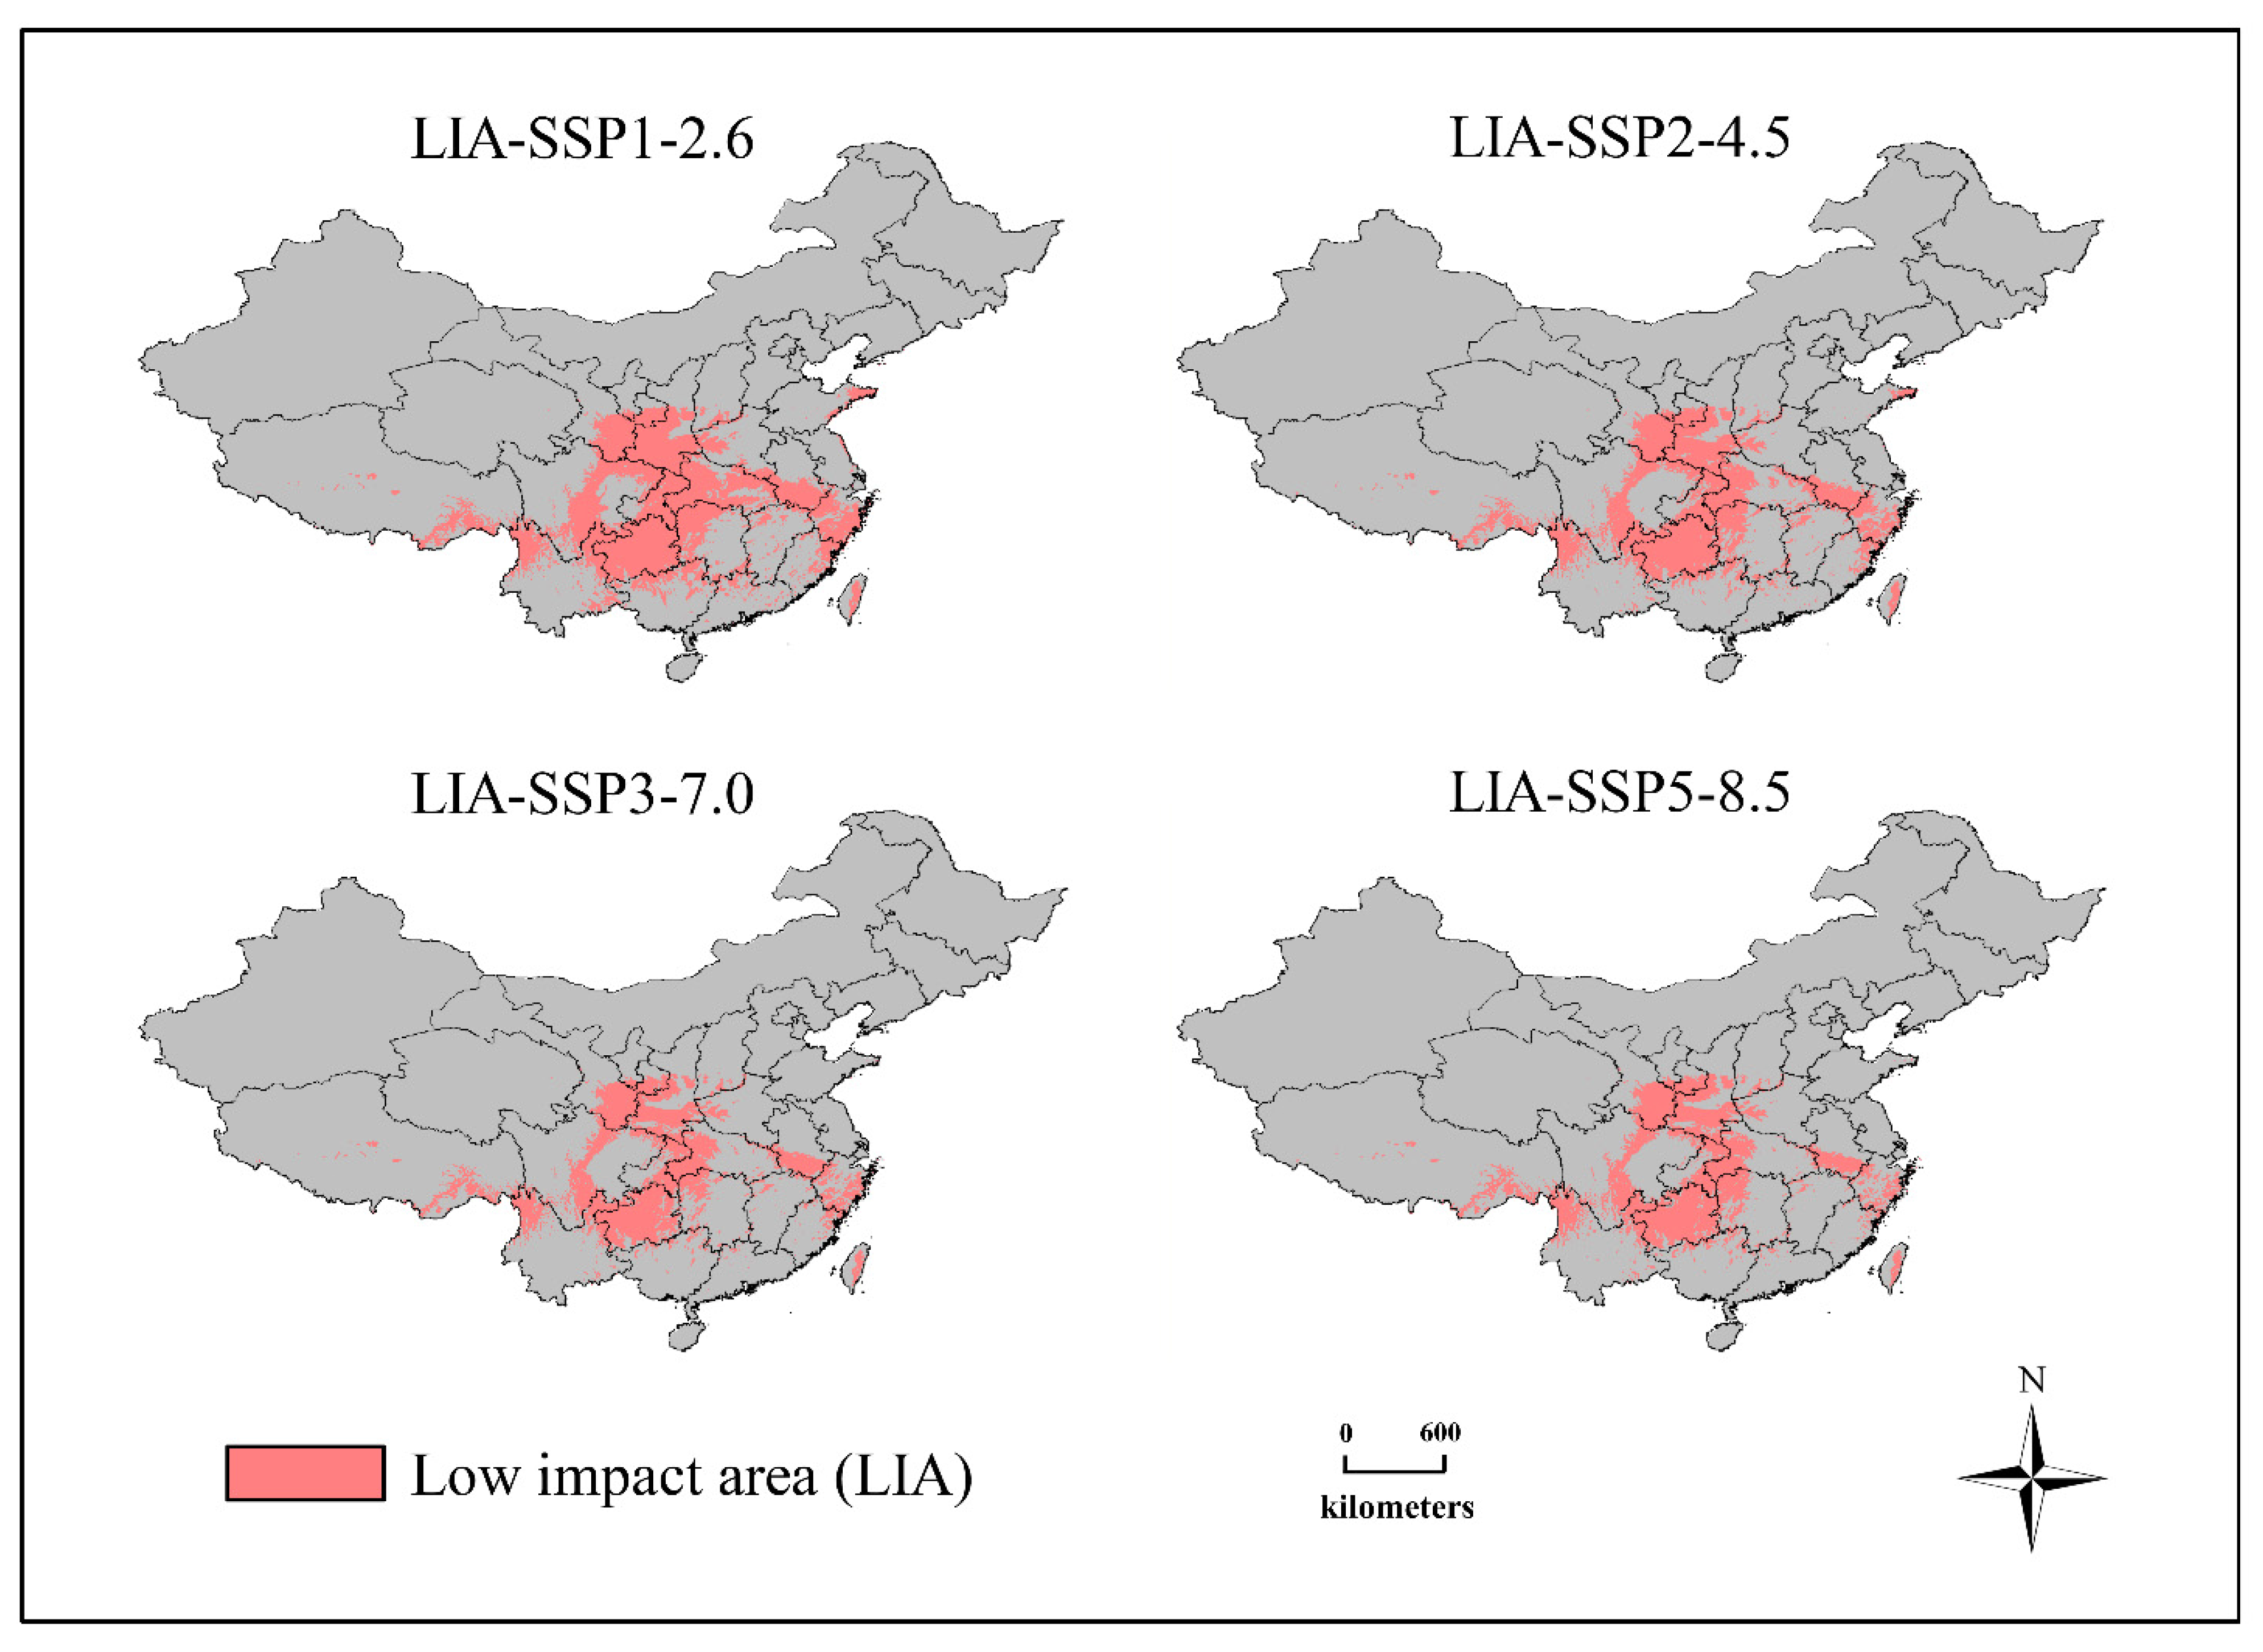
3.5. Relatively Stable Habitat

Relatively stable suitable habitats refer to areas where species are relatively less affected by climate change, where the predicted results under different climatic scenarios are different (Figure 6 and Figure S1; Table 3). With increasing climate severity (SSP1-2.6 → SSP3-7.0), the area of relatively stable suitable habitats for C. appendiculata decreased (130.01 × 10⁴ km2 → 82.95 × 10⁴ km2), which accounted for 60.78%, 47.75%, and 38.78% of the total area of the present potential suitable habitats, respectively, eventually stabilizing at SSP5-8.5. Under the SSP5-8.5 scenario, the total area of relatively stable C. appendiculata habitats was 84.40 × 10⁴ km2, which accounted for 39.46% of the total area of the present potential habitat. Furthermore, the predictions also indicated that central Sichuan, the entirety of Guizhou, southern Chongqing, western Hubei, northwestern Hunan, and southern Anhui were relatively stable suitable habitats for the growth of C. appendiculata under any climate scenario.

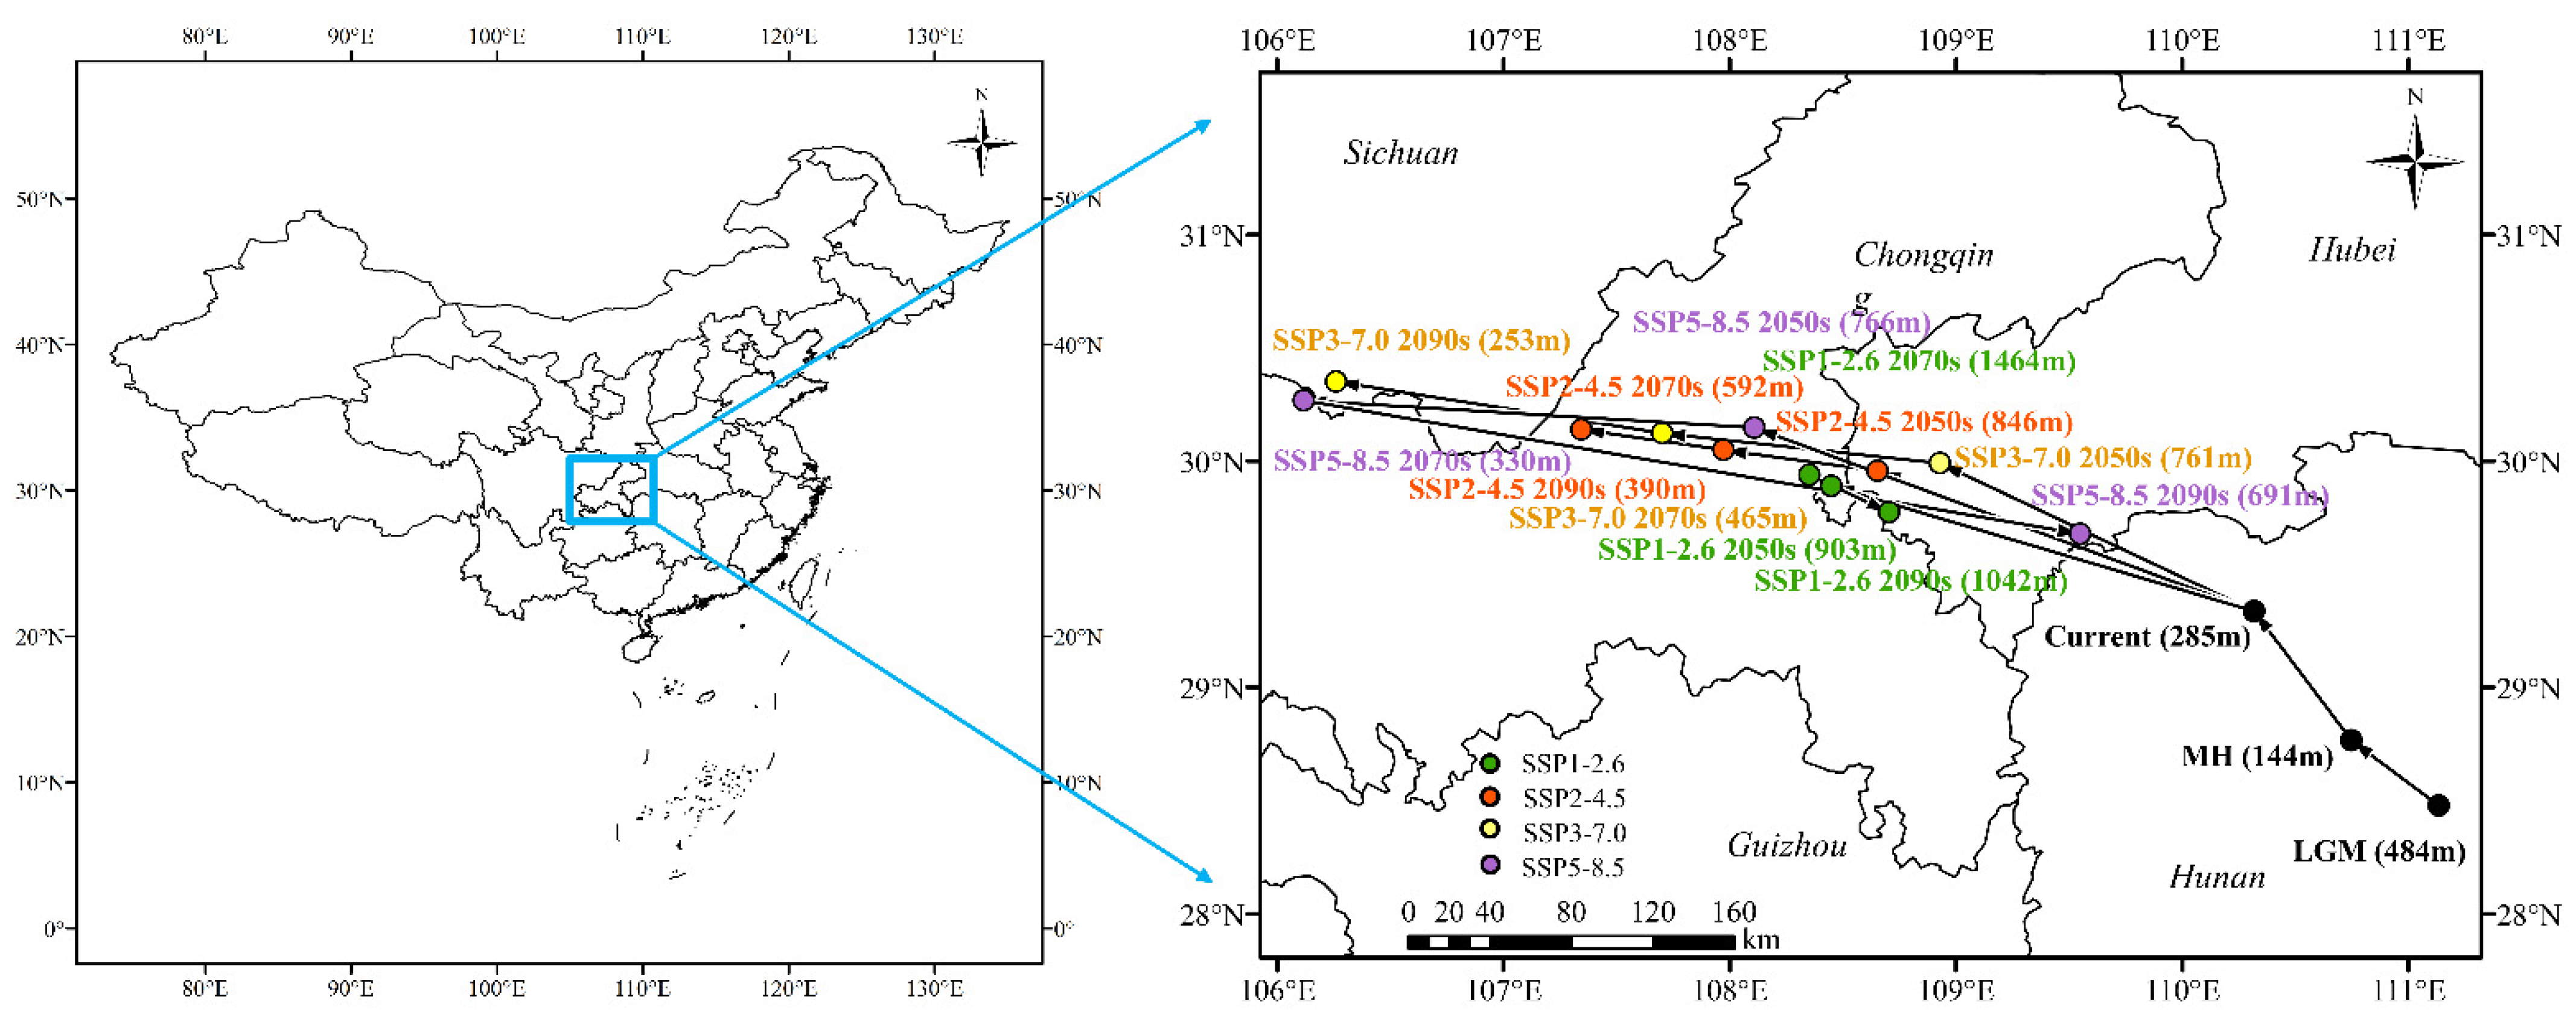
3.6. Shifts in the Distribution Center of Suitable Habitats

From the results of the model simulations, the centroids of the potential habitats of C. appendiculata showed a tendency to shift to the northwest under the SSP2-4.5 and SSP3-7.0 scenarios, while the centroids of the habitats initially moved to the northwest and then to the southeast under the SSP1-2.5 and SSP5-8.5 scenarios (Figure 7). Under the SSP2-4.5 scenario, the centroids of the suitable C. appendiculata habitats shifted from Yongding District, Zhangjiajie City, and Hunan Province to Lichuan City, Enshi Tujia, and Miao Autonomous Prefecture, Hubei Province (2050s), Fengdu County, Chongqing City (2070s), and Dianjiang County, Chongqing City (2090s) over time, with migration distances of 174.74 km, 66.51 km, and 61.49 km, respectively. Under the SSP5-8.5 climate scenario, the potential suitable habitats centroid shifted by 231.37 km (2050s), 192.64 km (2070s) to the northwest, and finally 337.55 km (2090s) to the southeast, from the present Zhangjiajie City to the 2090s in Xuanen County, Enshi Tujia, and Miao Autonomous Prefecture.
According to elevation changes, the elevation of the center of the suitable C. appendiculata habitats decreased from 484 m in the LGM to 285 m currently. Under the SSP1-2.6 scenario, the suitable C. appendiculata habitats shifted to higher elevations, while under the SSP2-4.5 and SSP3-7.0 climate scenarios, the elevation of suitable C. appendiculata habitats increased and then decreased. However, under the SSP5-8.5 scenario, the elevation of the center of suitable C. appendiculata habitats increased to 766 m in the 2050s, decreased to 330 m in the 2070s, and finally increased to 691m in the 2090s.

4. Discussion

4.1. Impacts of Environmental Variables on Species Distribution

The selection of environmental variables had a certain impact on the prediction results of the niche model [50,51]. This study demonstrated that the monthly mean temperature difference between day and night (BIO02), the mean temperature during the wettest quarter (BIO08), the mean temperature during the coldest quarter, and the precipitation during the driest month (BIO14) were the main environmental factors that affected the growth of C. appendiculata. Plants responded differently to future climate change scenarios, which mainly depended on their physiological or phenological characteristics [52]. The growth of C. appendiculata is very sensitive to changes in temperature and precipitation. Cremastra appendiculata typically grows in forest wetland understories or ditch-side wetlands and prefers areas with brief scattered sunlight, and ample ventilation [53]. The optimum temperature for the growth of C. appendiculata is from 15 °C to 30 °C. If the temperature is too low, the dormant period of the plant will typically impact its normal growth, whereas if the temperature is too high, the leaves will often burn [54]. Changes in temperature influence the distribution of C. appendiculata by impacting factors such as germination, water absorption, photosynthesis, transpiration, respiration, reproduction, and growth. At the same time, water is essential for plant growth. When water is lacking, it affects the division and elongation of plant cells. However, when there is too much precipitation, the root system is underdeveloped and the stems and leaves are thin and young, which affects the accumulation of biomass in medicinal plants [55]. For some endangered medicinal herbs (such as Cremastra appendiculata), their distribution is dominated by wild resources. Therefore, suitable habitat and suitable climate (temperature and precipitation) can ensure a stable supply of its resources and maintain its medicinal components located at a stable level. In case of extreme climate, continuous drought, or continuous precipitation, it may lead to water shortage or rotten roots, resulting in plant death. Because C. appendiculata has extremely high requirements in terms of environmental conditions, the risk of extinction increases with the severity of climate change/global warming. Consequently, it is necessary to establish a nature reserve as soon as possible to protect the diversity of C. appendiculata germplasm resources.

4.2. Impacts of Climate Change on Species Distribution Dynamics and Migration Trends

The Coupled Model Intercomparison Project (CMIP), which aims to address new scientific questions in climate change field. In the CMIP5 climate model, the Representative Concentration Pathway (RCP) is used to characterize the impact of human activities under future scenarios. The CMIP6 adds socio-economic development considerations compared to CMIP5. Shared Socioeconomic Pathway (SSP) as input parameters for climate change prediction models under the influence of human activities to describe future emissions of greenhouse gases, reactive gases, aerosols, and concentrations of atmospheric constituents under changes in population, socioeconomics, science and technology, energy consumption, and land use. The SSP1-2.6 (low emissions) scenario is an upgrade to the RCP2.6 scenario, SSP2-4.5 (medium emissions) is an upgrade to the RCP4.5 scenario, SSP3-7.0 (medium emissions) is the new emission pathway, SSP5-8.5 (high emissions) is an upgrade to the RCP8.5 scenario, and SSP5-8.5 is the worst-case scenario.
With the impacts of global climate change and the fragmentation of habitats caused by anthropogenic activities, barriers against the propagation of C. appendiculata are increasing. The speculation of past and future species habitats is critical for understanding the ecological needs of particular species and their biological and behavioral responses to climate change [56]. At present, GIS technology is an important tool for simulating the spatial distribution patterns of species [14]. The combination of ENM and ArcGIS was used to predict the potential geographical distribution of C. appendiculata in China. The results of this study indicated that under current climatic conditions, the area of 23–36°N, 95–121°E is the main potential growth area for C. appendiculata in China, such as Sichuan, Guizhou, Chongqing, Anhui, Hubei, Taiwan, Zhejiang, Tibet, and Yunnan Provinces. Global warming is a decisive factor for changes in species distribution patterns, which are the clearest and most direct reflection of climate change [57]. The climate change characteristics affected by global warming have been altering the structures and functions of terrestrial ecosystems, thereby modifying the habitats and terrestrial distribution of species. Through field investigations, our research found that C. appendiculata grows well in shady and wet humus soil under hillsides, and in wetlands along ditches. Although C. appendiculata can reproduce both sexually and asexually under natural conditions, its asexual reproduction is dominant. However, all orchid species have a complex seed germination process in the wild; thus, they are more dependent on the environment. The seeds lack endosperm, cotyledons, and primordial roots, and symbiotic mycorrhiza is necessary for seed germination. It is estimated that only 0.01% of the millions of seeds produced by a flock of orchids germinate under field conditions [58]. Therefore, due to the reasons above, difficulties for the natural migration of C. appendiculata increase further. Currently, all orchids are listed under Appendix-II of the Convention on International Trade in Endangered species of Wild Flora and Fauna (CITES) [58].
MaxEnt estimated that the highly suitable C. appendiculata regions in the LGM were in central Chongqing, eastern Sichuan, and a very small portion of southern Anhui, the area of highly suitable regions was also much smaller than presently. This may have been caused by weather instability, such as rapid and intense cold events. The LGM is the closest extreme cold period to today, when the average temperature was 5–10 °C lower than modern times [59]. The extremely cold climate caused a smaller area of the highly suitable regions for C. appendiculata than in modern times. In the middle Holocene (MH, 6 ka), the suitable regions of C. appendiculata were like today. The most suitable habitats for the growth of C. appendiculata obviously expanded to lower altitudes, as the altitudes of suitable areas are currently lower than other predicted periods, which may have been due to the monsoon areas and precipitation increasing during the MH by 10.7% and 18.7%, respectively, compared with modern China [14].
The results revealed that if the climate continues to warm, the potential distribution areas of C. appendiculata will reduce to varying degrees. The present potential medium and highly suitable areas are primarily concentrated in central, southern (Gansu, Shaanxi, Chongqing, Sichuan), and southeastern China (Anhui, Zhejiang, Taiwan). Under the SSP2-4.5 scenario the suitable C. appendiculata regions will continue to decrease, and be smaller than what currently exists, whereas under the SSP5-8.5 scenario, C. appendiculata will initially decrease and then increase. With intensifying climate severity, under the SSP5-8.5 scenario (2070s), the eastern coastal area of China will become unsuitable for the growth of C. appendiculata. Simultaneously, the currently highly suitable regions in Hubei, Chongqing, and other places will also disappear. However, under the SSP5-8.5 scenario (2090s), the area of the suitable regions will have recovered to a certain extent, and transition to the northwest and high-altitude areas. The suitable regions for C. appendiculata in Qinghai and Gansu are estimated to increase slightly in the future. This was consistent with the prediction of Charitonidou [60] for Ophrys helenae, which projected that C. appendiculata will eventually adapt to the habitat changes brought about by climate change. However, the premise here is to protect the genetic resources of C. appendiculata long before this.

4.3. Guiding Significance for Resource Protection and Artificial Cultivation of C. appendiculata

As a strategic natural wild health reserve resource, the future development and utilization of medicinal plant resources is of great significance. Highly suitable growth areas for C. appendiculata (e.g., Shaanxi, Chongqing, Hubei, etc.) should be regarded as priority areas for protection. The first task is to carry out the in situ and ex situ conservation of existing C. appendiculata resources and its genetic diversity, while formulating differentiated conservation strategies according to the geographical characteristics of different regions. The establishment of nature reserves is the most effective strategy for protecting rare and endangered wild resources in situ [61]. According to the prediction results of the model, C. appendiculata nature reserves should be established on Guanshan Mountain in Gansu Province, Shennongjia in Hubei Province, Zhangjiajie in Hunan Province, and on Lushan Mountain in Jiangxi Province.
In recent years, wild Chinese herbal medicines has been broadly welcomed by consumers; however, the disparities between scarce wild resources and immense market demands are becoming increasingly fierce. The artificial planting of Chinese herbal medicines is an effective approach toward the fundamental alleviation of this contradiction, where the division of suitable planting areas is the basis for artificial introduction. The pseudobulb of C. appendiculata, commonly known as “Shan-Ci-Gu”, is a traditional Chinese medicine that clears heat and detoxifies, removes blood stasis and reduces swelling, and is typically used to fight cancer [62]. Therefore, elucidating the adaptability of C. appendiculata to environmental changes and the distribution of its suitable growing areas can provide a scientific basis for optimizing its planting areas. Additional efforts invested in the optimization of the medicinal compound contents of C. appendiculata pseudobulbs, will have further guiding significance for commercialization.
Furthermore, the prediction results revealed that under any climate scenario, central Sichuan, the whole of Guizhou, southern Chongqing, western Hubei, northwestern Hunan, and southern Anhui are all areas with less impacts on C. appendiculata. The quality of Chinese medicinal materials is significantly influenced by the environment, where the chemical compositions of medicinal materials is intimately related to the environment and have obvious regional characteristics [63]. Thus, when artificially planting C. appendiculata in predicted suitable areas, the geoherbalism of medicinal materials should be taken into consideration. As the traditional producing areas of C. appendiculata, Guizhou and Chongqing Provinces can lead the way toward promoting the artificial cultivation of C. appendiculata in this area.

4.4. Model Limitations and Future Research Directions

Although the MaxEnt model has the advantages of simple operation, small sample requirements, and high prediction accuracy, it also has some limitations, akin to other prediction models. For example, investigations into the distribution of potential suitable areas of species based on the MaxEnt model can typically only be analyzed from variables such as climate and environment [25,28]. However, critical factors that affect the distribution of TCM species, such as geology, soil, land use history, interactions between species, and population dynamics, are difficult to quantify; thus, it is difficult to input into the model for data visualization analysis [64]. Therefore, based on existing technologies, analysis results should be combined with local geological, environmental, human geography, and other factors to realistically predict and analyze the potential suitable areas of C. appendiculata [65]. In addition, symbiotic fungi are essential for the germination and survival of orchids. The specific relationships between orchids and their mycorrhizal partners as relates to their growth remains unclear, as many studies have shown that orchids can form symbiotic relationships with many fungi [66,67,68,69]. Due to the lack of comprehensive data on orchid vegetation, pollinator communities, and mycorrhizal partners across the region, we did not incorporate these data into our analysis. Consequently, the roles of mycorrhizal fungi and pollinator communities in niche differentiation, and the large-scale distribution of C. appendiculata in China warrants further investigation [58,60].

5. Conclusions

For this study, an optimized maximum entropy model was used to estimate the distribution of potential suitable habitats for C. appendiculata in China under different climate scenarios in the past (LGM and MH), modern times, and future eras. The results revealed that the suitable habitats area of C. appendiculata in the past was comparable to the total area of current potential suitable habitats. Among them, the highly suitable areas were primarily distributed across Shaanxi, Chongqing, Guizhou, Hubei, Anhui, and Taiwan Province. In the future, except for SSP5-8.5 2090s, the area of potentially suitable C. appendiculata regions will be reduced to varying degrees. Meanwhile, this study found that the relatively low impact areas of C. appendiculata were mainly distributed across Sichuan, Guizhou, Chongqing, Hubei, and Anhui Provinces. Furthermore, the central point of the potential suitable habitats of C. appendiculata moved to the northwest under the SSP2-4.5 and SSP3-7.0 scenarios, while the central point of the suitable habitats initially transitioned to the northwest and then moved to the southeast under the SSP1-2.5 and SSP5-8.5 scenarios. These research results will provide some theoretical references for the protection of wild resources and artificial cultivation of the endangered medicinal plant C. appendiculata.

Supplementary Materials

The following supporting information can be downloaded at https://www.mdpi.com/article/10.3390/f13091504/s1. Figure S1: Jackknife test of the importance of variables. Blue, green, and red bars represent running the MaxEnt model with the variable alone, without the variable, and with all variables, respectively. (A): regularization training gain; (B): test gain; (C): AUC; Figure S2: Response curves of seven environmental predictors used in the ecological niche model for Cremastra appendiculata; Figure S3: Prediction validation with receiver operator characteristic (ROC) curves using the MaxEnt model. AUC: the area under curve; Figure S4: Predicted distribution of Cremastra appendiculata in China under future (2050s–2090s) climatic scenarios (SSP1-2.6 & SSP3-7.0); Figure S5: Changes of potential suitable areas of Cremastra appendiculata from current to future climatic conditions (SSP1-2.6 & SSP3-7.0); Table S1: The rarefying data points (108) of C. appendiculata in China.

Author Contributions

Conceptualization, W.-N.L. and J.-F.N.; methodology, Q.Z.; software, W.-N.L.; validation, J.-F.N., C.L. and M.-H.G.; formal analysis, W.-N.L.; investigation, W.-N.L.; resources, F.H.; data curation, W.-N.L.; writing—original draft preparation, W.-N.L.; writing—review and editing, J.-F.N.; visualization, W.-N.L.; supervision, Z.-Z.W.; project administration, J.-F.N.; funding acquisition, J.-F.N. All authors have read and agreed to the published version of the manuscript.

Funding

This research was funded by Xi’an Science and Technology Project (20NYYF0057); Fundamental Research Funds for the Central Universities [grant numbers GK202103065, GK202205002, GK202205003 and GK202205004]; Shaanxi Provincial Key R & D Program (2022SF-172, 2021SF-383, and 2020LSFP2-21); and Youth Innovation Team Construction Scientific Research Project of Shaanxi Education Department (21JP027).

Data Availability Statement

The bioclimatic variables are available from the WorldClim-Global Climate Database.

Conflicts of Interest

The authors declare no conflict of interest.

References

  1. Sambaraju, K.R.; Carroll, A.L.; Zhu, J.; Stahl, K.; Moore, R.D.; Aukema, B.H. Climate change could alter the distribution of mountain pine beetle outbreaks in western Canada. Ecography 2012, 35, 211–223. [Google Scholar] [CrossRef]
  2. Biber-Freudenberger, L.; Ziemacki, J.; Tonnang, H.E.; Borgemeister, C. Future Risks of Pest Species under Changing Climatic Conditions. PLoS ONE 2016, 11, e0153237. [Google Scholar] [CrossRef] [PubMed]
  3. Jo, W.S.; Kim, H.-Y.; Kim, B.J. Climate change alters diffusion of forest pest: A model study. J. Korean Phys. Soc. 2017, 70, 108–115. [Google Scholar] [CrossRef]
  4. Xu, W.; Sun, H.; Jin, J.; Cheng, J. Predicting the Potential Distribution of Apple Canker Pathogen (Valsa mali) in China under Climate Change. Forests 2020, 11, 1126. [Google Scholar] [CrossRef]
  5. Feng, L.; Sun, J.; Shi, Y.; Wang, G.; Wang, T. Predicting Suitable Habitats of Camptotheca acuminata Considering Both Climatic and Soil Variables. Forests 2020, 11, 891. [Google Scholar] [CrossRef]
  6. Li, X.; Mao, F.; Du, H.; Zhou, G.; Xing, L.; Liu, T.; Han, N.; Liu, Y.; Zhu, D.; Zheng, J.; et al. Spatiotemporal evolution and impacts of climate change on bamboo distribution in China. J. Environ. Manag. 2019, 248, 265. [Google Scholar] [CrossRef]
  7. Cuena-Lombrana, A.; Fois, M.; Fenu, G.; Cogoni, D.; Bacchetta, G. The impact of climatic variations on the reproductive success of Gentiana lutea L. in a Mediterranean mountain area. Int. J. Biometeorol. 2018, 62, 1283–1295. [Google Scholar] [CrossRef]
  8. Hoffmann, A.A.; Sgrò, C.M. Climate change and evolutionary adaptation. Nature 2011, 470, 479–485. [Google Scholar] [CrossRef]
  9. Razgour, O.; Taggart, J.B.; Manel, S.; Juste, J.; Ibanez, C.; Rebelo, H.; Alberdi, A.; Jones, G.; Park, K. An integrated framework to identify wildlife populations under threat from climate change. Mol. Ecol. Resour. 2018, 18, 18–31. [Google Scholar] [CrossRef]
  10. Chen, H.; Sun, J. Projected changes in climate extremes in China in a 1.5 °C warmer world. Int. J. Climatol. 2018, 38, 3607–3617. [Google Scholar] [CrossRef]
  11. Waldvogel, A.M.; Feldmeyer, B.; Rolshausen, G.; Exposito-Alonso, M.; Rellstab, C.; Kofler, R.; Mock, T.; Schmid, K.; Schmitt, I.; Bataillon, T.; et al. Evolutionary genomics can improve prediction of species’ responses to climate change. Evol. Lett. 2020, 4, 4–18. [Google Scholar] [CrossRef] [PubMed]
  12. Warren, R.; Price, J.; VanDerWal, J.; Cornelius, S.; Sohl, H. The implications of the United Nations Paris Agreement on climate change for globally significant biodiversity areas. Clim. Change 2018, 147, 395–409. [Google Scholar] [CrossRef]
  13. Pecl, G.T.; Araújo, M.B.; Bell, J.D.; Blanchard, J.; Bonebrake, T.C.; Chen, I.C.; Clark, T.D.; Colwell, R.K.; Danielsen, F.; Evengård, B.; et al. Biodiversity redistribution under climate change: Impacts on ecosystems and human well-being. Science 2017, 355, eaai9214. [Google Scholar] [CrossRef] [PubMed]
  14. Ye, X.-z.; Zhao, G.-h.; Zhang, M.-z.; Cui, X.-y.; Fan, H.-h.; Liu, B. Distribution Pattern of Endangered Plant Semiliquidambar cathayensis (Hamamelidaceae) in Response to Climate Change after the Last Interglacial Period. Forests 2020, 11, 434. [Google Scholar] [CrossRef]
  15. Clark, P.U.; Shakun, J.D.; Baker, P.A.; Bartlein, P.J.; Brewer, S.; Brook, E.; Carlson, A.E.; Cheng, H.; Kaufman, D.S.; Liu, Z.; et al. Global climate evolution during the last deglaciation. Proc. Natl. Acad. Sci. USA 2012, 109, E1134–E1142. [Google Scholar] [CrossRef]
  16. Martínez-Freiría, F.; Velo-Antón, G.; Brito, J.C.; Green, D. Trapped by climate: Interglacial refuge and recent population expansion in the endemic Iberian adder Vipera seoanei. Divers. Distrib. 2015, 21, 331–344. [Google Scholar] [CrossRef]
  17. Zhang, Y.Z.; Zhu, R.W.; Zhong, D.L.; Zhang, J.Q. Nunataks or massif de refuge? A phylogeographic study of Rhodiola crenulata (Crassulaceae) on the world’s highest sky islands. BMC Evol. Biol. 2018, 18, 154. [Google Scholar] [CrossRef]
  18. Cubry, P.; De Bellis, F.; Pot, D.; Musoli, P.; Leroy, T. Global analysis of Coffea canephora Pierre ex Froehner (Rubiaceae) from the Guineo-Congolese region reveals impacts from climatic refuges and migration effects. Genet. Resour. Crop Evol. 2012, 60, 483–501. [Google Scholar] [CrossRef]
  19. Chen, D.-M.; Kang, H.-Z.; Liu, C.-J. An Overview on the Potential Quaternary Glacial Refugia of Plants in China Mainland. Bull. Bot. Res. 2011, 31, 623–632. [Google Scholar]
  20. Zhao, P.; Zhou, H.J.; Potter, D.; Hu, Y.H.; Feng, X.J.; Dang, M.; Feng, L.; Zulfiqar, S.; Liu, W.Z.; Zhao, G.F.; et al. Population genetics, phylogenomics and hybrid speciation of Juglans in China determined from whole chloroplast genomes, transcriptomes, and genotyping-by-sequencing (GBS). Mol. Phylogenet. Evol. 2018, 126, 250–265. [Google Scholar] [CrossRef]
  21. Schipper, A.M.; Posthuma, L.; de Zwart, D.; Huijbregts, M.A. Deriving field-based species sensitivity distributions (f-SSDs) from stacked species distribution models (S-SDMs). Environ. Sci. Technol. 2014, 48, 14464–14471. [Google Scholar] [CrossRef] [PubMed] [Green Version]
  22. Joyner, T.A.; Lukhnova, L.; Pazilov, Y.; Temiralyeva, G.; Hugh-Jones, M.E.; Aikimbayev, A.; Blackburn, J.K. Modeling the potential distribution of Bacillus anthracis under multiple climate change scenarios for Kazakhstan. PLoS ONE 2010, 5, e9596. [Google Scholar] [CrossRef] [PubMed]
  23. Steven, J.; Phillips, M.D. Modeling of species distributions with Maxent: New extensions and acomprehensive evaluation. Ecography 2008, 31, 161–175. [Google Scholar] [CrossRef]
  24. Changjun, G.; Yanli, T.; Linshan, L.; Bo, W.; Yili, Z.; Haibin, Y.; Xilong, W.; Zhuoga, Y.; Binghua, Z.; Bohao, C. Predicting the potential global distribution of Ageratina adenophora under current and future climate change scenarios. Ecol. Evol. 2021, 11, 12092–12113. [Google Scholar] [CrossRef] [PubMed]
  25. Zhao, Q.; Mi, Z.Y.; Lu, C.; Zhang, X.F.; Chen, L.J.; Wang, S.Q.; Niu, J.F.; Wang, Z.Z. Predicting potential distribution of Ziziphus spinosa (Bunge) H.H. Hu ex F.H. Chen in China under climate change scenarios. Ecol. Evol. 2022, 12, e8629. [Google Scholar] [CrossRef] [PubMed]
  26. Liu, J.; He, C.; Tang, Y.; Liu, W.; Xu, Y.; Li, Z.; Qin, X.; Jin, S. A review of Cremastra appendiculata (D.Don) Makino as a traditional herbal medicine and its main components. J. Ethnopharmacol. 2021, 279, 114357. [Google Scholar] [CrossRef] [PubMed]
  27. Chung, M.Y.; Chung, M.G. The breeding systems of Cremastra appendiculata and Cymbidium goeringii: High levels of annual fruit failure in two self-compatible orchids. Ann. Bot. Fenn. 2003, 40, 81–85. [Google Scholar]
  28. Zhao, Q.; Zhang, Y.; Li, W.-N.; Hu, B.-W.; Zou, J.-B.; Wang, S.-Q.; Niu, J.-F.; Wang, Z.-Z. Predicting the Potential Distribution of Perennial Plant Coptis chinensis Franch. in China under Multiple Climate Change Scenarios. Forests 2021, 12, 1464. [Google Scholar] [CrossRef]
  29. Zhang, K.; Zhang, Y.; Tao, J. Predicting the Potential Distribution of Paeonia veitchii (Paeoniaceae) in China by Incorporating Climate Change into a Maxent Model. Forests 2019, 10, 190. [Google Scholar] [CrossRef]
  30. Poirazidis, K.; Bontzorlos, V.; Xofis, P.; Zakkak, S.; Xirouchakis, S.; Grigoriadou, E.; Kechagioglou, S.; Gasteratos, I.; Alivizatos, H.; Panagiotopoulou, M. Bioclimatic and environmental suitability models for capercaillie (Tetrao urogallus) conservation: Identification of optimal and marginal areas in Rodopi Mountain-Range National Park (Northern Greece). Glob. Ecol. Conserv. 2019, 17, e00526. [Google Scholar] [CrossRef]
  31. Yu, W.; Wen, J.; Zhang, Z.; Chen, X.; Zhang, Y. Spatio-temporal variations in the potential habitat of a pelagic commercial squid. J. Mar. Syst. 2020, 206, 339. [Google Scholar] [CrossRef]
  32. Wei, Y.; Zhang, L.; Wang, J.; Wang, W.; Niyati, N.; Guo, Y.; Wang, X. Chinese caterpillar fungus (Ophiocordyceps sinensis) in China: Current distribution, trading, and futures under climate change and overexploitation. Sci. Total Environ. 2021, 755, 142548. [Google Scholar] [CrossRef] [PubMed]
  33. Phillips, S.J.; Anderson, R.P.; Dudík, M.; Schapire, R.E.; Blair, M.E. Opening the black box: An open-source release of Maxent. Ecography 2017, 40, 887–893. [Google Scholar] [CrossRef]
  34. Heidy Kikillus, K.; Hare, K.M.; Hartley, S. Minimizing false-negatives when predicting the potential distribution of an invasive species: A bioclimatic envelope for the red-eared slider at global and regional scales. Anim. Conserv. 2010, 13, 5–15. [Google Scholar] [CrossRef]
  35. Sun, S.; Zhang, Y.; Huang, D.; Wang, H.; Cao, Q.; Fan, P.; Yang, N.; Zheng, P.; Wang, R. The effect of climate change on the richness distribution pattern of oaks (Quercus L.) in China. Sci. Total Environ. 2020, 744, 140786. [Google Scholar] [CrossRef] [PubMed]
  36. Cobos, M.E.; Peterson, A.T.; Barve, N.; Osorio-Olvera, L. kuenm: An R package for detailed development of ecological niche models using Maxent. PeerJ 2019, 7, e6281. [Google Scholar] [CrossRef]
  37. Arenas-Castro, S.; Gonçalves, J.F.; Moreno, M.; Villar, R. Projected climate changes are expected to decrease the suitability and production of olive varieties in southern Spain. Sci. Total Environ. 2020, 709, 136161. [Google Scholar] [CrossRef]
  38. Akpoti, K.; Kabo-Bah, A.T.; Dossou-Yovo, E.R.; Groen, T.A.; Zwart, S.J. Mapping suitability for rice production in inland valley landscapes in Benin and Togo using environmental niche modeling. Sci. Total Environ. 2020, 709, 136165. [Google Scholar] [CrossRef]
  39. Liu, B.; Gao, X.; Ma, J.; Jiao, Z.; Xiao, J.; Hayat, M.A.; Wang, H. Modeling the present and future distribution of arbovirus vectors Aedes aegypti and Aedes albopictus under climate change scenarios in Mainland China. Sci. Total Environ. 2019, 664, 203–214. [Google Scholar] [CrossRef]
  40. Guo, Y.; Li, X.; Zhao, Z.; Nawaz, Z. Predicting the impacts of climate change, soils and vegetation types on the geographic distribution of Polyporus umbellatus in China. Sci. Total Environ. 2019, 648, 1–11. [Google Scholar] [CrossRef]
  41. Tang, C.Q.; Matsui, T.; Ohashi, H.; Dong, Y.F.; Momohara, A.; Herrando-Moraira, S.; Qian, S.; Yang, Y.; Ohsawa, M.; Luu, H.T.; et al. Identifying long-term stable refugia for relict plant species in East Asia. Nat. Commun. 2018, 9, 4488. [Google Scholar] [CrossRef] [PubMed]
  42. Ye, X.; Yu, X.; Yu, C.; Tayibazhaer, A.; Xu, F.; Skidmore, A.K.; Wang, T. Impacts of future climate and land cover changes on threatened mammals in the semi-arid Chinese Altai Mountains. Sci. Total Environ. 2018, 612, 775–787. [Google Scholar] [CrossRef] [PubMed]
  43. Liao, Y.; Lei, Y.; Ren, Z.; Chen, H.; Li, D. Predicting the potential risk area of illegal vaccine trade in China. Sci. Rep. 2017, 7, 3883. [Google Scholar] [CrossRef] [PubMed]
  44. Wu, Y.-M.; Shen, X.-L.; Tong, L.; Lei, F.-W.; Mu, X.-Y.; Zhang, Z.-X. Impact of Past and Future Climate Change on the Potential Distribution of an Endangered Montane Shrub Lonicera oblata and Its Conservation Implications. Forests 2021, 12, 125. [Google Scholar] [CrossRef]
  45. Santos-Hernández, A.F.; Monterroso-Rivas, A.I.; Granados-Sánchez, D.; Villanueva-Morales, A.; Santacruz-Carrillo, M. Projections for Mexico’s Tropical Rainforests Considering Ecological Niche and Climate Change. Forests 2021, 12, 119. [Google Scholar] [CrossRef]
  46. Zurell, D.; Franklin, J.; König, C.; Bouchet, P.J.; Dormann, C.F.; Elith, J.; Fandos, G.; Feng, X.; Guillera-Arroita, G.; Guisan, A.; et al. A standard protocol for reporting species distribution models. Ecography 2020, 43, 1261–1277. [Google Scholar] [CrossRef]
  47. Brown, J.L.; Bennett, J.R.; French, C.M. SDMtoolbox 2.0: The next generation Python-based GIS toolkit for landscape genetic, biogeographic and species distribution model analyses. PeerJ 2017, 5, e4095. [Google Scholar] [CrossRef]
  48. Václavík, T.; Meentemeyer, R.K. Invasive species distribution modeling (iSDM): Are absence data and dispersal constraints needed to predict actual distributions? Ecol. Model. 2009, 220, 3248–3258. [Google Scholar] [CrossRef]
  49. Smith, A.B.; Godsoe, W.; Rodríguez-Sánchez, F.; Wang, H.H.; Warren, D. Niche Estimation Above and Below the Species Level. Trends Ecol. Evol. 2019, 34, 260–273. [Google Scholar] [CrossRef]
  50. Ashcroft, M.B.; French, K.O.; Chisholm, L.A. A simple post-hoc method to add spatial context to predictive species distribution models. Ecol. Model. 2012, 228, 17–26. [Google Scholar] [CrossRef]
  51. Barbet-Massin, M.; Thuiller, W.; Jiguet, F. The fate of European breeding birds under climate, land-use and dispersal scenarios. Glob. Change Biol. 2011, 18, 881–890. [Google Scholar] [CrossRef]
  52. Abdelaal, M.; Fois, M.; Fenu, G.; Bacchetta, G. Using MaxEnt modeling to predict the potential distribution of the endemic plant Rosa arabica Crép. in Egypt. Ecol. Inform. 2019, 50, 68–75. [Google Scholar] [CrossRef]
  53. Wei, H.B.; Lv, X.; Gao, X.F.; Zhang, M. Advances in Orchidacea Medicinal Plant Cremastra appendiculata. Guizhou Agric. Sci. 2017, 45, 88–92. [Google Scholar]
  54. An-min, M. Description on Wild Flower Resources of Orchidaceae (Cremastra, Dendrobium, Spiranthes, Cymbidium) in Western Henan Province. Hortic. Seed 2021, 41, 23–24. [Google Scholar] [CrossRef]
  55. Zhang, S.L.; Zhang, W.; Zhang, S. Preliminary study on relationship between fruiting phenology of Orchidaceae in China and major climatic factors. J. Plant Resour. Environ. 2021, 30, 1–9. [Google Scholar]
  56. Zahoor, B.; Liu, X.; Songer, M. The impact of climate change on three indicator Galliformes species in the northern highlands of Pakistan. Environ. Sci. Pollut. Res. Int. 2022, 29, 54330–54347. [Google Scholar] [CrossRef]
  57. Guo, Y.-L.; Wei, H.-Y.; Lu, C.-Y.; Zhang, H.-L.; Gu, W. Predictions of potential geographical distribution of Sinopodophyllum hexandrum under climate change. Chin. J. Plant Ecol. 2014, 38, 249–261. [Google Scholar] [CrossRef]
  58. Kumar, D.; Rawat, S. Modeling the effect of climate change on the distribution of threatened medicinal orchid Satyrium nepalense D. Don in India. Environ. Sci. Pollut. Res. Int. 2022, 412, 1–14. [Google Scholar] [CrossRef]
  59. Feng, G.; Mao, L.; Sandel, B.; Swenson, N.G.; Svenning, J.C. High plant endemism in China is partially linked to reduced glacial-interglacial climate change. J. Biogeogr. 2015, 43, 145–154. [Google Scholar] [CrossRef]
  60. Charitonidou, M.; Kougioumoutzis, K.; Halley, J.M. An Orchid in Retrograde: Climate-Driven Range Shift Patterns of Ophrys helenae in Greece. Plants 2021, 10, 470. [Google Scholar] [CrossRef]
  61. Chen, D.-L.; Zhong, C.; Jian, S.; Li, L.-X.; Wei, K.-H.; Miu, J.-H. Conservation Research on Endangered Medicinal Plant Dysosma versipellis (Hance) M. Cheng ex Ying. Mod. Chin. Med. 2022, 24, 395–402. [Google Scholar]
  62. Zhang, X.; Bi, C.; Shi, H.; Li, X. Structural studies of a mannoglucan from Cremastra appendiculata (Orchidaceae) by chemical and enzymatic methods. Carbohydr. Polym. 2021, 272, 118524. [Google Scholar] [CrossRef]
  63. Adhikari, D.; Barik, S.K.; Upadhaya, K. Habitat distribution modelling for reintroduction of Ilex khasiana Purk., a critically endangered tree species of northeastern India. Ecol. Eng. 2012, 40, 37–43. [Google Scholar] [CrossRef]
  64. Blach-Overgaard, A.; Svenning, J.-C.; Dransfield, J.; Greve, M.; Balslev, H. Determinants of palm species distributions across Africa: The relative roles of climate, non-climatic environmental factors, and spatial constraints. Ecography 2010, 33, 380–391. [Google Scholar] [CrossRef]
  65. Lin, L.; Jin, L.; Wang, Z.H.; Cui, Z.J.; Ma, Y. Prediction of the potential distribution of Tibetan medicinal Lycium ruthenicum in context of climate change. China J. Chin. Mater. Med. 2017, 42, 2659–2669. [Google Scholar] [CrossRef]
  66. Tupac Otero, J.; Ackerman, J.D.; Bayman, P. Diversity and host specificity of endophytic Rhizoctonia-like fungi from tropical orchids. Am. J. Bot. 2002, 89, 1852–1858. [Google Scholar] [CrossRef]
  67. Pellegrino, G.; Luca, A.; Bellusci, F. Relationships between orchid and fungal biodiversity: Mycorrhizal preferences in Mediterranean orchids. Plant Biosyst. Int. J. Deal. All Asp. Plant Biol. 2014, 150, 180–189. [Google Scholar] [CrossRef]
  68. Jacquemyn, H.; Waud, M.; Brys, R.; Lallemand, F.; Courty, P.E.; Robionek, A.; Selosse, M.A. Mycorrhizal Associations and Trophic Modes in Coexisting Orchids: An Ecological Continuum between Auto- and Mixotrophy. Front. Plant Sci. 2017, 8, 1497. [Google Scholar] [CrossRef]
  69. Reiter, N.; Lawrie, A.C.; Linde, C.C. Matching symbiotic associations of an endangered orchid to habitat to improve conservation outcomes. Ann. Bot. 2018, 122, 947–959. [Google Scholar] [CrossRef]
Figure 1. Photos of Cremastra appendiculata in the field and its distribution across China. (a) location; (b) flower; (c) individual; (d) pseudobulb.
Forests 13 01504 g001
Figure 2. Predicted distribution of C. appendiculata in China under current climate conditions.
Forests 13 01504 g002
Figure 3. Predicted distribution of C. appendiculata in China under past (LGM and MH) and future (2050s–2090s) climate scenarios.
Forests 13 01504 g003
Figure 4. Changes in potential suitable areas of C. appendiculata under current and future climate conditions.
Forests 13 01504 g004
Figure 5. Areas (a) and changes (b) of habitats of different suitability for C. appendiculata in China during various periods.
Forests 13 01504 g005
Figure 6. Composite prediction of low impact areas supported by varying numbers of shared socioeconomic pathways (SSP1-2.6, SSP2-4.5, SSP3-7.0, and SSP5-8.5).
Forests 13 01504 g006
Figure 7. Core distribution shifts under 12 climate scenarios/years. Arrows indicate the magnitude and direction of predicted changes over time.
Forests 13 01504 g007
Table 1. Environmental variables and their contributions and suitable value ranges.
CodeEnvironmental VariablePercent
Contribution
Permutation
Importance
BIO02Mean diurnal range (Mean of monthly (max temp − min temp)) (°C)51.130.7
BIO11Mean temperature of coldest quarter (°C)38.551.4
BIO04Temperature seasonality (standard deviation × 100)3.84.7
BIO14Precipitation of driest month (mm)2.33.2
BIO08Mean temperature of wettest quarter (°C)2.32.7
BIO15Precipitation seasonality (Coefficient of Variation) (mm)1.22.8
BIO18Precipitation of warmest quarter (mm)0.84.5
Table 2. Predicted suitable areas under current and future climatic conditions.
DecadesPredicted Area (×104 km2) and % of the Corresponding Current Area
Total Suitable RegionLowly Suitable RegionModerately Suitable RegionHighly Suitable Region
LGM193.49130.5362.690.28
(90.46%)(88.34%)(108.64%)(3.26%)
MH187.61124.2954.958.38
(87.71%)(84.11%)(95.21%)(99.30%)
1970–2000213.90147.7657.718.44
SSP1-2.62050s137.87106.1230.071.68
(64.45%)(71.82%)(52.10%)(19.92%)
2070s140.54106.4031.982.17
(65.70%)(72.01%)(55.42%)(25.69%)
2090s153.85116.8434.742.27
(71.92%)(79.08%)(60.19%)(26.88%)
SSP2-4.52050s145.42111.5631.752.11
(67.98%)(75.50%)(55.01%)(24.99%)
2070s125.3298.4525.571.30
(58.59%)(66.63%)(44.32%)(15.36%)
2090s112.6589.8821.970.80
(52.66%)(60.83%)(38.08%)(9.47%)
SSP3-7.02050s155.87119.4433.882.55
(72.87%)(80.84%)(58.70%)(30.23%)
2070s124.6199.6523.831.12
(58.25%)(67.44%)(41.30%)(13.31%)
2090s98.1980.8716.680.63
(45.90%)(54.73%)(28.91%)(7.49%)
SSP5-8.52050s128.16110.1026.571.48
(59.91%)(67.75%)(46.05%)(17.56%)
2070s98.1480.5416.930.67
(45.88%)(54.51%)(29.34%)(7.91%)
2090s183.65135.6343.774.26
(85.86%)(91.79%)(75.84%)(50.45%)
Table 3. Low impact areas (LIAs) under different shared socio-economic pathways (SSPs).
LIA StatisticsShared Socio-Economic Pathways (SSPs)
SSP1-2.6SSP2-4.5SSP3-7.0SSP5-8.5
Geographic area (×104 km2)130.01102.1582.9584.40
Percentage of current suitable area (%)60.7847.7538.7839.46
Percentage of SSP1-2.6 area (%)100.0078.5763.8064.92
Publisher’s Note: MDPI stays neutral with regard to jurisdictional claims in published maps and institutional affiliations.

