Article

Detection of Pine Wilt Disease Using Drone Remote Sensing Imagery and Improved YOLOv8 Algorithm: A Case Study in Weihai, China

1
School of Resources and Environment Engineering, Ludong University, Yantai 264025, China
2
Key Laboratory of Ecological Safety and Sustainable Development in Arid Lands, Xinjiang Institute of Ecology and Geography, Chinese Academy of Sciences, Urumqi 830011, China
3
University of Chinese Academy of Sciences, Beijing 100049, China
4
Yantai New-Old Kinetic Energy Conversion Research Institute, Yantai 264004, China
5
Yantai Scientific and Technological Achievements Transfer Conversion Demonstration Base, Yantai 264004, China
6
Yundu Seahawk UAV Application Technology Co., Yantai 264000, China
7
Yantai Geographic Information Center, Yantai 264039, China
8
Yantai Land Reserve and Utilisation Centre, Yantai 264100, China
9
School of Art & Design, Guangdong University of Technology, Guangzhou 510030, China
10
Yantai Land Use Planning Station, Yantai 264039, China
*
Author to whom correspondence should be addressed.
These authors contributed equally to this work.
Forests 2023, 14(10), 2052; https://doi.org/10.3390/f14102052
Submission received: 9 September 2023 / Revised: 5 October 2023 / Accepted: 11 October 2023 / Published: 13 October 2023
(This article belongs to the Section Forest Health)

Abstract

:
Pine Wilt Disease (PWD) is a devastating global forest disease that spreads rapidly and causes severe ecological and economic losses. Drone remote sensing imaging technology is an effective way to detect PWD and control its spread. However, the existing algorithms for detecting PWD using drone images have low recognition accuracy, difficult image calibration, and slow detection speed. We propose a fast detection algorithm for PWD based on an improved YOLOv8 model. The model first adds a small object detection layer to the Neck module in the YOLOv8 base framework to improve the detection performance of small diseased pine trees and then inserts three attention mechanism modules on the backbone network to extend the sensory field of the network to enhance the extraction of image features of deep diseased pine trees. To evaluate the proposed algorithm framework, we collected and created a dataset in Weihai City, China, containing PWD middle-stage and late-stage infected tree samples. The experimental results show that the improved YOLOv8s-GAM model achieves 81%, 67.2%, and 76.4% optimal detection performance on mAP50, mAP50-95, and Mean evaluation metrics, which is 4.5%, 4.5%, and 2.7% higher than the original YOLOv8s model. Our proposed improved YOLOv8 model basically meets the needs of large-scale PWD epidemic detection and can provide strong technical support for forest protection personnel.

1. Introduction

As the importance of ecological protection and carbon emission reduction has been increasing among countries, scholars in the field have actively engaged in research on ecological conservation and pest prevention. Pine trees are widely distributed in some countries and have important ecological functions such as windbreak, sand fixation, carbon sequestration, and soil and water conservation. However, pine forests are threatened by a nematode that uses Monochamus alternatus [1] as the main vector and infects the resin ducts of pine trees, causing Pine Wilt Disease (PWD) [2,3]. PWD originated in North America and has now spread to East Asia. In China alone, nineteen provincial-level administrative regions have suffered from PWD, resulting in serious ecological and economic losses [4].
The main methods for detecting PWD include manual ground survey, satellite remote sensing monitoring, and UAV remote sensing monitoring [5]. The manual ground survey has limitations such as incomplete coverage, long survey cycles, and a large workload due to the wide area and steep terrain of pine forests. Satellite remote sensing monitoring has advantages over field surveys in terms of spatial coverage and temporal resolution [6,7]. Some studies have used high-resolution satellite images such as GeoEye-l and IKONOS to identify diseased and healthy pines from pine forest areas using object-oriented classification methods [8,9,10]. Due to the distinct differences in spectral characteristics and color appearance between infected pines and healthy pines, such as the presence of yellow-green and reddish-brown hues, it becomes evident that there are low levels of chlorophyll, water content, and reduced cell activity [11,12]. Some studies have established a model for identifying pine wood nematode disease using K-nearest neighbor and maximum entropy methods, based on spectral and textural information from pine trees [13]. While remote sensing methods offer advantages over field surveys, challenges arise due to the extended revisit cycles of satellites and the compromised image quality caused by atmospheric clouds. These issues can lead to reduced timeliness, missed detection, and misclassification of diseased trees when relying solely on the spectral characteristics of remote sensing imagery objects [14].
In recent years, with the rapid advancement of low-altitude aerial photography equipment, the collection of data by Unmanned Aerial Vehicles (UAVs) has gained prominence due to its cost-effectiveness, flexibility, and timeliness. Its applications have expanded into various domains, including forestry resource detection, real scene 3D modeling, and mine surveying [15,16]. UAVs have proven to be more efficient and less labor-intensive than manual surveys for monitoring forest pests and diseases. Additionally, they exhibit superior accuracy in identifying individual diseased trees compared to traditional satellite remote sensing methods. As PWD continues to escalate worldwide, the employment of UAV remote sensing imagery and machine learning for PWD identification has garnered increasing attention from scholars in the field. In one study, a combination of self-organizing structure maps and random forest models were used to effectively extract feature information from pine forests to assess the level of PWD hazard [17]. Another research effort employed an object-oriented multi-scale segmentation method to delineate pine crowns and classify trees afflicted with PWD [18]. Some scholars partitioned high-resolution UAV ortho-images into squares and integrated artificial neural networks (ANN) and support vector machines (SVM) to successfully generate spatial distribution coverage maps for PWD [4]. Additionally, researchers leveraged residual neural networks to classify UAV forest tree species image data collected over more than 3 years, achieving high accuracy in evaluation metrics [19]. These scholars harnessed the features and texture information present in UAV images, coupling them with machine learning methodologies to make significant advancements in PWD monitoring and identification outperforming manual surveys and satellite remote sensing classification. However, the accuracy of the PWD monitoring hinges on several factors, including the study area’s location, image calibration, model methodologies, and field survey personnel experience. Most machine learning classification methods predominantly focus on the image’s low-level color and texture features, limiting their ability to utilize deep image features and thereby potentially compromising the accuracy of UAV-based PWD monitoring tasks.
With the remarkable success of deep learning in image classification and object detection tasks [20], researchers have begun to explore its application in PWD monitoring [2,3,21]. Deep learning models focused on object detection can be broadly categorized into two groups. The first comprises region of interest (ROI)-driven deep neural network methods, including Fast R-CNN [22], Faster R-CNN [23], SPP-Net [24], and R-FCN [25]. These methods initially employ Convolutional Neural Networks (CNN) to extract features from candidate regions. Subsequently, classifiers are employed to classify each candidate region and determine the target and its category. While Region-based object detection methods offer high detection accuracy, they often demand significant computational resources, suffer from suboptimal real-time performance, and encounter challenges in detecting small and densely packed targets. The second category encompasses one-stage detection algorithms such as YOLO series [26] and SSD [27]. These methods boast advantages like rapid detection speed and streamlined network models, but they still grapple with issues like imprecise localization of target detection boxes, limited detection effectiveness for small objects, and training model complexities.
In the realm of PWD monitoring using UAV imagery combined with deep learning, a reference [28] established a PWD detection model within the Faster-RCNN framework. This Model incorporated an additional information output model to pinpoint the actual geographical location of diseased trees. This approach achieved swift detection and precise localization of PWD diseased trees. Reference [29] employed both Faster R-CNN and YOLOv3 deep learning frameworks, alongside two conventional machine learning methods, to predict the pine infection rates under various treatment conditions (retaining or removing dead pine trees). Results indicated that YOLOv3 outperformed other baseline models, rendering it suitable for real-time PWD monitoring. Despite the increasing adoption of deep learning methods for classifying and detecting tree species from UAV images, they continue to face limitations in effectively identifying small object diseased pine trees and may experience missed detections in multi-object pine tree detection scenarios. Different models exhibit varying strengths in recognition accuracy and detection speed. Given the substantial volume of UAV image data associated with PWD monitoring tasks, achieving high-precision and high-efficiency detection requires careful consideration. In this context, reference [29,30] conducted comparative assessments of Faster R-CNN, YOLOv3, and nine conventional machine learning methods in terms of detection speed and accuracy evaluation. The results underscored the robustness of the YOLO series models.
In recent years, attention mechanisms, autonomously developed modules within deep learning, have gained prominence for their capacity to enhance feature extraction and attenuate irrelevant information based on image color, shape, and texture feature weights [31,32]. They are widely adopted to refine the architecture of target detection networks, thereby augmenting detection accuracy. In reference [33], the Convolutional Block Attention Module (CBAM) was employed to optimize the feature extraction framework in Faster R-CNN. This optimization aimed to heighten the model’s sensitivity, especially in detecting young tomato fruits set against backgrounds with similar colors. Moreover, in another reference [34], the channel attention module was integrated into the YOLOv5 network structure. This integration was undertaken to enhance the model’s responsiveness to channel-related features. As a result, the modified model exhibited significantly improved detection accuracy when identifying powdery mildew and anthracnose in complex conditions compared to the original YOLOv5 model.
In summary, in response to the challenges of limited adaptability and generalization of the mainstream models for PWD detection, we present a rapid PWD detection model based on the enhanced YOLOv8 framework. YOLOv8 represents the latest iteration of the YOLO detection network, achieving notable enhancements in both detection speed and accuracy. Our enhancements involve the incorporation of attention modules into the YOLOv8 framework’s backbone network [35,36,37], intensifying the focus on detection regions. Additionally, we introduce a small object layer [38] within the Neck module to enhance the detection effect of the model on the small object target diseased pines in the image. The contributions of our research are encapsulated as follows:
(1)
The addition of a small object detection layer to the Neck module, thereby expanding the receptive field for small objects and mitigating the detection of redundant larger targets. This results in a reduction in false positives and the elimination of redundant detection boxes;
(2)
The introduction of an attention mechanism module into the backbone network, facilitating weighted processing of the input feature map. Subsequently, The SPPF module is employed for multi-scale pooling, enabling the extraction of more distinctive multi-scale image features;
(3)
Experimental results demonstrate that our proposed enhanced YOLOv8 model exhibits a substantial improvement in PWD detection accuracy. It also demonstrates robust generalization capabilities and offers valuable technical support for pine forest management.

2. Materials and Methods

Our study was conducted in Weihai, China, where we meticulously planned and executed UAV flights to gather image data. Subsequently, we curated a comprehensive PWD image dataset and utilized it to train a PWD detection model, which was founded on the enhanced YOLOv8 framework, a semi-supervised deep learning object detection approach. We then applied this trained model to a test set of UAV images to identify diseased trees and conducted a thorough evaluation while providing visualizations of the outcomes. In addition, we engaged in manual verification and correction processes to ascertain the spatial distribution of diseased trees within our study area. Figure 1 illustrates the overarching workflow of our methodology.

2.1. Overview of the Study Area and Data Collection

Our study area is located in Weihai City, Shandong Province, China (E121°43′–122°19′, N36°52′–37°23′), with an area of 1364 km2 and a coastline of about 169 km [39]. The study area is in the north temperate zone, with a continental monsoon climate and an annual average temperature of 12 °C. The terrain gradually decreases from north to south, and the south is adjacent to the Yellow Sea. There are 204 km2 of pine forests in the study area, mainly consisting of red pine and black pine [40]. The study area and data acquisition are shown in Figure 2.
We employed the HY-200 vertical take-off and landing fixed-wing aerial survey UAV for our data acquisition purposes. This UAV was equipped with a 42.4 megapixel Sony A7R2 camera, featuring a 35 mm focal length and providing a ground resolution ranging from 0.03–0.07 m. Image data acquisition took place on 20 September 2022, during the hours of 8 am to 6 pm. The UAV was flown at a relative height of 120 m, with an overlap rate set to 65%–70%. Following each flight, the acquired flight data and image data underwent clarity checks, with data of insufficient clarity being discarded. The organized data were subsequently calibrated and mosaicked using Pix4D (version 4.412) software [41,42], resulting in the generation of a digital orthophoto map (DOM) boasting a spatial resolution of 3.977 cm. The overall data volume amounted to 18.27 G. Details regarding the devices and parameters used for t aerial image collection are presented in Table 1.

2.2. Preprocessing of Drone Image Data

We subjected the image data to a quality screening process, eliminating images with inadequate resolution. Pine trees infected by pine wood nematodes exhibited distinct colorations such as yellow-green, reddish-brown, and brown, which starkly contrasted with the appearance of healthy pine trees. The identification of abnormal discolored wood required precise color saturation and brightness due to the unique conditions imposed by identifying these anomalies. However, the original image’s color brightness suffered due to atmospheric impurities. Employing the dark channel dehazing algorithm, we processed the original image. This procedure bolstered color saturation and brightness, thereby enhancing the identification of abnormal discolored wood attributable to pine wood nematode infestations. To facilitate training and testing, the study area delineated in Figure 2 was partitioned into a training area and a test area. The training area, depicted in Figure 2a,b, encompassed a dataset of size 12.37 G. Correspondingly, Figure 2c depicted the test area, spanning a dataset size of 5.90 G. Considering the oversized nature of the original image frame, which was unsuitable for the model’s training and testing datasets, we leveraged the GDAL open-source library to crop and divide the image into 451 × 451-pixel segments. Subsequently, we structured the dataset following the COCO format. Within the dataset, a singular category for detection objects existed—specifically, individual damaged pine trees. A total of 4909 diseased pine trees were annotated. Ground truth values for diseased pine trees were determined visually by field operators and verified through on-site manual checks. Location information was also annotated. Ultimately, our efforts yielded a collection of 1450 datasets pertaining to diseased pine trees, consisting of 1180 training sets and 270 test sets. Part of the annotated dataset is shown in Figure 3.

2.3. Improvement of the YOLOv8 Model

The YOLOv8 network model comprises four key components: the input module, Backbone module, Neck module, and output module. In this study, we set out to address the challenges of insufficient feature extraction and limited recognition efficiency encountered by the YOLOv8 algorithm in the context of identifying abnormal discolored wood. To tackle these challenges, we made enhancements to both the Backbone and Neck components of the YOLOv8 framework. The improved algorithm’s structural diagram is illustrated in Figure 4. Specifically, within the Neck module of the YOLOv8 framework, we introduced a small object detection layer, while in the Backbone module, we incorporated three types of attention sub-modules, as depicted in Part 1 and Part 2 of Figure 4. The process commences with the input of the diseased wood image into the enhanced YOLOv8 framework. Here, the backbone network undertakes the extraction of image object features, while the Neck module amalgamates deep and shallow feature semantic information along the top-down and bottom-up pathways. Subsequently, the output module generates three distinct feature vectors. These vectors are employed for predicting image features, obtaining anchor boxes, and predicting object categories and confidence scores.
Within the Neck module featuring the newly introduced small object detection layer, five distinct operational steps transpire. The initial step involves upsampling the feature information from the preceding layer. Subsequently, the second step entails performing a fully connected operation with the feature information from the shallowest C2f model. The outcome of this operation, in the third step, yields a 160 × 160 × 128 result map through the C2f module. The fourth step involves passing the result from the C2f module through the CBS module to ensure channel consistency with the feature information of the subsequent layer. The final step encompasses the connection of an additional fully connected layer, ultimately yielding four diverse feature vectors, constituting the YOLOv8-Small model. The incorporation of the small object detection layer model effectively enables us to acquire and integrate deep and shallow feature information, thereby facilitating the extraction of small object features and enhancing the model’s detection accuracy.
We introduced three distinct plug-and-play visual attention modules, Convolutional Block Attention Module (CBAM), Efficient Channel Attention (ECA), and Global Attention Mechanism (GAM), sequentially preceding the SPPF layer within the YOLOv8-Small backbone network framework. CBAM, ECA, and GAM modules are the current high-performance attention modules, which can be added to the backbone and neck networks of any mainstream object detection framework to improve the overall detection precision of the frameworks. This incorporation yielded three distinctive Atten-YOLOv8 models: YOLOv8-CBAM, YOLOv8-ECA, and YOLOv8-GAM, as illustrated in Figure 4 Part 2. By integrating these attention modules, the backbone network was empowered to prioritize critical segments of the input data. The typical input for an attention module consists of a tensor representing the input data and a tensor conveying attention weights. The module subsequently produces an output in the form of a weighted data tensor, wherein the weighting assigned to each position corresponds to the value found in the corresponding position within the attention weight tensor.
The Convolutional Attention Module (YOLOv8-CBAM): It consists of two crucial components: the Channel Attention Module (CAM) and the Spatial Attention Module (SAM), as depicted in Figure 5a. CAM initially conducts global average pooling and global max pooling on the input PWD feature map denoted as F C B A M R C * H * W , thereby yielding two vectors, F a v g R C and F m a x R C , which respectively represent the average and maximum values of each channel. These vectors are then fed into a multilayer perceptron (MLP) composed of two fully connected layers, ultimately producing two vectors, M a v g R C and M m a x R C . In this process, the first fully connected layer reduces the input dimension to C / r , while the second fully connected layer restores the output dimension to C , where r is a hyperparameter. The resulting two output vectors, M a v g R C and M m a x R C , are combined element-wise to derive the channel attention vector M R C , wherein each element signifies the weight coefficient pertaining to the corresponding channel. Finally, this channel attention vector M R C is employed to perform channel-wise multiplication with the input feature map F C B A M R C * H * W , thereby yielding the output feature map denoted as F C B A M R C * H * W . The CAM can be mathematically expressed by Equation (1):
F C A M = σ M L P F a v g + M L P F m a x F a v g
where σ is the Sigmoid function, MLP is the multilayer perceptron. SAM takes the output F C A M R C * H * W of CAM as input and assigns a weight to each spatial position, indicating the importance of that position. Its calculation is expressed by Equation (2):
F C B A M = σ ( f 7 × 7 ( F a v g c ; F m a x c )
where f 7 × 7 means the filter size is 7 × 7 , the step size is 1, the padding is 3, and the output channel is 1, [;] represents an element-wise join.
Efficient Channel Attention Module (YOLOv8-ECA): The ECA module stands as an efficient channel attention module designed for deep convolutional neural networks. It introduces a local cross-channel interaction strategy that operates without dimensionality reduction, thereby effectively circumventing any detrimental effects that dimensionality reduction may have on the channel attention learning process. Its architectural depiction can be observed in Figure 5b. Notably, the ECA module relies on a minimal number of parameters and can serve as a plug-and-play module, bolstering the channel features of the input PWD feature map while preserving the input feature map’s dimensions. This enhancement culminates in substantial performance improvements. ECA executes global average pooling on the given PWD feature map to derive aggregated features [ C , 1 , 1 ] . Subsequently, it generates channel weights through one-dimensional convolution with a kernel size denoted as k, where k is adaptively determined based on the mapping through the channel dimension C and calculated utilizing Equation (3):
k = | l o g 2 C + b γ | o d d
where C is the number of channels, and | | o d d means that k can only take odd numbers, determined by the number of channels of the input feature map. γ and b are constants used to change the relationship between the number of channels C and the size of the convolution kernel.
Global Attention Mechanism (YOLOv8-GAM): GAM extends the principles of CBAM by incorporating three-dimensional reasoning, which serves to minimize information diffusion while amplifying the representation of global interactions. This enhancement contributes to the overall performance improvement of the detection network. The structural diagram of GAM is illustrated in Figure 5c. When applied to an input PWD feature map denoted as F G A M R C * H * W , it yields intermediate state F G A M and output state F G A M as computed by Equation (4):
F G A M = M C F G A M F G A M F G A M = M S F G A M F G A M
where M C and M S are the channel attention map and spatial attention map, respectively, and represents element-wise multiplication. The channel attention sub-module uses a three-dimensional arrangement to retain information in three dimensions. Then we use a two-layer MLP to amplify the cross-dimensional channel-spatial dependency (the MLP is an encoder-decoder structure, the same as CBAM, with a compression ratio of r ).

2.4. Experimental Environment and Metrics

The training and testing phases of the experiment were conducted on the Windows 10 operating platform, utilizing an Intel® Core™ i9-10900K CPU @ 3.70GHz processor and an NVIDIA GeForce RTX 3060 GPU. We employed the PyTorch deep learning framework, working with a dataset size of 451 × 451. To augment the training set, we applied standard data augmentation techniques, such as horizontal flipping and random input jitter. The training process encompassed 300 iterations, commencing with an initial learning rate of 0.01, a batch size of 16, and optimization using Stochastic Gradient Descent (SGD). The momentum was set to 0.937, and a weight decay coefficient of 0.0005 was employed. To expedite training, we initialized the parameters of the improved YOLOv8 model with a pre-trained model on the COCO dataset.
For assessing and comparing the performance of different models, this experiment employed Average Precision (AP) and F1-score as evaluation metrics. AP represents the average precision value across various Recall values R , where Precision P is defined as T P / T P + F P , Recall R as T P / T P + F N , TP as the count of correctly identified PWD samples, FP as the count of misidentified PWD samples, and FN as the count of misdetected samples belonging to other objects. F1-score assesses the overall model performance by considering both Precision P and Recall R , calculated as the harmonic mean of the two. AP and F1-score are determined using the following Equations (5) and (6):
A P = 0 1 P R d R
F 1 = 2 P R P + R    
Taking the detection of pine wilt disease as an example, this paper only detects one feature of the infected trees, so there is only one detection category. P ( R ) is the P-R curve on [0, 1], and AP is the area enclosed by the curve.

3. Experimental Results

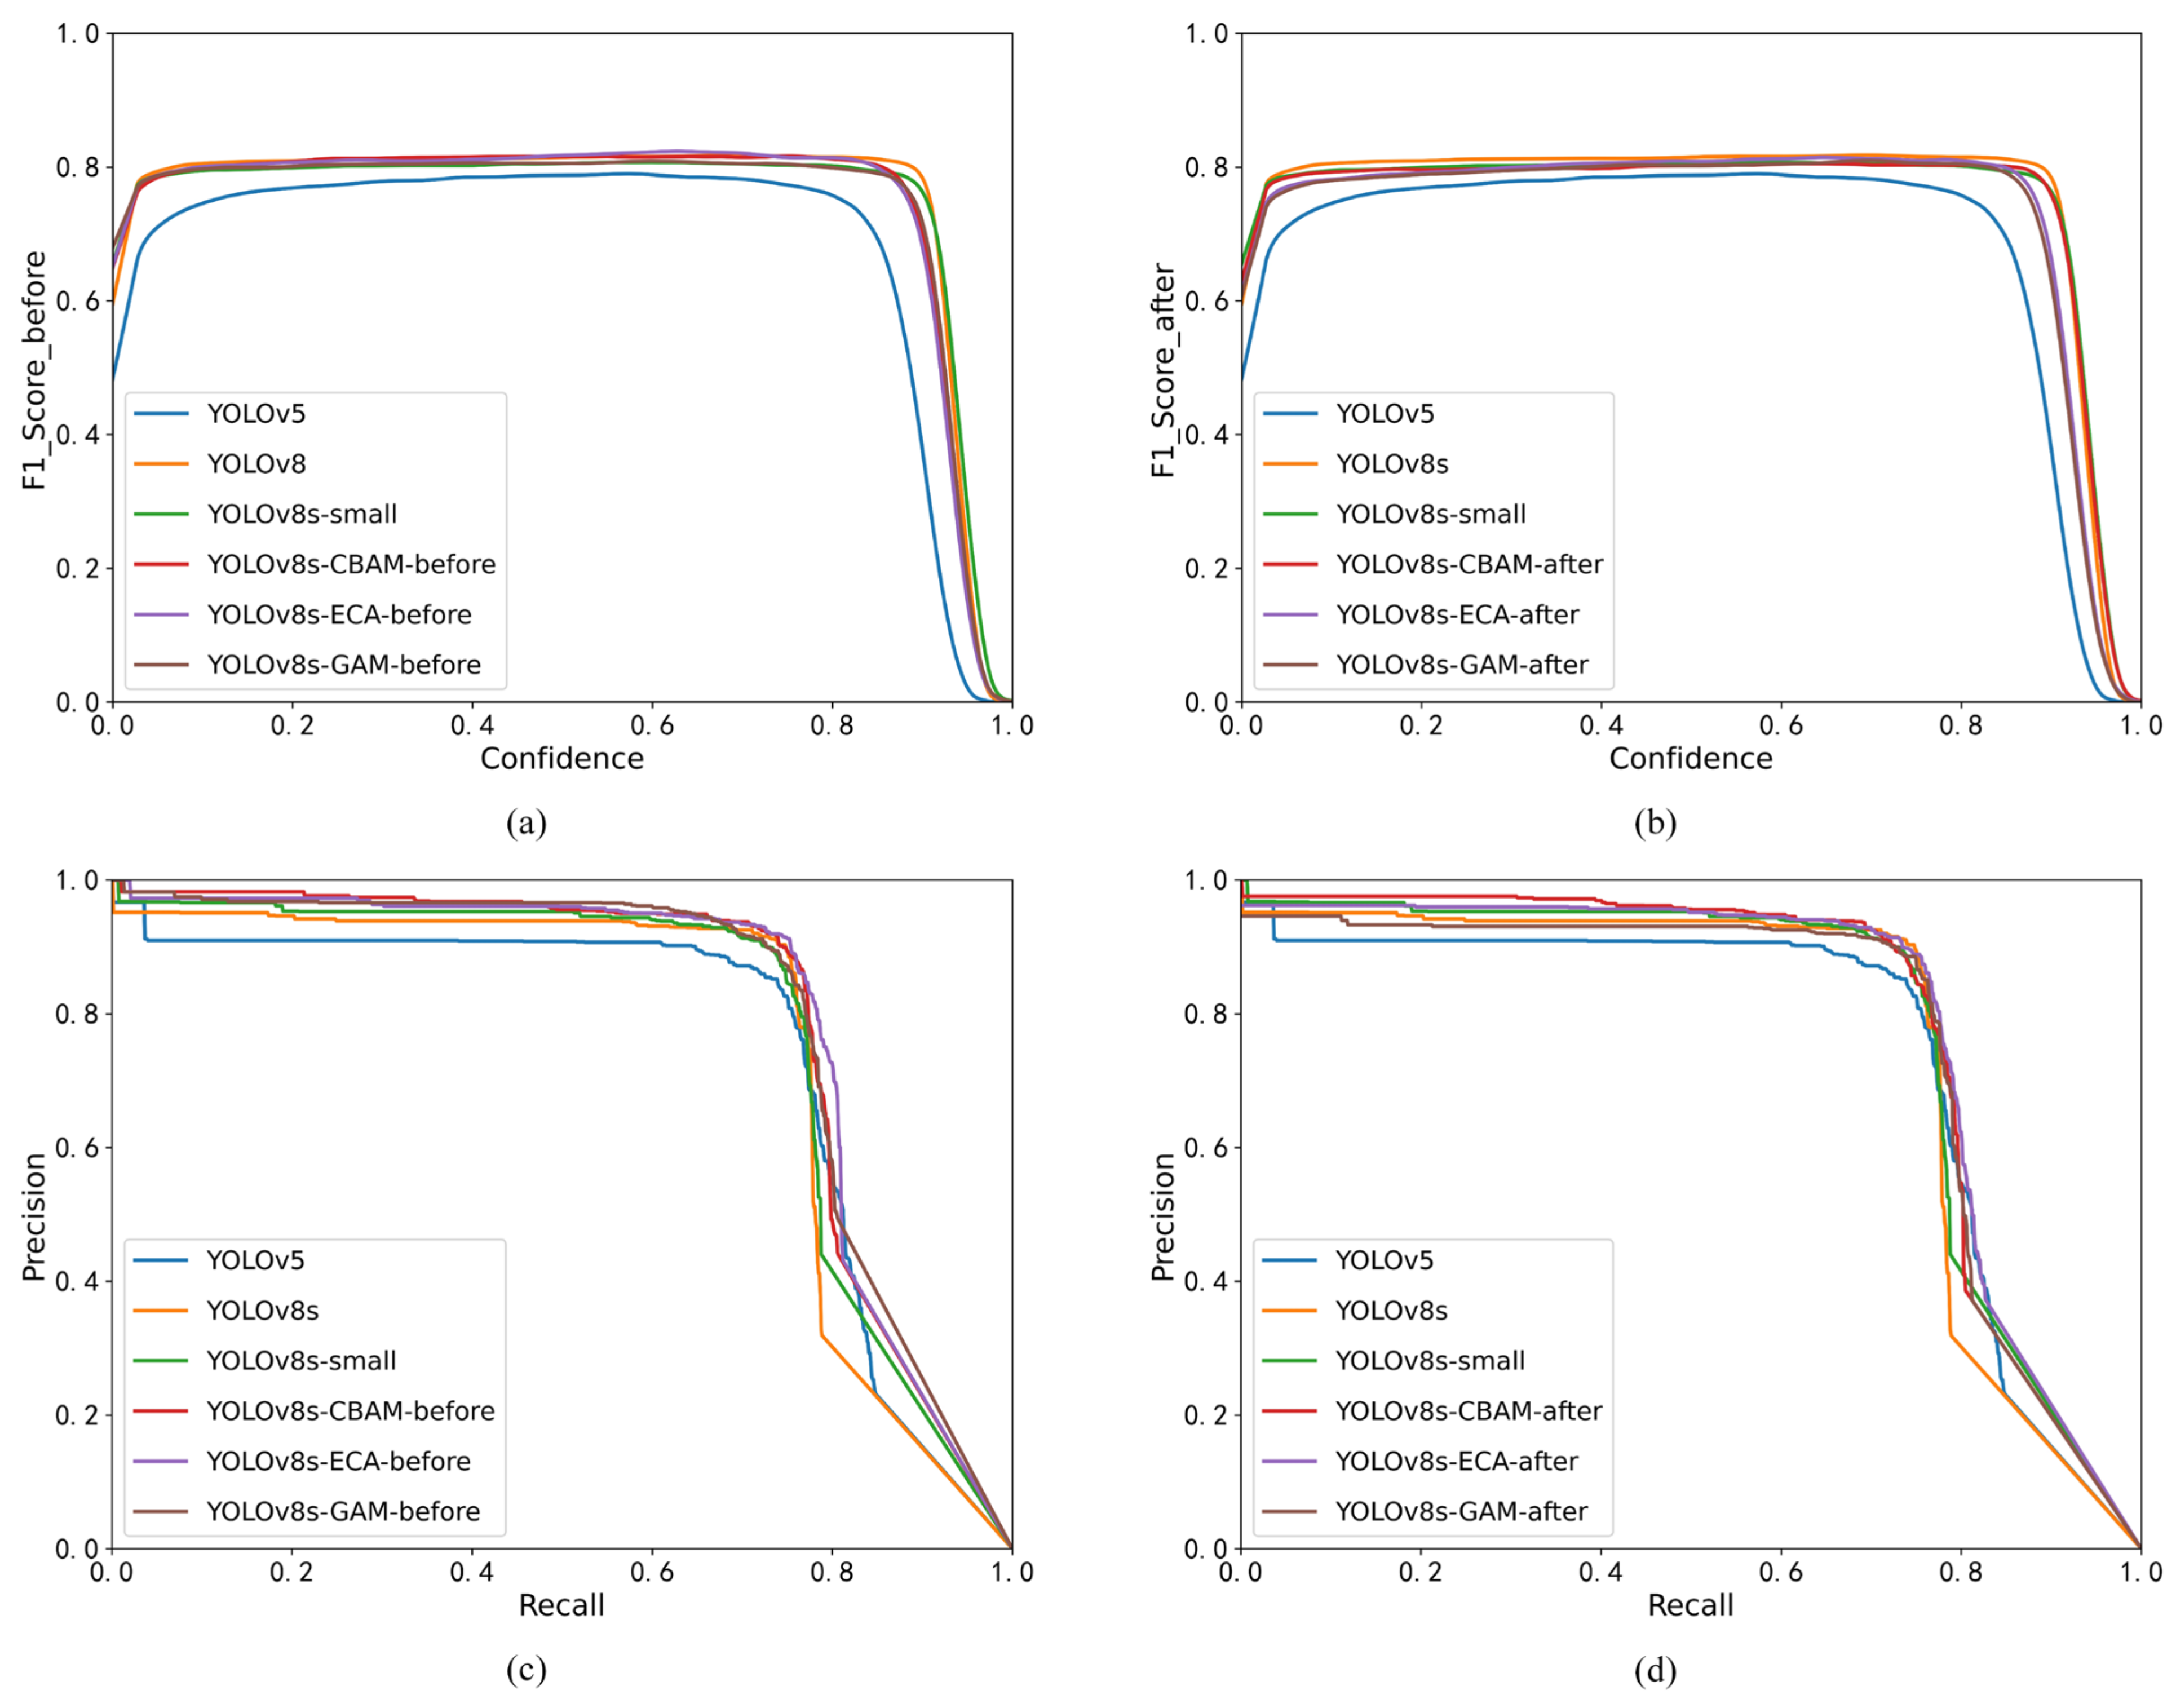
3.1. Assessment of the Precision of Quantitative Detection of PWD

Within the YOLOv8 framework, there exist five pre-trained models (YOLOv8n.pt, YOLOv8s.pt, YOLOv8m.pt, YOLOv8l.pt, YOLOv8x.pt). Among them, YOLOv8n.pt and YOLOv8s.pt stand out as lightweight pre-trained models, characterized by their modest training parameters and swift detection speed. With a keen eye on the timeliness and stability prerequisites of PWD detection, we opted for YOLOv8n.pt and YOLOv8s.pt pre-trained models for concurrent iterations of 300 rounds on the training set. This process yielded their optimal detection models, which were subsequently put to the test on the test set, enabling a thorough comparison of their performance based on various evaluation metrics. The network architectures of YOLOv8n.pt and YOLOv8s.pt pre-trained models share a similar foundation, featuring width factors of 0.25 and 0.5, respectively, along with depth factors of 0.33. Table 2 presents the accuracy results of the test set, highlighting the best values for each metric in bold. From the numerical analysis in Table 2, it is evident that under identical conditions, the YOLOv5 model lags behind the YOLOv8n and YOLOv8s models by 3.3% and 1.3% in mAP50 and mAP50-95 indicators, respectively, while also trailing by 2.7% and 2.8% in F1-Score and Mean indicators. This indicates the superior performance of the YOLOv8 base model in PWD detection tasks. Following the incorporation of a small object detection layer, YOLOv8n-Small surpasses YOLOv8s-Small by 1.3% and 1.5% in mAP-50 and F1-Score indicators, respectively, although it falls short by 1.1% in the Mean indicator. With the addition of attention modules, namely YOLOv8s-CBAM, YOLOv8s-ECA, and YOLOv8s-GAM, accuracy improvements are observed across mAP50, mAP50-95, F1-Score, and Mean indicators when compared to the YOLOv8n.pt series models. This enhancement is predominantly attributed to the broader network structure of YOLOv8s.pt, which exhibits commendable generalization capabilities. To elaborate, a larger depth factor and width factor in the neural network result in more intricate model structures and channels, thereby enabling the acquisition of richer depth feature information across network layers, including texture features of varying orientations and frequencies. Based on the accuracy values documented in Table 2, it becomes evident that models pre-trained with YOLOv8s.pt exhibit superior accuracy in comparison to those with YOLOv8n.pt pre-training. Consequently, the utilization of YOLOv8s.pt series models prove to be more apt for PWD detection tasks.
From the detailed analysis provided in Table 2, we can glean valuable insights. Upon the addition of the small object detection layer, the YOLOv8s-Small model showcased notable improvements, with a 2.1% and 4.1% boost in mAP50 and mAP50-95, respectively, compared to YOLOv8s. The F1-Score results between the two models remained similar, with a 1.6% improvement observed in the Mean indicator. This highlights that augmenting YOLOv8s-Small with the small object detection layer effectively enhances the model’s detection accuracy. This enhancement is attributed to the new detection framework’s ability to expand the receptive field for small objects while mitigating redundant detection of larger objects, consequently reducing false detections and redundant bounding boxes. Comparing YOLOv8s-Atten to YOLOv5 and YOLOv8s, we observe that YOLOv8s-Atten outperforms in all metrics, including mAP50, mAP50-95, F1-Score, and Mean. Furthermore, when contrasting YOLOv8s-Atten to YOLOv8s-Small, it achieves improvements of 2.1%, 2.4%, and 2.4% in mAP50, with the most substantial improvement being 0.4% in AP-95 and 1.7% in F1-Score. This demonstrates that the Atten-YOLOv8 framework, featuring inserted attention modules, effectively aggregates both shallow and deep feature information from PWD images, showcasing strong generalization capabilities in PWD detection. Notably, among the three YOLOv8s-Atten models, YOLOv8s-GAM excels, achieving the highest performance in mAP50, mAP50-95, and Mean indicators. It slightly lags behind YOLOv8s-ECA in the F1-Score metric. YOLOv8-GAM’s ability to capture image features in three dimensions—channel, space, and depth—plays a pivotal role in reducing information diffusion and amplifying global interaction representation, consequently enhancing the neural network’s performance. In conclusion, the comprehensive analysis of accuracy values presented in Table 2 underscores the suitability of YOLOv8-GAM for PWD detection tasks.
Table 2. Comparison of detection performance of different models.
MethodsEvaluation Metrics
mAP-50mAP50-95F1-ScoreMean
YOLOv575.250.279.068.1
YOLOv8n78.558.781.773.0
YOLOv8n-Small79.960.782.174.2
YOLOv8n-CBAM77.353.879.070.0
YOLOv8n-ECA76.352.579.669.5
YOLOv8n-GAM79.758.181.173.0
YOLOv8s76.562.781.873.7
YOLOv8s-Small78.666.880.675.3
YOLOv8s-CBAM80.764.681.675.6
YOLOv8s-ECA81.065.182.376.1
YOLOv8s-GAM81.067.280.976.4
Note: AP50 (IoU set to the average accuracy of 50 calculation), AP50-95 (IoU set to 50-95, step size 0.05, calculate the average of AP values for different IoUs in 10).

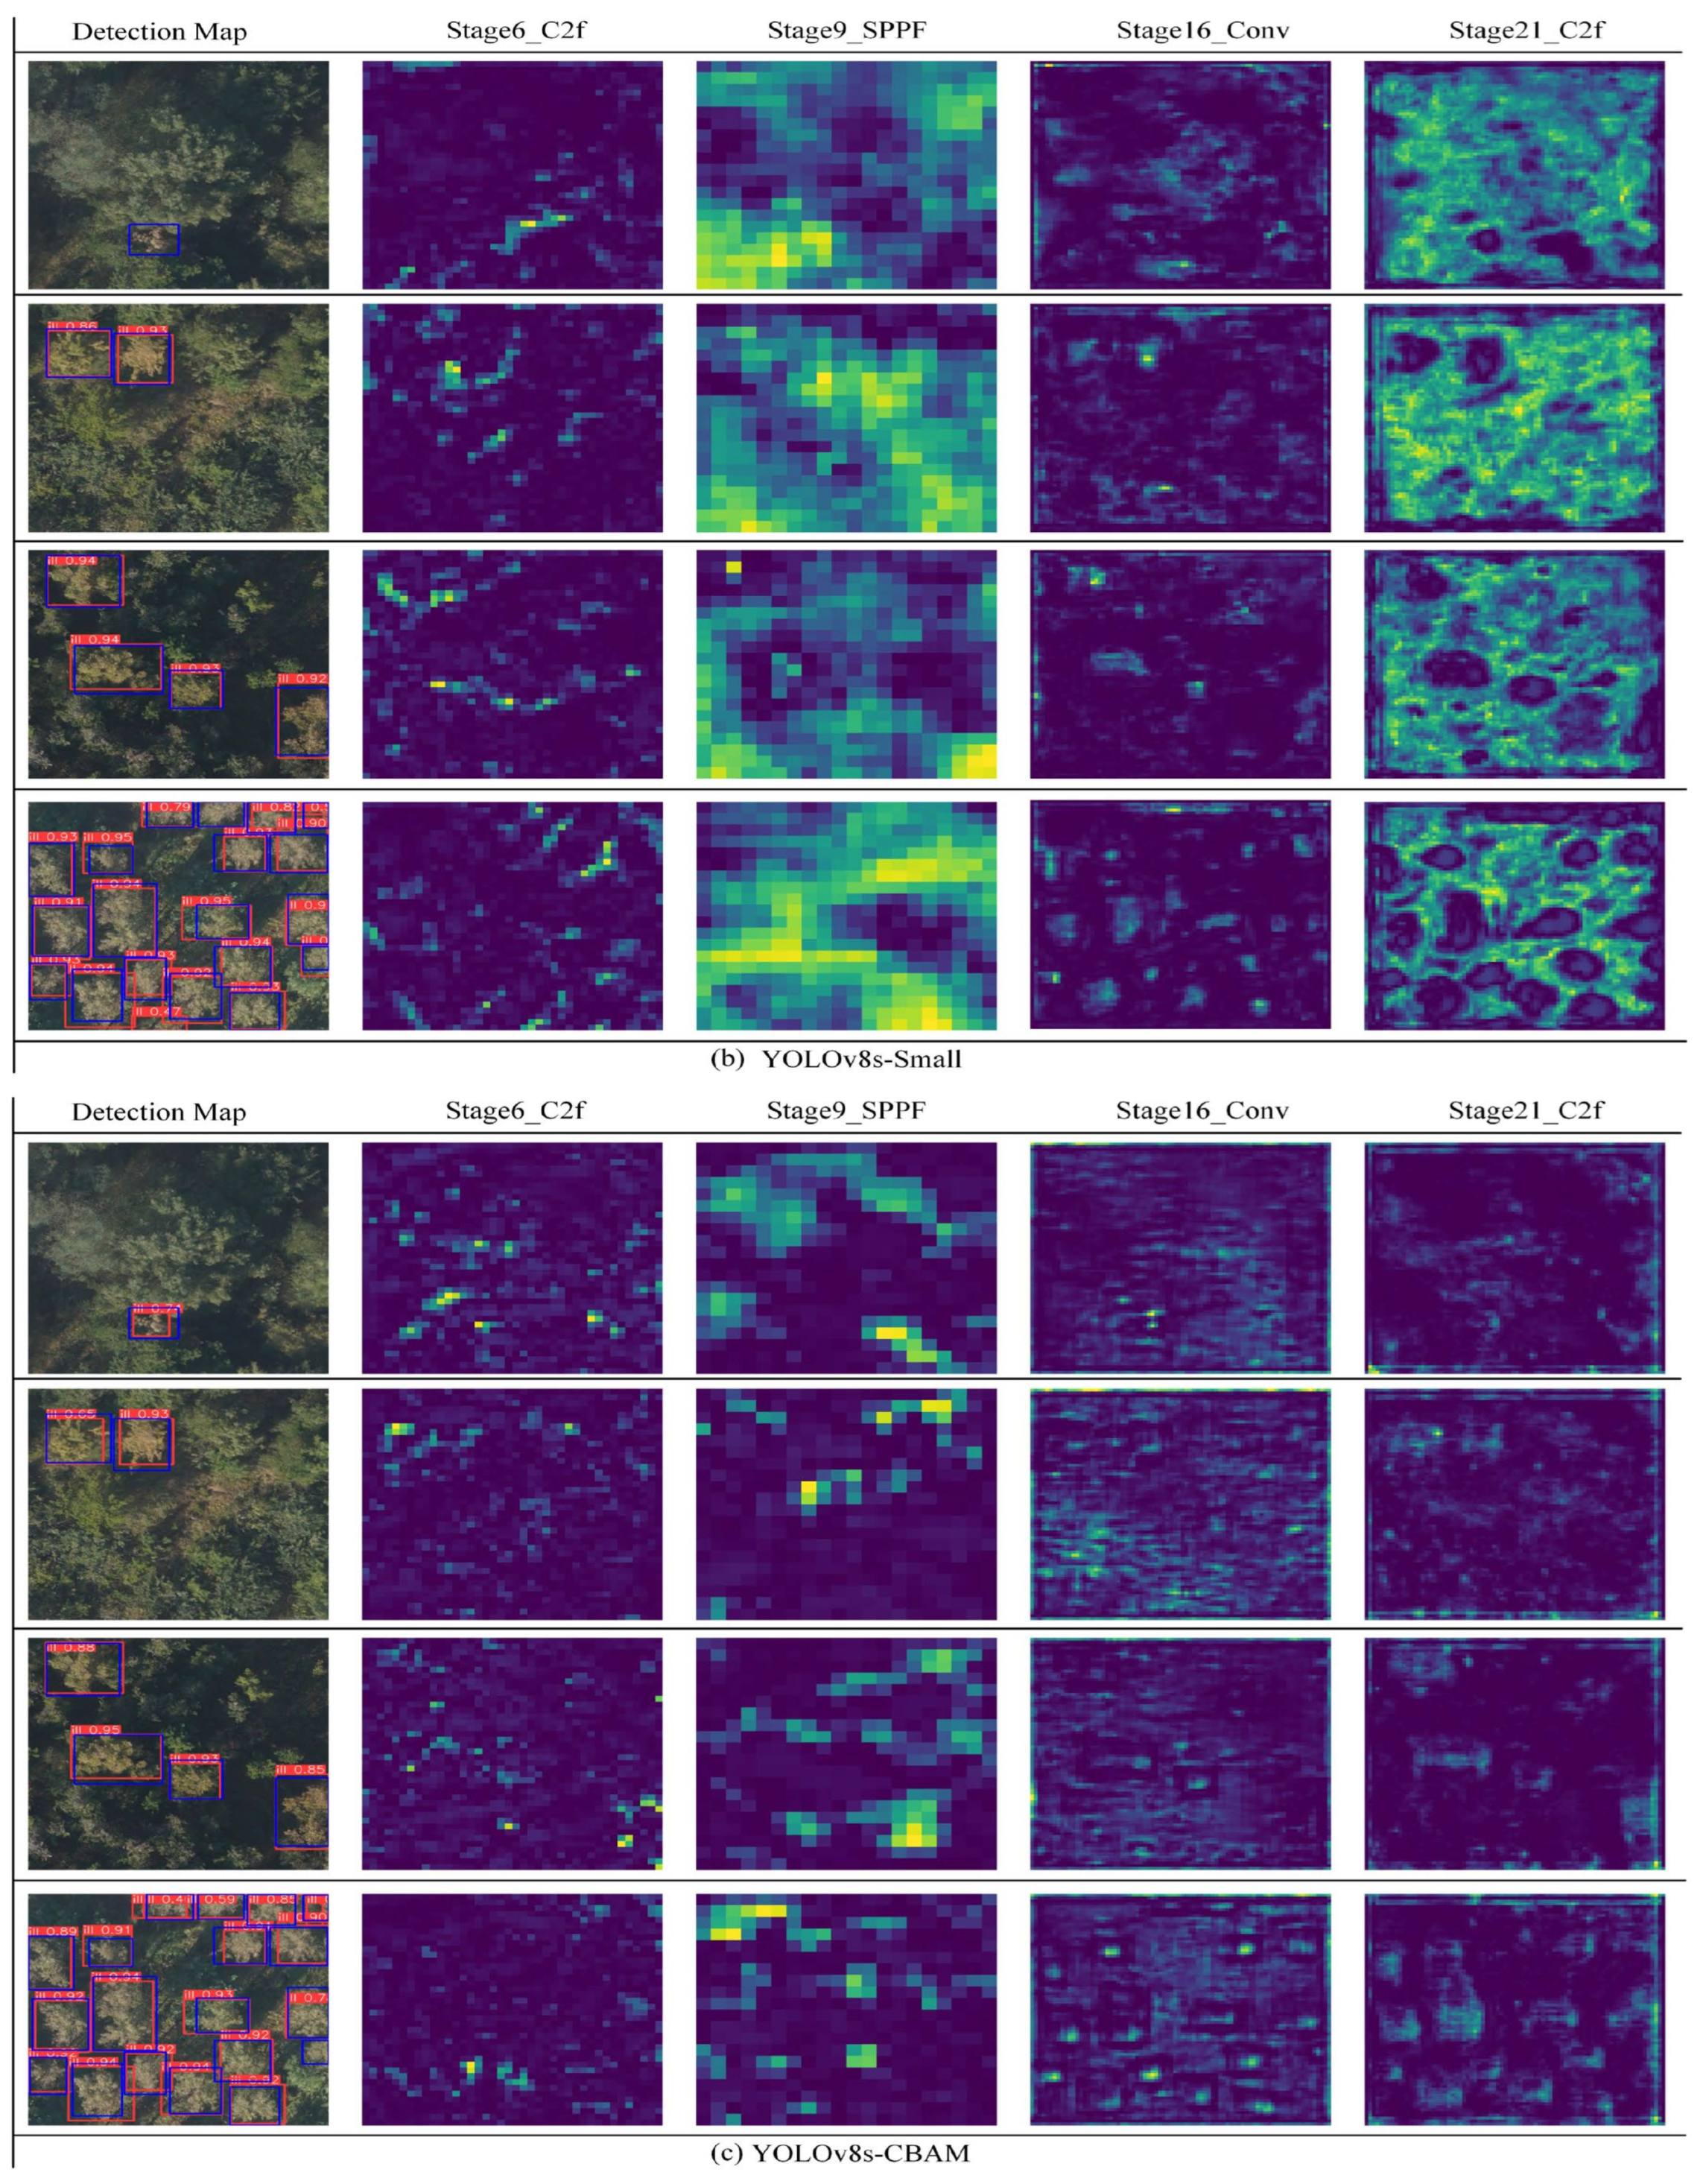
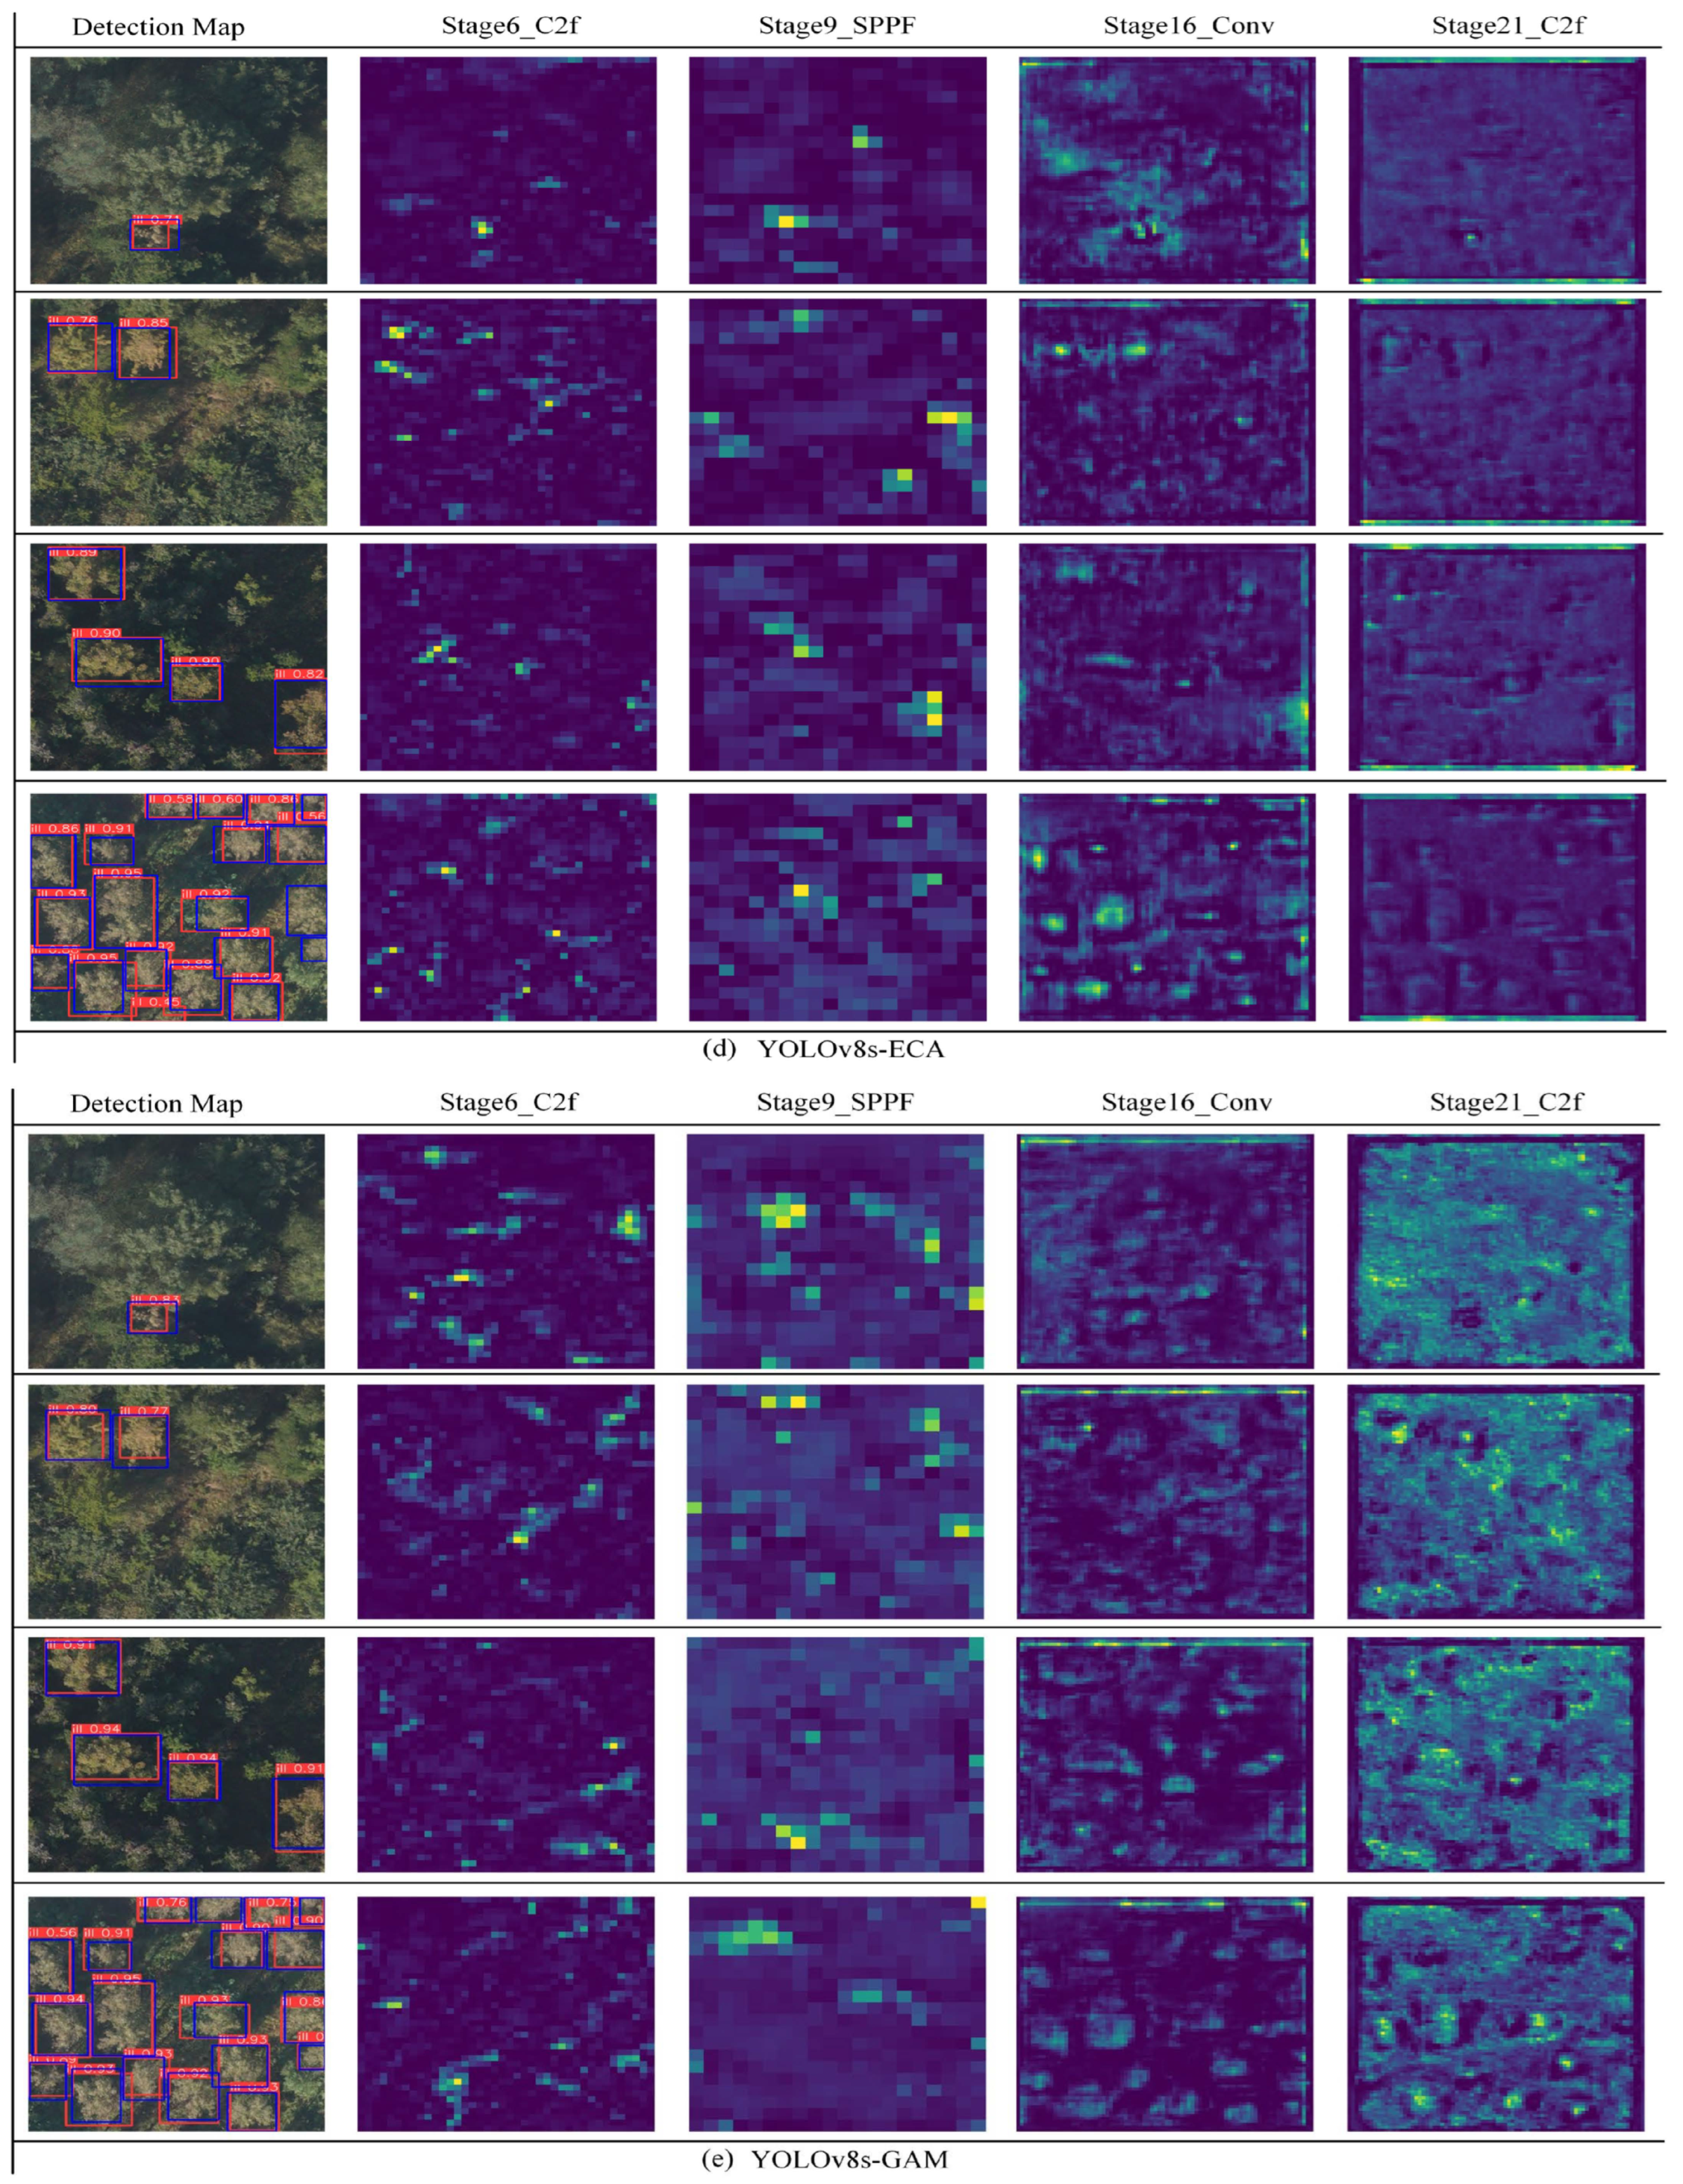
3.2. Results of Visualization of PWD

The qualitative visual analysis provided in Figure 6 highlights the detection performance of different models in identifying pine wilt disease (PWD). Four images from the test set were used for this analysis (Appendix A), yielding several important findings: YOLOv8 Detection Framework: The YOLOv8 detection framework exhibited missed and false detections in multiple examples. In the presence of multiple small targets in example (d), three missed detections occurred in the upper right corner of the image. YOLOv8-Small: The addition of the small target detection layer reduced the number of missed detections in YOLOv8-Small compared to YOLOv8. However, a false detection phenomenon was still observed in example (d). YOLOv8-Atten (CBAM, ECA, GAM): Models in the YOLOv8-Atten series, including YOLOv8-CBAM and YOLOv8-ECA, experienced missed detections only in the lower right corner of example (d). Remarkably, YOLOv8-GAM exhibited neither missed nor false detections in any of the four test cases.
To gain a deeper understanding of the feature extraction capabilities of each model in identifying PWD-discolored trees, feature maps at various layers of the network were visualized. Key observations from this visualization include: In the example (b) part of the image, YOLOv8’s feature maps at each stage struggled to capture ground object feature information effectively. YOLOv8-Small, empowered by the small target detection layer, managed to aggregate feature information related to pine forests. In the example (d) part of the image, all YOLOv8-Atten models exhibited notable improvements in their ability to capture feature information for multi-target detection when compared to YOLOv8 and YOLOv8-Small. Feature maps of the 16th and 21st layers indicated that attention improvement models were able to focus more on the image features of discolored pine tree areas while reducing the contribution of healthy pine forest areas to the recognition results. YOLOv8-GAM, which incorporated channel attention and convolutional spatial attention sub-modules with 3D reasoning and multilayer perceptrons, consistently outperformed other models. It effectively identified pine wilt disease, eliminating the issues of mis-detection and missed detection.
To provide a more comprehensive analysis of the causes behind missed and false detections in PWD recognition, a combination of detection results, feature map information, and field investigations was undertaken. Four primary reasons for these issues were identified: Similar Ground Objects: The presence of dead trees with light gray or gray-brown branches, similar to the color and texture features of PWD-discolored trees, led to false detections. This similarity confused the recognition process, affecting overall detection accuracy. Density of Pine Forest: Overly dense pine forests resulted in crown overlap and occlusion, leading to deformation in images. Such deformation contributed to missed and false detections by models during recognition. Aspect and Terrain of Pine Forest: Most pine forests in the study area are situated in regions with significant terrain variations, weak sunlight intensity in shaded slope areas, and lower brightness during image acquisition. This affected the clarity of image feature information. UAV flying height consistency resulted in higher-resolution data for high terrain and clearer crown feature information. Natural Conditions Interference: During data acquisition, wind force affected the UAV’s posture, leading to changes in the captured shape of tree crowns. This alteration resulted in image blurring and impacted detection accuracy. In conclusion, the visual analysis, feature map insights, and detailed analysis of missed and false detections provide a comprehensive understanding of the detection performance of various models. This analysis underscores the effectiveness of YOLOv8-GAM, which exhibited robust detection capabilities and addressed issues faced by other models.

3.3. Improved YOLOv8 Framework Ablation Experiments

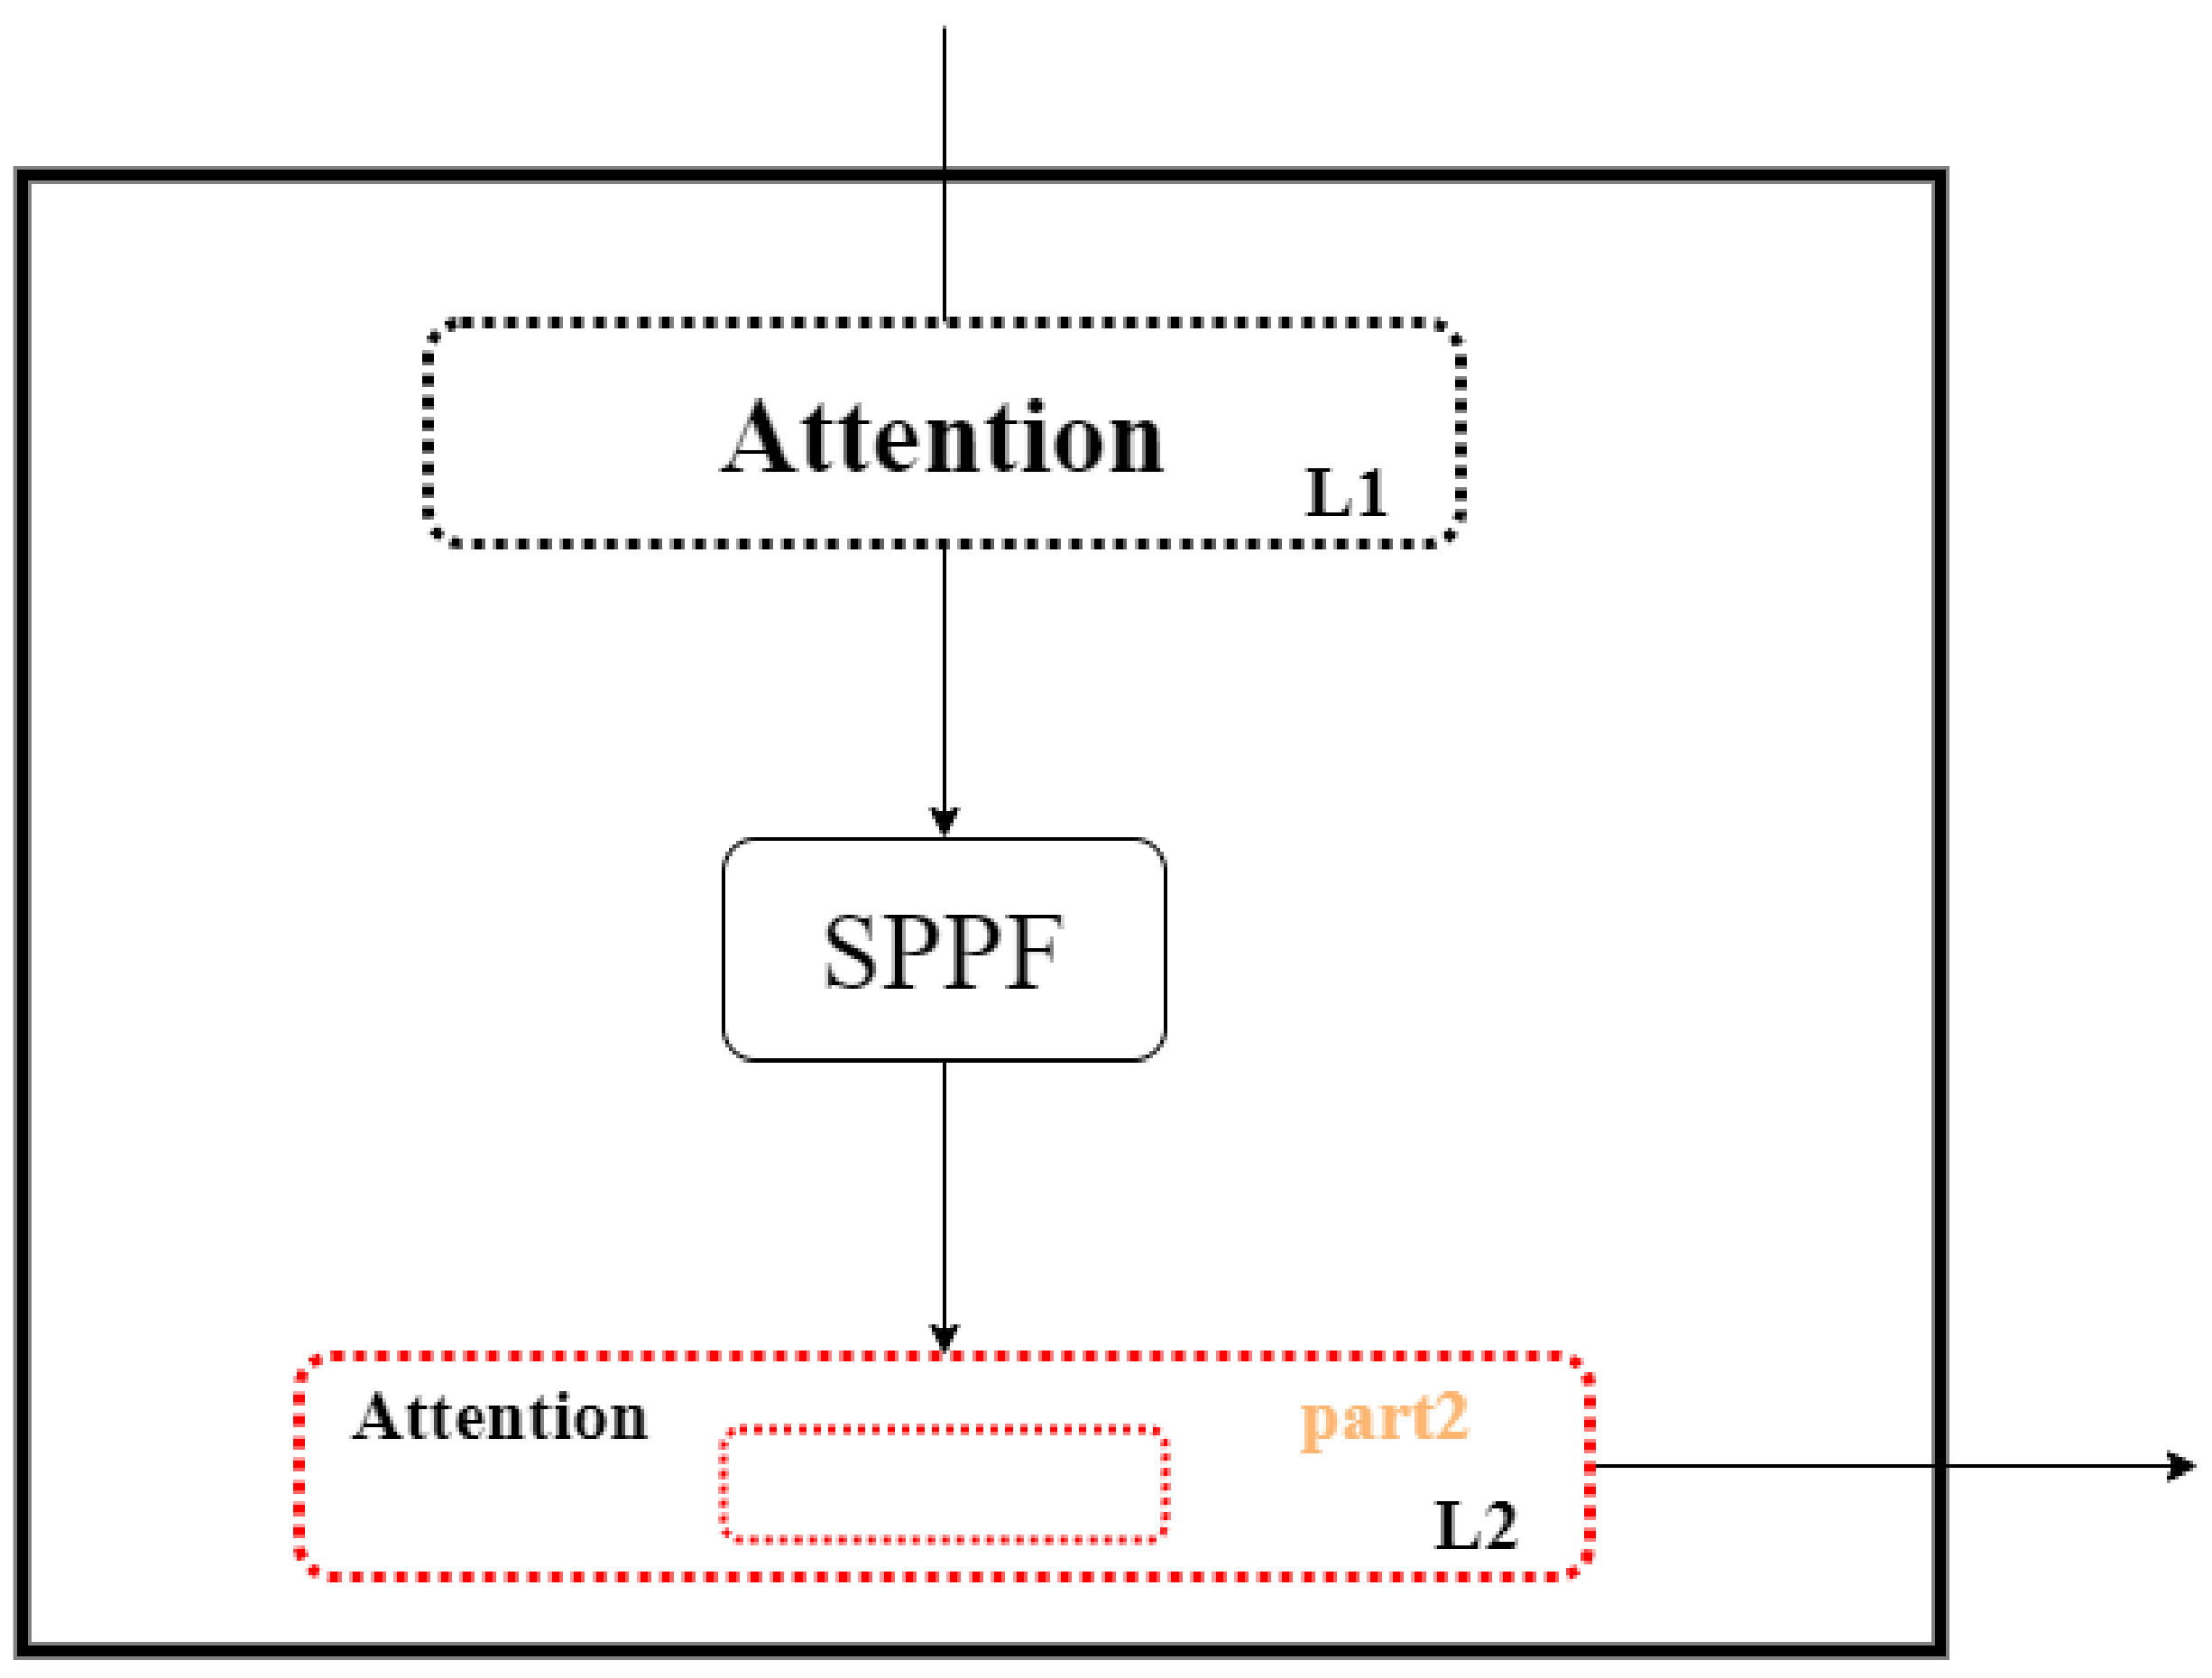
Influence of Attention Module Insertion Location on Model Precision

In Figure 4, the Spatial Pyramid Pooling Layer (SPPF) integrated into the Backbone of the improved YOLOv8 network structure is designed to capture multi-scale information. This is achieved by conducting maximum pooling on the input feature map at various scales. This multi-scale information is crucial for enhancing the model’s object detection performance. The insertion of attention mechanism modules (CBAM, ECA, GAM) either before or after the SPPF module could potentially impact the overall performance of the model. Attention mechanism modules are typically employed to elevate the importance of specific channels or spatial locations within a feature map. This enhancement aids the model in focusing more effectively on relevant information, ultimately improving its overall accuracy in recognizing and detecting objects.
To further validate the influence of the position of the attention module on the accuracy of the model. In this study, an experiment was conducted in which the attention module was inserted after the SPPF module.
The adjustment is illustrated in Figure 7, where the original position represented by the black dashed line (L1) was replaced with the red dashed line (L2) position. This experiment likely aimed to assess how the combination of spatial pyramid pooling and attention mechanism modules interacted and contributed to the model’s detection accuracy. The results of this experiment would provide insights into the optimal arrangement of these components within the YOLOv8-based detection framework.
After repositioning the attention mechanism module, we proceeded to train the YOLOv8s.pt model for 300 iterations using identical experimental conditions, resulting in the YOLOv8s-CBAM-after, YOLOv8s-ECA-after, and YOLOv8s-GAM-after models. The comparison of overall accuracy for the attention modules inserted before and after the SPPF layer is presented in Table 3, with the most favorable values highlighted in bold. Based on the data in Table 3, it is evident that the YOLOv8s-CBAM-After, YOLOv8s-ECA-After, and YOLOv8s-GAM-After models, featuring attention modules inserted after the SPPF layer, exhibited varying degrees of decline in metrics such as mAP50, mAP50-95, F1-Score, and Mean. The mAP50 accuracy experienced a maximum reduction of 3.5%. Notably, the CBAM module model demonstrated a slight improvement of 0.6% in mAP50-95, while the GAM module model exhibited a modest increase of 0.2% in F1-Score. In contrast, the other models displayed a general decline in performance.
We have also generated F1-score and P-R (Precision-Recall) curves for various models with attention modules inserted at different positions. In Figure 8, the F1-Score curves of (a) and (b) illustrate the confidence threshold on the x-axis and the corresponding F1-Score values on the y-axis. It is evident that all improved YOLOv8s models consistently outperform YOLOv5, as they are positioned above it, indicating superior detection performance. Within the improved YOLOv8s models, there is minimal variation in F1-Score values, which remain consistently near 80%. Moving on to Figure 8c,d, we observe that YOLOv8s-CBAM-before, YOLOv8s-ECA-before, and YOLOv8s-GAM-before exhibit broader coverage areas in their P-R curves compared to YOLOv8s-CBAM-after, YOLOv8s-CBAM-after, and YOLOv8s-CBAM-after. This suggests higher mAP values. By referring to the mAP50 and mAP50-95 values in Table 3, it is evident that inserting attention modules before the SPPF layer leads to superior accuracy compared to inserting them after. Specifically, YOLOv8s-GAM-before demonstrates optimal performance in mAP50 and mAP50-95 indicators, as indicated by the largest area enclosed by its P-R coordinate axis. This signifies that YOLOv8s-GAM-before can achieve higher detection accuracy and more balanced performance in pine wilt disease detection tasks, effectively reducing false negatives and false positives.
From our analysis of the ablation experiments involving the insertion of attention modules at different positions within the YOLOv8 network, we have drawn the following conclusions:
(1)
Inserting Attention Modules After the SPPF Network Layer: In this configuration, the SPPF module initially performs multi-scale pooling on the input feature map, followed by the attention module applying weighted processing to the pooled feature map. This approach allows the attention module to effectively adapt to the multi-scale features provided by the SPPF network layer, thereby enhancing the quality of feature representation.
(2)
Inserting Attention Modules Before the SPPF Network Layer: In this mode, the attention mechanism module first applies weighted processing to the input feature map, after which the SPPF module performs multi-scale pooling. This sequence of operations enables the SPPF module to make better use of the weight information provided by the attention module, resulting in the extraction of more distinctive multi-scale features.
For the specific task of pine wilt disease detection, it is evident that models incorporating attention mechanisms before the SPPF layer exhibit superior detection performance. These models demonstrate an ability to adapt to complex detection scenarios and showcase robust generalization capabilities.

4. Discussion

UAV remote sensing technology is widely employed in the pine woodworm disease (PWD) monitoring mission due to its cost-effectiveness, expansive coverage, flexibility, and efficiency. In this study, we utilized an enhanced version of the YOLOv8 algorithm for the automatic identification of diseased trees within pine forests. The algorithm achieved an overall average accuracy score of 76.4%, which largely fulfills the requirements of PWD mission control. Furthermore, we compiled a dataset comprising 1450 UAV images depicting 4909 infected trees. To tackle the issue of limited adaptability and generalization of the existing PWD model for small-target detection, we introduced a small-target detection layer within the Neck module. This augmentation significantly enhanced the model’s performance in detecting small-target diseased pine trees. Additionally, an attention module was incorporated into the Backbone network to intensify focus on feature information within the diseased pine tree images, thereby mitigating issues related to model leakage detection and false positives. Multiple target detection models were trained using the constructed datasets. Notably, our YOLOv8s-GAM model displayed the most impressive detection performance, achieving 81% and 67.2% in mAP50 and mAP50-95 metrics, respectively. We also conducted ablation experiments on the enhanced YOLOv8 framework, revealing that the highest AP50 and AP50-95 metrics of 79.9% and 65.2%, respectively, were obtained by inserting the attention mechanism after the SPPF layer. This result emphasizes the influence of the attention mechanism’s insertion point on detection accuracy. Experimental results demonstrate that our improved YOLOv8s-GAM detection model efficiently and accurately identifies both single and multiple mid to late-stage PWD diseased trees. We further reproduce the previous research work and compare it with the improved MobileNetv2-YOLOv4 (mAP-50: 78.1%, mAP50-95: 66.8%) in reference [43] and the unsupervised method for decision fusion proposed in reference [21] (mAP-50: 74.7%, mAP50-95: 63.2%), which shows a detection accuracy that is significantly improved.
As the progression of PWD infestation in pine trees is dynamic, diseased pine trees exhibit varying appearances and crown colors at different disease stages. Our detection approach relies on identifying pine trees based on crown color and texture characteristics. In the mid-to-late stages of infestation, diseased pine trees exhibit a yellowish-brown or reddish-brown crown color, while early diseased trees do not undergo significant color changes. Our proposed YOLOv8s-GAM model excels in accurately recognizing mid-to-late-stage diseased trees. However, due to the limited information contained in the images captured by the airborne camera in this study (comprising only three bands of visible light and RGB), there is a reduction in accuracy when detecting early-stage PWD-infected wood. Effectively distinguishing between early and mid-to-late-stage diseased wood remains a primary challenge in PWD detection. In addition to visual changes, the spectral characteristics of pine trees alter during infection, exhibiting varying spectral values at different disease stages. Hyperspectral technology, which captures continuous spectral information through multiple narrow electromagnetic bands, can enhance the detection accuracy of early diseased trees by selecting the band that best reflects diseased tree information from hyperspectral images. Reference [44] have demonstrated the effectiveness of the normalized vegetation index (NDVI) and multispectral images in identifying PWD-infected trees and broadleaf classification of coniferous trees. These findings suggest the potential utility of multispectral information in aiding identification. Nonetheless, it is worth noting that multispectral images typically possess lower resolution compared to RGB images. Therefore, combining hyperspectral data with deep learning RGB methods can offer comprehensive detection of diseased pine trees.
This study aims to improve the detection method of pine wood nematode disease (PWD). The proposed pine wood nematode disease detection method is based on a deep learning neural network, which consumes a large amount of computational resources during the training process and the application cost increases accordingly. Our proposed method also faces limitations arising from insufficient data volume and suboptimal data quality. Furthermore, its generalization capacity remains inadequate when detecting PWD in regions characterized by indistinct image features, resemblances in ground attributes, and abrupt changes in terrain slope. In future research, we intend to harness multi-source, high-precision drone remote sensing data, expand the sample size, and devise advanced detectors to bolster both detection performance and generalization capabilities. This strategic evolution aims to provide enhanced technical support for forest conservation efforts.

5. Conclusions

To address the critical task of carbon sequestration and ecological environment preservation, our approach combines drone remote sensing images with deep learning techniques for the detection and identification of pine wilt disease (PWD). In response to the challenges associated with existing methodologies, such as missed and false detections, as well as low accuracy, we introduce an enhanced YOLOv8 detection framework tailored specifically for PWD detection. The main findings of this study are as follows:
  • This paper demonstrates the efficacy of attention mechanisms. All three attention mechanisms, namely the Convolutional Block Attention Module (CBAM), Efficient Channel Attention (ECA), and Global Attention Module (GAM), exhibit improvements in detection accuracy. Particularly, the GAM model stands out with the most significant accuracy enhancement, achieving a 4.5% improvement. Consequently, the GAM model emerges as the optimal choice, boasting an average accuracy of 76.4% on the test set.
  • In this paper, we enhance model recognition accuracy by introducing a small target detection layer and an attention mechanism. First, this approach mitigates the influence of irrelevant features on model recognition to some extent. Second, the attention mechanism augments the model’s ability to select relevant features for identifying infected wood. Additionally, it leads to a reduction in the model file size, facilitating its applicability on resource-constrained devices.
  • The proposed PWD framework in this study enables rapid monitoring of extensive areas. The data acquisition equipment employed, specifically the UAV and camera, offers a cost-effective solution. Furthermore, the trained network model, no longer necessitating expertise in computer science and forestry, holds the potential for replication in PWD monitoring tasks across various study areas.

Author Contributions

Conceptualization, M.W. and H.Z.; methodology, X.C. and S.W.; software, X.C., S.W. and H.J.; validation, X.C., S.W. and Z.Z.; formal analysis, X.C., S.W. and C.Y.; data curation, H.F., Y.J., X.Z. (Xianfeng Zhao), X.Z. (Xiaojing Zhao) and P.Y.; writing—original draft preparation, X.C. and S.W.; writing—review and editing, H.Z. and M.W.; visualization, X.C. and S.W.; project administration, M.W.; funding acquisition, M.W. All authors have read and agreed to the published version of the manuscript.

Funding

This work was supported by the National Natural Science Foundation of China (42071385); the National Science and Technology Major Project of High Resolution Earth Observation System (79-Y50-G18-9001-22/23); the Yantai science and technology innovation development plan project (2022MSGY062); the Open Project Program of Shandong Marine Aerospace Equipment Technological Innovation Center; Ludong University (HHCXZX-2021-12) and the Shandong Science and Technology SMEs Technology Innovation Capacity Enhancement Project (2022TSGC2371); Yantai Science and Technology Development Project (2022MSGY057).

Data Availability Statement

Data sharing is not applicable to this article.

Acknowledgments

The authors thank the anonymous reviewers very much for their valuable comments, which greatly improved this paper.

Conflicts of Interest

The authors declare no conflict of interest.

Appendix A

This is the appendix of the paper “Detection of Pine Wilt Disease Using Drone Remote Sensing Imagery and Improved YOLOv8 Algorithm: A Case Study in Weihai, China”. It includes a more comprehensive explanation of the results of PWD visualization in Section 3.2. Figure A1 shows the visualization of the feature maps and the detection results for different models.
Figure A1. More visualization examples of detection results. From top to bottom, the visualization results of five models are as follows: YOLOv8s, YOLOv8s-Small, YOLOv8s-CBAM, YOLOv8s-ECA, and YOLOv8s-GAM. The first column displays the detection results, while the second, third, and fourth columns present feature map visualizations with different numbers of layers.
Forests 14 02052 g0a1aForests 14 02052 g0a1bForests 14 02052 g0a1c

References

  1. Wu, D.; Yu, L.; Yu, R.; Zhou, Q.; Li, J.; Zhang, X.; Ren, L.; Luo, Y. Detection of the Monitoring Window for Pine Wilt Disease Using Multi-Temporal UAV-Based Multispectral Imagery and Machine Learning Algorithms. Remote Sens. 2023, 15, 444. [Google Scholar] [CrossRef]
  2. Cai, P.; Chen, G.; Yang, H.; Li, X.; Zhu, K.; Wang, T.; Liao, P.; Han, M.; Gong, Y.; Wang, Q.; et al. Detecting Individual Plants Infected with Pine Wilt Disease Using Drones and Satellite Imagery: A Case Study in Xianning, China. Remote Sens. 2023, 15, 2671. [Google Scholar] [CrossRef]
  3. You, J.; Zhang, R.; Lee, J. A Deep Learning-Based Generalized System for Detecting Pine Wilt Disease Using RGB-Based UAV Images. Remote Sens. 2022, 14, 150. [Google Scholar] [CrossRef]
  4. Syifa, M.; Park, S.J.; Lee, C.W. Detection of the Pine Wilt Disease Tree Candidates for Drone Remote Sensing Using Artificial Intelligence Techniques. Engineering 2020, 6, 919–926. [Google Scholar] [CrossRef]
  5. Yu, R.; Luo, Y.; Zhou, Q.; Zhang, X.; Wu, D.; Ren, L. A Machine Learning Algorithm to Detect Pine Wilt Disease Using UAV-Based Hyperspectral Imagery and LiDAR Data at the Tree Level. Int. J. Appl. Earth Obs. Geoinf. 2021, 101, 102363. [Google Scholar] [CrossRef]
  6. Zhou, H.; Yuan, X.; Zhou, H.; Shen, H.; Ma, L.; Sun, L.; Fang, G.; Sun, H. Surveillance of Pine Wilt Disease by High Resolution Satellite. J. For. Res. 2022, 33, 1401–1408. [Google Scholar] [CrossRef]
  7. Prefecture, H. Assessment of Pine Forest Damage by Blight Based on Landsat TM Data and Correlation with Environmental Factors. Ecol. Res. 1992, 7, 9–18. [Google Scholar]
  8. Dennison, P.E.; Brunelle, A.R.; Carter, V.A. Assessing Canopy Mortality during a Mountain Pine Beetle Outbreak Using GeoEye-1 High Spatial Resolution Satellite Data. Remote Sens. Environ. 2010, 114, 2431–2435. [Google Scholar] [CrossRef]
  9. Park, J.; Sim, W.; Lee, J. Detection of Trees with Pine Wilt Disease Using Object-Based Classification Method. J. For. Environ. Sci. 2016, 32, 384–391. [Google Scholar] [CrossRef]
  10. Johnson, B.A.; Tateishi, R.; Hoan, N.T. A Hybrid Pansharpening Approach and Multiscale Object-Based Image Analysis for Mapping Diseased Pine and Oak Trees. Int. J. Remote Sens. 2013, 34, 6969–6982. [Google Scholar] [CrossRef]
  11. Arantes, B.H.T.; Moraes, V.H.; Geraldine, A.M.; Alves, T.M.; Albert, A.M.; da Silva, G.J.; Castoldi, G. Spectral Detection of Nematodes in Soybean at Flowering Growth Stage Using Unmanned Aerial Vehicles. Cienc. Rural 2021, 51, e20200283. [Google Scholar] [CrossRef]
  12. Wu, H. A Study of the Potential of Using Worldview-2 of Images for the Detection of Red Attack Pine Tree. In Eighth International Conference on Digital Image Processing (ICDIP 2016); SPIE: Bellingham, DC, USA, 2016; Volume 10033, pp. 1–5. [Google Scholar] [CrossRef]
  13. Hellesen, T.; Matikainen, L. An Object-Based Approach for Mapping Shrub and Tree Cover on Grassland Habitats by Use of LiDAR and CIR Orthoimages. Remote Sens. 2013, 5, 558–583. [Google Scholar] [CrossRef]
  14. Shi, Y.; Skidmore, A.K.; Wang, T.; Holzwarth, S.; Heiden, U.; Pinnel, N.; Zhu, X.; Heurich, M. Tree Species Classification Using Plant Functional Traits from LiDAR and Hyperspectral Data. Int. J. Appl. Earth Obs. Geoinf. 2018, 73, 207–219. [Google Scholar] [CrossRef]
  15. Guillen-Climent, M.L.; Zarco-Tejada, P.J.; Berni, J.A.J.; North, P.R.J.; Villalobos, F.J. Mapping Radiation Interception in Row-Structured Orchards Using 3D Simulation and High-Resolution Airborne Imagery Acquired from a UAV. Precis. Agric. 2012, 13, 473–500. [Google Scholar] [CrossRef]
  16. Zhang, C.; Kovacs, J.M. The Application of Small Unmanned Aerial Systems for Precision Agriculture: A Review. Precis. Agric. 2012, 13, 693–712. [Google Scholar] [CrossRef]
  17. Park, Y.S.; Chung, Y.J.; Moon, Y.S. Hazard Ratings of Pine Forests to a Pine Wilt Disease at Two Spatial Scales (Individual Trees and Stands) Using Self-Organizing Map and Random Forest. Ecol. Inform. 2013, 13, 40–46. [Google Scholar] [CrossRef]
  18. Sun, Z.; Wang, Y.; Pan, L.; Xie, Y.; Zhang, B.; Liang, R.; Sun, Y. Pine Wilt Disease Detection in High-Resolution UAV Images Using Object-Oriented Classification. J. For. Res. 2022, 33, 1377–1389. [Google Scholar] [CrossRef]
  19. Natesan, S.; Armenakis, C.; Vepakomma, U. Resnet-Based Tree Species Classification Using Uav Images. Int. Arch. Photogramm. Remote Sens. Spat. Inf. Sci. 2019, 42, 475–481. [Google Scholar] [CrossRef]
  20. Pouyanfar, S.; Sadiq, S.; Yan, Y.; Tian, H.; Tao, Y.; Reyes, M.P.; Shyu, M.; Chen, S.; Iyengar, S.S. A Survey on Deep Learning: Algorithms, Techniques, and Applications. ACM Comput. Surv. 2018, 51, 5. [Google Scholar] [CrossRef]
  21. Qin, J.; Wang, B.; Wu, Y.; Lu, Q.; Zhu, H. Identifying Pine Wood Nematode Disease Using Uav Images and Deep Learning Algorithms. Remote Sens. 2021, 13, 162. [Google Scholar] [CrossRef]
  22. Girshick, R. Fast R-CNN. In Proceedings of the 2015 IEEE International Conference on Computer Vision (ICCV), Santiago, Chile, 7–13 December 2015; pp. 1440–1448. [Google Scholar] [CrossRef]
  23. Ren, S.; He, K.; Girshick, R.; Sun, J. Faster R-CNN: Towards Real-Time Object Detection with Region Proposal Networks. IEEE Trans. Pattern Anal. Mach. Intell. 2017, 39, 1137–1149. [Google Scholar] [CrossRef] [PubMed]
  24. He, K.; Zhang, X.; Ren, S.; Sun, J. Spatial Pyramid Pooling in Deep Convolutional Networks for Visual Recognition. IEEE Trans. Pattern Anal. Mach. Intell. 2015, 37, 1904–1916. [Google Scholar] [CrossRef]
  25. Dai, J.; Li, Y.; He, K.; Sun, J. R-FCN: Object Detection via Region-Based Fully Convolutional Networks. In Proceedings of the Advances in Neural Information Processing Systems, Barcelona, Spain, 5–10 December 2016; pp. 379–387. [Google Scholar]
  26. Redmon, J.; Divvala, S.; Girshick, R.; Farhadi, A. You Only Look Once: Unified, Real-Time Object Detection. In Proceedings of the 2016 IEEE Conference on Computer Vision and Pattern Recognition (CVPR), Las Vegas, NV, USA, 26 June–1 July 2016; pp. 779–788. [Google Scholar]
  27. Liu, W.; Anguelov, D.; Erhan, D.; Szegedy, C.; Reed, S.; Fu, C.Y.; Berg, A.C. SSD: Single Shot Multibox Detector. In Proceedings of the Computer Vision–ECCV 2016: 14th European Conference, Amsterdam, The Netherlands, 11–14 October 2016; Volume 9905 LNCS, pp. 21–37. [Google Scholar]
  28. Deng, X.; Tong, Z.; Lan, Y.; Huang, Z. Detection and Location of Dead Trees with Pine Wilt Disease Based on Deep Learning and UAV Remote Sensing. AgriEngineering 2020, 2, 294–307. [Google Scholar] [CrossRef]
  29. Wu, B.; Liang, A.; Zhang, H.; Zhu, T.; Zou, Z.; Yang, D.; Tang, W.; Li, J.; Su, J. Application of Conventional UAV-Based High-Throughput Object Detection to the Early Diagnosis of Pine Wilt Disease by Deep Learning. For. Ecol. Manag. 2021, 486, 118986. [Google Scholar] [CrossRef]
  30. Yu, R.; Ren, L.; Luo, Y. Early Detection of Pine Wilt Disease in Pinus Tabuliformis in North China Using a Field Portable Spectrometer and UAV-Based Hyperspectral Imagery. For. Ecosyst. 2021, 8, 44. [Google Scholar] [CrossRef]
  31. Vaswani, A.; Shazeer, N.; Parmar, N.; Uszkoreit, J.; Jones, L.; Gomez, A.N.; Kaiser, Ł.; Polosukhin, I. Attention Is All You Need. In Proceedings of the Advances in Neural Information Processing Systems, Long Beach, CA, USA, 4–9 December 2017; Volume 2017-Decem, pp. 5999–6009. [Google Scholar]
  32. Carrasco, M. Visual Attention: The Past 25 Years. Vis. Res. 2011, 51, 1484–1525. [Google Scholar] [CrossRef]
  33. Wang, P.; Niu, T.; He, D. Tomato Young Fruits Detection Method under near Color Background Based on Improved Faster R-Cnn with Attention Mechanism. Agriculture 2021, 11, 1059. [Google Scholar] [CrossRef]
  34. Chen, Z.; Wu, R.; Lin, Y.; Li, C.; Chen, S.; Yuan, Z.; Chen, S.; Zou, X. Plant Disease Recognition Model Based on Improved YOLOv5. Agronomy 2022, 12, 365. [Google Scholar] [CrossRef]
  35. Woo, S.; Park, J.; Lee, J.; Kweon, I.S. CBAM: Convolutional Block Attention Module. In Proceedings of the European Conference on Computer Vision, Munich, Germany, 8–14 September 2018; pp. 3–19. [Google Scholar]
  36. Liu, Y.; Shao, Z.; Hoffmann, N. Global Attention Mechanism: Retain Information to Enhance Channel-Spatial Interactions. arXiv 2021, arXiv:2112.05561. [Google Scholar]
  37. Wang, Q.; Wu, B.; Zhu, P.; Li, P.; Zuo, W.; Hu, Q. ECA-Net: Efficient Channel Attention for Deep Convolutional Neural Networks. In Proceedings of the IEEE Computer Society Conference on Computer Vision and Pattern Recognition, Seattle, WA, USA, 13–19 June 2020; pp. 11531–11539. [Google Scholar]
  38. Zhu, C.; Chen, F.; Ahmed, U.; Shen, Z.; Savvides, M. Semantic Relation Reasoning for Shot-Stable Few-Shot Object Detection. In Proceedings of the IEEE Computer Society Conference on Computer Vision and Pattern Recognition, Nashville, TN, USA, 20–25 June 2021; pp. 8778–8787. [Google Scholar]
  39. Lin, Q.; Guo, J.; Yan, J.; Heng, W. Land Use and Landscape Pattern Changes of Weihai, China Based on Object-Oriented SVM Classification from Landsat MSS/TM/OLI Images. Eur. J. Remote Sens. 2018, 51, 1036–1048. [Google Scholar] [CrossRef]
  40. Bao, Y.; Han, A.; Zhang, J.; Liu, X.; Tong, Z.; Bao, Y. Contribution of the Synergistic Interaction between Topography and Climate Variables to Pine Caterpillar (Dendrolimus Spp.) Outbreaks in Shandong Province, China. Agric. For. Meteorol. 2022, 322, 109023. [Google Scholar] [CrossRef]
  41. Fraser, B.T.; Congalton, R.G. Issues in Unmanned Aerial Systems (UAS) Data Collection of Complex Forest Environments. Remote Sens. 2018, 10, 908. [Google Scholar] [CrossRef]
  42. Daniels, L.; Eeckhout, E.; Wieme, J.; Dejaegher, Y.; Audenaert, K.; Maes, W.H. Identifying the Optimal Radiometric Calibration Method for UAV-Based Multispectral Imaging. Remote Sens. 2023, 15, 2909. [Google Scholar] [CrossRef]
  43. Sun, Z.; Ibrayim, M.; Hamdulla, A. Detection of Pine Wilt Nematode from Drone Images Using UAV. Sensors 2022, 22, 4704. [Google Scholar] [CrossRef] [PubMed]
  44. Abdollahnejad, A.; Panagiotidis, D. Tree Species Classification and Health Status Assessment for a Mixed Broadleaf-Conifer Forest with Uas Multispectral Imaging. Remote Sens. 2020, 12, 3722. [Google Scholar] [CrossRef]
Figure 1. An overall overview of our method. It is divided into four parts: data acquisition, dataset generation, recognition model construction, and result visualization.
Forests 14 02052 g001
Figure 2. Overview of the study area for this study. The study area is located in Weihai City, Shandong Province, China. (ac) are the UAV orthophoto maps of the study area, where areas (a,b) are the training areas and (c) is the test area.
Forests 14 02052 g002
Figure 3. Partial presentation of the dataset. The first row is a multi-object annotation and the second row is a single-object annotation. Red bounding boxes indicate labeled diseased pine trees.
Forests 14 02052 g003
Figure 4. The overall network structure of the improved YOLOv8 is divided into four parts: the input module, the backbone network, the Neck module, and the output module. The CBS module is a convolutional layer for feature extraction and fusion of the input image. The SPPF module is a spatial pyramid fast pooling layer for the adaptive output of the input feature maps. The C2f module fuses feature maps at different levels to improve target detection accuracy and efficiency.
Forests 14 02052 g004
Figure 5. Schematic diagram of the three attention mechanism modules. (a) is the CBAM module, which extracts features through spatial attention and channel attention. (b) is the ECA module, which uses a local cross-channel interaction strategy to improve detection performance. (c) is the GAM module, which improves network performance by reducing information dispersion and amplifying the global interaction representation.
Forests 14 02052 g005
Figure 6. Detection examples and feature map extraction. The four examples (ad) have the same structure, and from top to bottom are the detection results and different stages feature maps of YOLOv8, YOLOv8-Small, YOLOv8-CBAM, YOLOv8-ECA, and YOLOv8-GAM, respectively. The blue color in the detection plots is the labeled box and the red color is the detection box.
Forests 14 02052 g006
Figure 7. Location of inserting attention mechanism module.
Forests 14 02052 g007
Figure 8. F1-score and P-R curves for different positions of the attention module. (a) is the F1-score curve before SPPF layer, (b) is the F1-score curve after SPPF layer, (c) is the P-R curve before SPPF layer, and (d) is the P-R curve after SPPF layer.
Forests 14 02052 g008
Table 1. UAV and airborne camera parameters.
UAV & CameraParameterValue
Forests 14 02052 i001Maximum take-off mass/g6500
UAV wingspan/m1.9
Maximum flight altitude/m3000
Maximum flight speed/(km·h−1)64.8
Max flight time/min90
Forests 14 02052 i002Dimensions (L × W × H)/mm126.9 × 95.7 × 60.3
Effective pixels/mp42.4
Continuous speed/s5 frames
Image SensorExmorRCMOS
Photo formatJPEG
Table 3. Performance comparison of different positional attention modules.
ModelsEvaluation Metrics
mAP-50mAP50-95F1-ScoreMean
YOLOv8s-CBAM-before80.764.681.675.6
YOLOv8s-CBAM-after79.865.280.475.1
YOLOv8s-ECA-before81.065.182.376.1
YOLOv8s-ECA-after79.963.581.574.9
YOLOv8s-GAM-before81.067.280.976.4
YOLOv8s-GAM-after77.561.681.173.4
Disclaimer/Publisher’s Note: The statements, opinions and data contained in all publications are solely those of the individual author(s) and contributor(s) and not of MDPI and/or the editor(s). MDPI and/or the editor(s) disclaim responsibility for any injury to people or property resulting from any ideas, methods, instructions or products referred to in the content.

