
Response Mechanism of Annual Streamflow Decline to Vegetation Growth and Climate Change in the Han River Basin, China
1
School of Hydraulic and Environmental Engineering, Changsha University of Science & Technology, Changsha 410114, China
2
Key Laboratory of Dongting Lake Aquatic Eco-Environmental Control and Restoration of Hunan Province, Changsha 410114, China
3
Department of History & Geography, East Stroudsburg University, East Stroudsburg, PA 18301, USA
*
Author to whom correspondence should be addressed.
Forests 2023, 14(11), 2132; https://doi.org/10.3390/f14112132
Submission received: 4 September 2023
/
Revised: 22 October 2023
/
Accepted: 23 October 2023
/
Published: 26 October 2023
(This article belongs to the Special Issue Modeling and Remote Sensing of Forests Ecosystem)
Abstract
:Vegetation changes have a significant impact on the underlying surface of a watershed and alter hydrological processes. To clarify the synergistic evolution relationship between climate, vegetation, and hydrology, this study aims to reveal how vegetation restoration influences streamflow decline. This study first applied the trend-free pre-whitening Mann–Kendall (TFPW-MK) method to identify variation trends of various elements at Baihe and Shayang hydrologic stations from 1982 to 2015. Secondly, an extended Budyko equation was improved by fitting the linear relationship between annual NDVI and Budyko parameter (ω). Finally, based on the extended Budyko formula, the elastic coefficient method was applied to identify the influence of vegetation changes on runoff changes of the Baihe and Shayang stations from 1982 to 2015. The results displayed that (1) the annual NDVI of Baihe and Shayang hydrologic stations both presented an increasing trend, and streamflow presented an insignificant decrease trend. The mutation year of the annual runoff depth of Baihe and Shayang stations both occurred in 1990. (2) The annual NDVI had a significant and positive linear relationship with ω. (3) The streamflow decline of Baihe and Shayang stations is mainly influenced by precipitation variation and human activities. (4) Vegetation growth had a positive effect on the streamflow decline of Baihe and Shayang stations, with a contribution rate of 14.06% and 17.87%. This effect of vegetation growth on discharge attenuation should be given high priority.
1. Introduction
The water cycle, as a key link connecting the ocean, land, and atmosphere, has significant implications for global climate and natural environment changes. Climatic and anthropogenic factors are two main factors that affect the water cycle, including precipitation, runoff, evaporation, and land use change [1,2,3]. Climate change directly affects hydrological cycle elements such as temperature, leading to terrestrial hydrological system change. Human activities have significantly affected runoff by altering the underlying surface conditions and canopy interception and evapotranspiration of the basin through many methods, such as off-river water intake, hydraulic engineering construction, and urban expansion [4,5,6]. By reason of the combined impact of climatic and anthropogenic factors, the hydrological cycle of the basin has undergone significant changes, resulting in frequent occurrence of extreme events such as extreme droughts and floods [7,8,9,10], posing serious challenges to water resource management, ecosystem balance in river basins, and agricultural irrigation and production [11,12,13]. Therefore, quantitative analysis of the effect of different factors on discharge variation is profit to clarify the evolution trend of watershed runoff, guiding managers to make correct decisions, and providing an important theoretical foundation for achieving water resource security and sustainable utilization.
Hanjiang River Basin (HJR) is a first-order tributary of the Yangtze River Basin. The upstream HJR is one of the water sources for China’s South–North Water Transfer Central Project, and midstream and downstream HJR are one of China’s major grain and cotton production bases. Because of the remarkable growth of water consumption by anthropic factors and the influence of global warming, the discharge of HJR was significantly reduced. Therefore, the analysis of the variation patterns and drivers of streamflow attenuation in HJR has become a hot research topic for scholars [14]. Du et al. [15] carried out the evolution law and driver of hydrological elements in the upper reaches of the HJR by mathematical statistical tests and hydrological modeling methods. Results indicated that there was a downward trend in precipitation and streamflow, with a sudden change year in 1990. Average annual runoff from 1991 to 2016 decreased by 8.12 billion cubic meters compared to 1962 to 1990, with approximately 43.2% affected by climate change and 56.8% affected by human activities. Zou et al. [16] explored the effect of precipitation changes and anthropic factors on runoff by the double cumulative curve method. Results indicated that the effect of anthropic factors on the reduction of runoff in HJR gradually increased during the research period. During the research period, the influence of human factors on streamflow attenuation in Shiquan station and Xiantao station increased by 18.56% and 11.15% in Phase III (2003–2018) compared to Phase II (1991–2002), respectively.
In order to protect and expand forests, reduce land desertification, and prevent soil erosion, the Chinese government has vigorously implemented key projects such as “returning farmland to forests and grasslands” and the “Three–North Shelterbelt Program”. From 2000 to 2017, the vegetation leaf area index increased significantly, accounting for 25% of the global net increase in leaf area. The implementation of a series of ecological restoration measures has caused rapid changes in vegetation in the Han River Basin. Zhan et al. [17] analyzed the characteristics and driving forces of vegetation change in midstream and downstream of HJR from 2001 to 2015. NDVI displayed a growth trend, and anthropic factors had a facilitating impact on vegetation recovery. Vegetation changes have altered hydrological processes such as precipitation interception, evapotranspiration, and soil infiltration, and have had a significant impact on watershed water cycle and runoff. The implementation of a series of ecological restoration measures in the HJR has a significant impact on its precipitation–runoff relationship. In recent years, some scholars have begun to analyze the impact of vegetation change on the HJR. Peng et al. [18] found that changes in the underlying surface are the main driver contributing to streamflow attenuation of HJR, and vegetation change is an important reason for the overall decrease in runoff of HJR. However, previous studies have mostly qualitatively analyzed the positive or negative impact of vegetation changes on runoff in the HJR, few researchers quantitatively assessed the contribution of vegetation growth on streamflow attenuation.
As a consequence, this paper aims to reveal how vegetation restoration influences streamflow variation by following contents: (1) identifying the changing characteristics of meteorological, hydrological, and annual NDVI data of HJR; (2) constructing a corrected Budyko equation; and (3) quantifying the impact of vegetation growth on discharge attenuation in HJR by corrected Budyko equation and elasticity analysis methods. This study helps to clarify vegetation spatiotemporal characteristics of HJR and its influence on runoff changes, which is instrumental in sustainable economic development and ecological environment protection of HJR.
2. Research Area and Data
Hanjiang River originates from the southern foothills of the Qinling Mountains. The entire area of the HJR is 1577 km, with a watershed area of 15.3 × 10⁴ km2, with the range of 106°11′–114°14′ E and 30°08′–34°20′ N. The mainstream of the Hanjiang River runs from east to west, passing between the Qinling Mountains and Daba Mountains, and the river gradient is large. The mountainous area within the watershed accounts for approximately 70% of the total watershed area. The average annual runoff of the entire Hanjiang River basin is 57.7 billion m3. The streamflow supply of the Hanjiang River mainly comes from atmospheric precipitation, and the distribution of surface water resources is basically consistent with the distribution of precipitation.
HJR belongs to the East Asian subtropical monsoon climate region, and its climate has obvious seasonal characteristics. The vegetation types in the watershed are mainly subtropical evergreen broad-leaved forest, evergreen broad-leaved forest, and deciduous broad-leaved mixed forest, with high vegetation coverage. The precipitation in the basin is mainly influenced by the warm and humid air currents in the southeast and southwest. The distribution of precipitation in the basin is uneven within the year, with an average annual precipitation of 873 mm, an average annual temperature of 12.0–16.0 °C, an extreme maximum temperature of 42.7 °C, and an extreme minimum temperature of −17.6 °C. The average wind speed for many years is between 1.0–3.0 m/s.
There are 14 major reservoirs built in the main stream of the Hanjiang River, including Danjiangkou, Shiquan, Ankang, etc. There are six major large reservoirs built in the tributaries, including Linhekou and Doulingzi. Key water diversion projects in the basin include the Water Diversion from the Han to Wei River Project, the Qingquangou Water Diversion Project, and the Water Diversion from the Yangtze River to Hanjiang River Project [19,20,21].
In this paper, Baihe and Shayang hydrological station of HJR are selected for this study. The discharge data of Baihe hydrological station and Shayang hydrological station from 1982 to 2015 are selected from the China Hydrological Yearbook and Yangtze River Water Resources Commission. Meteorological station data from 1982 to 2015 are downloaded from the China Meteorological Administration, and these stations’ potential evaporation can be computed by the Penman–Monteith equation. Annual NDVI (1982–2015) data are drawn from the GIMMS NDVI3g V1.0 dataset by the method of calculating the average value, and the spatial resolution of NDVI data is 0.05 degrees. Annual NDVI (1982–2015) data are drawn from the GIMMS NDVI3g V1.0 dataset by the method of calculating the average value. We use the tool “Zonal Statistics as Table” in ARCGIS to calculate the average value.
3. Methodology
3.1. Trend-Free Pre-Whitening Mann–Kendall Method
The Mann–Kendall (MK) trend test is a nonparametric rank test method, which does not require the original data to obey a normal distribution, nor is it affected by a few outliers and missing data, and is widely used in the field of hydrological statistics [22,23]. However, the non-parametric rank test method requires the original sequence to be independent, and if the original sequence has autocorrelation, it will significantly amplify the trend of the sequence. In this paper, we use the trend-free pre-whitening (TFPW) MK method to preprocess the original data series. TFPW-MK trend testing method is a pre-removal type MK trend testing method proposed for the autocorrelation problem of the sequence to be tested [24]. Through the trend-free pre-whitening method, we eliminate the influence of dominant trends on the estimation of autocorrelation coefficients in the original data series, and can effectively reduce the impact of autocorrelation on the test results in the sequence and avoid distortion of the test results [25]. Therefore, in this paper, we made use of the TFPW-MK trend test method to identify the variation trend characteristics of runoff depth (R), precipitation (Pre), potential evapotranspiration (ET0) and NDVI.
3.2. Mutational Analysis Methods
The Pettitt catastrophe test is a nonparametric catastrophe point detection method, which is simple in calculation and less affected by outliers and is widely used in the catastrophe analysis of hydrometeorological elements. The specific calculation process can be found in reference [26]. The Pettitt catastrophe test method defines the statistic to obtain the most significant possible mutation point and uses the statistic to determine whether the mutation point meets the given significance level. p < 0.05 indicates statistically significant.
Among them, Ut is the statistical variable of the sample time series data, and N is the number of sample sequences.
The accumulated deviation value mutation test approach is an intuitive curve judgment approach. The cumulative deviation curve of the variables is plotted with time as the horizontal coordinate for determining the continuous evolution characteristics of time series data, and the extreme point of the curve corresponds to the time when the sudden change occurs. The advantages of this method are not only the ease of calculation, but also the clarity of the time when the mutation occurs.
3.3. Extended Budyko Equation
There are a great many methods that can identify the effect of different factors on discharge variation, such as hydrological modeling [27], statistical analysis [28], and elasticity coefficient based on the Budyko hypothesis [29,30]. (1) The hydrological modeling method has high analysis accuracy and strong physical mechanism, which can simulate the hydrological process of precipitation, evapotranspiration, runoff and other factors. However, the calibration of model parameters is difficult and highly influenced by subjective factors of human beings, which increases the uncertainty of the results. Wen et al. [31] made use of the SWAT model to identify the effect of different factors on runoff variation of the Jinghe River and found that anthropogenic factors were major drivers influencing streamflow attenuation. (2) The statistical analysis method mainly conducts attribution analysis of streamflow variation by analyzing the correlation and trend characteristics of long-term series hydro-meteorological data, including comparative method of the slope changing ratio of cumulative quantity (SCRCQ), etc. Wang et al. [32] decoupled the influence of precipitation, evapotranspiration, and anthropogenic factors on discharge variation in Songhua by SCRCQ. (3) The Budyko method is easier to obtain input data and simpler calculation than hydrological modeling [33] and has become a commonly used method for scholars to study the driver of long-term runoff changes [34,35,36,37]. Through the derivation and derivation of a series of equations, the attribution of watershed runoff is quantitatively calculated. Zhao et al. [38] explored the driving factors of runoff in the middle reaches of the Yellow River by Budyko hydrothermal coupling equilibrium model. Except for the Beiluo River and Yanhe River, the main driver for streamflow changes was human activities.
R is runoff depth and Pre is precipitation. In light of this theory of Budyko, there is a functional relationship between the actual evaporation (ET) and drought index (AI = ET0/Pre) at the multi-year scale of the basin.
ET0 is potential evaporation. There are many equations for , and Fu’s equation based on the Budyko framework is Equation (4) [39].
where ω is a variable that characterizes watershed property information and represents the impact of environmental changes such as climate, topography, vegetation type, and soil on the Budyko curve in the watershed, reflecting the macroscopic manifestation of the micro-interaction between various environmental factors. The soil properties will undergo corresponding changes with the restoration of vegetation. The topography undergoes corresponding changes with the impact of the erosion process, such as gully head retrogressive erosion, erosion gully undercutting, etc. However, changes in land use and surface cover conditions have a much greater impact on hydrological processes than soil properties and topography. In particular, with the implementation of the large-scale conversion of farmland to forest and grass project in 1999, vegetation coverage became the most critical factor for underlying surface conditions and significantly affected the hydrological process of the watershed.
Therefore, vegetation as the most critical factor for underlying surface conditions has been introduced into the interpretation of water and heat coupling control parameters in many studies in recent years. Li et al. [40] found that the underlying surface parameters (ω) in Budyko’s hypothesis have a linear relationship with NDVI.
ω = a*NDVI + b
a and b are constants for a given basin and need to be computed, and the constant (a) characterizes the sensitivity degree of ω to vegetation changes.
Combining Equations (7) and (8), Equation (9) describing the relationship between runoff depth and climate and vegetation indices is obtained, so the influence of vegetation growth on discharge attenuation of the HJR can be estimated quantitatively from NDVI data obtained by remote sensing.
3.4. Elasticity Coefficient Method
The elasticity coefficients of runoff depth (R) to ET0, Pre, and NDVI can be calculated.
where , , and can be obtained by partial differentiation of Equation (9), respectively.
where , , and represent the changes in runoff depth due to changes in the ET0, Pre, NDVI and underlying surface parameters, respectively. , , and represent the elastic coefficient of streamflow to ET0, Pre, NDVI and ω.
, , and represent the contribution rates of ET0, Pre, NDVI and anthropic factors on runoff.
4. Results and Analysis
4.1. Trend Analysis
In this paper, we made use of the TFPW-MK trend test method to identify the variation trend characteristics of runoff depth (R), precipitation (Pre), potential evapotranspiration (ET0) and NDVI at the Baihe and Shayang hydrological stations (Table 1). The significance test of the TFPW-MK method needs to be judged based on the z value. If the absolute value of z is greater than 1.96 and less than 2.576, it indicates that the results are significant at the 0.05 level. If the absolute value of z is greater than 2.576, it indicates that the result is significant at the 0.01 level.
For Baihe hydrological station, the Z value of R from 1982 to 2015 was −0.697, which indicated that the annual R at Baihe hydrological station showed an insignificant downward trend overall. The z value of Pre and ET0 at Baihe hydrological station from 1982 to 2015 was 0.201 and 1.844, which indicated that the annual Pre and ET0 at Baihe hydrological station both showed an insignificant upward trend overall. The Z value of NDVI at Baihe hydrological station from 1982 to 2015 was 2.897, which indicated that the annual NDVI showed a significant upward trend overall. For the Shayang hydrological station, the Z values of R and Pre from 1982 to 2015 were −1.193 and −0.232, which indicated that the annual R and Pre both showed an insignificant downward trend overall. The Z value of ET0 and NDVI at Shayng hydrological station from 1982 to 2015 was 1.844 and 1.627, which indicated that the annual ET0 and NDVI both showed an insignificant upward trend overall.
4.2. Abrupt Analysis
Mutation analysis for annual runoff depth data (1982–2015) of the Baihe and Shayang stations was conducted using the Pettitt mutation test method (Figure 1). From Figure 1, the statistics of the Pettitt mutation test method for annual runoff depth data (1982–2015) of the Baihe and Shayang stations both showed an overall trend of increasing from 1982 to 1990 and then decreasing from 1991 to 2015. And the statistics in 1990 both were the maximum value and exceeded the critical value of α = 0.05. The results indicated that the sudden change year for annual runoff depth data (1982–2015) of the Baihe and Shayang stations both were around 1990.
The accumulated deviation value mutation test approach was used to test annual runoff depth data (1982–2015) of the Baihe and Shayang stations to confirm the accuracy of the mutation results of the Pettitt mutation test method (Figure 2). Figure 2 presented that the accumulated deviation value of annual runoff depth data (1982–2015) of the Baihe and Shayang stations both showed an overall trend of increasing from 1982 to 1990 and then decreasing from 1991 to 2015, which implied that annual runoff depth data (1982–2015) of these two hydrological stations both mutated in 1990. Therefore, the Pettitt and cumulative deviation value mutation test methods both verified that annual runoff depth data (1982–2015) of Baihe and Shayang stations mutated in 1990.
4.3. Influence Assessment of Revegetation on Streamflow
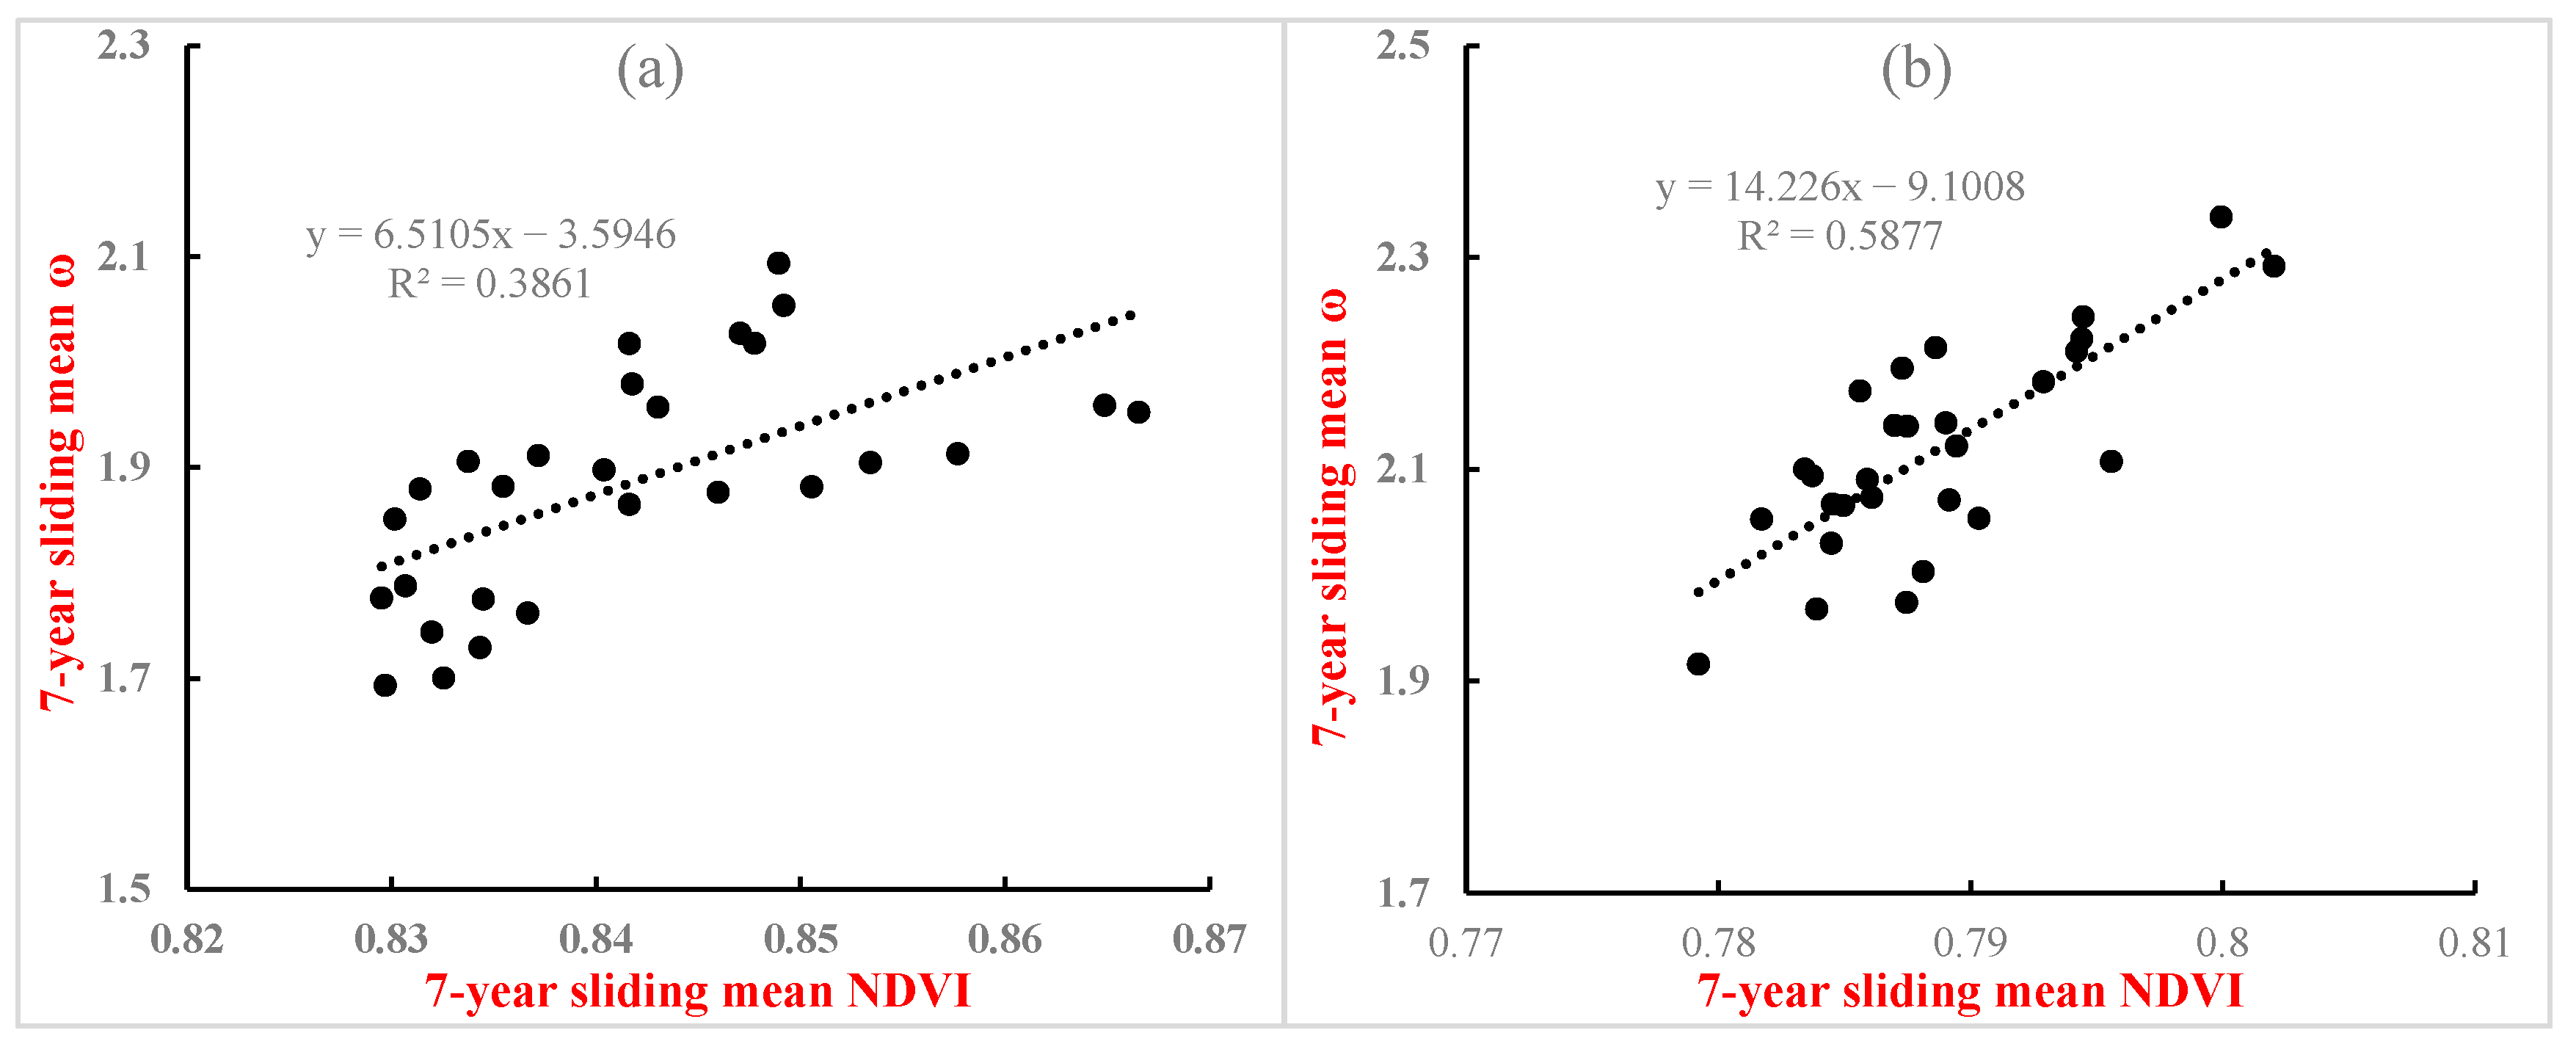
In an effort to further investigate the effect of revegetation on streamflow attenuation in HJR, we should obtain the linear relationship equations of NDVI and ω. Next, for obtaining the fitting equations of NDVI and ω, the 7-year moving average NDVI and ω of Baihe and Shayang hydrological stations are computed. Finally, the regression coefficients for Baihe (a = 6.51 and b = −3.59) and Shayang (a = 14.23 and b = −9.10) are obtained by least squares fitting, respectively (Figure 3). The determination coefficient (R2) of the fitting equation are 0.39 and 0.59, and the equations both are significant (p < 0.01). Comparing the fitting equations of NDVI and ω in other study areas, these determination coefficients range from 0.35 to 0.55 [30,41,42]. Determination coefficients in the figures are close to their numerical value. Therefore, the fitting equations of NDVI and ω can be applied to calculating the contribution of vegetation change to runoff attenuation.
In accordance with the mutation analysis results, 1990 was taken as the abrupt year for splitting the annual runoff depth of Baihe and Shayang into two sub-periods (P1: 1982–1990 and P2: 1991–2015), and values of hydro-meteorological elements and NDVI of HJR were computed (Table 2). We applied the T-test method to test the significance of the difference between the two sub-periods (P1: 1982–1990 and P2: 1991–2015).
From Table 2, potential evaporation and ω of the Biahe station both significantly increased by 50.64 mm and 0.25 from P1 to P2 (p < 0.05). Runoff depth significantly decreased by 157.36 mm, from 493.75 mm (P1) to 336.39 mm (P2) (p < 0.05). The change in precipitation showed no significant decrease, decreasing by 105.90 mm from 919.51 mm (P1) to 813.61 mm (P2). The change in NDVI showed no significant increase, increasing by 0.013 from 0.833 (P1) to 0.836 mm (P2).
For Shayang station, potential evaporation significantly increased by 45.49 mm from 895.15 mm (P1) to 940.64 mm (P2) (p < 0.05). Runoff depth significantly decreased by 117.56 mm, from 391.37 mm (P1) to 273.82 mm (P2) (p < 0.05). The change in precipitation showed no significant decrease, decreasing by 76.30 mm from 882.37 mm (P1) to 806.06 mm (P2). The change in NDVI and ω both showed no significant increase, increasing by 0.008 and 0.28 from P1 to P2.
The elasticity coefficient of the runoff depth of the Baihe and Shayang stations on each driving factor was calculated. And then the amount of runoff changes due to changes in P, ET0, ω, and NDVI could be computed, as shown in Table 3.
From T1 to T2, the increase of 50.64 mm in ET0 led to a decrease of 13.88 mm in the runoff depth of Baihe station. The decrease of 105.90 mm in Pre caused a decrease of 78.09 mm in runoff depth. The increase of 0.25 in ω and 0.013 in NDVI caused a decrease of 44.15 mm and 22.26 mm in the runoff depth of Baihe station. The contributions of ET0, Pre, human activities and NDVI to the runoff depth of Baihe station were 8.76%, 49.30%, 27.88% and 14.06%, respectively.
For Shayang station, the increase of 50.64 mm in ET0, 0.25 in ω, and 0.013 in NDVI led to a decrease of 12.59 mm, 33.27 mm, and 21.29 mm in runoff depth. The decrease of 105.90 mm in Pre caused a decrease of 51.89 mm in runoff depth. The contributions of ET0, Pre, human activities and NDVI to the runoff depth of Shayang station were 10.57%, 43.55%, 28.01% and 17.87%, respectively. In summary, streamflow decline in the HJR is mainly influenced by precipitation variation and human activities. Moreover, vegetation growth had a positive effect on streamflow decline.
With the implementation of the large-scale conversion of farmland to forest and grass project in 1999, vegetation coverage became the most critical factor for underlying surface conditions and significantly affected the hydrological process of the watershed. From Figure 3, we found that ω had a positive functional relationship with NDVI in the HJB, indicating that revegetation has a significant impact on ω. In addition, according to the sensitivity analysis results, the elasticity coefficients of runoff dep®(R) to NDVI were negative, indicating that R will decrease with increasing NDVI.
Although there are different research methods on the impact of vegetation change on runoff, there is generally a consistent conclusion that an increase in vegetation coverage is an important factor leading to a decrease in surface runoff [29,30]. This study presented that increasing vegetation coverage had a reducing effect on the runoff of the Baihe and Shayang stations, which is consistent with previous research findings [43,44], so this effect of vegetation growth on discharge attenuation should be given high priority. The government should plan vegetation restoration reasonably to reduce the reduction of water resources caused by unreasonable vegetation restoration.
5. Conclusions and Discussion
5.1. Conclusions
Runoff changes in the HJB have a significant impact on hydrological processes and the ecosystem of the Yangtze River. Since the implementation of the ecological restoration project, vegetation coverage of HJB has presented a growth trend as a whole. Vegetation changes can affect the underlying surface conditions of a watershed, and alter hydrological processes. To clarify the synergistic evolution relationship between climate, vegetation, and hydrology, this study aims to reveal how vegetation restoration influences streamflow decline.
The results displayed that (1) NDVI presented an increasing trend, and streamflow of Baihe and Shayang hydrologic station presented an insignificant decrease trend. The mutation year of the annual runoff depth of Baihe and Shayang stations both occurred in 1990. (2) The Budyko parameter has a positive linear relationship with NDVI (p < 0.01). (3) Streamflow decline in the HJR is mainly influenced by precipitation variation and human activities. Moreover, vegetation growth had a positive effect on the streamflow decline of Baihe and Shayang stations, with contribution rates of 14.06% and 17.87%. This effect of vegetation growth on discharge attenuation should be given high priority.
5.2. Discussions
This study quantitatively calculates the contribution rate of vegetation restoration to runoff changes in the Han River Basin by introducing NDVI into the Budyko formula, revealing how vegetation restoration affects the discharge decrease in HJR, filling the gap in attribution analysis of runoff changes in the HJR. Despite the strict control of data and models in this study, there are uncertainties. First of all, the determination coefficients of the fitting equations are low, so other factors need to be introduced to improve the determination coefficient of the fitting equation. Secondly, the method used in this study is only applicable to areas where vegetation change has a significant impact on the underlying surface.
In addition, the issue of interactive effects of the influence of climatic conditions and anthropic factors. Current studies have established a framework in which climate variability and human activities are independent factors, whereas, in reality, there is a strong interaction between the two in the eco-hydrological systems [44,45,46,47]. Therefore, how to couple the objectivity of statistical methods and the physical mechanism of hydrological modeling methods, while reducing uncertainty and improving accuracy, is an important direction for future research [48,49]. Based on the Budyko hypothesis, the variation of water storage in a watershed on a multi-year average scale in the water balance equation is 0, which clearly overlooks the interception of watershed runoff by soil and water conservation. Therefore, quantitative research on the contribution of different soil and water conservation to runoff remains a challenge and needs to be addressed in the attribution analysis of water and sediment changes. Further exploration of attribution analysis theory and model algorithms will also become the focus of future research.
Author Contributions
Conceptualization, S.H.; Methodology, M.J.; Software, M.J.; Formal analysis, M.J.; Data curation, M.J. and Y.L.; Writing—original draft, M.J.; Writing—review & editing, M.J., S.H., X.H. and Y.L.; Project administration, S.H. and X.H.; Funding acquisition, S.H. and Y.L. All authors have read and agreed to the published version of the manuscript.
Funding
This research was funded by the project of Philosophy and Social Science Plan in Henan Province (Grant No. 2022BJJ070) and the key project of Philosophy and Social Science Research in Colleges and Universities in Henan Province (Grant No. 2022-JCZD-15).
Data Availability Statement
Not applicable.
Conflicts of Interest
The authors declare no conflict of interest.
References
- Zhou, S.; Wang, Y.; Guo, A.; Zhang, R.; Liu, Q. Future spatiotemporal changes in water resources in the Yellow River Basin. J. Hydroelectr. Power 2018, 37, 28–39. (In Chinese) [Google Scholar]
- Ji, G.; Song, H.; Wei, H.; Wu, L. Attribution Analysis of Climate and Anthropic Factors on Runoff and Vegetation Changes in the Source Area of the Yangtze River from 1982 to 2016. Land 2021, 10, 612. [Google Scholar] [CrossRef]
- Abbott, B.; Bishop, K.; Zarnetske, J.; Minaudo, C.; Chapin, F.; Krause, S.; Hannah, D.; Conner, L.; Ellison, D.; Godsey, S.; et al. Human domination of the global water cycle absent from depictions and perceptions. Nat. Geosci. 2019, 12, 533–540. [Google Scholar] [CrossRef]
- Yang, X.; Wu, W.; Zheng, C.; Wang, Q. Identification of attribution of runoff changes in the Yi River Basin based on the Budyko hypothesis. Res. Soil Water Conserv. 2023, 30, 100–106. (In Chinese) [Google Scholar]
- Yang, S.; Jiang, R.; Xie, J.; Wang, Y.; Wang, Y. Research on the Characteristics and Attributions of Runoff Changes in the Upper Wei River. J. Water Resour. Water Eng. 2019, 30, 37–42. (In Chinese) [Google Scholar]
- Ji, G.; Wu, L.; Wang, L.; Yan, D.; Lai, Z. Attribution Analysis of Seasonal Runoff in the Source Region of the Yellow River Using Seasonal Budyko Hypothesis. Land 2021, 10, 542. [Google Scholar] [CrossRef]
- Li, Y.; Li, H.; Huang, J.; Liu, C. An approximation method for evaluating flash flooding mitigation of sponge city strategies-A case study of Central Geelong. J. Clean. Prod. 2020, 257, 120525. [Google Scholar] [CrossRef]
- Ji, G.; Lai, Z.; Xia, H.; Liu, H.; Wang, Z. Future Runoff Variation and Flood Disaster Prediction of the Yellow River Basin Based on CA-Markov and SWAT. Land 2021, 10, 421. [Google Scholar] [CrossRef]
- Aissia, M.A.B.; Chebana, F.; Ouarda, T.B.M.J.; Roy, L.; Bruneau, P.; Barbet, M. Dependence evolution of hydrological characteristics, applied to floods in a climate change context in Quebec. J. Hydrol. 2014, 519, 148–163. [Google Scholar] [CrossRef]
- Ji, G.; Lai, Z.; Yan, D.; Wu, L.; Wang, Z. Spatiotemporal patterns of future meteorological drought in the Yellow River Basin based on SPEI under RCP scenarios. Int. J. Clim. Change Strateg. Manag. 2022, 14, 39–53. [Google Scholar] [CrossRef]
- Greve, P.; Orlowsky, B.; Mueller, B.; Sheffield, J.; Reichstein, M.; Seneviratne, S. Global assessment of trends in wetting and drying over land. Nat. Geosci. 2014, 7, 716–721. [Google Scholar] [CrossRef]
- Ge, J.; Pitman, A.J.; Guo, W.; Zan, B.; Fu, C. China’s tree-planting could falter in a warming world. Nature 2019, 573, 474. [Google Scholar]
- Qin, Y.; Batzoglou, J.; Siebert, S.; Huning, L.; AghaKouchak, A.; Mankin, J.; Hong, C.; Tong, D.; Davis, S.; Mueller, N. Agricultural risks from changing snowmelt. Nat. Clim. Change 2020, 10, 459–465. [Google Scholar] [CrossRef]
- Deng, L.; Guo, S.; Tian, J.; Wang, H.; Wang, J. Runoff variation and attribution analysis in the upper Han River basin. South-to-North Water Transf. Water Sci. Technol. 2023, 21, 761–769. (In Chinese) [Google Scholar]
- Du, T.; Cao, L.; Ouyang, S.; Ping, Y.R.; Bao, B. Evolution Law and Attribution Analysis of Hydrological Elements in the Upper Han River Basin. Rep. Yangtze River Acad. Sci. 2023, 1–7. [Google Scholar]
- Zou, L.; Zhang, Y.; Chen, T.; Liu, H.Y. Research on the Characteristics of Precipitation and Runoff Evolution in the Han River Basin. Hydrology 2023, 43, 103–109. [Google Scholar]
- Zhan, Y.; Fan, J.; Meng, T.; Li, Z.; Yan, Y.; Huang, J.; Chen, D.; Sui, L. Analysis on vegetation cover changes and the driving factors in the mid-lower reaches of Han River Basin between 2001 and 2015. Open Geosci. 2021, 13, 675–689. [Google Scholar] [CrossRef]
- Peng, T.; Mei, Z.Y.; Dong, X.H.; Wang, J.B.; Liu, J.; Chang, W.J.; Wang, G.X. Attribution of runoff changes in the Han River Basin based on the Budyko hypothesis. South North Water Divers. Water Conserv. Technol. (Chin. Engl.) 2021, 19, 1114–1124. [Google Scholar]
- Chen, H. Research on Parameter Transplantation Method and Hydrological Hydrodynamic Coupling Model in the Han River Basin; Dalian University of Technology: Dalian, China, 2020. (In Chinese) [Google Scholar]
- Huo, L. Evolution Analysis of Water Resources System in the Upper Reaches of Hanjiang River under Climate Change and Early Warning Research on Carrying Capacity; Huazhong University of Science and Technology: Wuhan, China, 2020. (In Chinese) [Google Scholar]
- Li, F.; Deng, Z.; Deng, R.; Peng, C. Research on Ecological Flow Guarantee Measures for the Main Stream of the Han River. People’s Yangtze River 2021, 52, 50–53. (In Chinese) [Google Scholar]
- Tang, B.; Tong, L.; Kang, S.; Zhang, L. Impacts of climate variability on reference evapotranspiration over 58 years in the Haihe river basin of north China. Agric. Water Manag. 2011, 98, 1660–1670. [Google Scholar] [CrossRef]
- Luo, M.; Liu, T.; Frankl, A.; Duan, Y.C.; Meng, F.H.; Bao, A.M.; Kurban, A.; De Maeyer, P. Defining spatiotemporal characteristics of climate change trends from downscaled GCMs ensembles: How climate change reacts in Xinjiang, China. Int. J. Climatol. 2018, 38, 2538–2553. [Google Scholar] [CrossRef]
- Yue, S.; Wang, C.Y. Applicability of prewhitening to eliminate the influence of serial correlation on the Mann-Kendall test. Water Resour. Res. 2002, 38, 4-1–4-7. [Google Scholar] [CrossRef]
- Xv, J.; Yang, D.; Lei, Z.; Xv, J.; Yang, D.; Lei, Z.; Li, C.; Peng, J. Examination of long-term trends in precipitation and runoff in the Yangtze River Basin. Yangtze River 2006, 85, 63–67. (In Chinese) [Google Scholar]
- Pettitt, A.N. A Non-Parametric Approach to the Change-Point Problem. J. R. Stat. Soc. 1979, 28, 126–135. [Google Scholar] [CrossRef]
- Nie, N.; Zhang, W.; Liu, M.; Chen, H.; Zhao, D. Separating the impacts of climate variability, land-use change and large reservoir operations on streamflow in the Yangtze River basin, China, using a hydrological modeling approach. Int. J. Dig. Earth 2021, 14, 231–249. [Google Scholar] [CrossRef]
- Wang, S.; Yan, Y.; Yan, M.; Zhao, X. Quantitative estimation of the impact of precipitation and human activities on runoff change of the Huangfuchuan River basin. J. Geogr. Sci. 2012, 22, 906–918. [Google Scholar] [CrossRef]
- Liu, Y.; Chen, W.; Li, L.; Huang, J.; Wang, X.; Guo, Y.; Ji, G. Assessing the contribution of vegetation variation to streamflow variation in the Lancang River Basin, China. Front. Ecol. Evol. 2023, 10, 1058055. [Google Scholar] [CrossRef]
- Ji, G.; Yue, S.; Zhang, J.; Huang, J.; Guo, Y.; Chen, W. Assessing the Impact of Vegetation Variation, Climate and Human Factors on the Streamflow Variation of Yarlung Zangbo River with the Corrected Budyko Equation. Forests 2023, 14, 1312. [Google Scholar] [CrossRef]
- Wen, D.; Cui, B.; Liu, Z.; Zhang, K. Relative effects of human activities and climate change on the river runoff in an arid basin in northwest China. Hydrol. Process. 2015, 28, 4854–4864. [Google Scholar]
- Wang, S.; Wang, Y.; Ran, L.; Su, T. Climatic and anthropogenic impacts on runoff changes in the Songhua River basin over the last 56years (1955–2010), Northeastern China. Catena 2015, 127, 258–269. [Google Scholar] [CrossRef]
- Ji, G.; Huang, J.; Guo, Y.; Yan, D. Quantitatively Calculating the Contribution of Vegetation Variation to Runoff in the Middle Reaches of Yellow River Using an Adjusted Budyko Formula. Land 2022, 11, 535. [Google Scholar] [CrossRef]
- Donohue, R.J.; Roderick, M.L.; Mcvicara, T.R. Can dynamic vegetation information improve the accuracy of Budyko’s hydrological model? J. Hydrol. 2010, 390, 23–34. [Google Scholar] [CrossRef]
- Caracciolo, D.; Pumo, D.; Viola, F. Budyko’s based method for annual runoff characterization across different climatic areas: An application to United States. Water Resour. Manag. 2018, 32, 3189–3202. [Google Scholar] [CrossRef]
- Zhang, X.; Dong, Q.; Cheng, L.; Xia, J. A Budyko-based framework for quantifying the impacts of aridity index and other factors on annual runoff. J. Hydrol. 2019, 579, 124224. [Google Scholar] [CrossRef]
- Yang, X.; Wang, C.; Du, J.; Qiu, S.; Liu, J. Dynamic evolution of attribution analysis of runoff based on the complementary Budyko equation in the source area of Lancang river. Front. Earth Sci. 2023, 11, 1160520. [Google Scholar] [CrossRef]
- Zhao, G.J.; Tian, P.; Mu, X.M.; Jiao, J.Y.; Wang, F.; Gao, P. Quantifying the impact of climate variability and human activities on streamflow in the middle reaches of the Yellow River basin, China. J. Hydrol. 2014, 519, 387–398. [Google Scholar] [CrossRef]
- Fu, B. On the calculation of the evaporation from land surface. Chin. J. Atmos. Sci. 1981, 5, 23–31. (In Chinese) [Google Scholar]
- Li, D.; Pan, M.; Cong, Z.; Zhang, L.; Wood, E. Vegetation control on water and energy balance within the Budyko framework. Water Resour. Res. 2013, 49, 969–976. [Google Scholar] [CrossRef]
- Yue, S.; Huang, J.; Zhang, Y.; Chen, W.; Guo, Y.; Cheng, M.; Ji, G. Quantitative Evaluation of the Impact of Vegetation Restoration and Climate Variation on Runoff Attenuation in the Luan River Basin Based on the Extended Budyko Model. Land 2023, 12, 1626. [Google Scholar] [CrossRef]
- Gao, H.; Li, Q.; Xiong, G.; Li, B.; Zhang, J.; Meng, Q. Quantitative assessment of hydrological response to vegetation change in the upper reaches of Luanhe River with the modified Budyko framework. Front. Ecol. Evol. 2023, 11, 1178231. [Google Scholar] [CrossRef]
- Calder, I.R.; Smyle, J.; Aylward, B. Debate over flood-proofing effects of planting forests. Nature 2007, 450, 945. [Google Scholar] [CrossRef] [PubMed]
- Wang, Y.; Liu, Z.; Qian, B.; He, Z.; Ji, G. Quantitatively Computing the Influence of Vegetation Changes on Surface Discharge in the Middle-Upper Reaches of the Huaihe River, China. Forests 2022, 13, 2000. [Google Scholar] [CrossRef]
- Wu, J.; Miao, C.; Wang, Y.; Duan, Q.; Zhang, X. Contribution analysis of the long-term changes in seasonal runoff on the Loess Plateau, China, using eight Budyko-based methods. J. Hydrol. 2017, 545, 263–275. [Google Scholar] [CrossRef]
- Al-Safi, H.I.J.; Kazemi, H.; Sarukkalige, P.R. Comparative study of conceptual versus distributed hydrologic modelling to evaluate the impact of climate change on future runoff in unregulated catchments. J. Water. Clim. Chang. 2020, 11, 341–366. [Google Scholar] [CrossRef]
- Jiang, C.; Xiong, L.; Wang, D.; Liu, P.; Guo, S.; Xu, C. Separating the impacts of climate change and human activities on runoff using the Budyko-type equations with time-varying parameters. J. Hydrol. 2015, 522, 326–338. [Google Scholar] [CrossRef]
- Leuning, R.; Zhang, Y.Q.; Rajaud, A.; Cleugh, H.; Tu, K. A simple surface conductance model to estimate regional evaporation using MODIS leaf area index and the Penman-Monteith equation. Water Resour. Res. 2008, 44, 1–17. [Google Scholar] [CrossRef]
- Liu, C.M.; Wang, Z.G.; Yang, S.T.; Sang, Y.; Liu, X.; Li, J. Hydro-informatic modeling system: Aiming at water cycle in land surface material and energy exchange processes. Acta Geogr. Sin. 2014, 69, 579–587. (In Chinese) [Google Scholar]
Figure 1.
Pettitt mutation test results of runoff depth in Baihe (a) and Shayang (b) during 1982–2015.
Figure 1.
Pettitt mutation test results of runoff depth in Baihe (a) and Shayang (b) during 1982–2015.

Figure 2.
Runoff depth accumulated deviation value mutation analysis in Baihe (a) and Shayang (b) from 1982 to 2015.
Figure 2.
Runoff depth accumulated deviation value mutation analysis in Baihe (a) and Shayang (b) from 1982 to 2015.

Figure 3.
Functional Equations for 7-year sliding mean NDVI and 7-year sliding mean ω in Baihe (a) and Shayang (b) stations.
Figure 3.
Functional Equations for 7-year sliding mean NDVI and 7-year sliding mean ω in Baihe (a) and Shayang (b) stations.

Table 1.
TFPW-MK trend test results of meteorological and hydrological elements on Baihe and Shayang hydrological stations.
Table 1.
TFPW-MK trend test results of meteorological and hydrological elements on Baihe and Shayang hydrological stations.
| Hydrographic Station | Variable | β | Z | Level of Significance |
|---|---|---|---|---|
| Baihe | R | −3.044 | −0.697 | — |
| Pre | 0.552 | 0.201 | — | |
| ET0 | 1.627 | 1.844 | — | |
| NDVI | 0.001 | 2.897 | 0.01 | |
| Shayang | R | −2.930 | −1.193 | — |
| Pre | −0.988 | −0.232 | — | |
| ET0 | 1.758 | 1.844 | — | |
| NDVI | 0.001 | 1.627 | — |
Table 2.
Values of hydro-meteorological elements and NDVI in HJR.
| Station | Periods | ET0/mm | Pre/mm | R/mm | ω | NDVI |
|---|---|---|---|---|---|---|
| Baihe | P1 (1982–1990) | 847.52 | 919.51 | 493.75 | 1.69 | 0.833 |
| P2 (1991–2015) | 898.16 | 813.61 | 336.39 | 1.94 | 0.846 | |
| Difference | 50.64 | −105.90 | −157.36 | 0.25 | 0.013 | |
| P | 0.002 | 0.086 | 0.006 | 0.001 | 0.099 | |
| Shayang | P1 (1982–1990) | 895.15 | 882.37 | 391.37 | 1.92 | 0.783 |
| P2 (1991–2015) | 940.64 | 806.06 | 273.82 | 2.20 | 0.791 | |
| Difference | 45.49 | −76.30 | −117.56 | 0.28 | 0.008 | |
| P | 0.005 | 0.127 | 0.003 | 0.058 | 0.294 |
Table 3.
Attributing analysis of discharge variation in HJR.
| Station | εET0 | εPre | εω | εNDVI | ΔRET0 | ΔRPre | ΔRhum | ΔRNDVI | ||||
|---|---|---|---|---|---|---|---|---|---|---|---|---|
| Baihe | −0.64 | 1.64 | −1.32 | −3.83 | −13.88 | −78.09 | −44.15 | −22.26 | 8.76% | 49.30% | 27.88% | 14.06% |
| Shayang | −0.84 | 1.84 | −1.39 | −7.36 | −12.59 | −51.89 | −33.27 | −21.29 | 10.57% | 43.55% | 28.01% | 17.87% |
Disclaimer/Publisher’s Note: The statements, opinions and data contained in all publications are solely those of the individual author(s) and contributor(s) and not of MDPI and/or the editor(s). MDPI and/or the editor(s) disclaim responsibility for any injury to people or property resulting from any ideas, methods, instructions or products referred to in the content. |
© 2023 by the authors. Licensee MDPI, Basel, Switzerland. This article is an open access article distributed under the terms and conditions of the Creative Commons Attribution (CC BY) license (https://creativecommons.org/licenses/by/4.0/).
Share and Cite
MDPI and ACS Style
Jia, M.; Hu, S.; Hu, X.; Long, Y. Response Mechanism of Annual Streamflow Decline to Vegetation Growth and Climate Change in the Han River Basin, China. Forests 2023, 14, 2132. https://doi.org/10.3390/f14112132
AMA Style
Jia M, Hu S, Hu X, Long Y. Response Mechanism of Annual Streamflow Decline to Vegetation Growth and Climate Change in the Han River Basin, China. Forests. 2023; 14(11):2132. https://doi.org/10.3390/f14112132
Chicago/Turabian StyleJia, Mengya, Shixiong Hu, Xuyue Hu, and Yuannan Long. 2023. "Response Mechanism of Annual Streamflow Decline to Vegetation Growth and Climate Change in the Han River Basin, China" Forests 14, no. 11: 2132. https://doi.org/10.3390/f14112132
Note that from the first issue of 2016, this journal uses article numbers instead of page numbers. See further details here.