Article

The Response of Carbon Stocks to Land Use/Cover Change and a Vulnerability Multi-Scenario Analysis of the Karst Region in Southern China Based on PLUS-InVEST

1
School of Karst Science, Guizhou Normal University, Guiyang 550001, China
2
State Engineering Technology Institute for Karst Desertification Control, Guiyang 550001, China
3
School of Geography & Environmental Science, Guizhou Normal University, Guiyang 550001, China
*
Author to whom correspondence should be addressed.
Forests 2023, 14(12), 2307; https://doi.org/10.3390/f14122307
Submission received: 27 September 2023 / Revised: 21 November 2023 / Accepted: 22 November 2023 / Published: 24 November 2023
(This article belongs to the Special Issue Ecosystem Degradation and Restoration: From Assessment to Practice)

Abstract

:
Quantitatively revealing the response of carbon stocks to land use change (LUCC) and analyzing the vulnerability of ecosystem carbon stock (ECS) services are of great significance for maintaining the carbon cycle and ecological security. For this study, China’s Guizhou Province was the study area. Land use data in 2000, 2010, and 2020 were selected to explore the impacts of LUCC on carbon stocks in multiple scenarios by combining the PLUS and InVEST models and then analyzing the vulnerability of ECS services. The results show that forest land plays an important role in improving ECS services in karst plateau mountainous areas. In 2000–2020, forest land expansion offset the carbon stock reduced by the expansion of built-up land, greatly improving the regional ECS function. Following the natural trend (NT), the total carbon stock in Guizhou Province will decrease by 1.86 Tg; however, under ecological protection (EP) measures, the ECS service performs a positive function for LUCC. Focusing on socioeconomic development (ED) will increase the vulnerability of the regional ECS service. In the future, the forest land area size should be increased, and built-up land should be restricted to better improve the service function of ECS in karst plateau mountainous areas.

1. Introduction

In recent years, the acceleration of industrialization and urbanization has resulted in large amounts of carbon dioxide being emitted into the atmosphere, causing global warming [1] and a range of ecological issues [2,3]. In order to cope with global warming and the ecological problems caused by carbon emissions, the 26th United Nations Conference of the Parties to Climate Change (COP26) proposed that nations should ensure that global carbon emissions are zeroed out and that global warming will reach no more than 1.5 °C by 2050 [4]. As the world’s largest emitter of carbon dioxide, China has also proposed the goal of achieving a “carbon emissions peak” by 2030 and “carbon neutrality” by 2060 [5]. The karst plateau mountainous region of Guizhou is the center of the ecologically fragile karst area in southern China and is also an important ecological barrier in the upper reaches of the Yangtze and Pearl River Basins [6]. In recent years, with the rapid socioeconomic development and accelerated urbanization of the area [7], the land use landscape pattern in Guizhou Province has changed dramatically, causing greater disturbance to the terrestrial ecosystem carbon cycle and affecting the service function of the ecosystem, which will make the ecological problems faced by the fragile ecological environment of the karst plateau mountainous area more prominent [8].
Terrestrial ecosystems are an important component of global carbon stocks, act as an indispensable link in the global carbon cycle, and play an important role in the global carbon balance [9,10]. LUCC alters the plant and soil carbon densities of terrestrial ecosystems, and their carbon stocks change accordingly [11]. Therefore, it is important to study the response of terrestrial carbon sinks to LUCC in karst plateau mountainous areas and quantitatively assess the regional ECS service function to maintain the carbon balance and ecological security of regional terrestrial ecosystems. At present, academic research on the impact of LUCC on carbon stocks is progressing rapidly. For example, Richards et al. [12] estimated the impact of land cover change on global mangrove carbon stocks between 1996 and 2016 and found that mangrove protection and restoration measures were effective in reducing the net loss of carbon stocks. By examining the impacts of LUCC driven by population and economic growth on biodiversity and carbon sequestration, Marques et al. [13] found that overall population and economic growth led to an increase in the overall impacts of carbon sequestration, despite a decrease in land use impacts per unit of gross domestic product (GDP). Marques also concluded that forestry activities have the greatest impact on carbon sequestration, a finding that has been reflected in the studies of numerous scholars [14,15]. Schulp et al. [16] set up four development scenarios to project carbon stocks in Europe in 2030 and found that the role of LUCC on carbon stocks should not be ignored. At present, there are relatively few studies on the impacts of LUCC-induced carbon stock changes on ecological services, which are actually more meaningful for regional ecological protection policy implementation. In addition, most scholars’ studies have focused on single ecosystems, such as forest [17,18,19], grassland [20,21,22], or cropland [23,24,25] ecosystems, whereas integrated ecosystem studies are more reflective of nature–human integrity [26].
As a complex integrated ecosystem composed of nature and human beings, the karst region in southern China is characterized by strong karst development, a fragile ecological environment, poor ecosystem stability, vulnerability to human activities, and prominent contradictions between ecological protection and economic development [27]. As a result, the service function of the ecosystems in karst plateau mountainous areas is highly susceptible to influence, showing strong vulnerability [28]. At present, there are more studies on ecosystem restoration in karst areas in southern China [29,30,31]. Among them, Qiu et al. [30] explored the interactions between ecological restoration programs and social–ecological systems and proposed that regional ecosystem research could be advanced in the future based on the analysis of contexts and the assessment of measurement objectives. Tong [29] and others, in their study on vegetation growth and carbon storage in the karst region of southern China, found that large-scale ecological conservation programs can promote the greening of the planet and positively affect carbon sequestration, thereby mitigating climate change. However, ecosystems show significant vulnerability when they are often subjected to external disturbances, which reduces ecosystem service functions [32]. Research on ecosystem vulnerability is mainly conducted from the perspective of ecosystem service value [33,34,35]. Carbon storage services, as an important component of ecosystem services [36], are of more practical significance in studying ecosystem vulnerability through carbon stock changes under China’s “carbon peak” and “carbon neutral” goals [37].
On the basis of land use, carbon density, and natural and socioeconomic statistics, the PLUS and InVEST models were used to analyze the spatial and temporal responses of carbon stock changes and LUCC in the mountainous ecosystems of the karst plateau, and the potential impact index (PI) was calculated by combining the land use intensity to explore the vulnerability of ECS services, with the aim of maintaining regional ecosystem carbon balance and ecological security. The main research objectives were as follows: (1) to study the spatial and temporal changes in carbon stock in the karst plateau mountainous area from 2000 to 2020, and to realize the spatial and temporal dynamic monitoring of carbon stock in the ecologically fragile karst area; (2) to predict the spatial distribution of carbon stocks under different development scenarios in 2030, analyze the spatial and temporal response of LUCC and carbon stocks, and provide more methodological references for the ecological and environmental restoration of karst plateau mountainous areas; and (3) to assess the vulnerability of ECS services in karst plateau mountainous areas and provide ideas for land use management and planning and ecological protection in ecologically fragile karst areas.

2. Materials and Methods

2.1. Study Area

Guizhou Province (103°36′–109°35′ E, 24°37′–29°13′ W) is located in the eastern part of the Yunnan–Guizhou Plateau, covering an area of about 1.76 × 10⁷ ha, with a topography that is high in the west and low in the east, with an altitude of 147.8–2900.6 m (Figure 1). The geomorphological type is mainly characterized by plateau mountains, basins, and hills, of which the mountainous and hilly areas account for more than 92% of the province’s area. The climate type is subtropical monsoon climate, with an average annual temperature of 12–19 °C, an average annual precipitation of 1100–1300 mm, a warm and humid climate, and a forest coverage rate of more than 60%. Guizhou Province, as a typical karst plateau mountainous region, has a wide distribution of carbonate rocks and strong development of karst landforms, covering about 62% of the province’s area, with a fragmented surface, strong spatial heterogeneity, and very fragile ecosystem, as it is the center of the karst ecologically fragile zone in southern China. In 2008, the state launched the implementation of the Rocky Desertification Comprehensive Management Project (RDCP). During the period of 2012–2022, the area of rocky desertification in Guizhou was reduced from 30,200 km2 to less than 17,000 km2, a reduction of 43%, making Guizhou the province with the largest reduction in rocky desertification area in China’s karst region.

2.2. Data Sources and Data Processing

The land use data for 2000, 2010, and 2020 were obtained from the GlobeLand30 surface cover dataset with a spatial resolution of 30 m × 30 m [38]. In this study, the land use types were reclassified into six categories: forest land, cropland, grassland, water bodies, construction land, and unused land. The digital elevation model (DEM) [39], air temperature, precipitation [40], gross domestic product (GDP) [41], population [42], and river network data [43] were obtained from the Data Center for Resource and Environmental Sciences, Chinese Academy of Sciences. Road and county government site data were obtained from OpenStreetMap [44]. The slope was obtained based on DEM, and distance data were obtained using Euclidean distance [45]. The data are illustrated in Table 1.

2.3. Methods

2.3.1. Multi-Scenario Setting

Three development scenarios were designed for this study. The first is the natural trend (NT) scenario; this scenario mainly follows the historical development trend in land use [46]. The second is the ecological protection (EP) scenario; this scenario focuses on protecting the ecosystem by strictly controlling the outward conversion of forest land, grassland, and water bodies so as to maximize ecological benefits [47]. The third is the economic development (ED) scenario; the main goal of this scenario is socioeconomic development, and urban and rural construction is further strengthened. The ED scenario strictly limits the external conversion of built-up land, accelerates urbanization, and expands the area of built-up land. The LUCC probability distribution was set as shown in Table 2.

2.3.2. PLUS Model

Commonly used models for simulating and predicting LUCC include FLUS [48,49], CA-Marko [50,51,52], CLUE-S [53,54], and PLUS [55,56,57], among which the PLUS model is capable of identifying various drivers of LUCC (Figure 2), simulating the generation and evolution of land patches under different development scenarios and further improving the computational accuracy [58]. Due to the further refinement of land use conversion rules, it is more flexible in simulating LUCC in large-scale and spatially heterogeneous areas, and also shows better results in multi-scenario LUCC prediction.
Domain factor weights reflect the interaction between land use types, which can be filled in empirically or calculated using the percentage expansion of the land type, and this study used the percentage of expansion of land types as the domain factor weights for LUCC prediction [59], and the neighborhood weights were 0.6519, 0.3259, 0.0129, 0.0041, 0.0001, and 0.0052.

2.3.3. InVEST Model

Research methods surrounding the impact of LUCC on carbon stocks in terrestrial ecosystems are mainly divided into field sampling and model calculations. Field sampling, although more accurate, has been criticized for its high cost, difficulty in spatial quantification, and poor spatial representation. Based on this, models such as CEVSA [60,61], CASA [62,63], and InVEST [64,65,66] have been gradually used to estimate ECS. Of these, the InVEST model has been used by more scholars due to its simplicity, fast running speed, and high generalizability and stability. Carbon density represents the basic data for calculating regional carbon stocks using the InVEST model. The equations are as follows:
C i = C i a + C i b + C i s + C i d
C t = i = 1 6 C i × S i
where Ci denotes the carbon stock of land use type i and Ci−a, Ci−b, Ci−s, and Ci−d denote aboveground, belowground, soil, and dead organic matter carbon pools, respectively. Ct denotes the total carbon stock and Si denotes the area of land use type i.
Based on the results of previous studies, priority was given to carbon densities in Guizhou Province and surrounding regions, corrected for temperature and precipitation in the karst plateau mountainous areas, and the carbon densities of different land use types were finally determined (Table 3).

2.3.4. Ecosystem Service Vulnerability Assessment Methodology

The vulnerability of ecosystem services refers to the extent to which human ecosystems are negatively affected by adverse impacts such as climate change or LUCC, reflecting the strength of ecosystem service capacity [32]. In this study, according to the vulnerability assessment methodology for ecosystem services covering LUCC proposed by Schröter et al. [76], the potential impact index (PI) was used to measure the vulnerability of ECS services [77]. The equations are as follows:
P I = L a x × Δ C C x × Δ L a
Δ C = C y C x
Δ L a = L a y L a x
L a = 100 × i = 1 n ( A i × B i ) ,   L a 100 , 400
where PI is the potential impact index, C is the carbon stock, x is the initial year, y is the end year, La is the land use intensity, Ai is the land use intensity classification index for level i, Bi denotes the proportion of the area of the land use type in level i, and n is the number of land use levels. In this study, the land use index is divided into four levels, unused land is level 1; forest land, grassland, and water bodies are level 2; cropland is level 3; and built-up land is level 4 [78].

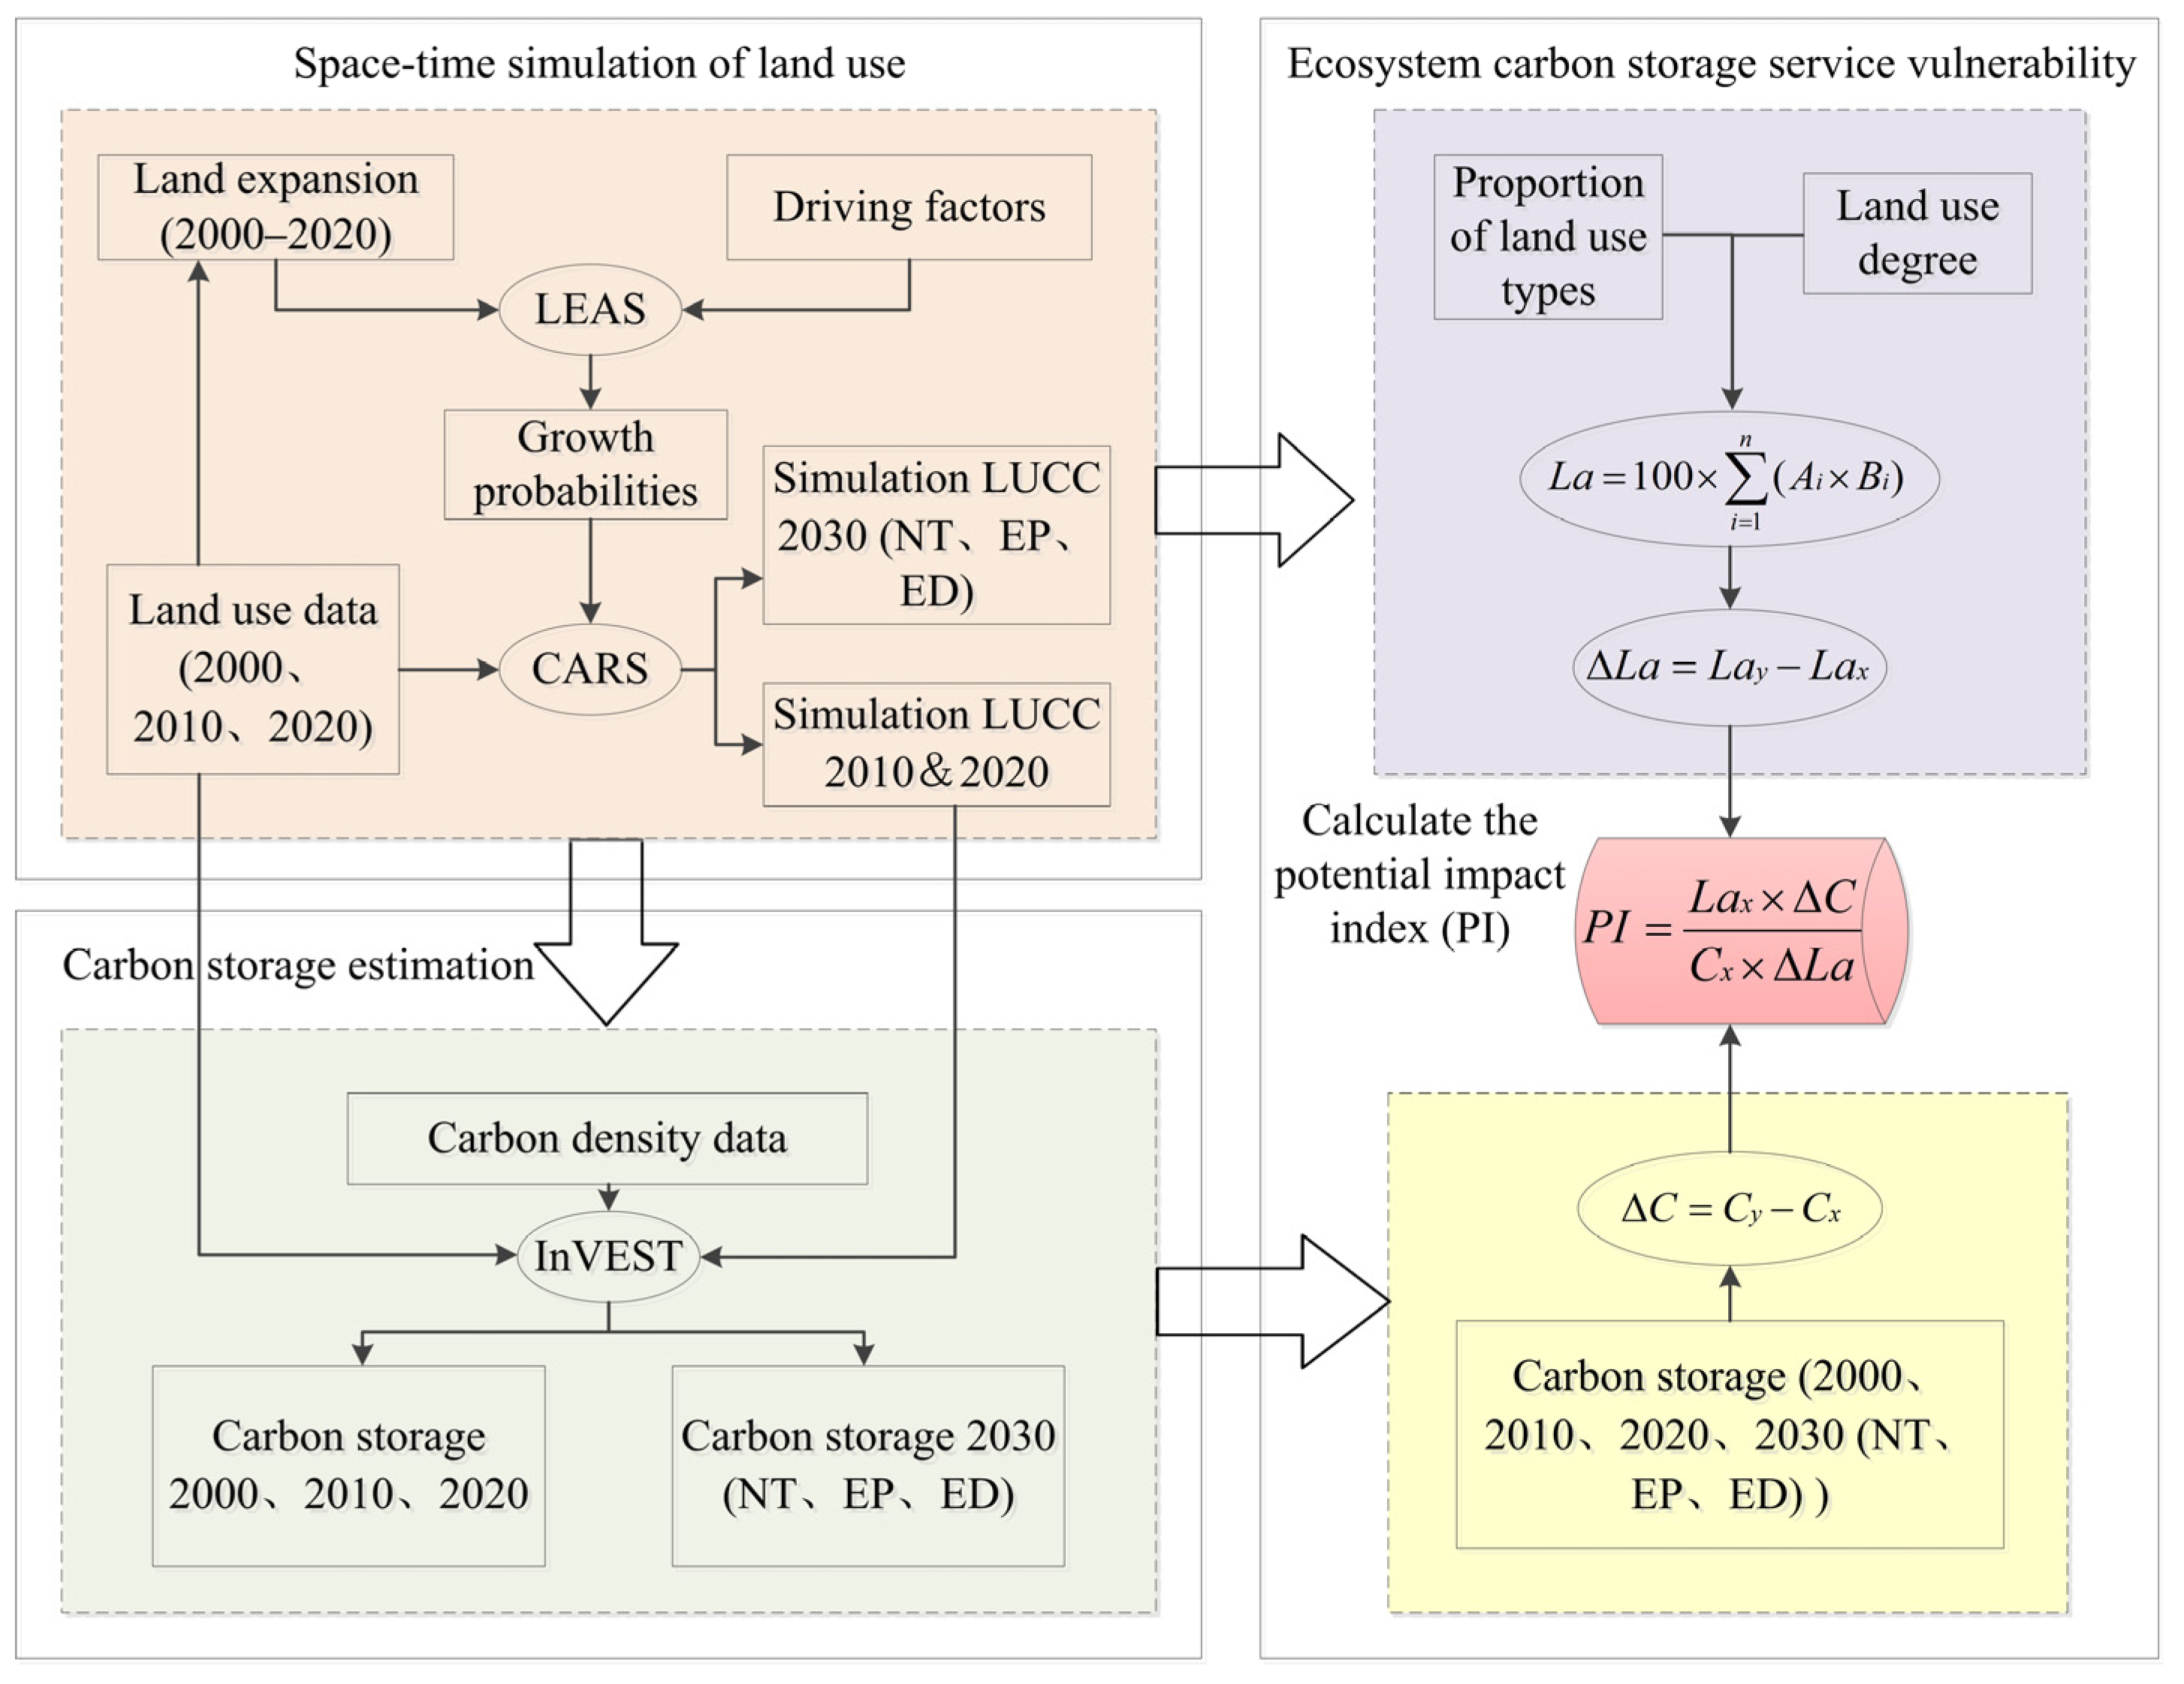
2.3.5. Research Framework

Based on the 2000, 2010, and 2020 land use data and 12 given factors (natural, socioeconomic, and accessibility factors) in Guizhou Province, the PLUS model was utilized to study land expansion. Subsequently, based on LUCC and carbon density data, the InVEST model was used to analyze the carbon stock changes in karst plateau mountainous areas, calculate the PI of Guizhou Province based on LUCC and carbon stock changes, and then assess the vulnerability of ECS services in karst plateau mountainous areas (Figure 3).

3. Results

3.1. Impact of LUCC on Carbon Stocks, 2000–2020

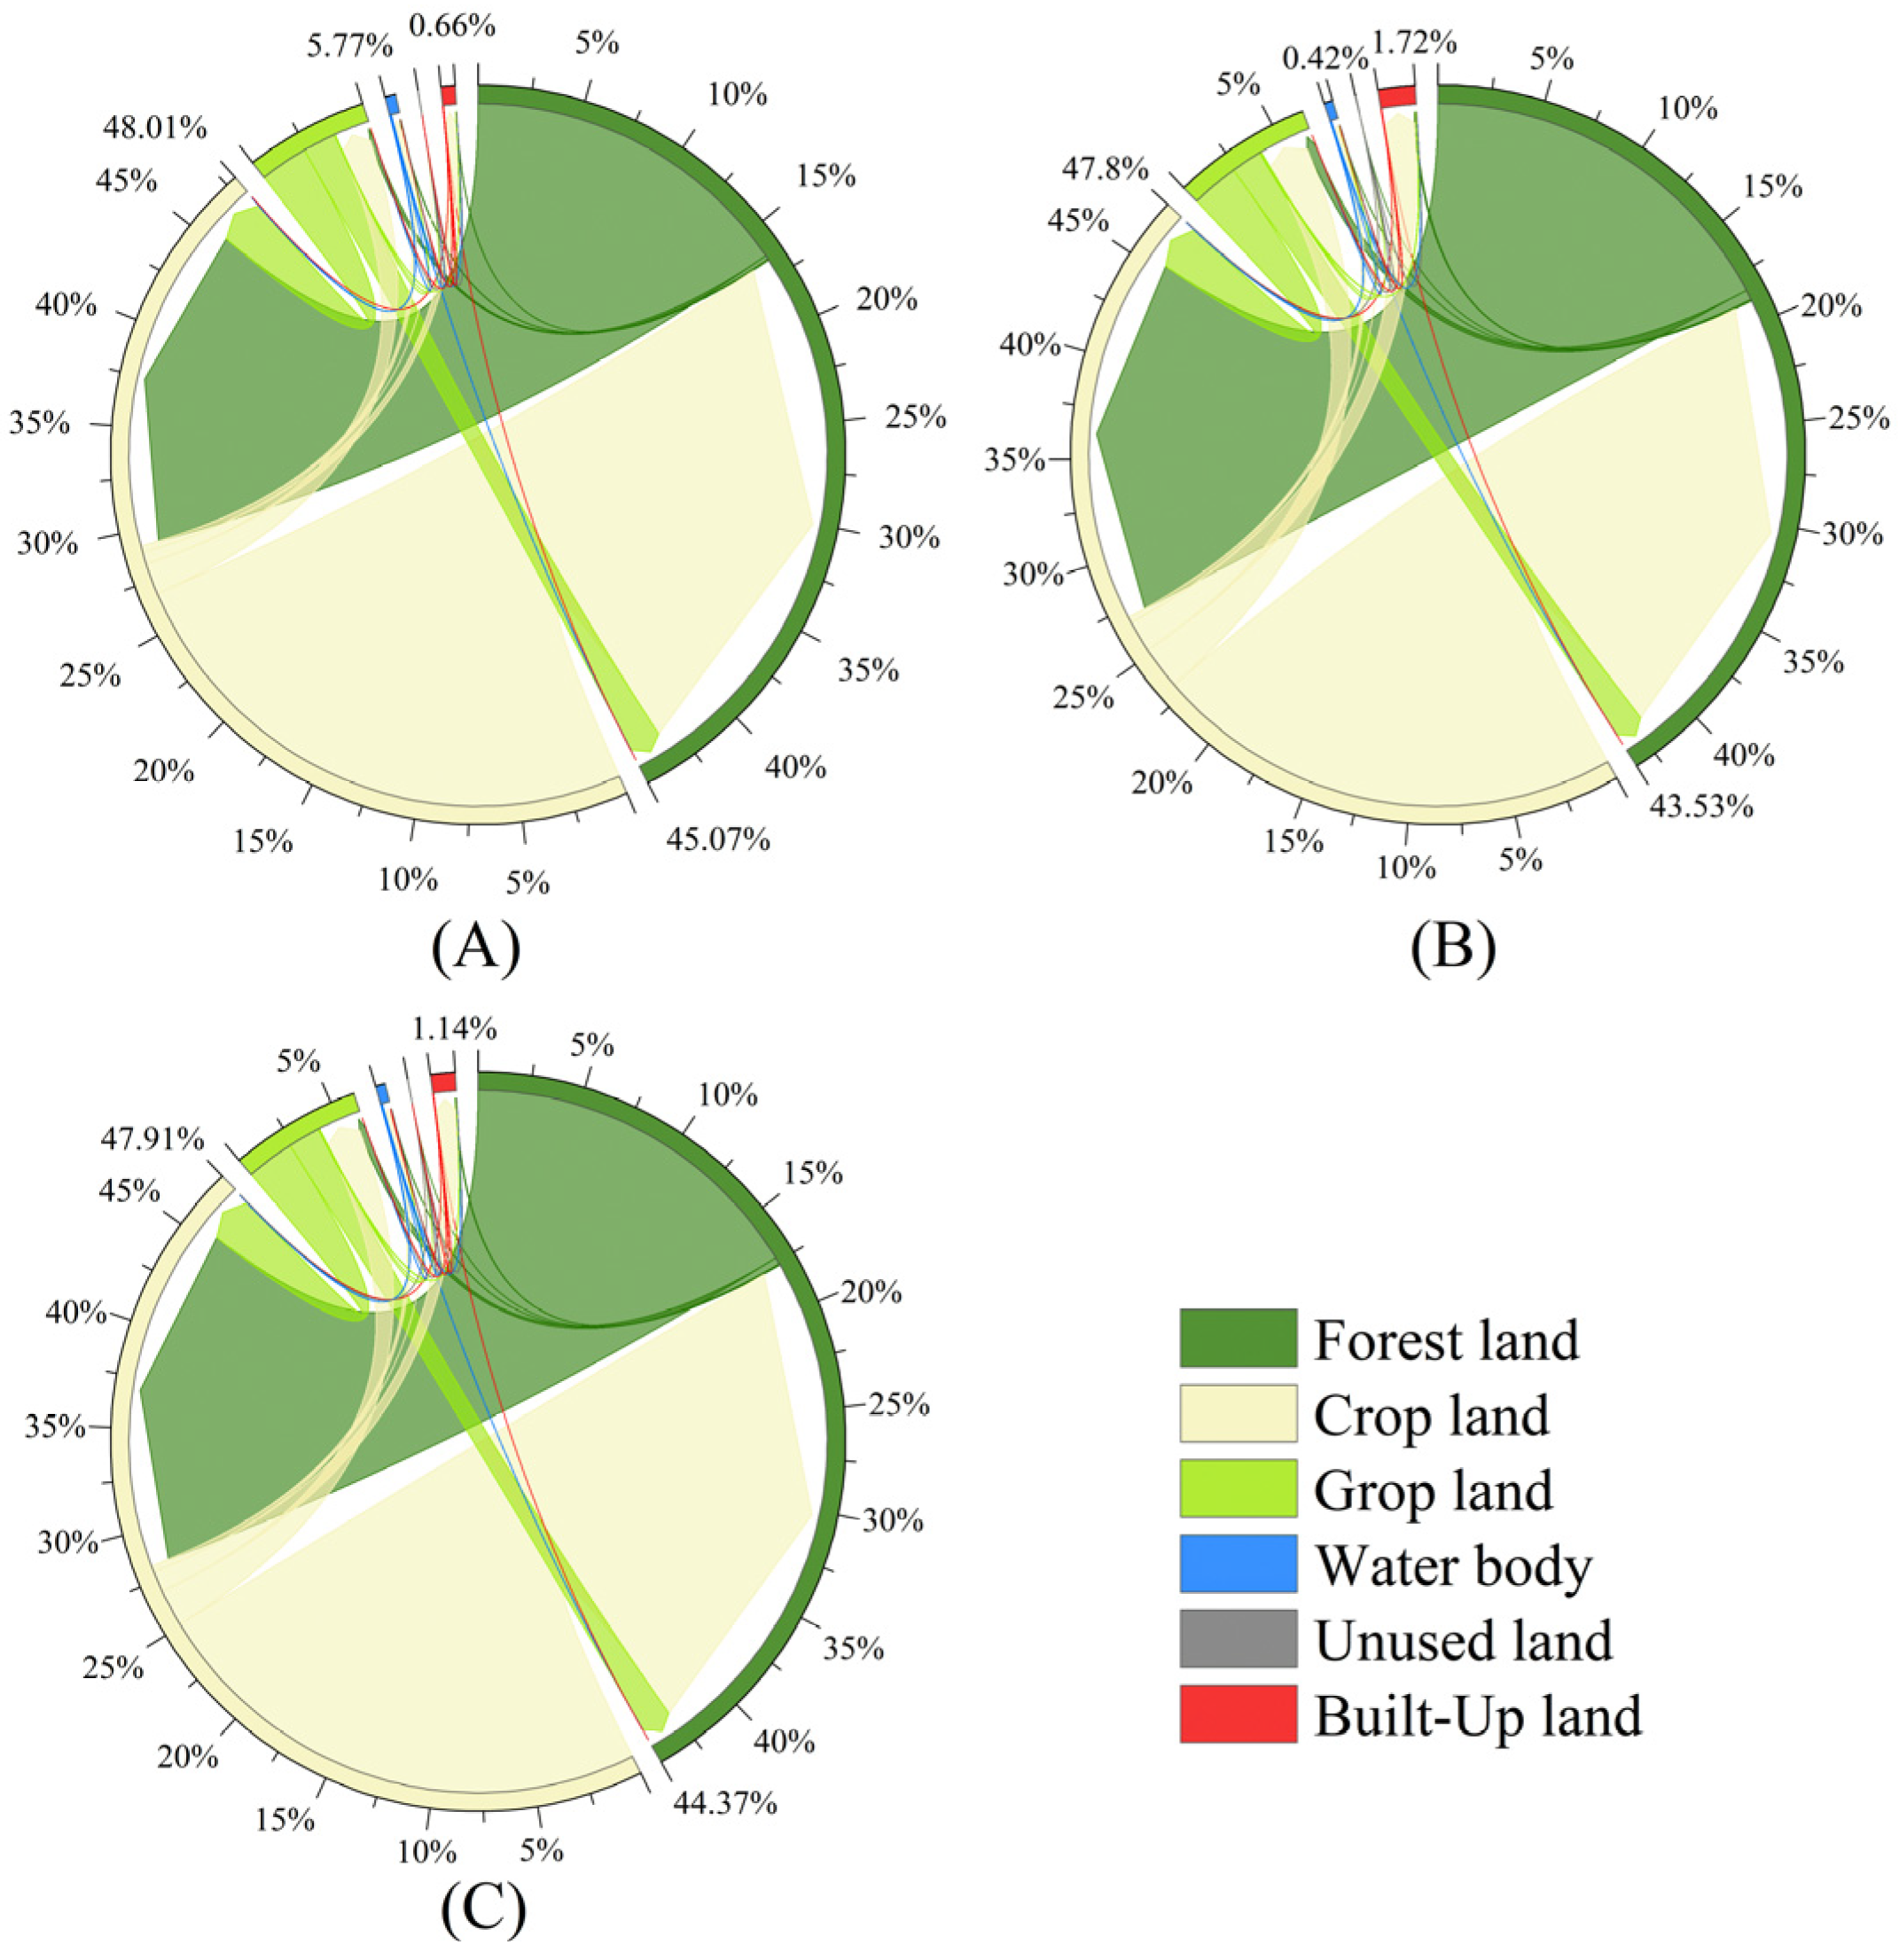
3.1.1. LUCC in 2000–2020

As shown in Figure 4 and Table 4, in 2000–2020, the major land use type in Guizhou Province was forest land, accounting for more than 59% of the total area of the study area, and the areas with large forest patches were mainly distributed in the karst mountains and hills, as well as the river valleys in the east and southeast. Secondly, more than 33% of the cropland resides in the karst basins in the western, northern, and central regions of Guizhou Province, with cropland in the central region being more concentrated and contiguous due to the influence of the terrain. The proportion of grassland only ranges from 1.33% to 2.23%, and it is mainly distributed in the karst peaks and depressions region in the west and southwest, where it is more dispersed due to the influence of the fragmented land surface. Less than 1% of the area comprises water bodies, unused land, and built-up land. From 2000 to 2010, the forest land area increased rapidly at an average rate of 5.51 × 10⁴ ha/a, while the cropland area decreased rapidly at an average rate of 4.87 × 10⁴ ha/a. In addition, grassland decreased by 0.61%, water bodies increased by 0.08%, and built-up land increased by 0.16%. Compared with the previous period, built-up land increased significantly in 2010–2020, with a growth rate of 0.37%; the increase in forest land and water bodies slowed down; the decrease in cropland and grassland slowed down; and the area of unused land remained more or less unchanged.
Analyzing the 2000–2020 LUCC in Guizhou Province (Figure 5), the land use conversions in both 2000–2010 and 2010–2020 occurred mainly in forest land, cropland, and grassland, and the general trend in each LUCC was similar, with some differences in scale. In 2000–2010 and 2010–2020, the forest land expansion area was mainly converted from cropland, accounting for about 91.64% and 85.42% of the area of cropland reduction, and about 94.19% and 93.86% of the area of forest land increase, respectively, which is the main direction of forest land expansion; however, this trend of expansion is gradually weakening. Meanwhile, more than 98.48% and 97.05% of the reduced area of forest land was converted into cropland, accounting for 87.21% and 88.47% of the expansion of cropland, respectively, which was the main source of the increase in the area of cropland. In addition, during the period 2000–2020, 84.21%, 81.19%, 79.80%, and 91.92% of the increase in the area of the land use types of grassland, built-up land, water bodies, and unused land, respectively, came from cropland.

3.1.2. Changes in Carbon Stocks, 2000–2020

As seen in Figure 6, the overall spatial distribution of carbon stocks shows a pattern of more in the east and less in the west, concentrated in small regions and dispersed in large regions. The high carbon values are mainly distributed in the karstic mountainous hills in the eastern and southeastern regions of Guizhou Province; it is the largest proportion of forest land (78.26%) in this region, followed by cropland (20.68%). Low carbon values are predominantly found in the midwestern region, which is dominated by karst basins, a region with extensive cropland (49.52%) and forest land (44.91%), as well as more grassland (3.31%) and built-up land (1.64%). The results of carbon stock estimation are shown in Table 5. The total amount is ranked in the order of forest land, cropland, grassland, built-up land, and unused land; the carbon stock of water bodies is 0.
The spatial and temporal changes in carbon stock in Guizhou Province are shown in Figure 7. In this study, the carbon stock changes are divided into three intervals, namely a significant increase (>3 t/ha), basically unchanged (−3~3 t/ha), and a significant decrease (<−3 t/ha). Most of the regions have carbon stock variations in the range of −3~3 t/ha, and the regions with significant increases or decreases in carbon stocks are scattered. There are more regions with significant increases in carbon stocks and fewer regions with significant decreases in 2010–2020 compared to 2000–2010. From 2000 to 2010, the province’s carbon stock increased by a total of 25.3 Tg. The carbon stock of cropland and grassland decreased, the carbon stock of forest land and built-up land increased, and the amount of carbon stored due to the increase in the area of forest land reached 146 Tg, which became the main contributor to carbon storage. The carbon emissions caused by the decrease in the area of cropland reached 104 Tg, which became the main contributor to carbon emissions. Compared to the previous period, the total carbon stock increase decreased by 23.3 Tg from 2010 to 2020, at which time the carbon stock increase in forest land decreased by 86 Tg but remained the main contributor to carbon storage, and the loss of cropland decreased by 50.3 Tg but remained the main contributor to carbon emissions. In 2000–2020, the increase in total carbon stocks continued to decline.

3.2. Multi-Scenario Projection of Carbon Stocks in 2030

3.2.1. LUCC Multi-Scenario Simulation

The PLUS model was used to simulate LUCC in Guizhou Province under different scenarios (Figure 8). In order to verify the reliability of the PLUS model, the simulation accuracy of the PLUS model needs to be verified [79,80]. On the basis of the 2010 land use data, the spatial distribution of land use in 2020 was predicted; compared with the real data in 2020, the total accuracy was 0.88 and the kappa was 0.79. Therefore, it meets the accuracy requirements for modeling LUCC [47] and can be used for LUCC prediction.
Analyzing the results of the transfer of land use types in 2030 under different scenarios (Figure 9), land use conversions in the NT scenario occur primarily between forest land, cropland, grassland, water bodies, and built-up land. Among them, the increase in forest land comes mainly from grassland, accounting for about 99.72% of the increase in forest land; the decrease in cropland is almost entirely transformed into built-up land, accounting for about 90.88% of the increase in built-up land, which is the main direction of the expansion of built-up land; the main source of the increase in grassland is water bodies; and the main source of the increase in water bodies is grassland.
Land use conversions in the EP scenario mainly occur between forest land, cropland, grassland, and built-up land. At this time, ecological protection becomes the most important goal, and cropland, grassland, and built-up land are converted in large quantities to forest land with a higher ecological value. Of this, about 24.50%, 99.92%, and 91.67% of the reduction in cropland, grassland, and built-up land, respectively, are converted to forest land, accounting for 31.35%, 22.49%, and 46.11% of the increase in forest land, respectively. In addition, more than 75.50% of the reduction in cropland is also converted to grassland, representing the main source of the increase in grassland.
Compared to the EP scenario, land use conversion in the ED scenario also occurs mainly between forest land, cropland, grassland, and built-up land, but the direction of land use transfer is the opposite of that in the EP scenario. The economic benefits of this scenario are greater than the ecological benefits, and with the further acceleration of socioeconomic development and urbanization and a massive exodus of the agricultural population to the cities, more than 57.14% of the cropland is degraded to grassland. About 27.16% of cropland is converted into built-up land, accounting for 89.88% of the increase in the area of built-up land, making it the main direction for the expansion of built-up land. The conversion of part of the cropland to forest land is the main source of the increase in the area of forest land, while substantial forest land is degraded to grassland as a result of the intensified utilization of forest resources.

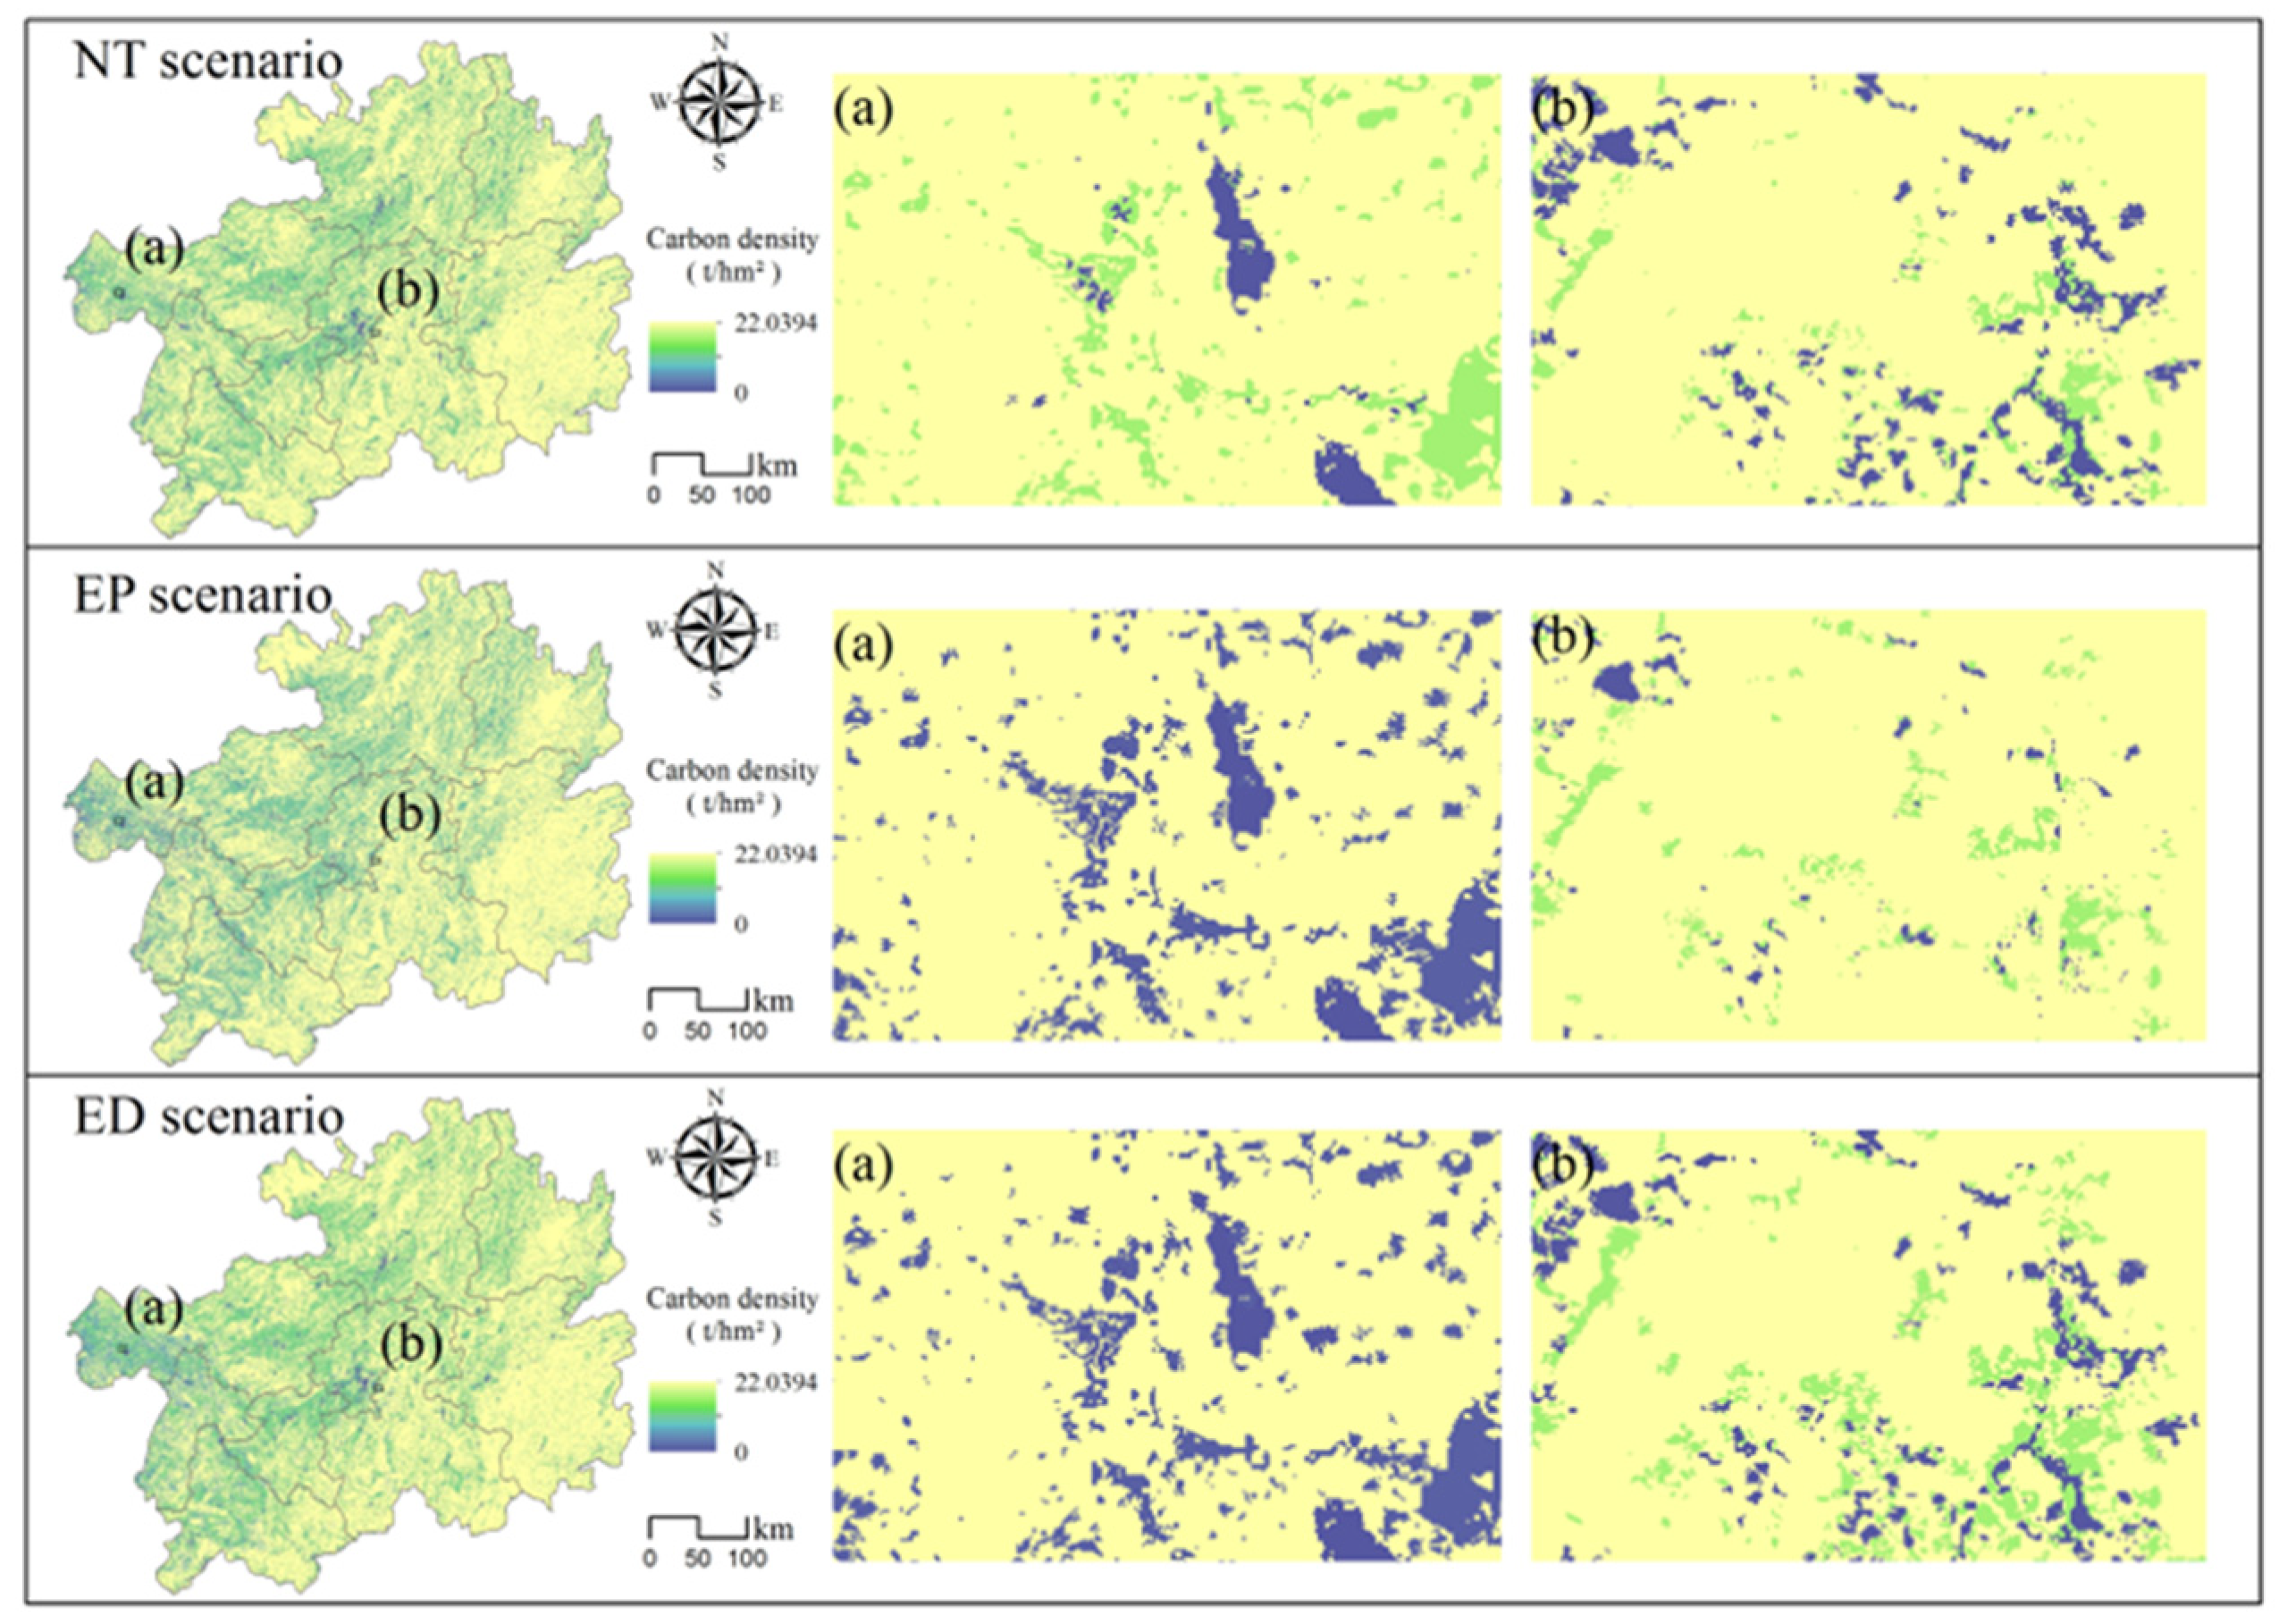
3.2.2. Carbon Stock Response to LUCC under Different Scenarios

Compared with 2000–2020, the overall distribution of carbon stocks changes little in 2030, with small differences in the distribution of carbon stocks between scenarios and significant localized differences in the distribution of carbon stocks (Figure 10). In Figure 11, the carbon stock changes in the karst plateau mountainous region in different scenarios from 2020 to 2030 are shown as follows: The NT scenario shows a significant increase in carbon stock changes in the range of about −3–3 t/ha, as well as the stabilization of carbon stock changes in the karst plateau mountains in 2030. Compared to the NT scenario, there are significantly more areas with significantly higher carbon stocks in the EP scenario, mainly in areas with a concentration of built-up land. On the contrary, there is an increase in the number of regions with significantly reduced carbon stocks in the ED scenario; they are mainly concentrated in the karst basins and river valleys in the midwestern Guizhou Province.
In different development scenarios in 2020–2030, the carbon stocks in Guizhou Province all shift from increasing to decreasing (Table 6). Among them, in the NT scenario, the carbon stock in Guizhou Province decreases by 1.86 Tg; the carbon stock increases by 6.02 Tg from the expansion of forest land, while cropland and grassland areas continue to decrease, and the carbon stock decreases by 0.86 Tg and 9.82 Tg due to the decrease in cropland and grassland, respectively. In the NT scenario, the carbon stock in Guizhou Province maintains a decreasing trend between 2020 and 2030. The reasons for the decrease in total carbon stocks are mainly related to the slowing down of the expansion of forested land, the rapid expansion of the built-up land area, and the significant decrease in the area of cropland and grassland. In the EP scenario, the total carbon stock decreases by a total of 0.18 Tg, with the carbon stock in cropland, unused land, and built-up land decreasing and the carbon stock in forest land and grassland increasing. The increase in carbon stocks contributed by forest land in 2030 under the ecosystem protection objective is 7.51 Tg, which is 1.49 Tg more than in the NT scenario. Grassland contributes 10.8 Tg of carbon stock gain and is the main contributor to carbon storage in the EP scenario, while the loss of carbon stock due to the reduction in the area of cropland is 15.8 Tg and is the main driver of carbon emissions. The total carbon stock in the ED scenario in 2030 reduces by 34.3 Tg. The carbon stock reduced by forest land is 88.7 Tg; grassland and built-up land are the main contributors to carbon storage, contributing 24.7 Tg and 22.1 Tg of the carbon stock, respectively.

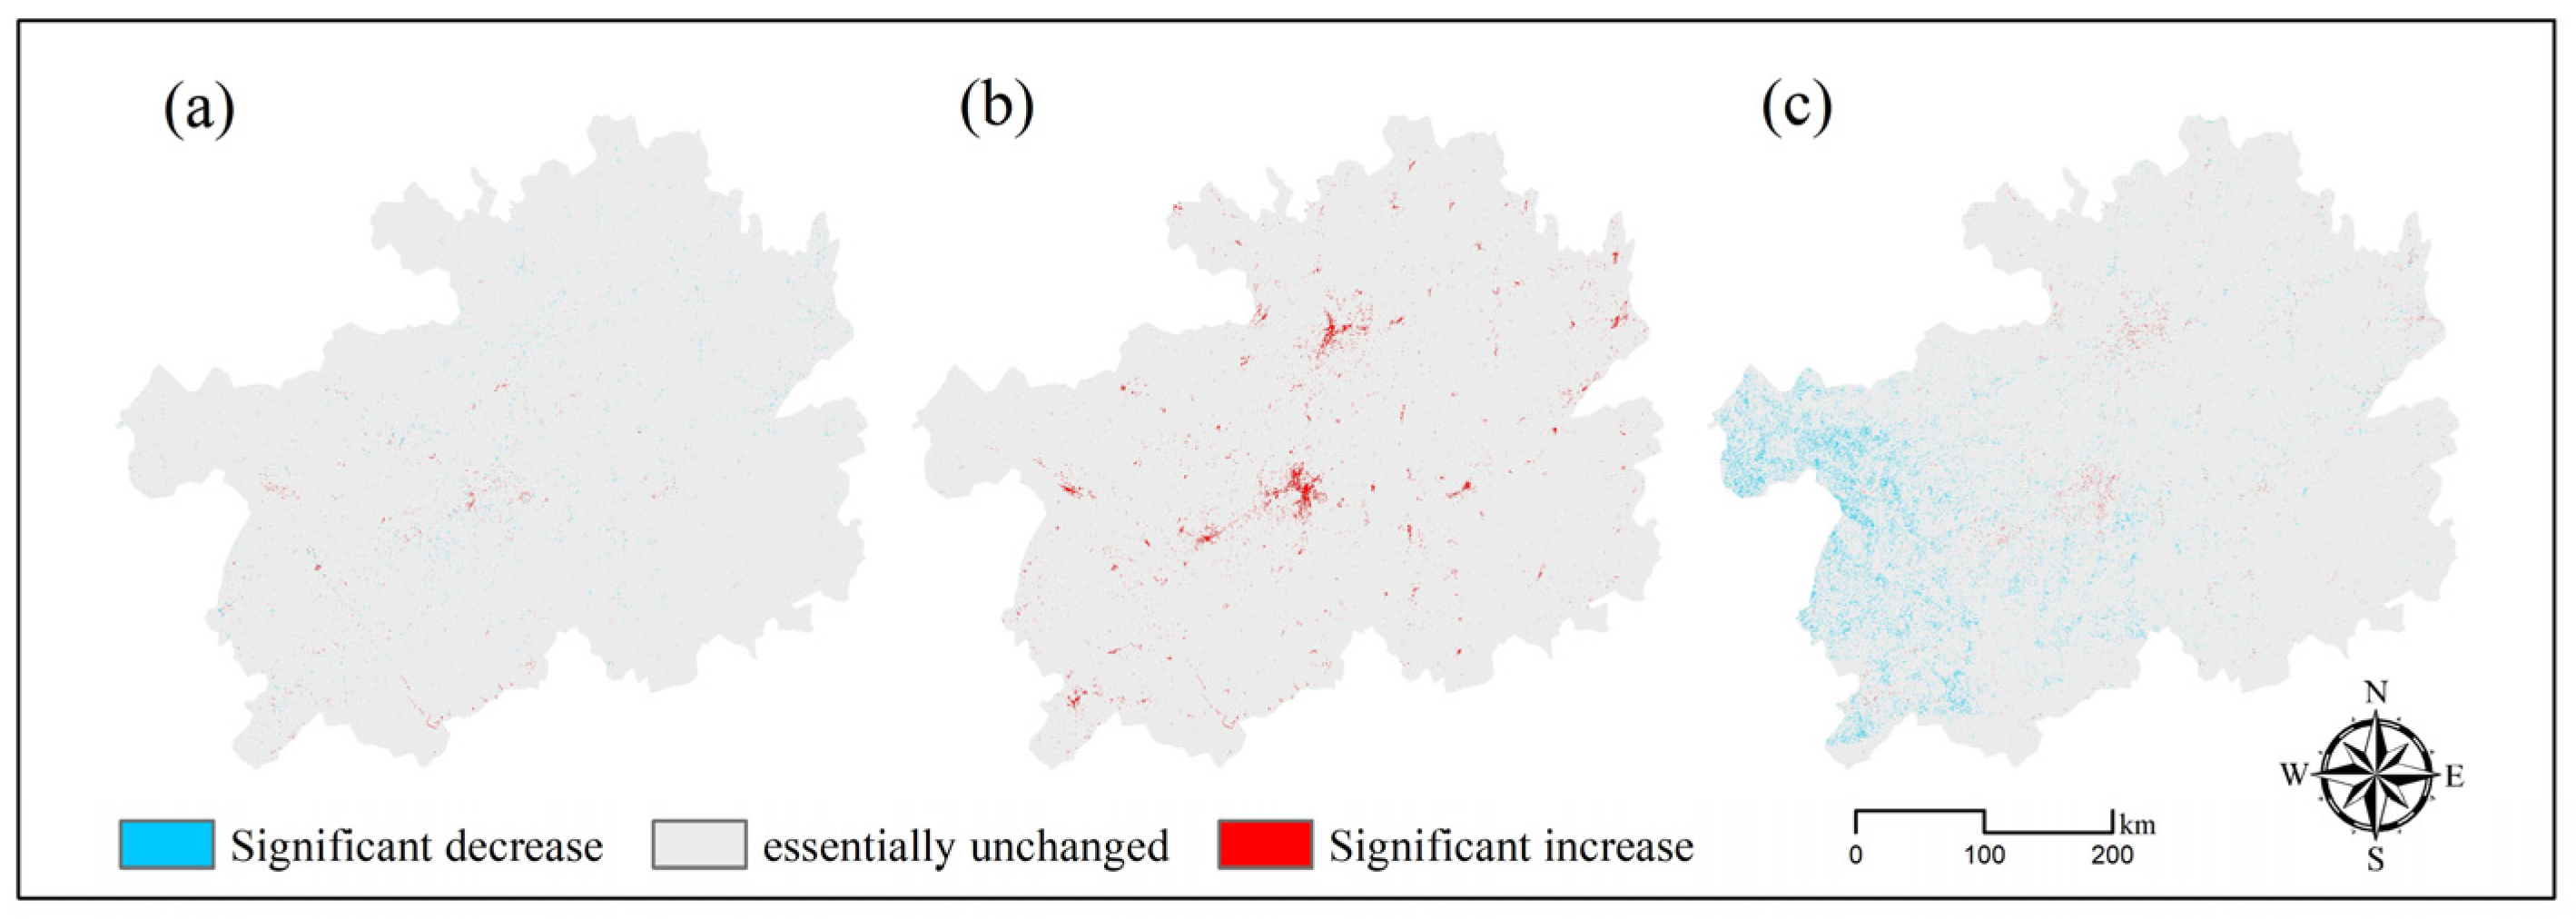
3.3. Vulnerability Analysis of ECS Services

Based on the area share of each land use type and the land use intensity index, the land use intensity of the corresponding year was obtained; combined with the results of carbon stock calculations, the potential impact index of vulnerability of interannual ECS services was obtained (Table 7). Between 2000 and 2020, the land use intensity in Guizhou Province showed a decreasing trend, with the rate of decrease changing from fast to slow; meanwhile, carbon stocks showed an increasing trend, with the speed changing from fast to slow. The PI values of −0.57 and −0.16 for the first and second decade, respectively, both show negative potential impacts, but the vulnerability of LUCC to carbon storage services is attenuated. Against the background of rapid socioeconomic development, land use intensity continued to decline from 2000 to 2020, decreasing by 3.13 over the 20-year period. Cropland has a high land use index, which decreased substantially during this period, and the area of forest land, which has the lowest land use index, expanded more. Although the land use index of built-up land is the highest, the proportion of built-up land expansion is far lower than those of cropland reduction and forest land expansion. Therefore, the regional land use intensity shows a decreasing trend thanks to the regional ecological environmental protection measures. As a large amount of arable land is converted into forest land, this becomes the main reason for the reduction in land use intensity. Along with the decrease in land use intensity, the regional ECS increased significantly; the ECS service function in the karst plateau mountainous areas was improved.
In the 2030 projection scenarios, the NT scenario shows an increase of 0.43 in land use intensity and a decrease of 1.86 Tg in carbon storage from 2020 to 2030. Due to the large reduction in the area of grassland with the lowest land use index, the expansion of forest land slows down; the area of forest land expansion mainly comes from grassland with the same land use index; and a substantial amount of cropland is converted into built-up land with a higher land use index level, which increases the land use intensity. The PI value is −0.24, and the vulnerability is slightly increased compared with 2010–2020. The PI value is still negative, indicating that the LUCC still has a negative impact on the ECS service. The EP scenario decreases land use intensity by 0.86. The LUCC in this period shifts the land use index from high to low, and the rapid expansion of forest and grassland is accompanied by a rapid decrease in cropland and built-up land, which leads to a rapid decrease in regional land use intensity. Due to the large-scale reduction in higher-carbon-intensity cropland, 0.18 Tg of the regional carbon stock is predicted to be reduced in 2020–2030. However, the PI value is 0.01, which turns from negative to positive, indicating that the LUCC contributes to the carbon storage service and effectively maintains the carbon balance of the regional ecosystem. The ED scenario shows that, in 2030, the land use intensity is increased to 236.71, and the carbon stock is reduced by 34.3 Tg and reaches its lowest value. This is related to the large-scale reduction in regional forest land area and the rapid increase in the area of built-up land. At this time, the PI value is −1.00. Compared with 2000–2020, the potential negative impact index in the ED scenario increases significantly. This indicates that the negative impact of LUCC on the ECS service is expanded.
The PI values under different development scenarios accurately reflect the service functions of the regional ECS. According to the NT scenario, the negative impact of LUCC on ECS in Guizhou Province in 2030 is slightly increased. The LUCC of the EP scenario is the most favorable for the carbon storage service of the karst plateau mountain ecosystems; on the contrary, the LUCC of the ED scenario leads to a rapid increase in the regional ECS service’s vulnerability. In the future, the relationship between ecological protection and socioeconomic development should be fully coordinated so that land use can be more rationalized and the vulnerability of ECS services can be further mitigated.

4. Discussion

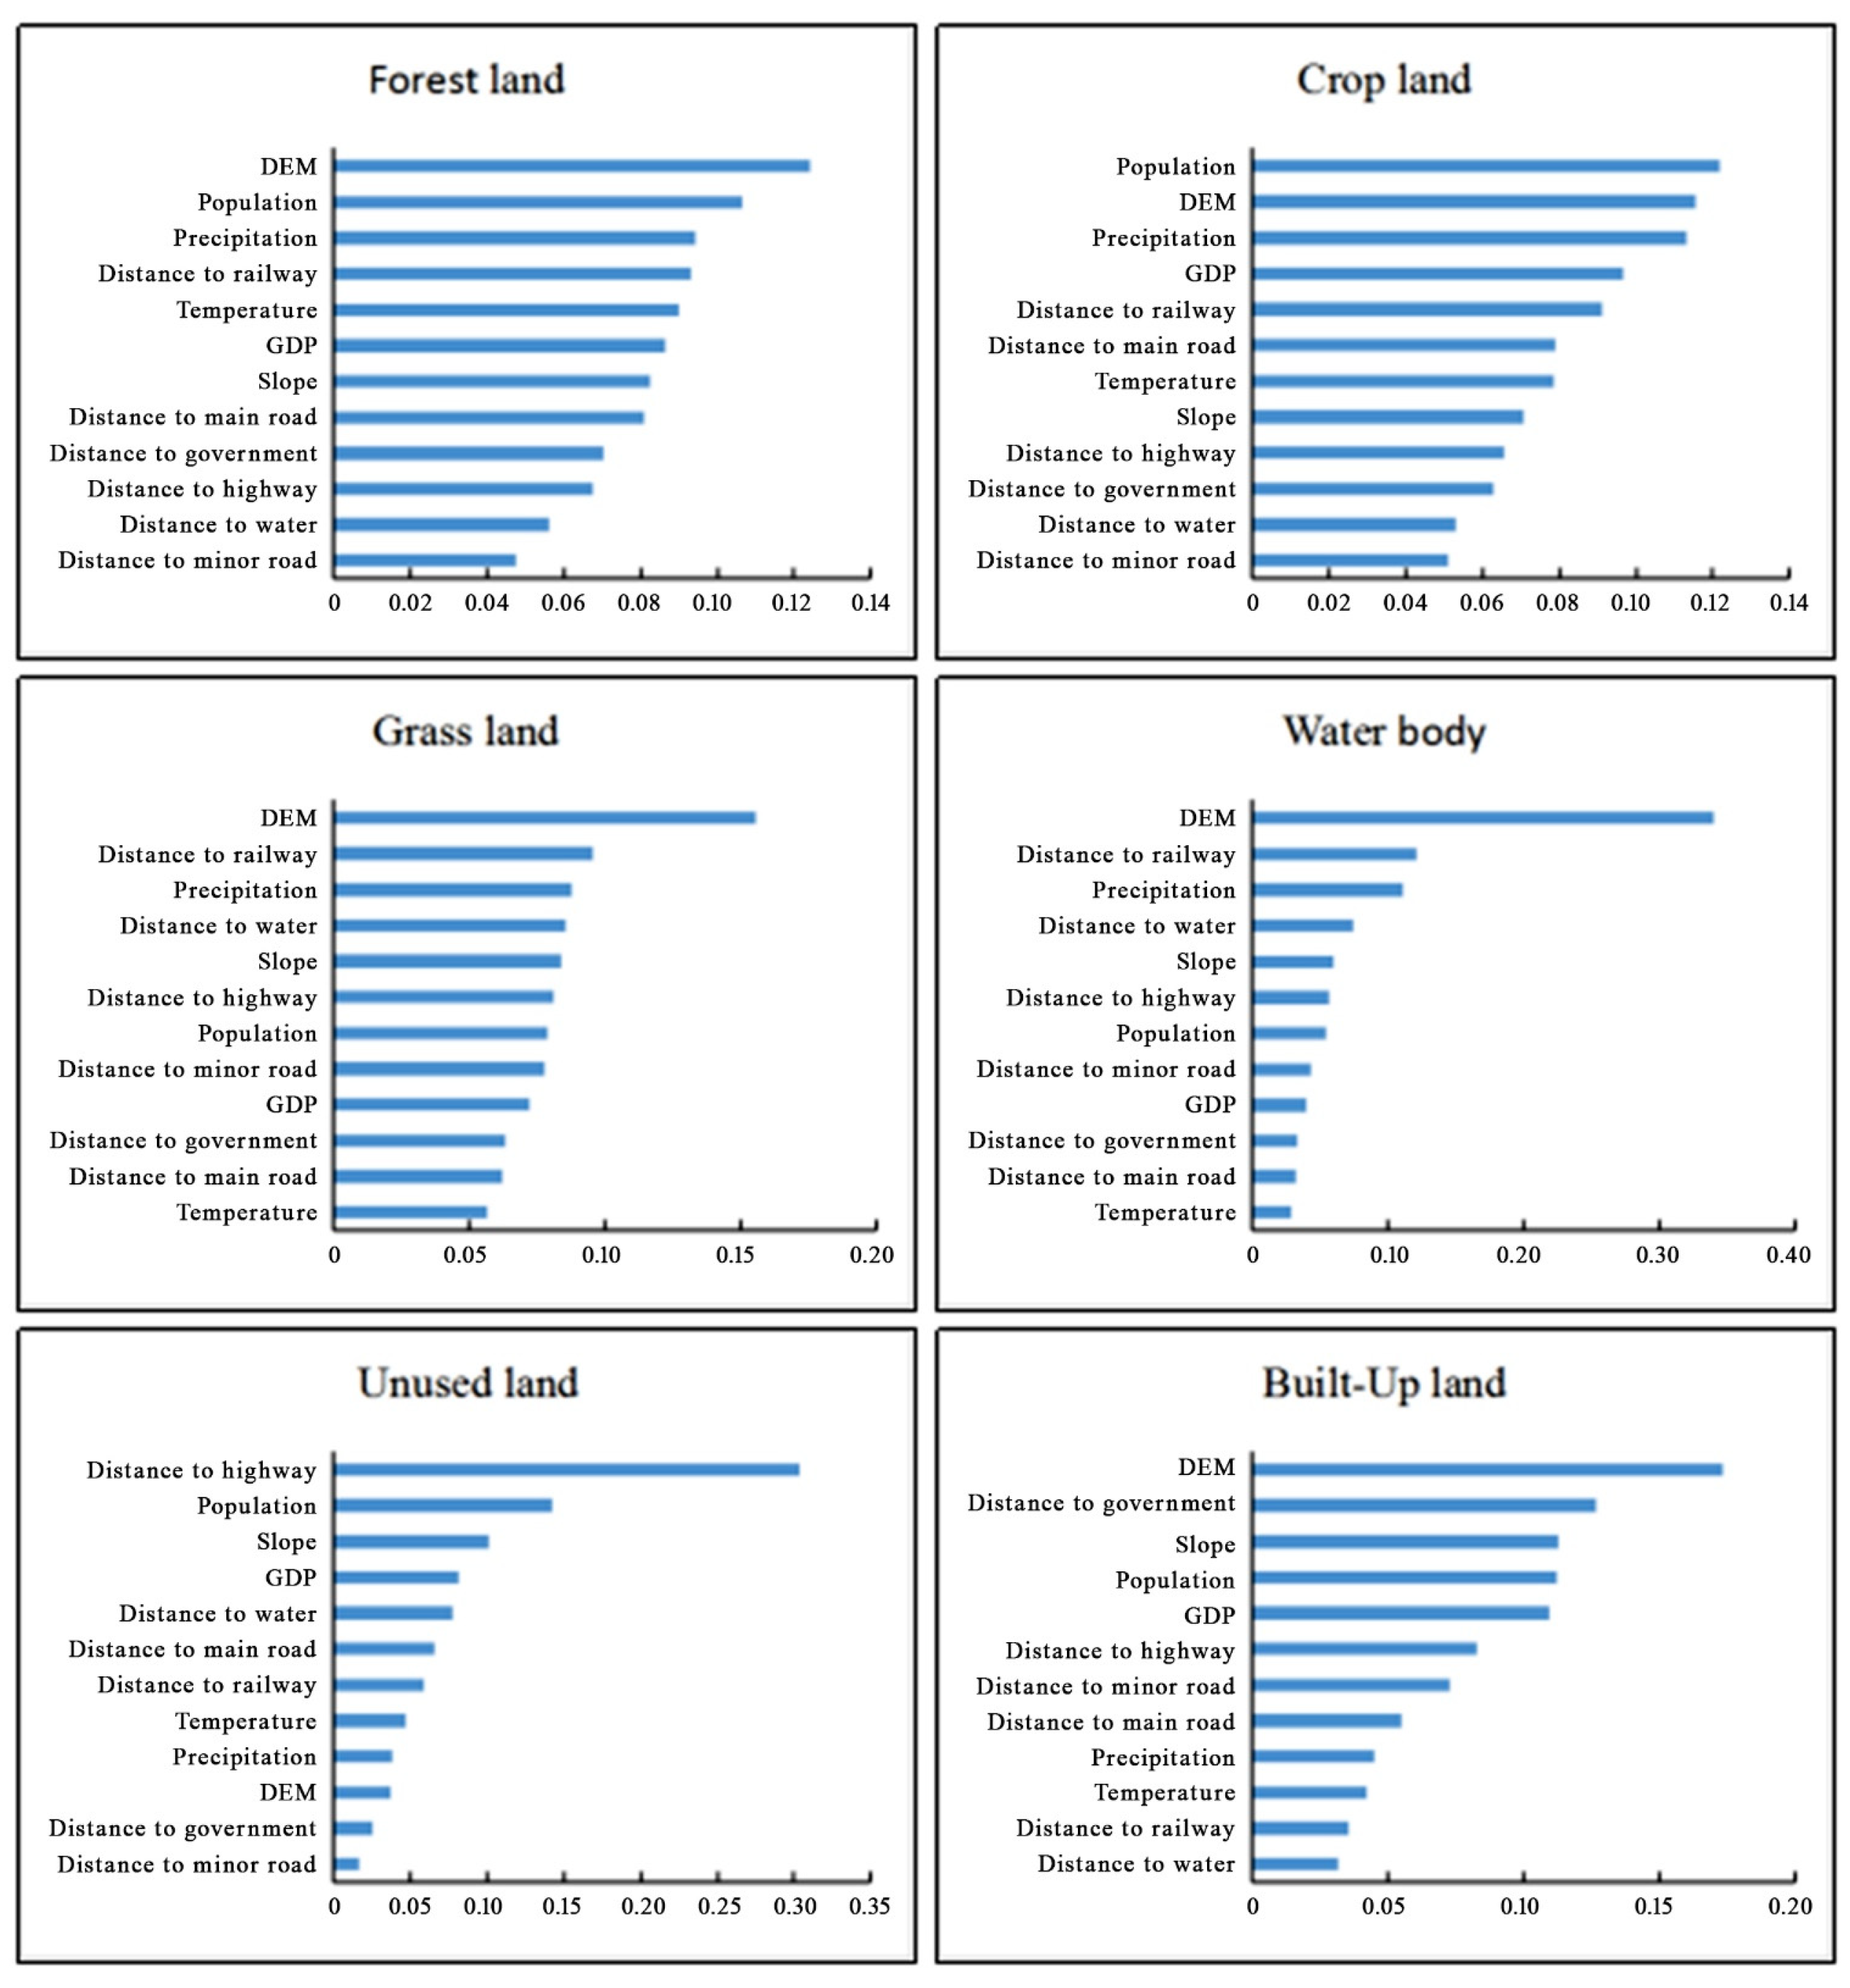
4.1. Analysis of the Contribution of LUCC Drivers

LUCC is usually driven by a number of natural and social factors. Based on the LEAS module of the PLUS model, which calculates the contribution of drivers to changes in land use types, the higher the percentage of the contribution value of the driver factor, the higher its contribution, and the greater the driving force for LUCC.
In Figure 12, the largest contribution to forest land is provided with the DEM, with a contribution of more than 0.12. The landscape of Guizhou Province is mostly mountainous and hilly, accounting for 92.50% of the province’s area, and the basin area only covers 7.50% of the land, with large changes in topographic relief [8,81]. The topography has become a major factor affecting the expansion of forest land. Population also has a significant influence on the expansion of forest land in mountainous areas of the karst plateau. A study by Fan et al. [82] showed that the expansion of the forest land area is more likely in areas with low population density and a relatively weak intensity of human activities. The most significant contributing factors to cropland expansion were population, DEM, and precipitation, indicating that cropland expansion is more influenced by population density, which is consistent with the findings of Chen et al. [83]. Compared to other factors, the DEM contribution to grassland expansion exceeds 0.15. The other drivers have small differences in contribution values, with contributions centrally distributed between 0.05 and 0.10, suggesting that topography is the main factor influencing grassland expansion. The most prominent impacts on water body land and unused land expansion are DEM and distance to highway, respectively, which contribute much more than the other drivers. The largest contributor to built-up land is DEM, with a contribution of over 0.17. In addition, the contributions of the distance from county government sites, slope, population, and GDP all exceed 0.10. However, socioeconomic factors including the distance from the county government sites, population, and GDP drive the outward expansion of built-up land. Wu et al. [84] also pointed out that socioeconomics is an important factor influencing the expansion of built-up land.
LUCC in Guizhou Province is affected by the intersection of natural and socioeconomic factors. Among the drivers, the contribution of DEM to LUCC is high in all land use types except for unused land, indicating that topography plays an important role in LUCC in karst plateau mountainous areas.

4.2. Carbon Stock Response to LUCC in Mountainous Areas of the Karst Plateau

Because of the differences in carbon storage capacity between different land use types, shifts in land use types inevitably lead to changes in carbon stocks (Figure 13). Existing studies have shown that forests, as the largest carbon reservoir in terrestrial ecosystems, have the highest carbon stocks among the various land use types. This result has been verified in the same way in other regions. For example, Hayes et al. [85] ostensibly showed that US forests are one of the most important carbon sinks in North America. Keit et al. [86] pointed out that eucalyptus forests in Australia have the highest biomass carbon density in the world. The destruction of forests is the main reason for the decline in carbon storage capacity of terrestrial ecosystems [14,15,87]. Cropland and grassland have the second highest carbon density after forest land [88]. Built-up land has a low carbon density and is a major source of carbon in terrestrial ecosystems [89]. Ecological projects can significantly increase terrestrial ECS [29], such as the Natural Forest Protection Project (NFCP) and the Returning Farmland to Forest Project (GFGP) [30,90], an ecological restoration program initiated by the Chinese government in the late 1990s. Among these projects, the implementation of the GFGP has transformed a large amount of cropland on the steep slopes of karst plateau mountainous areas into forest land or grassland [90,91], and the expansion of forest land area has effectively increased the carbon storage capacity of ecosystems in karst plateau mountainous areas.
In 2000–2020, the area of forest land converted from cropland was 2.17 × 10⁶ ha, accounting for 94.05% of the total expansion of forest land, with a net increase in the carbon stock of 114 Tg. Socioeconomic development and the acceleration of industrialization and urbanization will result in more land being converted to built-up land, causing a decline in regional carbon stocks and an increase in carbon emissions [92]. Since 2006, Guizhou Province has been actively promoting industrialization and urbanization. As a result, forest land, cropland, and grassland with high carbon density are converted into built-up land with relatively low carbon density, leading to a decrease in regional carbon density and a weakening of the service function of the regional ecosystem [93]. Socioeconomic development, in turn, promotes the expansion of built-up land to a wider range of forest land, cropland, and grassland, leading to the deterioration of the ecosystem service function of the karst plateau mountainous areas and the continuous reduction in terrestrial ECS. During the period of 2000–2020, the area of built-up land converted from forest land, cropland, and grassland in Guizhou Province was 9.56 × 10⁴ ha, accounting for 99.25% of the area of built-up land expansion, resulting in the loss of 13.7 Tg of the carbon stock.
As China has committed to the ambitious goal of achieving peak carbon by 2030 [94], it is necessary to explore the response of carbon stocks in the karst plateau mountainous region to LUCC in 2030. According to the NT scenario, the total carbon stock in Guizhou Province will decrease by 1.86 Tg in 2030, and the main reason for the carbon loss is the conversion of high-carbon-intensity cropland to lower-carbon-intensity built-up land. As a result of rapid socioeconomic development, a large proportion of the agricultural population is migrating to cities, which, while driving the development of the urban economy, also promotes the process of urbanization, and the expansion of the urban scale extends to cropland, leading to the weakening of the regional ECS capacity. The above results are consistent with previous studies. Xiang et al. [95], in their study on the response of carbon stocks to LUCC in the main urban area of Chongqing, found that, with rapid socioeconomic development and the acceleration of industrialization and urbanization, built-up land has been continuously expanding to cropland, which has resulted in a large reduction in the carbon stock in the region, as the carbon sequestration capacity of built-up land is much lower than that of cropland. In addition, the substantial conversion of grassland to forest land in the karst plateau mountainous region has led to an increase in regional carbon density, which has increased the carbon stock in this region and effectively replenished the carbon stock lost due to the conversion of cropland to built-up land.
The EP scenario realizes the restoration of the ecological environment by expanding the area of forest land and grassland, and improves the ECS capacity of the karst plateau mountainous area, which increases the carbon storage capacity by 1.68 Tg compared with the NT scenario. Contrary to the EP scenario, the ED scenario is an all-out effort to develop socioeconomics and accelerate urbanization at the expense of ecological and environmental protection. At this time, the area of forested land decreases, the regional carbon density decreases, and the carbon stock in the karst plateau mountainous area decreases dramatically, predicting a reduction by 3.43 Tg in 10 years. With the reduction in large amounts of forest land and cropland, land use has shown a transformation from high-carbon-density land to low-carbon-density land, causing a significant carbon stock reduction [95]. The ED scenario lacks sources of carbon stock replenishment, and the loss of regional carbon stocks is more severe. This conclusion is supported by the findings of Hastie et al. [96] in their study on the risk of LUCC on carbon storage in Peruvian peatlands, where the conversion of forest land to urban land, mines, and cropland in high-carbon-density tropical peatlands affected by human activities leads to the release of regionally sequestered carbon and a decrease in carbon density.

4.3. ECS Service Vulnerability

Since the implementation of the NFCP (2000) and GFGP (1999) programs, the function of the karst plateau mountainous area’s ECS has been significantly improved [97]. The vulnerability of ECS services in karst plateau mountainous areas shows a negative potential impact during the period of 2000–2020, but the vulnerability decreases. As a result of the implementation of the policy of returning farmland to forests, the area of forest land with a high carbon density has increased rapidly, effectively improving the function of ECS services [98,99]. However, with the acceleration of industrialization and urbanization, the rapid expansion of built-up land has reduced the carbon density of this region [100]. Additionally, as the large expansion of forest land area effectively offsets the loss of carbon stocks due to the expansion of built-up land, the expansion of forest land has also led to a sustained reduction in the intensity of regional land use, which has greatly improved the functioning of the ECS in the entire karst plateau mountainous region. Pellikka et al. [101], in their study of the effect of LUCC on the carbon stock in Kenya, similarly found that the increase in high-carbon-density forest land can effectively offset the loss of carbon stocks due to the expansion of low-carbon-density cropland to forest land, thereby increasing regional carbon stocks. Therefore, although the area of built-up land has expanded rapidly due to rapid socioeconomic development, it is not the main cause of the vulnerability of regional ECS services. Coordinating the relationship between various land uses, protecting forest land with high carbon density, achieving the reasonable expansion of built-up land, and integrating the planning and management of land use can effectively mitigate the negative impact of LUCC on ECS.
Similarly, in response to China’s goal of achieving “peak carbon” by 2030, it is also important to study the vulnerability of ECS services in the karst plateau mountainous region in 2030. In the NT scenario, LUCC in the karst plateau mountainous region in 2030 still exhibits a negative potential impact on carbon storage services. During the period 2020–2030, integrated spatial control in the context of urbanization needs to be strengthened so that the land use structure is optimized [93], expanding the area of high-carbon-density ecological land and reducing the impact of building land expansion on carbon stocks so that the vulnerability of ECS services is reduced. The EP scenario focuses on eco-environmental protection, making land use planning more ecologically civilized and socioeconomic development fully adapted to the ecological environment. Therefore, compared with the NT scenario, the land use intensity decreases by 1.26, the carbon stock increases by 1.68 Tg, the PI value changes from negative (−0.16) to positive (0.01), the perturbation of land use on the ecosystem carbon balance slows down, and the capacity of the ECS service is further improved, which is conducive to the ecological restoration of the ecologically fragile karst areas. On the contrary, in the ED scenario, the function of carbon storage services is declining and carbon emissions are accelerating. As a result, compared to the NT and EP scenarios, the ED scenario increases land use intensity by 1.44 and 2.70, respectively, and decreases carbon stocks by 32.4 Tg and 34.1 Tg. The negative potential impacts are the lowest of the three scenarios, and the vulnerability of the ECS service increases significantly.
The EP scenario involves rapid growth in forest area and a reduction in built-up land area, with the overall carbon intensity of the region increasing and land use intensity decreasing; thus, the ECS service function performs positively in response to LUCC. Joshua et al. [102], similarly, found that maintaining and expanding forested land areas and restricting urban sprawl based on policy measures can effectively improve ecosystem services and increase regional carbon storage. The results of the ED scenario are the opposite to those of the EP scenario, in which LUCC shows extreme vulnerability to the services of the ECS; in order to change this situation, it is necessary to strengthen land management measures, strictly formulate ecological protection policies, and promote the expansion of forest land. Joshua et al. also point out that enhancing forest land expansion is better for storing carbon than restricting urban expansion, and this conclusion is consistent with the results of this study regarding the ECS service function of LUCC during the period of 2000–2020.

4.4. Limitations and Prospects

In this study, carbon stock estimation and the vulnerability assessment of ECS services were carried out on the provincial scale, which can reveal the overall regional pattern to a certain extent. However, due to the strong spatial heterogeneity of the karst plateau mountainous region, there are certain differences in the natural environment and socioeconomic development at different spatial scales, and it is not possible to accurately take into account the actual situation at different spatial scales in the implementation of strategy. In the future, research will partition the region into geographic units according to the spatial heterogeneity of the karst plateau mountainous areas and include more data on the natural environment and socioeconomic development. When studying the vulnerability of ECS services in subregions, studies should not ignore the land use policy of the subregions, and they should explore the changes in the carbon stock and the ECS service function of the different subregions in a targeted way, as well as put forward appropriate land use planning and management strategies, while at the same time combining the natural and socioeconomic conditions of the different subregions and fully considering the operability of the strategies.
In addition, regional scales are too large for carbon density measurements to be as convenient and accurate as smaller scales, and carbon density values may have some bias. Carbon density also varies with climatic conditions, with differences in carbon density between paddy and dry fields, which both count as cropland, changes in tree age [103], and the conversion of different tree species [104] also leading to changes in carbon density. Therefore, it is necessary for future studies to conduct large-scale sampling experiments to obtain more accurate carbon density data, and to improve the accuracy of regional ECS estimation by fully considering the effect of phenological changes on carbon density.

5. Conclusions

Combined with the PLUS-InVEST model, quantitatively revealing the impact of LUCC on carbon stocks under multiple scenarios and analyzing the vulnerability of ECS services are of great significance for maintaining the carbon cycle and ecological security of regional terrestrial ecosystems. The main conclusions are as follows:
Forest land plays an important role in improving ECS services in the karst plateau mountainous region. From 2000 to 2020, the massive expansion of forest land area in the context of rapid socioeconomic development effectively offset the loss of carbon stocks due to the expansion of built-up land, resulting in an increase in carbon stocks in Guizhou Province. The expansion of forest land also leads to a sustained reduction in the land use intensity in Guizhou Province, which greatly improves the function of ECS in karst plateau mountainous areas.
In the NT scenario, a large amount of cropland is converted into built-up land and the expansion of forest land slows down, implying that the carbon stock in Guizhou Province will decrease by 1.86 Tg, and the vulnerability of ECS services in karst plateau mountainous areas increases slightly. In the EP scenario, due to ecological protection, a large amount of cropland and built-up land will be converted into forest land and grassland with a higher ecological value in Guizhou Province, the land use intensity decreases, and the ECS service function performs positively for LUCC in karst plateau mountainous areas. In the ED scenario, socioeconomic development becomes the main goal, a large amount of cropland is converted into built-up land, and a large amount of forest land is degraded to grassland, resulting in the serious loss of the carbon stock, a rapid increase in land use intensity, and enhanced vulnerability of ECS services in karst plateau mountainous areas.

Author Contributions

All authors contributed to the manuscript. Conceptualization, Z.Z. and S.D.; methodology, S.D.; validation, D.H. and F.Z.; formal analysis, S.D.; data curation, S.D. and D.H.; writing—original draft preparation, S.D.; writing—review and editing, S.D., Z.Z., D.H., F.Z., F.D. and Y.Y.; visualization, S.D. and D.H.; project administration, Z.Z.; funding acquisition, Z.Z. All authors have read and agreed to the published version of the manuscript.

Funding

This research was funded by Guizhou Provincial Key Technology R&D Program (Qiankehe Support (2023) General 211), the National Natural Science Foundation of China (41661088), and the Guizhou Province High-level Innovative Talent Training Plan “Hundred” Level Talents (Qiankehe Platform Talents (2016) 5674).

Data Availability Statement

All the data used in this study are mentioned in Section 2, “Materials and Methods”.

Acknowledgments

The authors gratefully acknowledge the financial support of Guizhou Normal University. We would also like to thank the experts for their helpful and productive comments on the manuscript.

Conflicts of Interest

The authors declare no conflict of interest. The funders had no role in the design of the study; in the collection, analyses, or interpretation of data; in the writing of the manuscript; or in the decision to publish the results.

References

  1. Lempert, R.J. Measuring global climate risk. Nat. Clim. Change 2021, 11, 805–806. [Google Scholar] [CrossRef]
  2. Mazdiyasni, O.; AghaKouchak, A. Substantial increase in concurrent droughts and heatwaves in the United States. Proc. Natl. Acad. Sci. USA 2015, 112, 11484–11489. [Google Scholar] [CrossRef]
  3. Noyes, P.D.; McElwee, M.K.; Miller, H.D.; Clark, B.W.; Van Tiem, L.A.; Walcott, K.C.; Erwin, K.N.; Levin, E.D. The toxicology of climate change: Environmental contaminants in a warming world. Environ. Int. 2009, 35, 971–986. [Google Scholar] [CrossRef]
  4. O’Neill, S. COP26: Some Progress, But Nations Still Fiddling While World Warms. Engineering 2022, 11, 6–8. [Google Scholar] [CrossRef]
  5. Chen, B.; Xu, C.; Wu, Y.; Li, Z.; Song, M.; Shen, Z. Spatiotemporal carbon emissions across the spectrum of Chinese cities: Insights from socioeconomic characteristics and ecological capacity. J. Environ. Manag. 2022, 306, 114510. [Google Scholar] [CrossRef]
  6. Niu, L.; Shao, Q. Soil Conservation Service Spatiotemporal Variability and Its Driving Mechanism on the Guizhou Plateau, China. Remote Sens. 2020, 12, 2187. [Google Scholar] [CrossRef]
  7. Zhuo, C.; Deng, F. How does China’s Western Development Strategy affect regional green economic efficiency? Sci. Total Environ. 2020, 707, 135939. [Google Scholar] [CrossRef]
  8. Pan, S.; Liang, J.; Chen, W.; Li, J.; Liu, Z. Gray Forecast of Ecosystem Services Value and Its Driving Forces in Karst Areas of China: A Case Study in Guizhou Province, China. Int. J. Environ. Res. Public Health 2021, 18, 12404. [Google Scholar] [CrossRef] [PubMed]
  9. Wan, D.; Liu, J.; Zhao, D. Assessment of Carbon Storage under Different SSP-RCP Scenarios in Terrestrial Ecosystems of Jilin Province, China. Int. J. Environ. Res. Public Health 2023, 20, 3691. [Google Scholar] [CrossRef]
  10. Xie, L.; Bai, Z.; Yang, B.; Fu, S. Simulation Analysis of Land-Use Pattern Evolution and Valuation of Terrestrial Ecosystem Carbon Storage of Changzhi City, China. Land 2022, 11, 1270. [Google Scholar] [CrossRef]
  11. Houghton, R.A. Revised estimates of the annual net flux of carbon to the atmosphere from changes in land use and land management 1850–2000. Tellus B Chem. Phys. Meteorol. 2003, 55, 378–390. [Google Scholar]
  12. Richards, D.R.; Thompson, B.S.; Wijedasa, L. Quantifying net loss of global mangrove carbon stocks from 20 years of land cover change. Nat. Commun. 2020, 11, 4260. [Google Scholar] [CrossRef] [PubMed]
  13. Marques, A.; Martins, I.S.; Kastner, T.; Plutzar, C.; Theurl, M.C.; Eisenmenger, N.; Huijbregts, M.A.; Wood, R.; Stadler, K.; Bruckner, M.; et al. Increasing impacts of land use on biodiversity and carbon sequestration driven by population and economic growth. Nat. Ecol. Evol. 2019, 3, 628–637. [Google Scholar] [CrossRef]
  14. Winkler, K.; Yang, H.; Ganzenmüller, R.; Fuchs, R.; Ceccherini, G.; Duveiller, G.; Grassi, G.; Pongratz, J.; Bastos, A.; Shvidenko, A.; et al. Changes in land use and management led to a decline in Eastern Europe’s terrestrial carbon sink. Commun. Earth Environ. 2023, 4, 237. [Google Scholar] [CrossRef]
  15. Woodbury, P.B.; Heath, L.S.; Smith, J.E. Land use change effects on forest carbon cycling throughout the southern United States. J. Environ. Qual. 2006, 35, 1348–1363. [Google Scholar] [CrossRef]
  16. Schulp, C.J.; Nabuurs, G.-J.; Verburg, P. Ecosystems; Environment. Future carbon sequestration in Europe—Effects of land use change. Agric. Ecosyst. Environ. 2008, 127, 251–264. [Google Scholar] [CrossRef]
  17. Brinck, K.; Fischer, R.; Groeneveld, J.; Lehmann, S.; Dantas De Paula, M.; Pütz, S.; Sexton, J.O.; Song, D.; Huth, A. High resolution analysis of tropical forest fragmentation and its impact on the global carbon cycle. Nat. Commun. 2017, 8, 14855. [Google Scholar] [CrossRef] [PubMed]
  18. Mugabowindekwe, M.; Brandt, M.; Chave, J.; Reiner, F.; Skole, D.L.; Kariryaa, A.; Igel, C.; Hiernaux, P.; Ciais, P.; Mertz, O. Nation-wide mapping of tree-level aboveground carbon stocks in Rwanda. Nat. Clim. Change 2023, 13, 91–97. [Google Scholar] [CrossRef] [PubMed]
  19. Seidl, R.; Schelhaas, M.-J.; Rammer, W.; Verkerk, P.J. Increasing forest disturbances in Europe and their impact on carbon storage. Nat. Clim. Change 2014, 4, 806–810. [Google Scholar] [CrossRef]
  20. Chang, J.; Ciais, P.; Gasser, T.; Smith, P.; Herrero, M.; Havlík, P.; Obersteiner, M.; Guenet, B.; Goll, D.S.; Li, W. Climate warming from managed grasslands cancels the cooling effect of carbon sinks in sparsely grazed and natural grasslands. Nat. Commun. 2021, 12, 118. [Google Scholar] [CrossRef]
  21. Yang, Y.; Tilman, D.; Furey, G.; Lehman, C. Soil carbon sequestration accelerated by restoration of grassland biodiversity. Nat. Commun. 2019, 10, 718. [Google Scholar] [CrossRef]
  22. Zhang, L.; Zhou, G.; Ji, Y.; Bai, Y. Grassland carbon budget and its driving factors of the subtropical and tropical monsoon region in China during 1961 to 2013. Sci. Rep. 2017, 7, 14717. [Google Scholar] [CrossRef] [PubMed]
  23. Gosling, P.; van der Gast, C.; Bending, G. Converting highly productive arable cropland in Europe to grassland:–a poor candidate for carbon sequestration. Sci. Rep. 2017, 7, 10493. [Google Scholar] [CrossRef] [PubMed]
  24. Ogle, S.M.; Breidt, F.J.; Del Grosso, S.; Gurung, R.; Marx, E.; Spencer, S.; Williams, S.; Manning, D. Counterfactual scenarios reveal historical impact of cropland management on soil organic carbon stocks in the United States. Sci. Rep. 2023, 13, 14564. [Google Scholar] [CrossRef] [PubMed]
  25. Shang, Z.; Cao, J.; Degen, A.; Zhang, D.; Long, R.J. A four year study in a desert land area on the effect of irrigated, cultivated land and abandoned cropland on soil biological, chemical and physical properties. CATENA 2019, 175, 1–8. [Google Scholar] [CrossRef]
  26. Levin, P.S.; Fogarty, M.J.; Matlock, G.C.; Ernst, M. Integrated ecosystem assessments. NOAA Tech. Memo. NMFS-NWFSC 2008, 92, 20. [Google Scholar]
  27. Zhang, S.; Xiong, K.; Qin, Y.; Min, X.; Xiao, J. Evolution and determinants of ecosystem services: Insights from South China karst. Ecol. Indic. 2021, 133, 108437. [Google Scholar] [CrossRef]
  28. Chen, J.; Yu, J.; Bai, X.; Zeng, Y.; Wang, J. Fragility of karst ecosystem and environment: Long-term evidence from lake sediments. Agric. Ecosyst. Environ. 2020, 294, 106862. [Google Scholar] [CrossRef]
  29. Tong, X.; Brandt, M.; Yue, Y.; Horion, S.; Wang, K.; Keersmaecker, W.D.; Tian, F.; Schurgers, G.; Xiao, X.; Luo, Y.; et al. Increased vegetation growth and carbon stock in China karst via ecological engineering. Nat. Sustain. 2018, 1, 44–50. [Google Scholar] [CrossRef]
  30. Qiu, S.; Peng, J.; Zheng, H.; Xu, Z.; Meersmans, J. How can massive ecological restoration programs interplay with social-ecological systems? A review of research in the South China karst region. Sci. Total Environ. 2022, 807, 150723. [Google Scholar] [CrossRef]
  31. Hu, Z.; Wang, S.; Bai, X.; Luo, G.; Li, Q.; Wu, L.; Yang, Y.; Tian, S.; Li, C.; Deng, Y. Changes in ecosystem service values in karst areas of China. Agric. Ecosyst. Environ. 2020, 301, 107026. [Google Scholar] [CrossRef]
  32. Yoshikawa, T.; Koide, D.; Yokomizo, H.; Kim, J.Y.; Kadoya, T. Assessing ecosystem vulnerability under severe uncertainty of global climate change. Sci. Rep. 2023, 13, 5932. [Google Scholar] [CrossRef]
  33. Arowolo, A.O.; Deng, X.; Olatunji, O.A.; Obayelu, A.E. Assessing changes in the value of ecosystem services in response to land-use/land-cover dynamics in Nigeria. Sci. Total Environ. 2018, 636, 597–609. [Google Scholar] [CrossRef]
  34. Costanza, R.; Kubiszewski, I. The authorship structure of “ecosystem services” as a transdisciplinary field of scholarship. Ecosyst. Serv. 2012, 1, 16–25. [Google Scholar] [CrossRef]
  35. Fei, L.; Shuwen, Z.; Jiuchun, Y.; Liping, C.; Haijuan, Y.; Kun, B. Effects of land use change on ecosystem services value in West Jilin since the reform and opening of China. Ecosyst. Serv. 2018, 31, 12–20. [Google Scholar] [CrossRef]
  36. Zhong, L.; Wang, J.; Zhang, X.; Ying, L. Effects of agricultural land consolidation on ecosystem services: Trade-offs and synergies. J. Clean. Prod. 2020, 264, 121412. [Google Scholar] [CrossRef]
  37. Chen, J.; Chen, J.; Liao, A.; Cao, X.; Chen, L.; Chen, X.; He, C.; Han, G.; Peng, S.; Lu, M.; et al. Global land cover mapping at 30m resolution: A POK-based operational approach. ISPRS J. Photogramm. Remote Sens. 2015, 103, 7–27. [Google Scholar] [CrossRef]
  38. National Geographic Information Resources Catalog Service System. 2016. Available online: https://www.webmap.cn/ (accessed on 5 March 2023).
  39. GSCloud. The Data Set is Provided by Geospatial Data Cloud Site, Computer Network Information Center, Chinese Academy of Sciences. 2020. Available online: http://www.gscloud.cn/ (accessed on 15 March 2023).
  40. Xu, X. Spatially Interpolated Dataset of Mean Conditions of Meteorological Elements in China. Resource and Environmental Science Data Registration and Publication System. 2017. Available online: https://www.resdc.cn/doi/doi.aspx?DOIid=39 (accessed on 15 March 2023).
  41. Xu, X. Spatial Distribution of China’s GDP on Kilometer Grid Dataset. Resource and Environmental Science Data Registration and Publication System. 2017. Available online: https://www.resdc.cn/DOI/DOI.aspx?DOIID=33 (accessed on 15 March 2023).
  42. Xu, X. Kilometer Grid Dataset for Spatial Distribution of Population in China. Resource and Environmental Science Data Registration and Publication System. 2017. Available online: https://www.resdc.cn/doi/doi.aspx?DOIid=32 (accessed on 15 March 2023).
  43. Xu, X. DEM-Based Extraction of Chinese Watershed and River Network Datasets. Resource and Environmental Science Data Registration and Publication System. 2018. Available online: https://www.resdc.cn/DOI/DOI.aspx?DOIID=44 (accessed on 15 March 2023).
  44. OpenStreetMap© Online Mapping Project Database. Available online: http://www.openstreetmap.org/ (accessed on 17 March 2023).
  45. Qasim, W.; Cho, J.M.; Moon, B.E.; Basak, J.K.; Kahn, F.; Okyere, F.G.; Yoon, Y.C.; Kim, H.T. Predicting Common Patterns of Livestock-Vehicle Movement Using GPS and GIS: A Case Study on Jeju Island, South Korea. J. Biosyst. Eng. 2018, 43, 247–254. [Google Scholar]
  46. Zhu, L.; Song, R.; Sun, S.; Li, Y.; Hu, K. Land use/land cover change and its impact on ecosystem carbon storage in coastal areas of China from 1980 to 2050. Ecol. Indic. 2022, 142, 109178. [Google Scholar] [CrossRef]
  47. Wang, C.; Li, T.; Guo, X.; Xia, L.; Lu, C.; Wang, C. Plus-InVEST Study of the Chengdu-Chongqing Urban Agglomeration&rsquo;s Land-Use Change and Carbon Storage. Land 2022, 11, 1617. [Google Scholar]
  48. Çağlıyan, A.; Dağlı, D. Monitoring land use land cover changes and modelling of urban growth using a future land use simulation model (FLUS) in Diyarbakır, Turkey. Sustainability 2022, 14, 9180. [Google Scholar] [CrossRef]
  49. Mamitimin, Y.; Simayi, Z.; Mamat, A.; Maimaiti, B.; Ma, Y. FLUS Based Modeling of the Urban LULC in Arid and Semi-Arid Region of Northwest China: A Case Study of Urumqi City. Sustainability 2023, 15, 4912. [Google Scholar] [CrossRef]
  50. Daba, M.H.; You, S. Quantitatively assessing the future land-use/land-cover changes and their driving factors in the upper stream of the Awash River based on the CA–markov model and their implications for water resources management. Sustainability 2022, 14, 1538. [Google Scholar] [CrossRef]
  51. Floreano, I.X.; de Moraes, L.A.F. Land use/land cover (LULC) analysis (2009–2019) with Google Earth Engine and 2030 prediction using Markov-CA in the Rondônia State, Brazil. Environ. Monit. Assess. 2021, 193, 239. [Google Scholar] [CrossRef] [PubMed]
  52. Hamad, R.; Balzter, H.; Kolo, K. Predicting Land Use/Land Cover Changes Using a CA-Markov Model under Two Different Scenarios. Sustainability 2018, 10, 3421. [Google Scholar] [CrossRef]
  53. Verburg, P.H.; Soepboer, W.; Veldkamp, A.; Limpiada, R.; Espaldon, V.; Mastura, S.S. Modeling the spatial dynamics of regional land use: The CLUE-S model. Environ. Manag. 2002, 30, 391–405. [Google Scholar] [CrossRef]
  54. Wu, M.; Ren, X.; Che, Y.; Yang, K. A coupled SD and CLUE-S model for exploring the impact of land use change on ecosystem service value: A case study in Baoshan District, Shanghai, China. Environ. Manag. 2015, 56, 402–419. [Google Scholar] [CrossRef]
  55. Nie, W.; Xu, B.; Yang, F.; Shi, Y.; Liu, B.; Wu, R.; Lin, W.; Pei, H.; Bao, Z. Simulating future land use by coupling ecological security patterns and multiple scenarios. Sci. Total Environ. 2023, 859, 160262. [Google Scholar] [CrossRef]
  56. Xu, L.; Liu, X.; Tong, D.; Liu, Z.; Yin, L.; Zheng, W. Forecasting Urban Land Use Change Based on Cellular Automata and the PLUS Model. Land 2022, 11, 652. [Google Scholar] [CrossRef]
  57. Zhang, S.; Yang, P.; Xia, J.; Wang, W.; Cai, W.; Chen, N.; Hu, S.; Luo, X.; Li, J.; Zhan, C. Land use/land cover prediction and analysis of the middle reaches of the Yangtze River under different scenarios. Sci. Total Environ. 2022, 833, 155238. [Google Scholar] [CrossRef]
  58. Liang, X.; Guan, Q.; Clarke, K.C.; Liu, S.; Wang, B.; Yao, Y. Understanding the drivers of sustainable land expansion using a patch-generating land use simulation (PLUS) model: A case study in Wuhan, China. Comput. Environ. Urban Syst. 2021, 85, 101569. [Google Scholar] [CrossRef]
  59. Guo, W.; Teng, Y.; Yan, Y.; Zhao, C.; Zhang, W.; Ji, X. Simulation of Land Use and Carbon Storage Evolution in Multi-Scenario: A Case Study in Beijing-Tianjin-Hebei Urban Agglomeration, China. Sustainability 2022, 14, 13436. [Google Scholar] [CrossRef]
  60. Gu, F.; Zhang, Y.; Huang, M.; Tao, B.; Guo, R.; Yan, C. Effects of climate warming on net primary productivity in China during 1961–2010. Ecol. Evol. 2017, 7, 6736–6746. [Google Scholar] [CrossRef] [PubMed]
  61. Wang, J.-B.; Liu, J.-Y.; Shao, Q.-Q.; Liu, R.-G.; Fan, J.-W.; Chen, Z.-Q. Spatial-temporal patterns of net primary productivity for 1988-2004 based on GLOPEM-CEVSA model in the “Three-River Headwaters” Region of Qinghai Province, China. Chin. J. Plant Ecol. 2009, 33, 254. [Google Scholar]
  62. Kelong, C.; Yanli, H.; Shengkui, C.; Jin, M.; Guangchao, C.; Hui, L. The Study of Vegetation Carbon Storage in Qinghai Lake Valley Based on Remote Sensing and CASA Model. Procedia Environ. Sci. 2011, 10, 1568–1574. [Google Scholar] [CrossRef]
  63. Schaefer, K.; Collatz, G.J.; Tans, P.; Denning, A.S.; Baker, I.; Berry, J.; Prihodko, L.; Suits, N.; Philpott, A. Combined simple biosphere/Carnegie-Ames-Stanford approach terrestrial carbon cycle model. Chin. J. Plant Ecol. 2008, 113. [Google Scholar] [CrossRef]
  64. KVG, R.K.; Barik, D.K. Assessment of carbon storage and erosion using invest model in Visakhapatnam district, Andhra Pradesh. J. Rural. Dev. 2018, 2018, 207–220. [Google Scholar]
  65. Li, K.; Cao, J.; Adamowski, J.F.; Biswas, A.; Zhou, J.; Liu, Y.; Zhang, Y.; Liu, C.; Dong, X.; Qin, Y. Assessing the effects of ecological engineering on spatiotemporal dynamics of carbon storage from 2000 to 2016 in the Loess Plateau area using the InVEST model: A case study in Huining County, China. Environ. Dev. 2021, 39, 100641. [Google Scholar] [CrossRef]
  66. Nelson, E.; Sander, H.; Hawthorne, P.; Conte, M.; Ennaanay, D.; Wolny, S.; Manson, S.; Polasky, S. Projecting global land-use change and its effect on ecosystem service provision and biodiversity with simple models. PLoS ONE 2010, 5, e14327. [Google Scholar] [CrossRef]
  67. Ding, F.; Pan, Z.; Wu, P.; Cui, Y.; Zhou, F. Carbon accumulation and distribution characteristics of the evergreen broadleaved and deciduous broad-leaved mixed forests in East Guizhou. Acta Ecol. Sin. 2015, 35, 8. [Google Scholar]
  68. Stocker, T.F.; Qin, D.; Plattner, G.K.; Tignor, M.M.B.; Allen, S.K.; Boschung, J.; Nauels, A.; Xia, Y.; Bex, V.; Midgley, P.M. Climate Change 2013: The Physical Science Basis. In Contribution of Working Group I to the Fifth Assessment Report of IPCC the Intergovernmental Panel on Climate Change; Cambridge University Press: Cambridge, UK, 2014. [Google Scholar]
  69. Li, K.; Wang, S.; Cao, M. Carbon storage of vegetation and soil in China. Sci. Sin. (Terrae) 2003, 33, 9. [Google Scholar] [CrossRef]
  70. Xie, X.; Sun, B.; Zhou, H.; Li, Z. Soil carbon stocks and their influencing factors under native vegetations in China. Acta Pedol. Sin. 2004, 41, 687–699. [Google Scholar]
  71. Li, M.; Du, M.; Yu, L. Carbon Storage and Density of Forest Vegetation and Its Spatial Distribution Pattern in Guizhou Province. J. Northwest For. Univ. 2016, 31, 8. [Google Scholar]
  72. Yang, Y.; Bao, W.; Liu, Y. Scenario simulation of land system change in the Beijing-Tianjin-Hebei region. Land Use Policy 2020, 96, 104677. [Google Scholar] [CrossRef]
  73. Yang, H.; Huang, J.; Liu, D. Linking climate change and socioeconomic development to urban land use simulation: Analysis of their concurrent effects on carbon storage. Appl. Geogr. 2020, 115, 102135. [Google Scholar] [CrossRef]
  74. Zhang, C.; Tian, H.; Chen, G.; Chappelka, A.; Xu, X.; Ren, W.; Hui, D.; Liu, M.; Lu, C.; Pan, S.; et al. Impacts of urbanization on carbon balance in terrestrial ecosystems of the Southern United States. Environ. Pollut. 2012, 164, 89–101. [Google Scholar] [CrossRef]
  75. Gao, H.; Han, H.; Zhang, C.; Wang, H. Effects of Land Use Change on Carbon Storage in Wujiang River of Guizhou Province from 2000-2010. J. Sichuan Agric. Univ. 2016, 34, 7. [Google Scholar]
  76. Schröter, D.; Cramer, W.; Leemans, R.; Prentice, I.C.; Araújo, M.B.; Arnell, N.W.; Bondeau, A.; Bugmann, H.; Carter, T.R.; Gracia, C.A.; et al. Ecosystem Service Supply and Vulnerability to Global Change in Europe. Science 2005, 310, 1333–1337. [Google Scholar] [CrossRef]
  77. Metzger, M.J.; Rounsevell, M.D.A.; Acosta-Michlik, L.; Leemans, R.; Schröter, D. The vulnerability of ecosystem services to land use change. Agric. Ecosyst. Environ. 2006, 114, 69–85. [Google Scholar] [CrossRef]
  78. Wang, S.; Liu, J.; Zhang, Z.; Zhou, Q.; Zhao, X. Analysis on the spatial and temporal characteristics of land use in China. Acta Geogr. Sin. 2001, 56, 631–639. [Google Scholar]
  79. Gao, L.; Tao, F.; Liu, R.; Wang, Z.; Leng, H.; Zhou, T. Multi-scenario simulation and ecological risk analysis of land use based on the PLUS model: A case study of Nanjing. Sustain. Cities Soc. 2022, 85, 104055. [Google Scholar] [CrossRef]
  80. Guo, H.; Cai, Y.; Li, B.; Tang, Y.; Qi, Z.; Huang, Y.; Yang, Z. An integrated modeling approach for ecological risks assessment under multiple scenarios in Guangzhou, China. Ecol. Indic. 2022, 142, 109270. [Google Scholar] [CrossRef]
  81. Jiao, L.; Yang, R.; Zhang, Y.; Yin, J.; Huang, J. The Evolution and Determinants of Ecosystem Services in Guizhou&mdash; A Typical Karst Mountainous Area in Southwest China. Land 2022, 11, 1164. [Google Scholar]
  82. Fan, L.; Cai, T.; Wen, Q.; Han, J.; Wang, S.; Wang, J.; Yin, C. Scenario simulation of land use change and carbon storage response in Henan Province, China: 1990–2050. Ecol. Indic. 2023, 154, 110660. [Google Scholar] [CrossRef]
  83. Chen, S.; Yao, S. Identifying the drivers of land expansion and evaluating multi-scenario simulation of land use: A case study of Mashan County, China. Ecol. Inform. 2023, 77, 102201. [Google Scholar] [CrossRef]
  84. Wu, J.; Luo, J.; Zhang, H.; Qin, S.; Yu, M. Projections of land use change and habitat quality assessment by coupling climate change and development patterns. Sci. Total Environ. 2022, 847, 157491. [Google Scholar] [CrossRef]
  85. Hayes, D.J.; Turner, D.P.; Stinson, G.; McGuire, A.D.; Wei, Y.; West, T.O.; Heath, L.S.; De Jong, B.; McConkey, B.G.; Birdsey, R.A. Reconciling estimates of the contemporary North American carbon balance among terrestrial biosphere models, atmospheric inversions, and a new approach for estimating net ecosystem exchange from inventory-based data. Glob. Change Biol. 2012, 18, 1282–1299. [Google Scholar] [CrossRef]
  86. Keith, H.; Mackey, B.G.; Lindenmayer, D.B. Re-evaluation of forest biomass carbon stocks and lessons from the world’s most carbon-dense forests. Proc. Natl. Acad. Sci. USA 2009, 106, 11635–11640. [Google Scholar] [CrossRef]
  87. Houghton, R.A.; Nassikas, A.A. Global and regional fluxes of carbon from land use and land cover change 1850–2015. Glob. Biogeochem. Cycles 2017, 31, 456–472. [Google Scholar] [CrossRef]
  88. Zhu, G.; Qiu, D.; Zhang, Z.; Sang, L.; Liu, Y.; Wang, L.; Zhao, K.; Ma, H.; Xu, Y.; Wan, Q. Land-use changes lead to a decrease in carbon storage in arid region, China. Ecol. Indic. 2021, 127, 107770. [Google Scholar] [CrossRef]
  89. Nakakaawa, C.A.; Vedeld, P.O.; Aune, J.B. Spatial and temporal land use and carbon stock changes in Uganda: Implications for a future REDD strategy. Mitig. Adapt. Strateg. Glob. Change 2011, 16, 25–62. [Google Scholar] [CrossRef]
  90. Ouyang, Z.; Zheng, H.; Xiao, Y.; Polasky, S.; Liu, J.; Xu, W.; Wang, Q.; Zhang, L.; Xiao, Y.; Rao, E.; et al. Improvements in ecosystem services from investments in natural capital. Science 2016, 352, 1455–1459. [Google Scholar] [CrossRef]
  91. Wang, X.; Zhang, X.; Feng, X.; Liu, S.; Yin, L.; Chen, Y. Trade-offs and synergies of ecosystem services in karst area of China driven by grain-for-green Program. Chin. Geogr. Sci. 2020, 30, 101–114. [Google Scholar] [CrossRef]
  92. Sadat, M.; Zoghi, M.; Malekmohammadi, B. Spatiotemporal modeling of urban land cover changes and carbon storage ecosystem services: Case study in Qaem Shahr County, Iran. Environ. Dev. Sustain. 2020, 22, 8135–8158. [Google Scholar] [CrossRef]
  93. Li, L.; Song, Y.; Wei, X.; Dong, J. Exploring the impacts of urban growth on carbon storage under integrated spatial regulation: A case study of Wuhan, China. Ecol. Indic. 2020, 111, 106064. [Google Scholar] [CrossRef]
  94. Fang, K.; Tang, Y.; Zhang, Q.; Song, J.; Wen, Q.; Sun, H.; Ji, C.; Xu, A. Will China peak its energy-related carbon emissions by 2030? Lessons 30 Chin. Prov. 2019, 255, 113852. [Google Scholar]
  95. Xiang, S.; Wang, Y.; Deng, H.; Yang, C.; Wang, Z.; Gao, M. Response and multi-scenario prediction of carbon storage to land use/cover change in the main urban area of Chongqing, China. Ecol. Indic. 2022, 142, 109205. [Google Scholar] [CrossRef]
  96. Hastie, A.; Honorio Coronado, E.N.; Reyna, J.; Mitchard, E.T.; Åkesson, C.M.; Baker, T.R.; Cole, L.E.; Oroche, C.J.C.; Dargie, G.; Dávila, G. Risks to carbon storage from land-use change revealed by peat thickness maps of Peru. Nat. Geosci. 2022, 15, 369–374. [Google Scholar] [CrossRef]
  97. Zhang, X.; Yue, Y.; Tong, X.; Wang, K.; Qi, X.; Deng, C.; Brandt, M. Eco-engineering controls vegetation trends in southwest China karst. Sci. Total Environ. 2021, 770, 145160. [Google Scholar] [CrossRef] [PubMed]
  98. Hou, W.; Gao, J.; Wu, S.; Dai, E. Interannual Variations in Growing-Season NDVI and Its Correlation with Climate Variables in the Southwestern Karst Region of China. Remote Sens. 2015, 7, 11105–11124. [Google Scholar] [CrossRef]
  99. Zhang, M.; Wang, K.; Liu, H.; Zhang, C.; Yue, Y.; Qi, X. Effect of ecological engineering projects on ecosystem services in a karst region: A case study of northwest Guangxi, China. J. Clean. Prod. 2018, 183, 831–842. [Google Scholar] [CrossRef]
  100. Li, Z.-T.; Li, M.; Xia, B.-C. Spatio-temporal dynamics of ecological security pattern of the Pearl River Delta urban agglomeration based on LUCC simulation. Ecol. Indic. 2020, 114, 106319. [Google Scholar] [CrossRef]
  101. Pellikka, P.; Heikinheimo, V.; Hietanen, J.; Schäfer, E.; Siljander, M.; Heiskanen, J. Impact of land cover change on aboveground carbon stocks in Afromontane landscape in Kenya. Sci. Total Environ. 2018, 94, 178–189. [Google Scholar] [CrossRef]
  102. Lawler, J.J.; Lewis, D.J.; Nelson, E.; Plantinga, A.J.; Polasky, S.; Withey, J.C.; Helmers, D.P.; Martinuzzi, S.; Pennington, D.; Radeloff, V.C. Projected land-use change impacts on ecosystem services in the United States. Proc. Natl. Acad. Sci. USA 2014, 111, 7492–7497. [Google Scholar] [CrossRef] [PubMed]
  103. Dang, X.; Liu, G.; Zhao, L.; Zhao, G. The response of carbon storage to the age of three forest plantations in the Loess Hilly Regions of China. CATENA 2017, 159, 106–114. [Google Scholar] [CrossRef]
  104. Chen, G.-S.; Yang, Y.-S.; Xie, J.-S.; Guo, J.-F.; Gao, R.; Qian, W. Conversion of a natural broad-leafed evergreen forest into pure plantation forests in a subtropical area: Effects on carbon storage. Ann. For. Sci. 2005, 62, 659–668. [Google Scholar] [CrossRef]
Figure 1. Location of the study area.
Forests 14 02307 g001
Figure 2. Drivers of LUCC in Guizhou Province. (a) DEM; (b) slope; (c) temperature; (d) precipitation; (e) GDP; (f) population; (g) distance to government; (h) distance to water; (i) distance to railway; (j) distance to highway; (k) distance to main road; (l) distance to minor road.
Forests 14 02307 g002
Figure 3. Data processing and methodology study flowchart. Note: LEAS and CARS are the two modules of the PLUS model.
Forests 14 02307 g003
Figure 4. Distribution of land use types in Guizhou Province in 2000, 2010, and 2020. Note: Figures (a) and (b) show enlargement of the area of the region. Years 2000, 2010, and 2020 have the same coordinates for region (a); 2000, 2010, and 2020 have the same coordinates for region (b).
Forests 14 02307 g004
Figure 5. Land use transfer, 2000–2010, 2010–2020, and 2000–2030. (A) 2000–2010; (B) 2010–2020; (C) 2000–2020.
Forests 14 02307 g005
Figure 6. Distribution of carbon stocks in Guizhou Province in 2000, 2010, and 2020. Note: Figures (a) and (b) show enlargement of the area of the region. Years 2000, 2010, and 2020 have the same coordinates for region (a); 2000, 2010, and 2020 have the same coordinates for region (b).
Forests 14 02307 g006
Figure 7. Carbon stock change distribution in Guizhou Province for 2000–2010, 2010–2020, and 2000–2020. Note: (a) 2000–2010; (b) 2010–2020; (c) 2000–2020.
Forests 14 02307 g007
Figure 8. Land use distribution in Guizhou Province under NT, EP, and ED scenarios in 2030. Note: Figures (a) and (b) show enlargement of the area of the region. The coordinates of region (a) are the same for the NT, EP, and ED scenarios. The coordinates of region (b) are the same for the NT, EP, and ED scenarios.
Forests 14 02307 g008
Figure 9. Land use transfer in NT, EP, and ED scenarios, 2020–2030. Note: (A) NT scenario; (B) EP scenario; (C) ED scenario.
Forests 14 02307 g009
Figure 10. Distribution of carbon stocks under the NT, EP, and ED scenarios in 2030. Note: Figures (a) and (b) show enlargement of the area of the region. The coordinates of region (a) are the same for the NT, EP, and ED scenarios. The coordinates of region (b) are the same for the NT, EP, and ED scenarios.
Forests 14 02307 g010
Figure 11. Distribution of carbon stock changes in 2020–2030 for NT, EP, and ED scenarios. Note: (a) NT scenario; (b) EP scenario; (c) ED scenario.
Forests 14 02307 g011
Figure 12. Contribution of land use drivers in Guizhou Province. Note: This figure ranks the contribution of each driver to the LUCC in order of magnitude, with those contributing more than 0.1 generally considered and analyzed as positive drivers.
Forests 14 02307 g012
Figure 13. Changes in carbon stocks due to LUCC from 2000 to 2020. Note: Since the same magnitude does not clearly show the change in carbon stocks due to LUCC, this figure splits the original figure into three different magnitudes, as follows: (a) for carbon × 100 Mg; (b) for carbon × 10−3 Mg; and (c) for carbon × 10−5 Mg.
Forests 14 02307 g013
Table 1. Data description.
CategoryDataResolutionSource
Land use dataLand use30 mNational Geographic Information Resources Catalog Service System (https://www.webmap.cn, accessed on 5 March 2023)
Natural factorsDigital elevation model (DEM)30 mThe dataset is provided by Geospatial Data Cloud site, Computer Network Information Center, Chinese Academy of Sciences (https://www.gscloud.cn, accessed on 5 March 2023)
Slope30 m
Average annual precipitation1000 mResource and Environment Science and Data Center of Chinese Academy of Sciences (https://www.resdc.cn, accessed on 15 March 2023)
Average annual temperature1000 m
Socioeconomic factorsPopulation1000 m
Gross domestic product (GDP)1000 m
Accessibility factorsDistance to water sources/
Distance to railroads/OpenStreetMap
(https://www.openstreetmap.org, accessed on 17 March 2023)
Distance to highways/
Distance to major roads (Class I and II roads)/
Distance to secondary roads (Class III and IV roads)/
Distance to county government sites/
Table 2. Multi-scenario cost matrices.
NT ScenarioEP ScenarioED Scenario
LUCCFLCLGLWBULBLFLCLGLWBULBLFLCLGLWBULBL
FL111100111011101010
CL111111011011111110
GL111111011111001110
WB111111000110001110
UL011010000010100110
BL111111000011111111
Note—FL: Forest land; CL: Cropland; GL: Grassland; WB: Water body; UL: Unused land; BL: Built-up land; 1 = conversion possible; 0 = not possible.
Table 3. Carbon densities of different land uses in Guizhou Province (Mg/ha).
LUCCCi−aCi−bCi−sCi−dReference
Forest land20.3667.501707.80Ding et al. [67]; Stocker et al. [68]
Cropland38.7080.7092.901Stocker et al. [68]; Li et al. [69]; Xie et al. [70]
Grassland4.3086.5089.020Stocker et al. [68]; Li et al. [71]
Water body0000Yang et al. [72]; Yang et al. [73]; Zhang et al. [74]
Unused land0.740.1369.920Stocker et al. [68]; Li et al. [69]; Gao et al. [75]
Built-Up land00710Stocker et al. [68]; Gao et al. [75]
Table 4. Area and percent of land use in Guizhou Province, 2000, 2010, and 2020.
200020102020
Area%Area%Area%
Forest land1052.7859.761107.8962.891130.6264.18
Cropland661.2537.54612.5434.77587.3933.34
Grassland39.292.2328.621.6223.361.33
Water body4.390.255.870.336.940.39
Unused land0.08<0.010.08<0.010.080.01
Built-Up land3.870.226.670.3813.260.75
Table 5. Carbon stocks and changes in different land uses in Guizhou Province (unit: Tg).
2000201020202000–20102010–20202000–2020
Forest land2796.832943.243003.61146.4160.37206.78
Cropland1410.451306.551252.91−103.9−53.64−157.54
Grassland70.6651.4642.02−19.20−9.44−28.64
Water body000000
Unused land0.060.060.06000
Built-Up land2.754.739.421.984.696.67
Total4280.754306.034308.0225.281.9927.27
Note: Carbon stocks in 2000, 2010, and 2020. Carbon stock changes in 2000–2010, 2010–2020, and 2000–2020.
Table 6. Carbon stocks and changes in different land uses under NT, EP, and ED scenarios (unit: Tg).
20302020–2030
NTEPEDNTEPED
Forest land3009.633011.122914.96.027.51−88.71
Cropland1252.051237.091277.62−0.86−15.8224.71
Grassland32.2052.7764.14−9.8210.7522.12
Water body000000
Unused land0.050.050.06−0.01−0.010
Built-Up land12.236.7916.982.81−2.637.56
Total4306.164307.844273.71−1.86−0.18−34.31
Table 7. Carbon stock services’ vulnerability to LUCC.
YearC (Tg)LaTime△C (Tg)△LaPI
20004280.75237.97————————
20104306.03235.522000–201025.28−2.45−0.57
20204308.02234.842010–20201.99−0.68−0.16
2030 (NT)4306.16235.272020–2030 (NT)−1.860.43−0.24
2030 (EP)4307.84234.012020–2030 (EP)−0.18−0.830.01
2030 (ED)4273.71236.712020–2030 (ED)−34.311.87−1.00
Disclaimer/Publisher’s Note: The statements, opinions and data contained in all publications are solely those of the individual author(s) and contributor(s) and not of MDPI and/or the editor(s). MDPI and/or the editor(s) disclaim responsibility for any injury to people or property resulting from any ideas, methods, instructions or products referred to in the content.

