

Automatic Detection and Counting of Stacked Eucalypt Timber Using the YOLOv8 Model
by
 , ,
, ,
Gianmarco Goycochea Casas
1,* ,
,
Zool Hilmi Ismail
2 ,
,
Mathaus Messias Coimbra Limeira
1,
Antonilmar Araújo Lopes da Silva
3 and
Helio Garcia Leite
1 1
Department of Forest Engineering, Federal University of Viçosa, Viçosa 36570-900, MG, Brazil
2
Center for Artificial Intelligence and Robotics, Universiti Teknologi Malaysia, Jalan Sultan Yahya Petra, Kuala Lumpur 54100, Malaysia
3
Rua Visconde de Mauá, n 755, Cidade Nobre, Ipatinga 35162-391, MG, Brazil
*
Author to whom correspondence should be addressed.
Forests 2023, 14(12), 2369; https://doi.org/10.3390/f14122369
Submission received: 4 October 2023
/
Revised: 24 November 2023
/
Accepted: 27 November 2023
/
Published: 4 December 2023
(This article belongs to the Special Issue Computer Application and Deep Learning in Forestry)
Abstract
:The objective of this project was to automate the detection and counting process of stacked eucalypt (hybrid Eucalyptus urophylla x Eucalyptus grandis) timber in the forestry industry using the YOLOv8 model. The dataset consists of 230 diverse images of eucalypt roundwood, including images of roundwood separated on a rail and stacked timber. The annotations were made using LabelImg, ensuring accurate delineation of target objects on the log surfaces. The YOLOv8 model is customized with a CSPDarknet53 backbone, C2f module, and SPPF layer for efficient computation. The model was trained using an AdamW optimizer and implemented using Ultralytics YOLOv8.0.137, Python-3.10.12, and torch-2.0.1 + cu118 with CUDA support on NVIDIA T1000 (4096MiB). For model evaluation, the precision, recall, and mean Average Precision at a 50% confidence threshold (mAP50) were calculated. The best results were achieved at epoch 261, with a precision of 0.814, recall of 0.812, and mAP50 of 0.844 on the training set and a precision of 0.778, recall of 0.798, and mAP50 of 0.839 on the validation set. The model’s generalization was tested on separate images, demonstrating robust detection and accurate counting. The model effectively identified roundwood that was widely spaced, scattered, and overlapping. However, when applied to stacked timber, the automatic counting was not very accurate, especially when using images. In contrast, when using video, the relative percentage error for automatic counting significantly decreased to −12.442%. In conclusion, video proved to be more effective than images for counting stacked timber, while photographs should be reserved for the counting of individual roundwood pieces.
1. Introduction
Timber quantification is essential in forestry and the timber industry. The volume of timber is a key factor in pricing, so it is important to have a measurement system that meets the required conditions and is also efficient [1]. Accurate estimation of timber volume is crucial in the industry, particularly for industrial timber. Volume is often estimated in stacked cubic meters, and the accuracy of these estimates affects various aspects of timber management and utilization [2], including billing and cost estimation. Inaccurate estimations can lead to significant economic consequences [3].
Various methods are employed to quantify the volume of stacks. The manual measurement technique involves measuring the length, height, and depth of stacked timber to determine the volume in stereo [4]. Another approach involves immersing logs in water to approximate the unevenness of the stack surface; this is commonly referred to as xylometry [5,6]. The Absolute Total Residual Oven-dry weight (ATRO) measurement is a widely used method in the wood industry to determine the moisture content of a sample, expressed as a percentage of the sample’s final dry weight. This measurement is crucial for accurately assessing and comparing the density of various timber types, and has practical applications in the forestry sector [7,8,9]. Additionally, measurements can be obtained by weighing the load on trucks [10]; scanning truckloads with lasers [11,12]; utilizing software for digital image assessment [13]; employing mathematical expressions; and using conversion factors [14]. The use of stereo camera technology, specifically LogStackPro, has shown promise as an accurate alternative to traditional manual methods for measuring timber volumes for commercial transactions. While statistical comparisons found no significant differences between the evaluated measurement techniques, practical considerations emphasize the potential financial impact of volume discrepancies [15]. Furthermore, LiDAR-based methods are a trend in these times; it is possible that these methods will complement, or even replace, traditional measurement techniques in the future [3,16,17].
One of the major challenges in the industrial sector is accurately quantifying stacked timber, particularly in the case of eucalypt wood used for pulp production. Specific software and mobile applications have been developed to address the challenges of timber volume measurement. These applications utilize various techniques to achieve accurate and consistent results. Digitora [18] employs the equidistant points method to guarantee accuracy and consistency in measurements. This method involves placing a series of equally spaced points on the timber and measuring the distances between them. The volume is then calculated based on these measurements. NeuroDIC [19] utilizes artificial neural network (ANN) models to classify images of timber and its spacing. Once trained, the ANN can be used to obtain a conversion factor to estimate the volume of stacked timber. Trestima Stack [20] uses computer vision to accurately determine the volume of timber based on images captured via smartphone or tablet. The actual volume is counted based on the surface area of the stack, the length of the log, and an automatically generated coefficient factor. In addition, software named IFOVEA https://fovea.eu/index.php (accessed on 12 July 2023) and Timbeter https://timbeter.com/ (accessed on 12 July 2023) [21] have been developed, enabling users to obtain panoramic views of multiple images and quantify stacked timber through image analysis. Despite the existence of this technology, and the need to quantify the solid volume of wood in stacks—or in transport trucks for small producers and medium and large forestry companies—total automation is still a pending goal.
When logs in a stack have the same length, or a relatively small variation in length, the distribution of their diameters can be used to calculate the solid volume. To do this, it is necessary to know the number of logs in the stack. Manual counting using the stack itself, or an image of it, is not a good option on a commercial scale, except for very small stacks. The alternative is to automate the log counting process using a computer vision solution. This requires an object detection model, in this case, for wooden logs.
Nonetheless, there are technological solutions available to tackle this problem. One such approach involves harnessing the power of deep learning with YOLO (You Only Look Once) [22] models, which are specifically designed for real-time object detection and use deep CNNs in various applications, such as robotics, autonomous vehicles, and video surveillance. There are currently eight versions of the YOLO model. YOLOv8 [23] represents the cutting edge in computer vision models and was developed by Ultralytics in January 2023. This model offers ready-to-use support for various tasks, including object detection, classification, and segmentation, making it accessible through both a Python package and a command-line interface.
The YOLO model has proven to be highly effective in precise and automated wood detection. It has been successfully employed for tasks like surface knot detection in lumber [24]; extracting contour features from complex textures, such as cracks in wood structures [25,26]; and identifying wood defects with remarkable accuracy [27,28].
Computer vision is a field of computer science that deals with the extraction of meaningful information from digital images or videos. It is used in a wide variety of fields, including object recognition, surveillance, robotic control, medical imaging, and manufacturing [29].
Artificial intelligence (AI) in computer vision is derived from the functioning of the human brain. One of the key insights from neuroscience is that the human brain has two distinct visual processing pathways: the ventral pathway and the dorsal pathway. The ventral pathway is responsible for object identification and recognition. It begins in the occipital lobe and projects to the temporal lobe, where it is involved in processing the features of objects, such as their shape, color, and texture. The dorsal pathway is responsible for processing the spatial location of objects. It begins in the occipital lobe and projects to the parietal lobe, where it is involved in tracking the movements of objects and their relationship to the body [30].
Human vision is often influenced by the specific task we are attempting to accomplish. It is therefore important that visual models be able to interpret visual stimuli in a way that is relevant to the specific task being performed. One way to accomplish this is to train the vision models with data annotated specifically for the task the model is expected to perform. By considering the specific task the model is trying to perform, we can train vision models to be more efficient and accurate [31].
Deep convolutional neural networks (CNNs) have revolutionized image classification and have led to the widespread adoption of deep neural networks in computer vision applications by companies such as Google, Facebook, Microsoft, and Baidu [32]. These networks can learn the hierarchical features of images, from low-level features such as edges and shapes, to high-level features such as objects and scenes [33]. Image classification is a computer vision task that aims to identify and categorize objects in an image. It does this by analyzing the numerical properties of various image features, such as color, texture, and shape. The features are then organized into categories [34].
Computer vision has emerged as a prominent technology with various applications within the sciences, offering significant promise in automating processes both in industrial settings and in basic research [35]. Forest researchers have been using AI in forestry to detect wood surface defects and textures. One such technique is integral projection, which can be used to plot and locate the position of a wood plate. This technique was tested on five types of wood samples, and it showed high average classification accuracy [36]. A study has developed a robust and low-cost algorithm for detecting wood defects. This algorithm can be applied to an automatic wood optimization machine, which can help improve the quality and efficiency of wood processing [37].
Our main objective was to leverage advanced computer vision techniques, particularly the state-of-the-art YOLOv8 model, to automate the process of detecting and counting stacked eucalypt (hybrid Eucalyptus urophylla x Eucalyptus grandis) timber. This advancement in computer vision not only benefits forestry, but also opens the door to broader technological integration in the industry. This research offers an automatic detection application that could be used as an alternative solution for the forestry industry, streamlining production processes and addressing challenges in the solid volume quantification of stacked timber. Furthermore, these advancements pave the way for integrating state-of-the-art computer vision technologies in various forestry research areas, promising a technologically advanced future for the industry.
2. Materials and Methods
2.1. Dataset
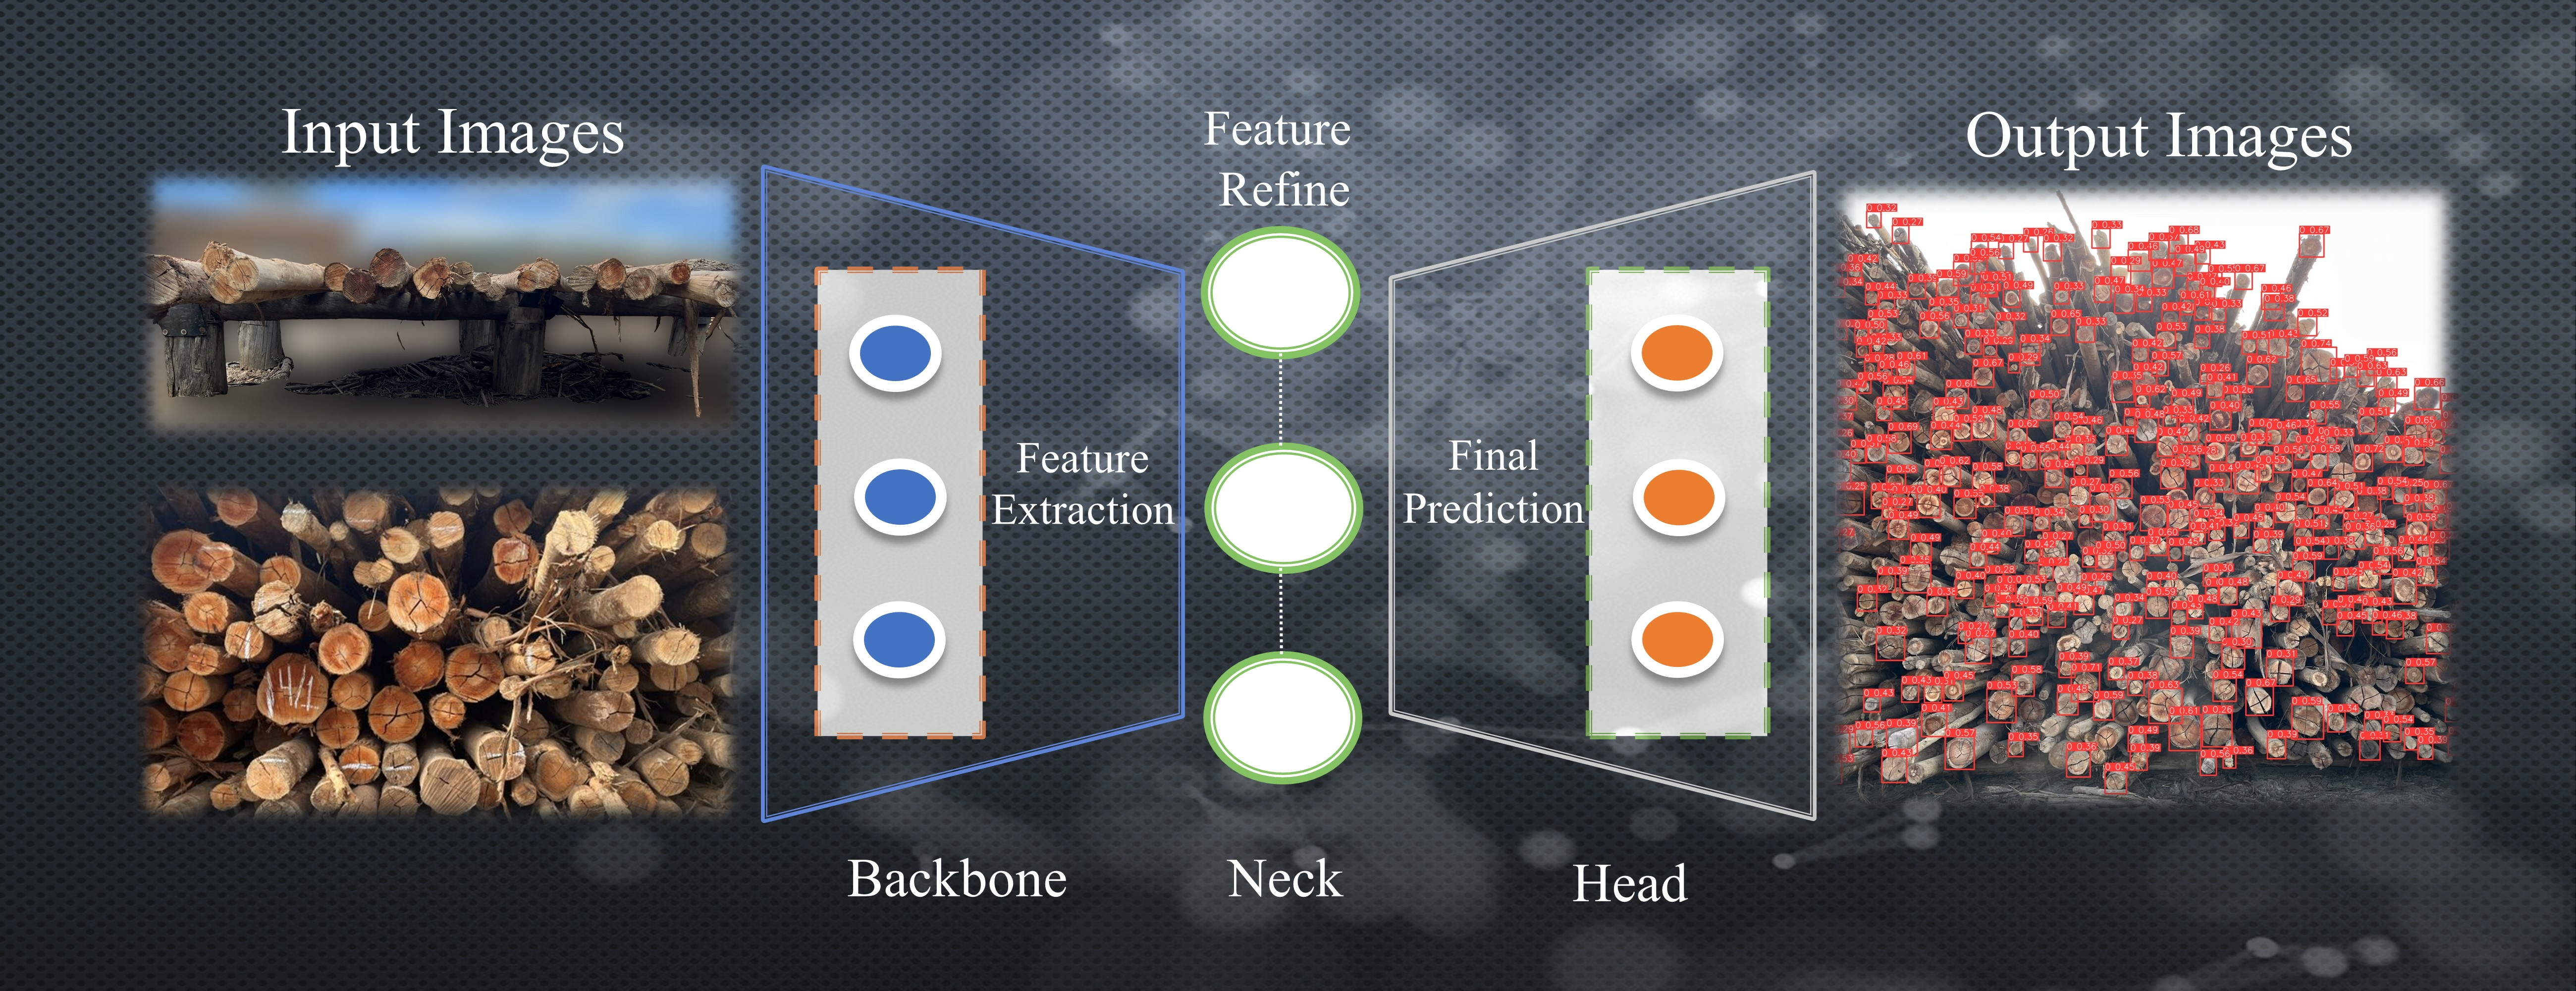
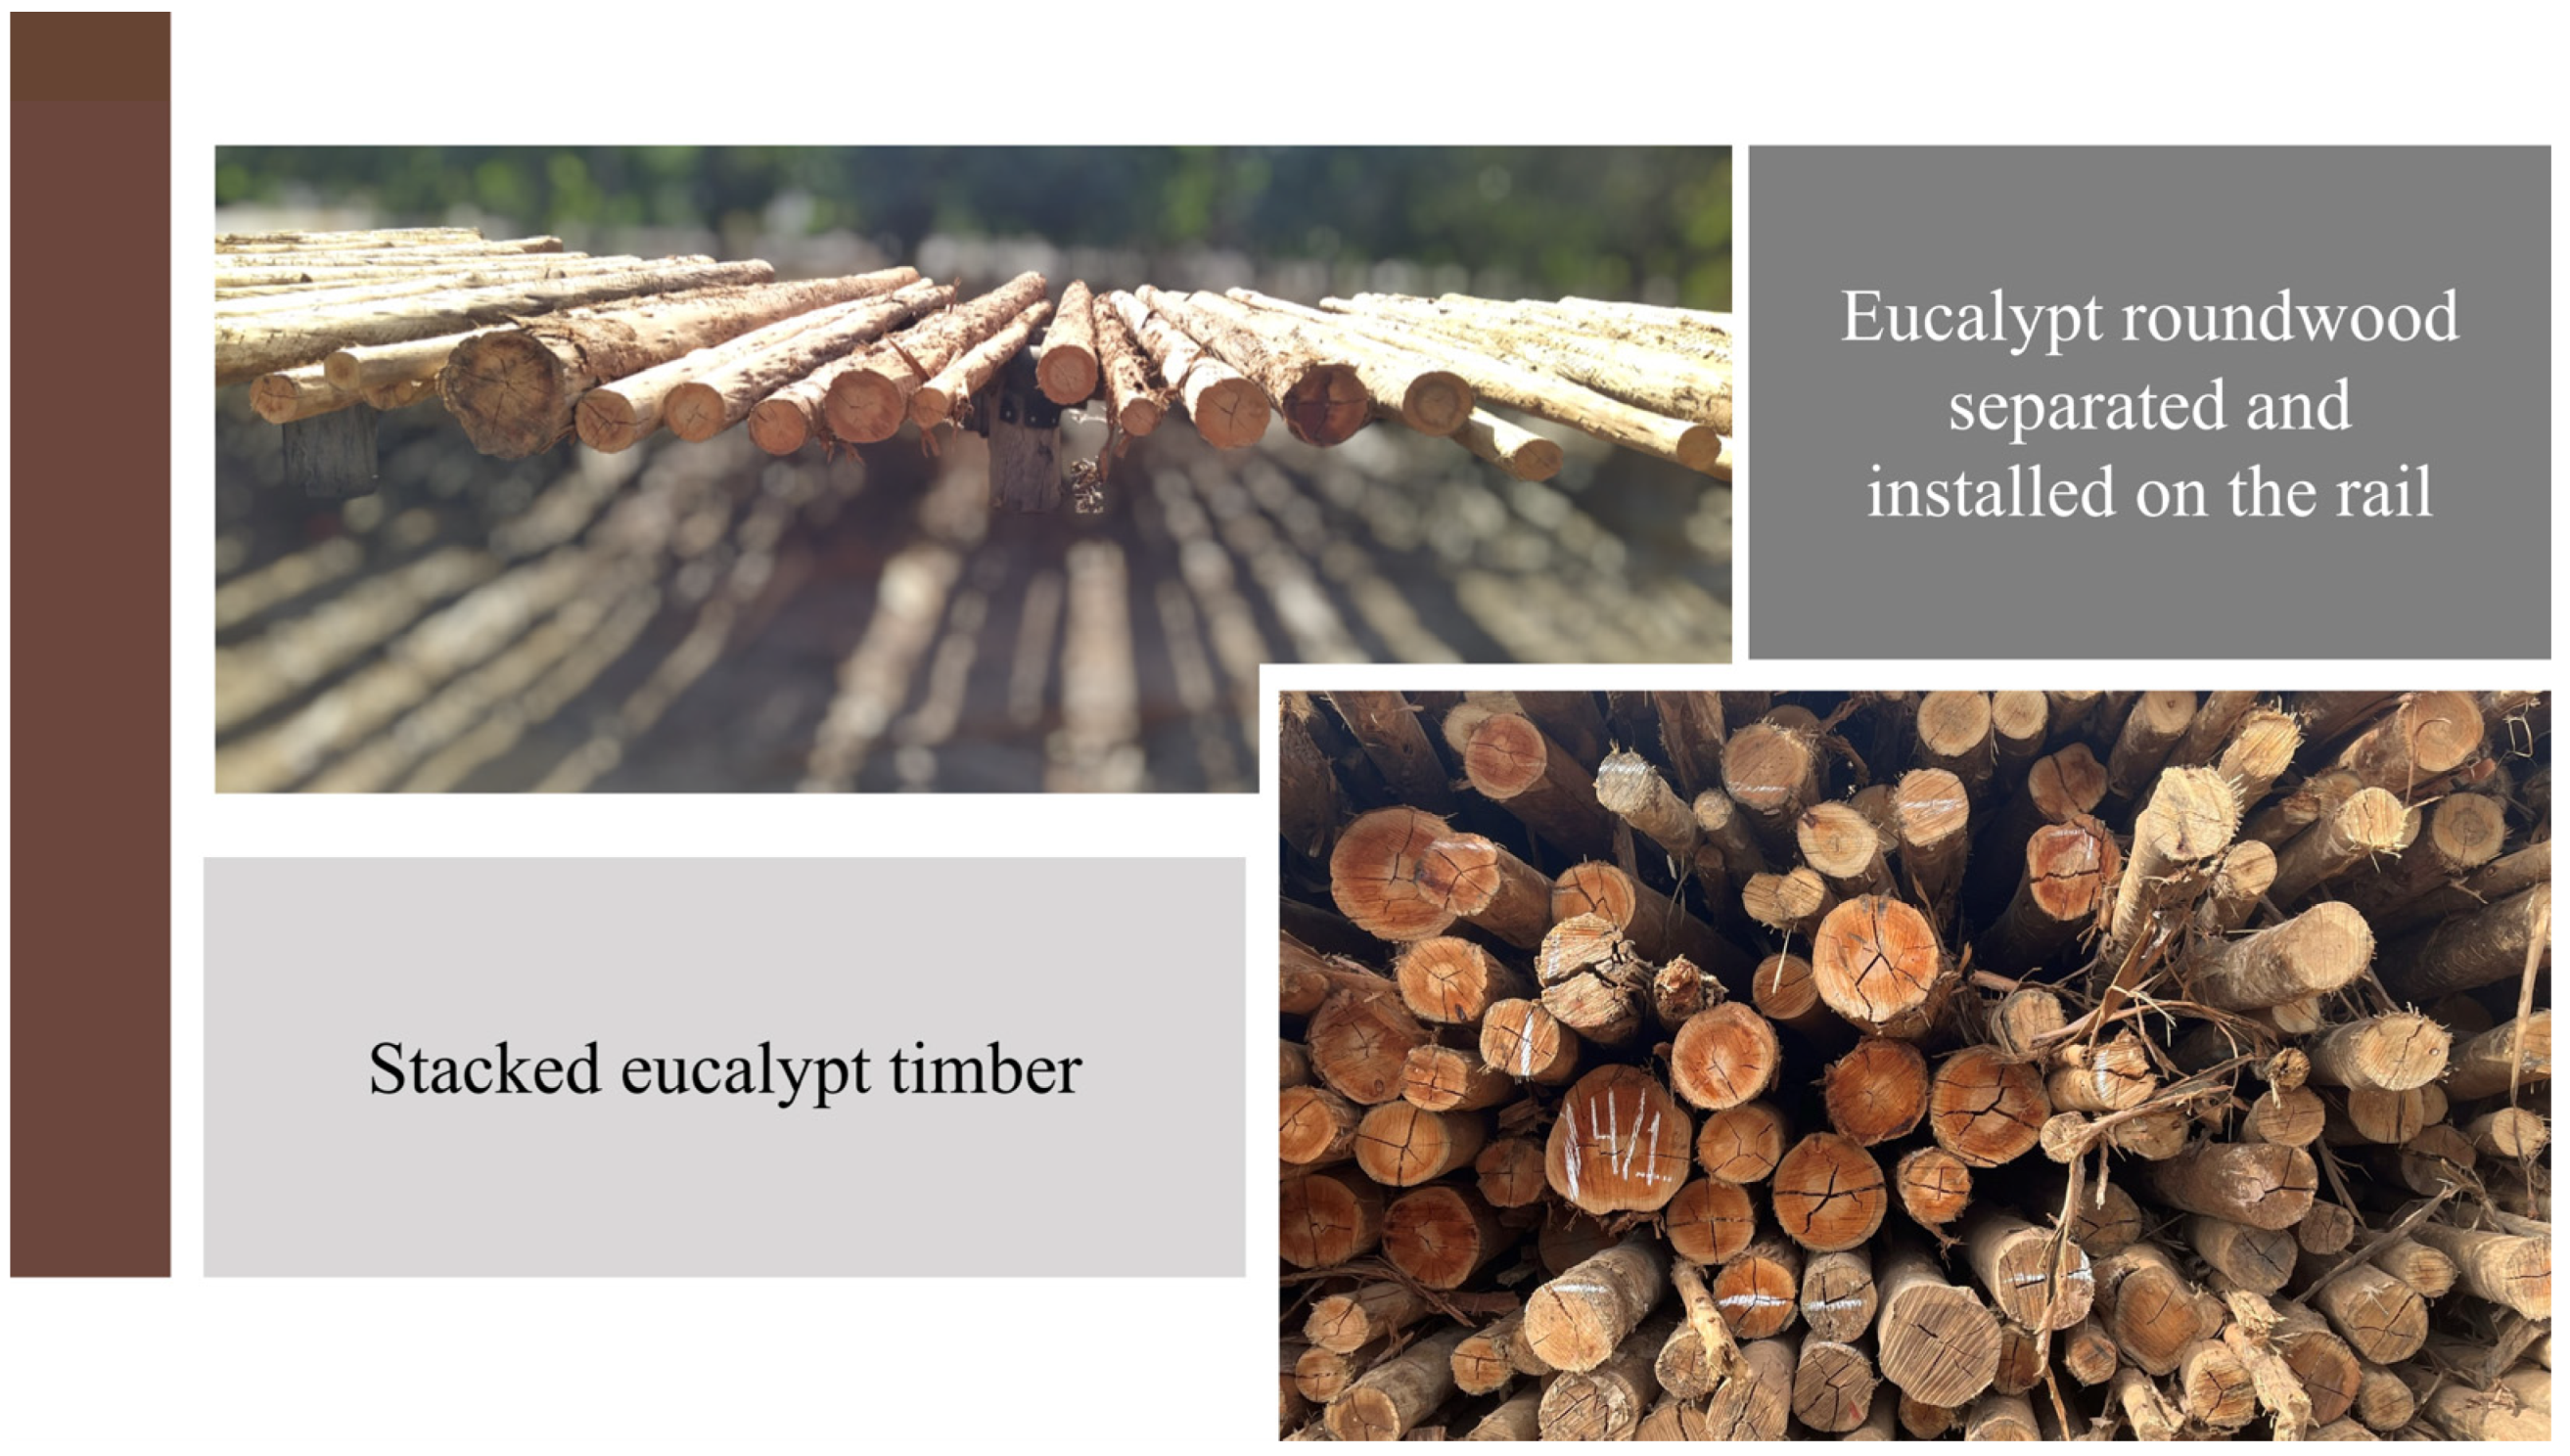
The dataset consists of photographs obtained from a forestry organization in Minas Gerais, Brazil. In order to train the YOLOv8 model, we utilized two types of images: those of eucalypt roundwood separated and installed on a rail, and those of stacked eucalypt timber (Figure 1). A total of 230 images were used. The stacked timber has a diameter range of 4 to 31 cm and is from a 6- to 7-year-old pre-cutting inventory.
The photographic equipment was an iPhone 13 smartphone (manufactured by Apple at the Foxconn plant in Tamil Nadu, India), with f/1.6 aperture, 1/173 s exposure time, ISO 50, 5 mm focal length, 72 dpi resolution, and 1536 × 2048 pixel dimensions. The photographs were taken at a 60° viewing angle under favorable environmental conditions, specifically without rain.
During the annotation process, we paid special attention to accurately delineating the target objects on the log surfaces, ensuring the model’s effectiveness in detecting and counting these objects in real-world scenarios. The inclusion of these diverse log images enhances the model’s generalization capability and improves its performance in recognizing various log configurations in stacked eucalypt timber.
2.2. Annotation Format and Dataset Splitting
The annotation process is conducted directly on the image, where the first value (Object-Class) corresponds to the object’s class identification, and the second (x) (Equation (1)) and third (y) (Equation (2)) values represent the midpoint of the bounding box. The midpoint value is relative to the image’s width and height. The fourth (width) (Equation (3)) and fifth (height) (Equation (4)) values denote the width and height of the bounding box, respectively. The annotation process was carried out using LabelImg [38]. The dataset was partitioned into training, testing, and validation sets, with a size distribution of 80%, 10%, and 10%, respectively. Each stacked timber image had between 50 and 150 annotations, and all log faces were annotated on the roundwood images. In total, 6880 box labels were added. The width of the bounding boxes ranged from 0.008464 pixels to 0.121745 pixels, with an average width of 0.035087 pixels. The height of the bounding boxes ranged from 0.006348 pixels to 0.142333 pixels, with an average height of 0.037198 pixels.
This allocation was applied both to the images and their corresponding labels, ensuring consistency between the different subsets. Figure 2 displays an illustrative example of the image annotations used in our study.
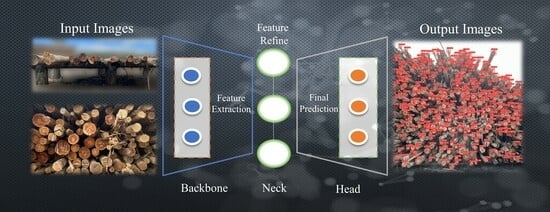
2.3. Architecture and Configuration Model
The design incorporates a customized CSPDarknet53 backbone in its architecture. It also utilizes the C2f (cross-stage partial bottleneck with two convolutions) module. To expedite computation, a spatial pyramid pooling fast (SPPF) layer is employed, enabling the pooling of features into a fixed-size map. Furthermore, each convolution is complemented by batch normalization and SiLU (Sigmoid Linear Unit) activation. Notably, the head of the model is decoupled to handle object-oriented tasks independently. The architecture design is described in [39]. YOLOv8 offered a range of five scaled versions, namely YOLOv8n (nano), YOLOv8s (small), YOLOv8m (medium), YOLOv8l (large), and YOLOv8x (extra-large). We utilized YOLOv8n, which is ideal for customizing a new model and detecting very small objects.
We utilized an AdamW optimizer with specific parameter groups for training the YOLOv8 model. The configuration employed was AdamW (lr = 0.002, momentum = 0.9), with the following weight decay values for respective parameters: 57 weight (decay = 0.0), 64 weight (decay = 0.0005), and 63 bias (decay = 0.0). The image sizes used for training and validation were set to 640.
The YOLOv8 model was implemented using Ultralytics YOLOv8.0.137, Python-3.10.12, and torch-2.0.1 + cu118 with CUDA support on NVIDIA T1000 (4096MiB). The training process consisted of 3000 epochs, with an allowance of 300 for early stopping. Each batch size was set to 2. The system was also configured with BoT-SORT (Robust Associations Multi-Pedestrian Tracking) [40], a rule-based tracking algorithm that is designed to be robust in the face of collisions and obstructions. This makes it ideal for video counting applications.
2.4. Accuracy Measurements
The accuracy measurement was conducted using three measurement metrics: Precision (P) (Equation (5)), Recall (R) (Equation (6)), and mean Average Precision at a specific confidence threshold of 50% (mAP50). These metrics are essential in evaluating the performance of the model and its ability to correctly identify and classify objects or instances within the given dataset.
The calculation of mAP50 involves finding the precision and recall values at the 50% confidence threshold, and then averaging the precision values across different object categories or classes. The final mAP50 score represents the average precision across all classes at the 50% confidence level.
In the above,
TP represents True Positives—the number of correct positive predictions made by the model;
FP represents False Positives—the number of incorrect positive predictions made by the model;
FN represents False Negatives—the number of positive instances that were not correctly predicted by the model.
The model was generalized using images and video. Each tested image and video was manually counted to obtain the observed count. The error (E) was calculated using the absolute value of the difference between the estimated and observed counts. The relative error percentage (RE%) was also calculated by dividing the difference between the estimated and observed counts by the observed count.
3. Results
3.1. Model Performance
The training process was stopped early, as there were no observable improvements in the last 300 epochs. The best results were achieved at epoch 261. Throughout the training, a total of 561 epochs were completed, taking approximately 12.350 h to finish. The YOLOv8 model used in the training process consists of 168 layers and a total of 3,005,843 parameters.
The performance metrics of the trained model for precision, recall, and mean average precision (mAP50) were evaluated (Table 1). During the training set, the model achieved a precision of 0.814, a recall of 0.812, and a mAP50 of 0.844. During the validation set, the model achieved a precision of 0.778, a recall of 0.798, and a mAP50 of 0.839. During the testing set, the model achieved a precision of 0.741, a recall of 0.779, and a mAP50 of 0.799. These metrics provide insights into the model’s performance in detecting objects accurately, with the validation set showing the highest overall performance.
Figure 3 illustrates the outcomes of four distinct performance curves for a computer vision model: the F1 confidence curve, the precision–confidence curve, the precision–recall curve, and the recall–confidence curve. Each curve represents how different performance metrics relate to the model’s prediction confidence across the training, validation, and test datasets. The results show that the model is performing well on both precision and recall, with an F1 score of 0.81 on the training set. However, the F1 score is slightly lower on the validation (0.79) and test (0.76) datasets. The precision–confidence curve shows that the model is very accurate at high confidence thresholds. However, the precision is slightly lower at lower confidence thresholds. The precision–recall curve shows that the model is achieving a high recall rate, which means that it is identifying a high proportion of true positives. The recall–confidence curve shows that the model is very good at identifying true positives at high confidence thresholds. However, the recall is slightly lower at lower confidence thresholds. Overall, the results indicate that the model is performing well on the training and validation sets; however, the performance on the test set is slightly lower.
3.2. Model Generalization
The generalization of the model was validated using photographs that were entirely separate from the training, validation, and testing datasets. The best performing model was then applied to two distinct types of images: roundwood stretched on a rail, and stacked timber. To clearly depict the round wood spread on the rail, the images were segmented to display solely the front surface of each log.
Upon applying the model to these images, a detailed report was generated, containing annotations for each detected object in every photo, effectively enabling automatic counting. The scenarios encompassed a variety of roundwood configurations, including widely spaced roundwood with large diameters (Figure 4A) and medium diameters (Figure 4E), scattered roundwood with small diameters (Figure 4B), as well as spaced and overlapping roundwood with smaller diameters (Figure 4C,D).
The results of the model’s performance were remarkable, as it flawlessly detected roundwood in all cases, accurately providing the precise count for each scenario. This successful detection showcases the model’s robustness and its ability to effectively handle diverse roundwood arrangements, making it a valuable tool for automated wood counting applications in real-world settings.
Subsequently, we applied the model to stacked timber in the forestry industry. It is essential to consider that in a business dealing with cellulose pulp, the stacked timber lacks a distinct arrangement and consists of a mix of large, medium, and small diameters. To assess the model’s performance, we applied it to several photographs and compared the results of ten sample images (Figure 5). For each image, we conducted a careful manual count to obtain the observed count, which we then compared with the automatic count generated by the model.
The observed count is always greater than the estimated count, which means that the estimated count is underestimating the true count. The relative error (RE%) is high for all image files, ranging from −32.817% to −48.805%, and the RE% for the video file is much lower, at −12.442% (Table 2). This suggests that the estimated count is more accurate for video files than for image files.
The video (Video S1), in which a full stack—47.4 m in length, with an estimated count of 4152 logs, and an observed count of 4742 logs— was recorded, presented an error of 590 log counts. These results provide crucial insights into the model’s accuracy and effectiveness in automating the counting process for stacked timber through video footage.
4. Discussion
The YOLO (You Only Look Once) model is a relatively new advancement in the field of computer vision, with its first iteration, YOLOv1 [22], being introduced in 2015. YOLOv1 was distinguished by its unified, single-stage detection approach. Subsequently, in 2016, YOLOv2 [41] was introduced, incorporating innovative features like anchor boxes and multi-scale training.
Building on the progress made, the YOLOv3 [42] version emerged in 2018, incorporating the feature pyramid network (FPN) for enhanced performance. The year 2020 saw the introduction of YOLOv4 [43], which introduced the bag of freebies and bag of specials, further refining the model’s capabilities.
In the same year, YOLOv5 [44] was established, boasting an auto-learning bounding box anchors feature, representing yet another significant stride in the evolution of the YOLO series. In 2022 the YOLOv6 [45] version was introduced, featuring hardware-friendly decoupled head characteristics to optimize performance on specific devices. Continuing the series, YOLOv7 [46] was established in the same year, offering trainable bag-of-freebies features and further enhancing adaptability and performance. Finally, in 2023, the latest iteration—YOLOv8 [23]—was released, introducing anchor-free detection head features, promising improved precision and flexibility. YOLOv8 employs Complete Intersection over Union (CIoU) [47] and Distribution Focal Loss (DFL) [48] functions for bounding box loss, and binary cross-entropy for classification loss. These loss functions have enhanced object detection performance, particularly in the context of smaller objects.
In comparison to other models in the field of computer vision, the YOLO model stands out as an efficient detection technique, reframing detection as a regression problem, enabling rapid image predictions, and outstripping methods like the Deformable Parts Model (DPM) and the Region-based Convolutional Neural Network (R-CNN) in terms of learning highly generalizable object representations [22,49].
This progressive evolution of the YOLO model demonstrates the constant efforts and innovations in computer vision to advance object detection and recognition, making it a versatile and powerful tool for various real-world applications. Based on these criteria, we can identify several advantages of the YOLO model, including its efficient implementation of object detection in a single stage; its open access status; and the fact that it receives regular updates to keep up with the latest advancements in the field.
Our research builds upon the impressive achievements of previous studies that have successfully utilized the YOLO model for various wood-related tasks, such as surface knot detection in lumber, the extraction of contour features from complex wood structures, and wood defect detection [24,25,27,28]. In dedicated evaluations for trunk and branch segmentation, YOLOv8 achieved precision, recall, and F1 scores of 0.888, 0.974, and 0.922 for trunks, and 0.739, 0.789, and 0.742 for branches, respectively [50]. These results demonstrate the model’s effectiveness in segmenting tree trunks and branches. The model’s versatility was further demonstrated in its application for palm tree detection, especially when coupled with unmanned aerial vehicle (UAV) imagery and remote sensing (RPW) mapping. During this application, YOLOv8 achieved a precision of 0.923, a recall of 0.951, and an F1 score of 0.937 [51]. Authors evaluated the performance of YOLOv8 variants through the classification of tree species from aerial imagery, during which YOLOv8-l outperformed other YOLOv8 variants, achieving weighted and micro-average scores of 71.55% and 72.70%, respectively [52]. Studies have also been carried out for the detection of weeds in lawns using YOLO object detectors. YOLOv8l exhibited the best performance in the initial test dataset, with a precision of 0.9476, mAP_0.5 of 0.9795, and mAP_0.5:0.95 of 0.8123; its performance in additional test datasets did not meet the standards required for professional use [53].
The method’s demonstrated robustness across diverse scenarios not only showcases its effectiveness, but also increases its potential applications in various environmental and ecological contexts. Research has indicated that object detection can be applied to a range of variables, enabling precise classification of scenes from remote sensing data. This includes tasks such as detecting trees [17] and dead trees in forest management [54], thereby enhancing our understanding of human impacts on natural ecosystems and biodiversity.
However, we focused specifically on the detection and counting of eucalypt timber, a critical component of pulp production and forest management that demands precise and efficient automation. To date, no applied studies have been found for this task. The results indicated that it was very difficult to achieve high precision in terms of detection, but it was still within acceptable limits. The model performs well, particularly in terms of precision and recall, but there are some variations in performance across the different datasets. However, the detection accuracy did not affect automated counting. Video was found to be more effective than images for counting stacked timber, as the movement of the video camera captured a wider range of logs that were not detected by photographs. Additionally, another advantage of using video is that it can be used to improve the accuracy and efficiency of object detection and counting by leveraging many frames and tracking objects across frames, avoiding double counting. Photographs should only be used for the detection and counting of separate roundwood. The acceptable margin of error for detection and counting systems varies significantly depending on the specific application. In industries where the value of the products being detected is higher, such as the pulp industry, even small errors can lead to substantial financial losses. During our exercise of detecting stacked wood using video, we achieved a detection and counting error of −12.442%. While this error is acceptable for counting purposes, further research is necessary to improve accuracy. In contrast, the use of photographs resulted in an error exceeding 30%, significantly limiting its practicality, especially for industrial applications. This highlights the critical importance of achieving high accuracy in detection and counting systems. It is important to emphasize that, in order for the established model to be operational on a large scale or to be eligible for commercial use—such as in the development of an application—a substantial number of photographs need to be used, greater than the amount we received from the industry sector that provided us with the data.
Our research not only contributes to the advancement of computer vision in the forestry sciences, but also holds the potential to revolutionize industrial processes by providing a robust and reliable tool for timber detection. The automated detection and counting of stacked eucalypt timber using the YOLOv8 model could significantly streamline both production and inventory management.
The YOLOv8 model offers automated log counting within stacked timber. When the logs within the stack possess consistent lengths or minimal length variations, the distribution of their diameters serves as a basis for calculating the solid volume. Pre-harvest inventories typically capture diameter measurements, while taper models estimate those along the length of the logs. Combining this information with diameter distribution models and their associated probabilities enables volume calculation through various methods, including the Smalian and Huber methods.
Furthermore, our study introduces exciting possibilities for the integration of computer vision technology in other aspects of forestry research and practice, propelling the industry towards a technologically advanced future. Accurately counting logs in stacks could help to improve the automation of existing applications, or aid in developing new strategies for quantifying the solid volume of stacked timber, addressing a crucial challenge in the forestry industry.
5. Conclusions
The YOLOv8 model has proven to be an effective tool for automating the counting of stacked eucalypt timber. This can provide valuable information to optimize log counting processes and improve efficiency in the forest industry. The automated counting model can significantly streamline the laborious manual counting process, saving time and resources. While it is difficult to achieve high precision in terms of detection, the accuracy did not affect automated counting. The model excelled at identifying roundwood in various arrangements, achieving high accuracy. However, it consistently underestimated the number of stacked timber logs in static images, with errors ranging from −32.817% to −48.805%. While static images posed a challenge, the model’s performance improved significantly when counting timber logs in videos, resulting in relatively lower errors of around −12.442%. Further research and improvements of the model could overcome its current limitations and make it a more robust and reliable tool for forestry operations.
Supplementary Materials
The following supporting information can be downloaded at: https://data.mendeley.com/datasets/sf3mfhhcwp/1, accessed on 12 July 2023, Video S1: Detection and counting of a full stack of eucalypt timber using a cell phone video.
Author Contributions
G.G.C.: investigation, conceptualization, data curation, formal analysis, methodology, writing—original draft, writing—review and editing. Z.H.I.: supervision, formal analysis, methodology. M.M.C.L.: data curation, writing—review and editing. A.A.L.d.S.: resources, data curation. H.G.L.: supervision, formal analysis, methodology, funding acquisition. All authors have read and agreed to the published version of the manuscript.
Funding
This study was financed in part by the Coordenação de Aperfeiçoamento de Pessoal de Nível Superior, Brazil (CAPES); Financing Code 001.
Data Availability Statement
The data presented in this study are available on request from the corresponding author.
Conflicts of Interest
The authors declare no conflict of interest.
References
- Pásztory, Z.; Heinzmann, B.; Barbu, M.C. Manual and Automatic Volume Measuring Methods for Industrial Timber. In Proceedings of the IOP Conference Series: Earth and Environmental Science; Institute of Physics Publishing: Bristol, UK, 2018; Volume 159. [Google Scholar]
- Cremer, T.; Berendt, F.; de Diez, F.M.; Wolfgramm, F.; Blasko, L. Accuracy of Photo-Optical Measurement of Wood Piles. In Proceedings of the 1st International Electronic Conference on Forests—Forests for a Better Future: Sustainability, Innovation, Interdisciplinarity, Online, 15–30 November 2020; MDPI: Basel, Switzerland, 2020; p. 90. [Google Scholar]
- Purfürst, T.; De Miguel-Díez, F.; Berendt, F.; Engler, B.; Cremer, T. Comparison of Wood Stack Volume Determination between Manual, Photo-Optical, IPad-LiDAR and Handheld-LiDAR Based Measurement Methods. iForest 2023, 16, 243–252. [Google Scholar] [CrossRef]
- Husch, B.; Beers, T.W.; Kershaw, J.A., Jr. Forest Mensuration, 4th ed.; Wiley: Hoboken, NJ, USA, 2002; ISBN 978-0471018506. [Google Scholar]
- Husch, B.; Miller, C.I.; Beers, T.W. Forest Mensuration, 3rd ed.; Krieger Publishing Company: Malabar, FL, USA, 1993. [Google Scholar]
- Antunes Santana, O.; Imaña Encinas, J.; Riesco Muñoz, G. Stacking Factor in Transporting Firewood Produced from a Mixture of Caatinga Biome Species in Brazil. Int. J. For. Eng. 2023, 34, 54–63. [Google Scholar] [CrossRef]
- Koman, S.; Feher, S. Basic Density of Hardwoods Depending on Age and Site. Wood Res. 2015, 60, 907–912. [Google Scholar]
- Glass, S.V.; Zelinka, S.L.; Johnson, J.A. Investigation of Historic Equilibrium Moisture Content Data from the Forest Products Laboratory; United States Department of Agriculture, Forest Service, Forest Products Laboratory: Madison, WI, USA, 2014.
- Watanabe, K.; Kobayashi, I.; Kuroda, N. Investigation of Wood Properties That Influence the Final Moisture Content of Air-Dried Sugi (Cryptomeria japonica) Using Principal Component Regression Analysis. J. Wood Sci. 2012, 58, 487–492. [Google Scholar] [CrossRef]
- Carvalho, A.M.; Camargo, F.R.A. Avaliacao Do Metodo de Recebimento de Madeira Por Estere [Evaluation of the Method of Receiving Wood by Stere]. Rev. O Papel 1996, 57, 65–68. [Google Scholar]
- Nylinder, M.; Kubénka, T.; Hultnäs, M. Roundwood Measurement of Truck Loads by Laser Scanning. In Field Study at Arauco Pulp Mill Nueva Aldea; 2008; pp. 1–9. Available online: https://docplayer.net/33097769-Roundwood-measurement-of-truck-loads-by-laser-scanning-a-field-study-at-arauco-pulp-mill-nueva-aldea.html (accessed on 15 May 2023).
- Kunickaya, O.; Pomiguev, A.; Kruchinin, I.; Storodubtseva, T.; Voronova, A.; Levushkin, D.; Borisov, V.; Ivanov, V. Analysis of Modern Wood Processing Techniques in Timber Terminals. Cent. Eur. For. J. 2022, 68, 51–59. [Google Scholar] [CrossRef]
- Campos, J.C.C.; Leite, H.G. Forest Measurement: Questions and Answers, 5th ed.; UFV: Viçosa, Brazil, 2017; ISBN 978-8572695794. [Google Scholar]
- Soares, C.B.S.; Paula Neto, F.; Souza, A.L. Dendrometria e Inventário Florestal, 2nd ed.; Universidade Federal de Viçosa: Viçosa, Brazil, 2011. [Google Scholar]
- Mederski, P.S.; Naskrent, B.; Tomczak, A.; Tomczak, K. Accuracy of Photo-Optical Timber Measurement Using a Stereo Camera Technology. Croat. J. For. Eng. 2023, 45, 10. [Google Scholar] [CrossRef]
- Leite, R.V.; do Amaral, C.H.; de Pires, R.P.; Silva, C.A.; Soares, C.P.B.; Macedo, R.P.; da Silva, A.A.L.; Broadbent, E.N.; Mohan, M.; Leite, H.G. Estimating Stem Volume in Eucalyptus Plantations Using Airborne LiDAR: A Comparison of Area- and Individual Tree-Based Approaches. Remote Sens. 2020, 12, 1513. [Google Scholar] [CrossRef]
- Pu, Y.; Xu, D.; Wang, H.; Li, X.; Xu, X. A New Strategy for Individual Tree Detection and Segmentation from Leaf-on and Leaf-off UAV-LiDAR Point Clouds Based on Automatic Detection of Seed Points. Remote Sens. 2023, 15, 1619. [Google Scholar] [CrossRef]
- Bertola, A.; Soares, C.P.B.; Ribeiro, J.C.; Leite, H.G.; de Souza, A.L. Determination of Piling Factors through Digitora Software. Rev. Árvore 2003, 27, 837–844. [Google Scholar] [CrossRef]
- Silveira, D.D.P. Estimation of the Volume Wooden Stacked Using Digital Images and Neural Networks. Master’s Thesis, Universidade Federal de Viçosa, Viçosa, Brazil, 2014. [Google Scholar]
- Kärhä, K.; Nurmela, S.; Karvonen, H.; Kivinen, V.-P.; Melkas, T.; Nieminen, M. Estimating the Accuracy and Time Consumption of a Mobile Machine Vision Application in Measuring Timber Stacks. Comput. Electron. Agric. 2019, 158, 167–182. [Google Scholar] [CrossRef]
- Moskalik, T.; Tymendorf, Ł.; van der Saar, J.; Trzciński, G. Methods of Wood Volume Determining and Its Implications for Forest Transport. Sensors 2022, 22, 6028. [Google Scholar] [CrossRef] [PubMed]
- Redmon, J.; Divvala, S.; Girshick, R.; Farhadi, A. You Only Look Once: Unified, Real-Time Object Detection. In Proceedings of the IEEE Conference on Computer Vision and Pattern Recognition, Las Vegas, NV, USA, 27–30 June 2016; pp. 779–788. [Google Scholar]
- Jocher, G.; Chaurasia, A.; Qiu, J. YOLO by Ultralytics; Version 8.0.0; 2023; Available online: https://github.com/ultralytics/ultralytics (accessed on 15 May 2023).
- Fang, Y.; Guo, X.; Chen, K.; Zhou, Z.; Ye, Q. Accurate and Automated Detection of Surface Knots on Sawn Timbers Using YOLO-V5 Model. Bioresources 2021, 16, 5390–5406. [Google Scholar] [CrossRef]
- Ma, J.; Yan, W.; Liu, G.; Xing, S.; Niu, S.; Wei, T. Complex Texture Contour Feature Extraction of Cracks in Timber Structures of Ancient Architecture Based on YOLO Algorithm. Adv. Civ. Eng. 2022, 2022, 7879302. [Google Scholar] [CrossRef]
- Liu, Y.; Hou, M.; Li, A.; Dong, Y.; Xie, L.; Ji, Y. Automatic Detection of Timber-Cracks in Wooden Architectural Heritage Using YOLOv3 Algorithm. Int. Arch. Photogramm. Remote Sens. Spat. Inf. Sci. 2020, 43, 1471–1476. [Google Scholar] [CrossRef]
- Kurdthongmee, W. Improving Wood Defect Detection Accuracy with Yolo V3 by Incorporating Out-of-Defect Area Annotations. Available online: https://ssrn.com/abstract=4395580 (accessed on 21 July 2023).
- Cui, Y.; Lu, S.; Liu, S. Real-Time Detection of Wood Defects Based on SPP-Improved YOLO Algorithm. Multimed. Tools Appl. 2023, 82, 21031–21044. [Google Scholar] [CrossRef]
- Davies, E.R. The Dramatically Changing Face of Computer Vision. In Advanced Methods and Deep Learning in Computer Vision; Elsevier: Amsterdam, The Netherlands, 2022; pp. 1–91. [Google Scholar]
- Goodale, M.A.; Milner, A.D. Separate Visual Pathways for Perception and Action. Trends Neurosci. 1992, 15, 20–25. [Google Scholar] [CrossRef]
- Zhu, S.-C.; Wu, Y. Statistics of Natural Images. In Computer Vision; Springer International Publishing: Cham, Switzerland, 2023; pp. 19–35. [Google Scholar]
- Krizhevsky, A.; Sutskever, I.; Hinton, G.E. ImageNet Classification with Deep Convolutional Neural Networks. Commun. ACM 2017, 60, 84–90. [Google Scholar] [CrossRef]
- Zeiler, M.D.; Fergus, R. Visualizing and Understanding Convolutional Networks. In Computer Vision–ECCV 2014: 13th European Conference, Zurich, Switzerland, September 6–12, 2014, Proceedings, Part I 13; Springer International Publishing: Cham, Switzerland, 2014; pp. 818–833. [Google Scholar]
- Gavali, P.; Banu, J.S. Deep Convolutional Neural Network for Image Classification on CUDA Platform. In Deep Learning and Parallel Computing Environment for Bioengineering Systems; Elsevier: Amsterdam, The Netherlands, 2019; pp. 99–122. [Google Scholar]
- Voulodimos, A.; Doulamis, N.; Doulamis, A.; Protopapadakis, E. Deep Learning for Computer Vision: A Brief Review. Comput. Intell. Neurosci. 2018, 2018, 7068349. [Google Scholar] [CrossRef]
- Zhang, Y.; Liu, S.; Tu, W.; Yu, H.; Li, C. Using Computer Vision and Compressed Sensing for Wood Plate Surface Detection. Opt. Eng. 2015, 54, 103102. [Google Scholar] [CrossRef]
- Cavalin, P.; Oliveira, L.S.; Koerich, A.L.; Britto, A.S. Wood Defect Detection Using Grayscale Images and an Optimized Feature Set. In Proceedings of the IECON 2006—32nd Annual Conference on IEEE Industrial Electronics, Paris, France, 6–10 November 2006; pp. 3408–3412. [Google Scholar]
- Tzutalin, D. LabelImg 2015. Available online: https://github.com/tzutalin/labelImg (accessed on 15 May 2023).
- Terven, J.; Cordova-Esparza, D. A Comprehensive Review of YOLO: From YOLOv1 to YOLOv8 and Beyond. arXiv 2023, arXiv:2304.00501. [Google Scholar] [CrossRef]
- Aharon, N.; Orfaig, R.; Bobrovsky, B.-Z. BoT-SORT: Robust Associations Multi-Pedestrian Tracking. arXiv 2022, arXiv:2206.14651. [Google Scholar] [CrossRef]
- Redmon, J.; Farhadi, A. YOLO9000: Better, Faster, Stronger. In Proceedings of the IEEE Conference on Computer Vision and Pattern Recognition, Honolulu, HI, USA, 21–26 July 2017; pp. 7263–7271. [Google Scholar]
- Redmon, J.; Farhadi, A. Yolov3: An Incremental Improvement. arXiv 2018, arXiv:1804.02767. [Google Scholar] [CrossRef]
- Bochkovskiy, A.; Wang, C.Y.; Liao, H.Y.M. Yolov4: Optimal Speed and Accuracy of Object Detection. arXiv 2020, arXiv:2004.10934. [Google Scholar] [CrossRef]
- Jocher, G. YOLOv5 by Ultralytics; Version 7.0; 2020; Available online: https://github.com/ultralytics/yolov5/releases/tag/v7.0 (accessed on 21 June 2023).
- Li, C.; Li, L.; Jiang, H.; Weng, K.; Geng, Y.; Li, L.; Ke, Z.; Li, Q.; Cheng, M.; Nie, W.; et al. YOLOv6: A Single-Stage Object Detection Framework for Industrial Applications. arXiv 2022, arXiv:2209.02976. [Google Scholar] [CrossRef]
- Wang, C.Y.; Bochkovskiy, A.; Liao, H.Y.M. YOLOv7: Trainable Bag-of-Freebies Sets New State-of-the-Art for Real-Time Object Detectors. In Proceedings of the IEEE/CVF Conference on Computer Vision and Pattern Recognition, Vancouver, BC, Canada, 18–22 June 2023; pp. 7464–7475. [Google Scholar]
- Zheng, Z.; Wang, P.; Liu, W.; Li, J.; Ye, R.; Ren, D. Distance-IoU Loss: Faster and Better Learning for Bounding Box Regression. In Proceedings of the AAAI Conference on Artificial Intelligence, New York, NY, USA, 7–12 February 2020; Volume 34, pp. 12993–13000. [Google Scholar] [CrossRef]
- Li, X.; Wang, W.; Wu, L.; Chen, S.; Hu, X.; Li, J.; Tang, J.; Yang, J. Generalized Focal Loss: Learning Qualified and Distributed Bounding Boxes for Dense Object Detection. Adv. Neural Inf. Process. Syst. 2020, 33, 21002–21012. [Google Scholar]
- Liu, W.; Anguelov, D.; Erhan, D.; Szegedy, C.; Reed, S.; Fu, C.-Y.; Berg, A.C. SSD: Single Shot MultiBox Detector. In Computer Vision—ECCV 2016. ECCV 2016; Lecture Notes in Computer Science; Springer: Cham, Switzerland, 2016; Volume 9905, pp. 21–37. [Google Scholar]
- Ahmed, D.; Sapkota, R.; Churuvija, M.; Karkee, M. Machine Vision-Based Crop-Load Estimation Using YOLOv8. arXiv 2023. [Google Scholar] [CrossRef]
- Hajjaji, Y.; Alzahem, A.; Boulila, W.; Farah, I.R.; Koubaa, A. Sustainable Palm Tree Farming: Leveraging IoT and Multi-Modal Data for Early Detection and Mapping of Red Palm Weevil. arXiv 2023, arXiv:2306.16862. [Google Scholar] [CrossRef]
- Bayrak, O.C.; Erdem, F.; Uzar, M. Deep Learning Based Aerial Imagery Classification for Tree Species Identification. Int. Arch. Photogramm. Remote Sens. Spatial Inf. Sci. 2023, 48, 471–476. [Google Scholar] [CrossRef]
- Sportelli, M.; Apolo-Apolo, O.E.; Fontanelli, M.; Frasconi, C.; Raffaelli, M.; Peruzzi, A.; Perez-Ruiz, M. Evaluation of YOLO Object Detectors for Weed Detection in Different Turfgrass Scenarios. Appl. Sci. 2023, 13, 8502. [Google Scholar] [CrossRef]
- Wang, X.; Zhao, Q.; Jiang, P.; Zheng, Y.; Yuan, L.; Yuan, P. LDS-YOLO: A Lightweight Small Object Detection Method for Dead Trees from Shelter Forest. Comput. Electron. Agric. 2022, 198, 107035. [Google Scholar] [CrossRef]
Figure 1.
The database comprises a set of two types of images used to train the YOLOv8 model.

Figure 2.
Annotation format and dataset splitting in an image of stacked eucalypt timber.

Figure 3.
Evaluation of the different performance curves for the trained model, comprising the F1 confidence curve, precision–confidence curve, precision–recall curve, and recall–confidence curve.
Figure 3.
Evaluation of the different performance curves for the trained model, comprising the F1 confidence curve, precision–confidence curve, precision–recall curve, and recall–confidence curve.

Figure 4.
Images used in model generalization, classified as spaced roundwood with large diameters (A) and medium diameters (E), scattered roundwood with small diameters (B), as well as spaced and overlapping roundwood with smaller diameters (C,D).
Figure 4.
Images used in model generalization, classified as spaced roundwood with large diameters (A) and medium diameters (E), scattered roundwood with small diameters (B), as well as spaced and overlapping roundwood with smaller diameters (C,D).

Figure 5.
Images (A–J) used in the generalization of the model for the counting and detection of stacked timber in the pulp production industry.
Figure 5.
Images (A–J) used in the generalization of the model for the counting and detection of stacked timber in the pulp production industry.


Table 1.
Performance metrics evaluated in stacked eucalypt timber data splitting.
| Data Splitting | Precision | Recall | mAP50 |
|---|---|---|---|
| Train | 0.814 | 0.812 | 0.844 |
| Validation | 0.778 | 0.798 | 0.839 |
| Test | 0.741 | 0.779 | 0.799 |
Table 2.
File data and error analyses for images and video tested.
| File Name | Type | File | Observed Count | Estimated Count | E | RE% |
|---|---|---|---|---|---|---|
| A | Image | .jpg | 278 | 147 | 131 | −47.122 |
| B | Image | .jpg | 387 | 260 | 127 | −32.817 |
| C | Image | .jpg | 540 | 300 | 240 | −44.444 |
| D | Image | .jpg | 580 | 300 | 280 | −48.276 |
| E | Image | .jpg | 534 | 300 | 234 | −43.82 |
| F | Image | .jpg | 586 | 300 | 286 | −48.805 |
| G | Image | .jpg | 524 | 300 | 224 | −42.748 |
| H | Image | .jpg | 546 | 300 | 246 | −45.055 |
| I | Image | .jpg | 452 | 273 | 179 | −39.602 |
| J | Image | .jpg | 217 | 114 | 103 | −47.465 |
| Video S1 | video | .avi | 4742 | 4152 | 590 | −12.442 |
Disclaimer/Publisher’s Note: The statements, opinions and data contained in all publications are solely those of the individual author(s) and contributor(s) and not of MDPI and/or the editor(s). MDPI and/or the editor(s) disclaim responsibility for any injury to people or property resulting from any ideas, methods, instructions or products referred to in the content. |
© 2023 by the authors. Licensee MDPI, Basel, Switzerland. This article is an open access article distributed under the terms and conditions of the Creative Commons Attribution (CC BY) license (https://creativecommons.org/licenses/by/4.0/).
Share and Cite
MDPI and ACS Style
Casas, G.G.; Ismail, Z.H.; Limeira, M.M.C.; da Silva, A.A.L.; Leite, H.G. Automatic Detection and Counting of Stacked Eucalypt Timber Using the YOLOv8 Model. Forests 2023, 14, 2369. https://doi.org/10.3390/f14122369
AMA Style
Casas GG, Ismail ZH, Limeira MMC, da Silva AAL, Leite HG. Automatic Detection and Counting of Stacked Eucalypt Timber Using the YOLOv8 Model. Forests. 2023; 14(12):2369. https://doi.org/10.3390/f14122369
Chicago/Turabian StyleCasas, Gianmarco Goycochea, Zool Hilmi Ismail, Mathaus Messias Coimbra Limeira, Antonilmar Araújo Lopes da Silva, and Helio Garcia Leite. 2023. "Automatic Detection and Counting of Stacked Eucalypt Timber Using the YOLOv8 Model" Forests 14, no. 12: 2369. https://doi.org/10.3390/f14122369
Note that from the first issue of 2016, this journal uses article numbers instead of page numbers. See further details here.