


Detection of Cherry Tree Crown Based on Improved LA-dpv3+ Algorithm
by
Zhenzhen Cheng
1,
Yifan Cheng
2,*,
Meng Li
1,
Xiangxiang Dong
1,
Shoufu Gong
1 and
Xiaoxiao Min
1 1
School of Horticulture, Xinyang Agriculture and Forestry University, No. 1, North Ring Road, Pingqiao District, Xinyang 464000, China
2
School of Optical and Electronic Information, Huazhong University of Science and Technology, 1037 Luoyu Road, Hongshan District, Wuhan 430074, China
*
Author to whom correspondence should be addressed.
Forests 2023, 14(12), 2404; https://doi.org/10.3390/f14122404
Submission received: 10 November 2023
/
Revised: 4 December 2023
/
Accepted: 7 December 2023
/
Published: 9 December 2023
(This article belongs to the Topic Metrology-Assisted Production in Agriculture and Forestry)
Abstract
:Accurate recognition of the canopy is a prerequisite for precision orchard yield estimation. This paper proposed an enhanced LA-dpv3+ approach for the recognition of cherry canopies based on UAV image data, with a focus on enhancing feature representation through the implementation of an attention mechanism. The attention mechanism module was introduced to the encoder stage of the DeepLabV3+ architecture, which improved the network’s detection accuracy and robustness. Specifically, we developed a diagonal discrete cosine transform feature strategy within the attention convolution module to extract finer details of canopy information from multiple frequency components. The proposed model was constructed based on a lightweight DeepLabv3+ network architecture that incorporates a MobileNetv2 backbone, effectively reducing computational costs. The results demonstrate that our proposed method achieved a balance between computational cost and the quality of results when compared to competing approaches. Our model’s accuracy exceeded 89% while maintaining a modest model size of only 46.8 MB. The overall performance indicated that with the help of a neural network, segmentation failures were notably reduced, particularly in high-density weed conditions, resulting in significant increases in accuracy (ACC), F1-score, and intersection over union (IOU), which were increased by 5.44, 3.39, and 8.62%, respectively. The method proposed in this paper may be applied to future image-based applications and contribute to automated orchard management.
1. Introduction
Agricultural remote sensing is the process of optimizing crop production using satellites, human-powered aircraft, and unmanned aerial vehicles (UAVs) [1,2]. Advances in UAV technology have allowed farmers to obtain high-resolution images at far lower costs than traditional methods. Thus, UAV images have become an important data source for agricultural remote sensing [3,4,5,6]. Furthermore, innovative approaches to UAV image processing have become a consistent pursuit in this domain [7,8,9]. In particular, studies that have focused on individual tree identification and extraction using UAV images have suggested the platform’s potential for the detection and delineation of tree canopies. Subsequently, it is expected that the morphological parameters of trees can be accurately identified on a singular basis [10,11,12].
Accurate tree identification is a prerequisite for canopy extraction studies. Feature-based machine-learning methods are widely used for tree identification owing to their simplicity and universality in terms of canopy textures [13,14,15], grayscales [16,17,18], and spectra [19,20]. Such image features typically do not appear individually, but are combined together in statistical analyses to achieve various types of advanced tasks [21,22,23]. Interestingly, complex and highly detailed images allow manual feature engineering to resolve object detection problems, but doing so is costly and difficult, especially when the object and backgrounds share similar features [24]. Compared with manual feature engineering, deep learning (DL) networks enable the automatic detection of the characteristics of single trees, making their identification an ideal candidate process for low-altitude and high-spatial-resolution UAV image processing.
Many advanced DL techniques have been introduced for UAV tree extraction owing to their powerful feature extraction capabilities. According to the output results, these DL models can be divided into three categories: object detection, semantic segmentation, and instance segmentation. Object detection-based tree canopy detection methods adopt rectangular box-labeling of the tree canopy boundary. Santos assessed the performance of three classic detection algorithms, including the “faster” region-based convolutional neural network (RCNN), YOLOv3, and RetinaNet, for urban environments [25]. Their results showed that target detection algorithms based on a convolutional neural network (CNN) accurately locate single target trees in a canopy. Zheng proposed a framework based on faster RCNN to delineate a bounding box around the individual canopies of single oil palm trees, successfully providing information about their positions and locations [26]. Although this information is valuable, some key details regarding the morphology of the tree canopy (e.g., individual shapes and contours) were not provided.
Instance segmentation applies different labels to separate instances of objects belonging to the same class. The latest research reported that these technologies accurately delineate the boundaries of distinct trees while providing detailed location and spatial information [27,28,29]. However, this comes at the price of high computational and per-pixel image annotation costs. Most instance segmentation algorithms focus on improving model performance while ignoring the balance between computational costs and accuracy. In contrast, our approach in this paper emphasizes the use of semantic segmentation. Semantic segmentation algorithms excel at capturing object boundaries compared to object detection and offer computational efficiency compared to instance segmentation [30].
Semantic segmentation has ushered in a new era of benefits via the introduction of fully convolutional networks (FCNs) [31]. Building upon this, U-Net adopts an encoder–decoder structure to stitch shallow and deep features to accurately recover the details of reduced images during image size recovery [32]. Kattenborn achieved semantic segmentations with the U-Net architecture applied to shrubs, herbs, and trees with 84% accuracy [33]. However, the segmentation of large-scale objects suffers because the detailed location/spatial information related to object boundaries is missing owing to pooling or striding operations, despite the U-shaped encoder–decoder architecture storing the richest information [34].
Models such as DeepLab later extended these approaches by introducing atrous convolutions, conditional random fields (i.e., DeepLabv1), residual networks, and Atrous Spatial Pyramid Pooling (ASPP). The current DeepLabv3+ surpasses the previous versions in the DeepLab family, and experimental results using the PASCAL VOC-2012 dataset have demonstrated that DeepLabv3+ outperforms SegNet [35], the pyramid scene parsing network (PSP) [36], and FCN [37,38]. DeepLabv3+ has, therefore, been widely used for image segmentation tasks in various complex scenes, such as along roads [39], water systems [40], and farmland extraction [41]. Morales reported that the DeepLabv3+ model outperforms four U-Net architectures in identifying semantically segmented mauritia flexuosa palm trees from UAV images [42]. Ferreira used DeepLabv3+ alongside morphological post-processing to detect palm tree canopies and compared the results to the standard FCN, showing an improvement in canopy detection of 34.7% [43].
Although DeepLabv3+ shows excellent performance, the application strategies that can be applied to different scenarios require constant reassessment. For example, although it improves accuracy and speed by adopting the improved Xception backbone, these improvements come at the price of complex architectures and persistently high computational costs, which make it difficult to run on farm terminals with limited computing power. Hence, Torres evaluated the performance of Xception and MobileNetv2 as interchangeable backbone models of DeepLabv3+ for Brazilian Cumbaru tree segmentation [30]. Quantitative analyses showed that the MobileNetv2-based model effectively delineated canopy types with lower computational costs than when using the Xception backbone. Encoding lightweight backbone networks allows for practical algorithmic convergence with lower costs, which is quite amenable to agricultural uses. However, DeepLabv3+ and its lightweight backbone networks do not perform well with noncompact cherry tree extractions. Normally, fruit tree pruning, which comprises a task different to forest-land classification, encourages branches to grow toward an outer spherical threshold so that both air and light penetrate the inner foliage to reach the center of the tree as much as possible. This human-induced growth style exacerbates DeepLabv3+’s inability to completely estimate the relationship between the local features of large-scale targets owing to their non-customized expansion ratios, resulting in the appearance of holes in large-scale target segmentation despite the high overall accuracy.
To remedy these shortcomings, the current study aims to develop a low-cost lightweight tree canopy extraction model, provide a semantic segmentation strategy for non-compact fruit trees with gaps between branches, and assess the DeepLabv3+ backbone variants in the performance of tree segmentation.
2. Study Site and Materials
2.1. Study Site and Image Acquisition
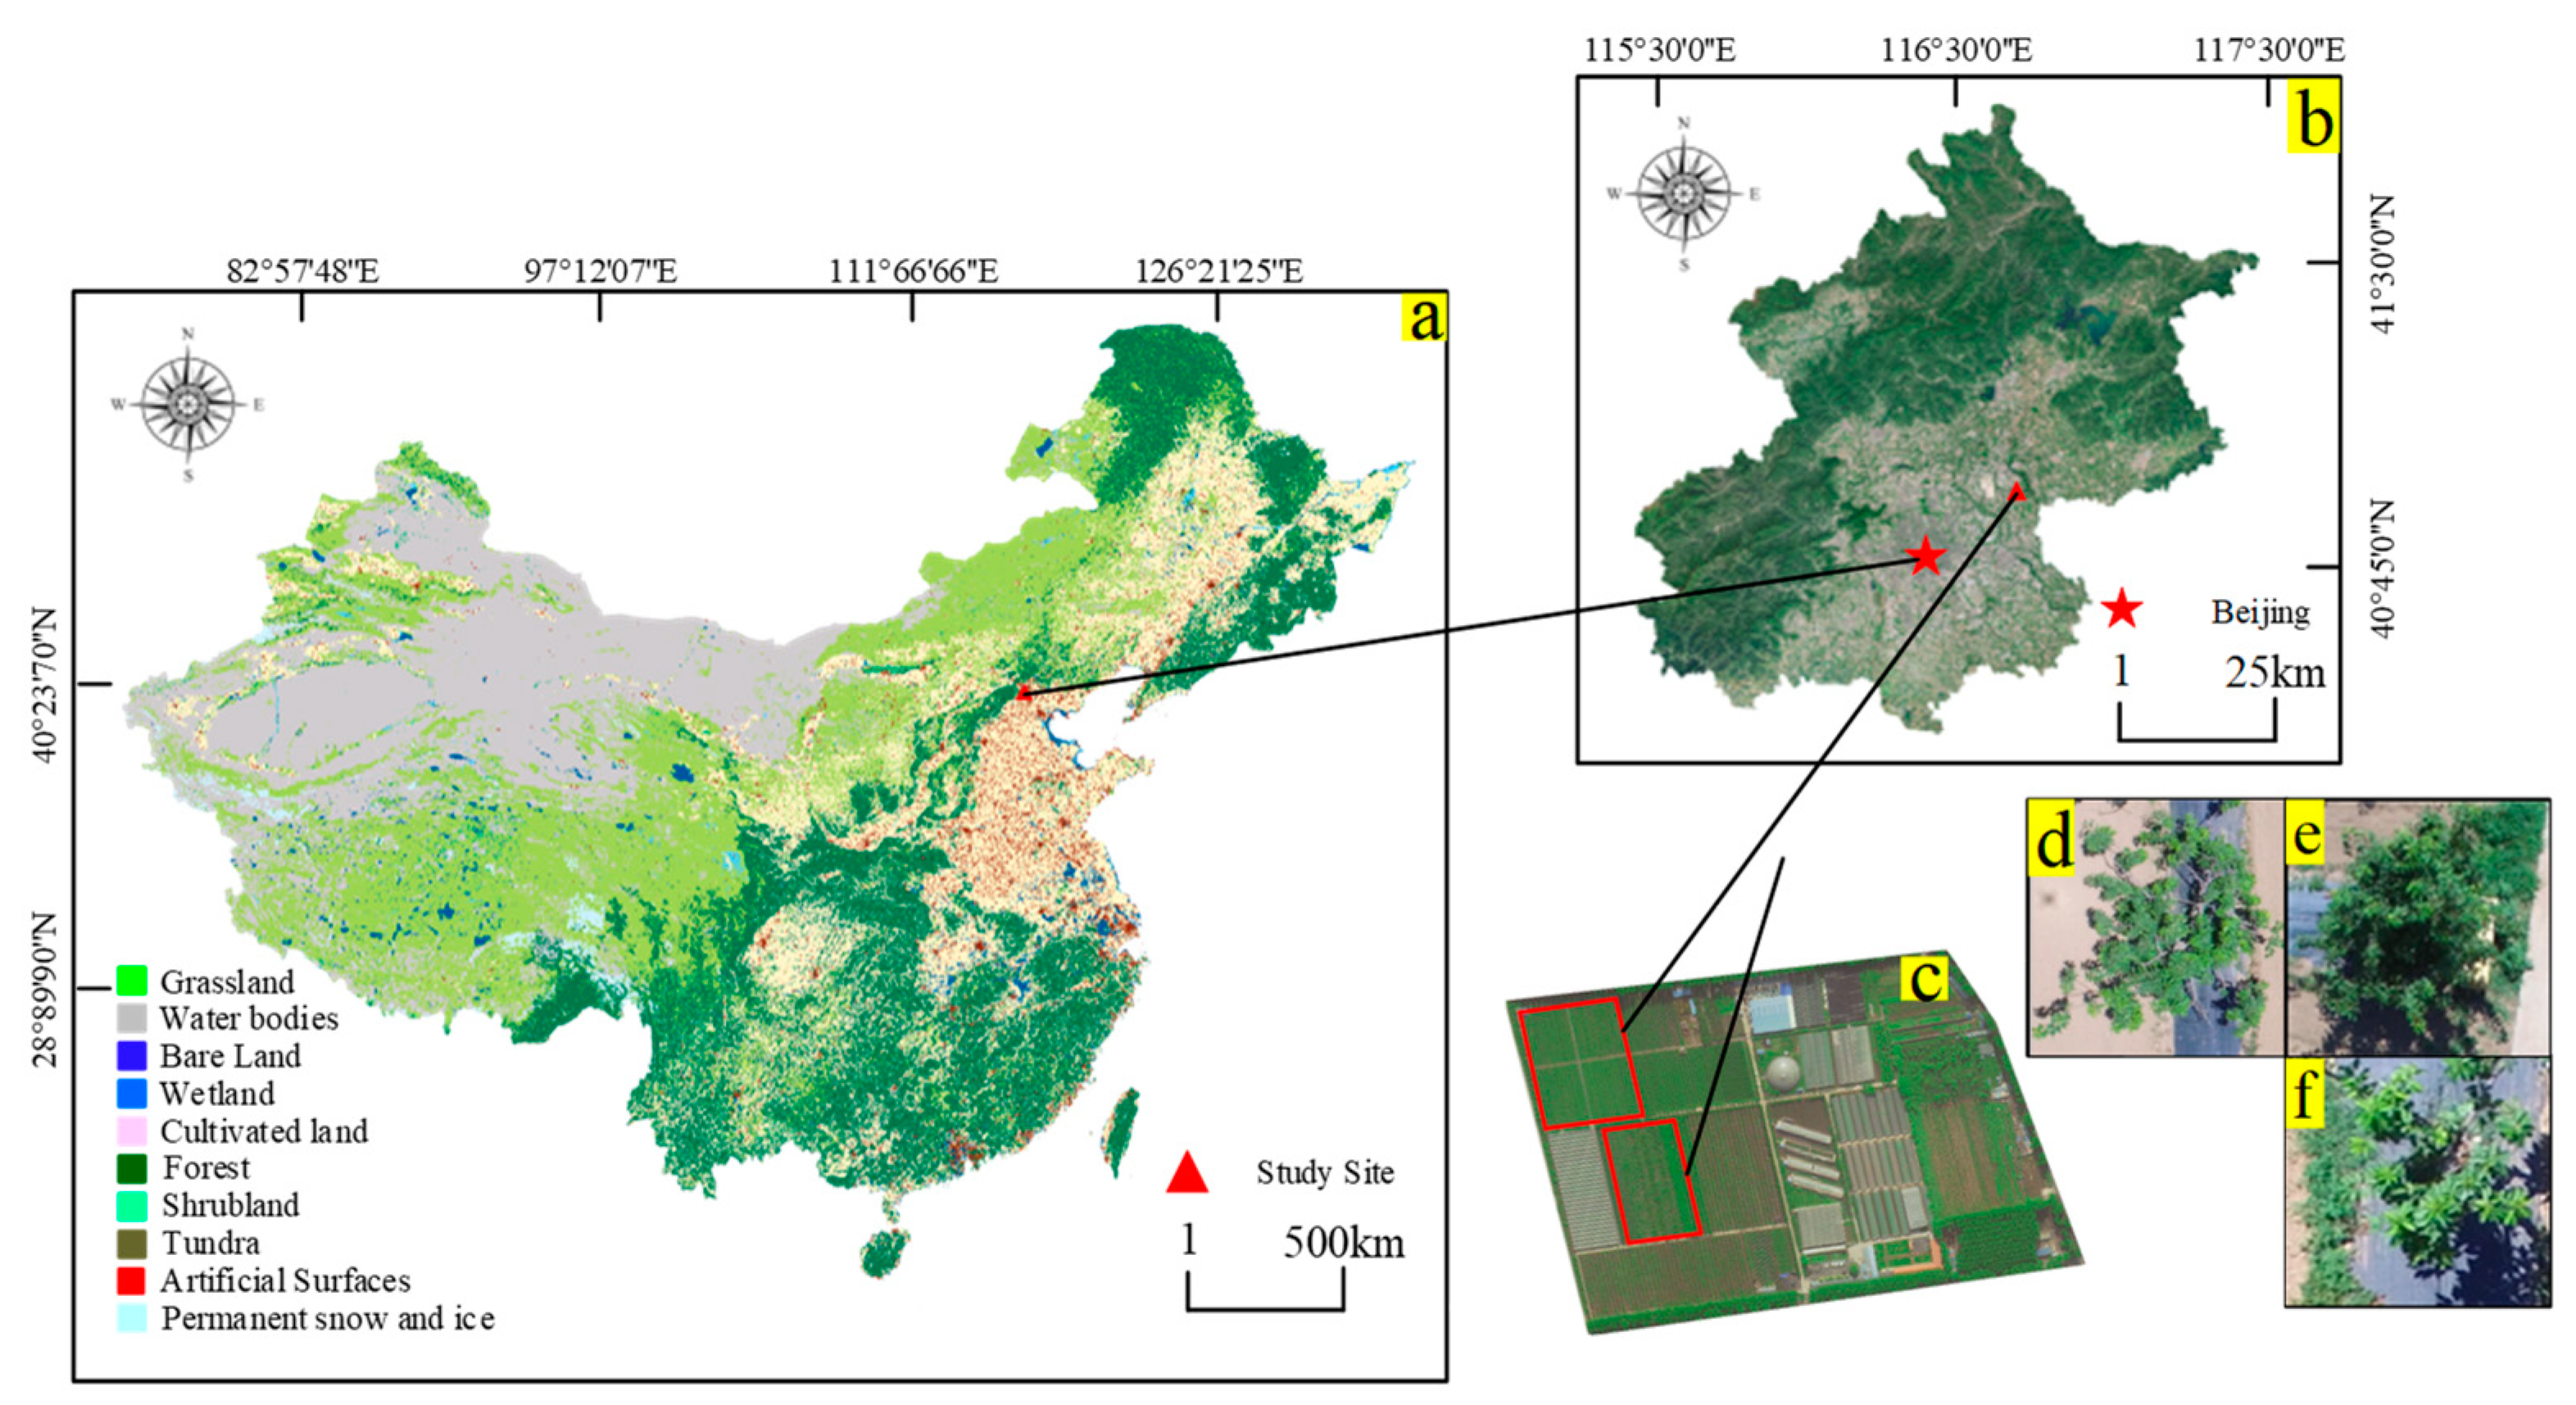
Beijing Zhongnong Futong Horticulture Co., Ltd., is an agricultural high-tech service enterprise, leveraging expertise and technologies from leading scientific research institutions, including China Agricultural University, Chinese Academy of Agricultural Sciences, Beijing Academy of Agriculture and Forestry, and Beijing Agricultural College. The study area took place in Zhongnong Futong’s commercial cherry orchard (Figure 1a–c). The orchard spans over 200 acres, featuring cherry tree heights ranging from 2 to 5 m. The cherry trees were meticulously spaced at intervals of 4 m with 5 m paths between rows. The canopy had grown irregularly, the branches and leaves were scattered with many gaps, and some had noticeable holes (Figure 1d) and black-hole shadows (Figure 1e). Weeds of different densities were randomly distributed on both sides of each row, and their physiological characteristics (e.g., color and texture) were similar to those of a natural tree canopy (Figure 1f). Images of the study areas were obtained using a commercial-grade DJI Phantom 3 UAV quadcopter (DJI Technology Co., Ltd., Shenzhen, China) equipped with a Sony EXMOR 1/2.3 in complementary metal–oxide–semiconductor digital camera (Sony Corporation, Tokyo, Japan), outputting 3000 × 4000-pixel red–green–blue three-channel images. Observations were taken in dry, windless weather (<1.5 m/s) at multiple distances from the trees (20–60 m) to capture variations in scale.
A typical UAV flight plan includes a procedure to obtain video batch training datasets and high-quality images by hovering at multiple distances from the trees. In our study, 1037 images were taken from the test area. For more details about the experimental setup, please see Cheng et al. (2020) [24].
2.2. Dataset Construction
Semantic segmentation requires pixel-level labeled datasets. In this study, each image pixel was manually assigned to a tree or background category using free DL LabelMe software (version 5.0.1, developed by the Massachusetts Institute of Technology, Cambridge, MA, USA) [44]. Each cherry tree crown was delineated manually by an expert with experience in agricultural image processing, and the data were used as a benchmark for model training and evaluation (Figure 2). To improve the generalizability of the model, the original cherry tree images were selected under different weather and altitude conditions and further expanded using image augmentation methods that included random rotations of 45°, 90°, 135°, and 180° and random flipping in mirror, horizontal, and vertical modes, resulting in an augmented dataset of 2168 images, which were divided into training, validation, and testing sets at a ratio of 8:1:1 by random selection. The test set consisted of images near the ground (20–30 m), at low altitudes (50–60 m), and with low- and high-density weed coverage. The statistics of these datasets are shown in Table 1.
3. Methodology
The proposed method can be summarized in two steps. The first distinguishes the tree canopy regions from the background using the LA-dpv3+ network. The model’s DeepLabv3+ framework was modified by replacing Xception with MobileNetv2 as the backbone for feature extraction, which effectively reduces the memory required for network parameters and operations. To strengthen tree information extractability, an effective discrete cosine transform (DCT) module was designed to enhance the convolutional block attention module (CBAM). A simplified connection to the main module is shown in Figure 2. The second stage, following background removal, discriminates individual tree detections in the face of continuous tree canopies (see Section 3.2).
3.1. LA-dpv3+ Network
This section briefly introduces the basic DeepLabv3+ architecture, MobileNetv2 network, and enhanced CBAM modules, which comprise blocks of the proposed approach. It then discusses the proposed segmentation framework.
3.1.1. Fundamentals of DeepLabv3+ Architecture
DeepLabv3+ was proposed by Google and was built upon its predecessor, DeepLabv3 [35]. It is mainly implemented by encoder and decoder modules. The encoder stage is dedicated to extracting image features and consists of the X_ception-65 backbone and the ASPP mechanism. Specifically, X_ception-65 outputs low-level features for the decoder module and high-level semantics for the ASPP layer. In DeepLabv3+, X_ception-65 removes all max-pooling layers of the aligned Xception backbone and replaces the depth-wise separable convolution with striding. It also adds batch normalization and rectified linear unit (ReLU) operations. The ASPP convolution’s custom dilation rate was used to capture the global context of each image. It consists of a 1 × 1 and three 3 × 3 atrous layers at rates of 6, 12, and 18, and it incorporates an image-pooling layer. In the decoder stage, the features extracted by the ASPP module were bilinearly upsampled by a factor of four, followed by concatenation with the corresponding low-level features from the encoder stage. Before concatenation, low-level features were first convolved with a 1 × 1 filter to reduce the number of channels (Chen et al., 2018). Finally, the three 3 × 3 convolutions were applied to refine the fused features, followed by 4× bilinear upsampling.
Figure 3 shows that X_ception-65 contained 65 convolutional layers, including 11 in the ingress stream, 48 in the intermediate stream, and 6 in the egress stream. Although X_ception-65 is a powerful feature extractor, its computational complexity is high, resulting in a heavier-than-warranted DeepLab3+ encoder module. To reduce computational redundancy, a lightweight network is needed that operates using limited calculation resources so that agricultural platforms can be supported.
3.1.2. MobileNetv2 Backbone
MobileNetv2 [45] is a network conceived for mobile and embedded devices with fewer parameters and fewer computational complexities than larger models. Therefore, it is suitable for real-time applications on embedded terminals. Additionally, research has reported that, although DeepLabv3+ uses the new generation MobileNetv3 to receive slight advantages in computation, its accuracy is lower than that of DeepLabv3+ using MobileNetv2 [46]. Therefore, MobileNetv2 was chosen in this study as the main feature extraction network. It builds upon the core MobileNetv1 [47] benefits of extensive depth-wise separable convolutions used as efficient building blocks, which significantly reduces the number of parameters. In particular, MobileNetv2 introduced the inverted residual block, in which residual connections exist between bottleneck layers. The bottleneck structure was first developed as part of the ResNet network, and adding a bottleneck structure to MobileNetv2 avoids information loss from tensors with a small number of channels caused by the ReLU operation. Because the last layer of the point-by-point convolution uses the linear activation function, it also has a “linear bottleneck” structure. This inverse residual structure is based on the standard ResNet, which entails first reducing the dimensionality, followed by increasing it, whereas the inverse residual increases the dimension first using the point-by-point convolution and reduces the dimension of the result of the depth-wise convolution. Compared with the standard design, the inverted structure is significantly more memory-efficient. The MobileNetv2 encoder reduces the computational complexity of the model, but it also weakly captures and fuses semantic information. The solution to this problem is described in the next subsection.
3.1.3. Enhanced Attention Module
Holes and other irregular canopy shapes are commonly observed in cherry orchard scenarios, and they call for contextual and detailed semantic information so that neural network models can pay attention to these features. CBAM (a convolutional block attention module) is a sophisticated neural network module designed to enhance the performance of convolutional neural networks (CNNs) by prioritizing relevant spatial and channel-wise features for capturing intricate image features [48]. Demonstrating its effectiveness across various computer vision tasks, including image classification and object detection, CBAM has proven to be a powerful tool in diverse research areas [49,50,51]. Consequently, this paper utilizes CBAM to refine the features extracted from the lightweight model. Therefore, this paper leverages CBAM to refine the features extracted from the lightweight model.
The CBAM was developed from human visual attention methods, which pay more attention to key features and ignore those that contribute less. It consists of channel and spatial attention blocks, and the channel attention mechanism identifies the most meaningful features located by the spatial attention mechanism. The CBAM uses global average pooling (GAP) to simply average the features, which causes sufficient semantic information to be preserved in feature maps, even when combined with global max-pooling. Qin et al. showed that GAP is a special case of DCT, and using GAP in the channel attention mechanism means that only the lowest-frequency information is retained, whereas it discards important information from other frequencies [52]. Inspired by Qin et al., our frequency layer is incorporated into the channel attention mechanism of CBAM to enhance the information extractability of tree crowns (Figure 4).
The DCT is a mathematical operation capable of transforming an image from the spatial domain to the frequency domain. Particularly, a two-dimensional (2D) version of the DCT is widely used for feature extraction, and in various image processing applications. For an image feature tensor in networks , the 2D DCT can be formulated as [53]
where is the frequency spectrum of the 2D DCT at index (h, w), where h and w are the height and width, respectively, of . Supposing h and ω are both equal to zero, we obtain [53]
This indicates that the GAP is a feature decomposition case with its lowest frequency in the frequency domain. It is clearly preferable to capture adequate information by exploiting more frequency components from feature maps instead of only those of the lowest frequencies.
Inspired by DCT theory, the frequency layer is further incorporated into the channel attention mechanism of CBAM to strengthen the information extractability of tree crowns. In terms of the spatial attention module, we embraced the well-established iterative process outlined by Sanghyun Woo et al. [47]. The overall structure of the enhanced CBAM is shown in Figure 4. Typically, the feature map is equally split into several groups along the channel dimension, and each part is assigned a corresponding 2D DCT frequency component. In this study, a diagonal DCT feature strategy was used for efficiency. Specifically, five DTC frequency components from low to high in the horizontal and vertical directions were selected. According to Equations (1), these DCT frequency components can be written as
where denotes the 2D DCT results at indices (0,0), (H-1,0), (0, W-1), (,), and (H-1, W-1), respectively. If given an entire feature map, , C is the number of channels, each of which is processed by the same frequency component and concatenated. Hence, a total of five multi-frequency feature vectors are obtained:
where F1–F5 is the output of the DTC attention mechanism. Subsequently, these output feature vectors are forwarded to the multilayer perceptron in parallel with the aggregated max-pooling vectors to produce channel attention vectors. The whole channel attention can thus be written as
3.1.4. Architecture of LA-dpv3
The proposed framework, LA-dpv3+, is based on DeepLabv3+, MobileNetv2, and enhanced CBAM modules (Figure 5). The LA-dpv3+ framework was modified in the DeepLabv3+ framework by using the lightweight encoder MobileNetv2 and retaining parts, such as the Atrous Spatial Pyramid Pooling and encoder–decoder modules. Because a tree canopy can be distinguished from the background by features of color, texture, or shape, which are generally extracted by a shallow neural network, an enhanced CBAM was added after the quarter layers of MobileNetv2 as part of the decoder module. The refined features were then compressed by a 1 × 1 convolution to be concatenated with multiscale features from the ASPP module.
3.2. Individual Tree Detection
The proposed tree canopy extraction algorithm relies on an individual tree detection module, as described by Cheng et al. (2020) [24]. It was developed to identify trees from mingled canopies. This detection method was tested against different lighting and overlapping conditions. For example, a canopy can have heavily intermingled or barely overlapping branches with different numbers of interweaving trees. The method involves several steps in which the background is removed by applying the Excess Green Index (EXG) and Otsu’s method, the target regions are extracted using the length threshold of the circumscribed rectangle of the connected area, a Gaussian mixture model (GMM) is built by fitting a projection histogram curve in the horizontal direction of the extracted interlacing regions, and image segmentation is performed by estimating the GMM parameters.
3.3. Experimental Setup and Evaluation Indices
3.3.1. Experimental Setup
The experiments utilized the Python and PyTorch deep learning framework for training and testing the performance of the LA-dpv3+ method. Additionally, the specific configuration details of the experiments are shown in Table 2. The input image size for our model was consistently set at 512 × 512 pixels. All experiments were trained using the Adam optimizer with a learning rate of 0.007, the momentum factor was set to 0.9, the batch size was set to 24, and 200 epochs were used. As we had two possible outcomes, tree or background, binary cross-entropy was used as the loss function.
3.3.2. Evaluation Indices
The proposed method was evaluated in terms of segmentation accuracy and implementation costs. Four evaluation indicators (i.e., model size, parameter quantity, training time, and test time) were used to evaluate the running cost, and the indicators of accuracy (ACC), F1-score, and intersection over union (IOU) were used to measure segmentation accuracy. ACC is the percentage of correctly extracted canopy pixels (positives) from the background (negatives). The F1-score is the harmonic mean of precision and recall, indicating the balance between false positives and false negatives (background). The IOU reflects the consistency of the segmented canopy area with the ground-truth area. These metrics are defined by the following equations:
where a true positive (TP) is the number of canopy pixels correctly predicted as being produced by the segmentation algorithm. A false positive (FP) represents the number of background pixels classified as the canopy. A true negative (NT) is the number of background pixels correctly predicted by the segmentation algorithm. Lastly, a false negative (FN) is the number of canopy pixels counted as the background. S and Si are the segmentation maps and ground truth images, respectively.
4. Experimental Results
First, the improved strategy based on DeepLabv3+ was verified, including the performance of the DeepLabv3+ variant and the efficacy of the enhanced CBAM module. Second, the overall performance of the proposed method under weed-covered conditions was tested, which had already been determined to be the most challenging extraction case [24].
4.1. Comparison of Three Backbones
Three DeepLabv3+ variants were trained in this study: ResNet (the backbone of DeepLabV3), Xception (the backbone of DeepLabv3+), and MobileNetv2. The results are shown in Table 3. All networks were quite successful in their segmentation accuracy, achieving over 87% in ACC, F1-score, and IOU separately. Among them, ResNet provided the best ACC, F1-score, and IOU values of 94.67, 95.32, and 89.87%, respectively. The segmentation accuracy of MobileNetv2 was slightly lower than that of ResNet by 1.24, 0.61, and 2.22%, respectively. However, in terms of running costs, MobileNetv2 effectively controlled the functional parameters and memory usage of the model. The size of MobileNetv2 is only 46.8 MB, which is about one tenth of ResNet and one ninth of Xception. The numbers of parameters used for ResNet and Xception are ~9.4 and 10.2× that of MobileNetv2, respectively. Regarding time costs, ResNet took 9 h, 31 min to process; Xception took 8 h, 59 min; and MobileNetv2 only took 3 h, 29 min for training, saving ~6 and 5 h, respectively.
As shown in Table 3, the running cost of the model was proportional to its accuracy. Compared with MobileNetv2, ResNet and Xception achieved small accuracy gains at the cost of larger sizes, more parameters, and greater training and inference times. Although the segmentation accuracy of MobileNetv2 was slightly lower than that of ResNet and Xception, the model’s ACC, F1-score, and IOU values were greater than 87.65%. From the perspective of the trade-off between segmentation accuracy and implementing efficiency, applying MobileNetv2 as the backbone is the optimal choice.
4.2. Effectiveness of Attention Module Embedding
To evaluate the effectiveness of the attention mechanism for key information extraction, an intermediate feature map was visualized, as shown in Figure 6. Figure 6a shows the input feature image of the DTC-channel attention module. Each square in the figure represents a channel of the convolution operation, which indicates the current learning results (i.e., a class of low-level image features). Visually explicit or indistinct appearances in the squares reflect critical or minor feature contributions, respectively. Figure 6b shows the output of the DTC-channel attention module. The values in the squares in Figure 6b correspond to the weights of each channel in Figure 6a. The weight value of the explicit channel was larger than that of the indistinct channel, which indicates that the key features were focused through our channel attention module. The output feature maps of the spatial attention module are shown in Figure 6c. The outline of the canopy is highlighted, indicating that the spatial attention mechanism accurately and effectively locates the features. Additionally, the main body of the canopy is surrounded by a complete borderline, implying that the spatial attention mechanism achieves a high level of correlation between similar features at different distances.
To further evaluate the feasibility of the proposed attention mechanism, tests were performed on images taken at different flight heights. Figure 7 illustrates an example of the segmentation results. The first row shows the results of an image captured at approximately 20 m, and the second row represents 50 m. Green rectangles are set on the image for easy visual inspection. Comparing the extraction results of the algorithm before and after adding the enhanced CBAM, it is obvious that the proposed attention module eliminates the hollow inside part (hole) of the tree canopy, which is particularly significant to the performance of MobileNetv2, followed by Xception and ResNet. Comparing images taken at different heights, it can be seen that, with the increase in the target scale, the holes inside the canopy are more obvious, and complete canopy extraction becomes more difficult. Limited by the model scale, MobileNetv2 turns out to be inferior to Xception and Resnet in the segmentation of large-scale objects; however, the addition of the attention mechanism makes up for this. A quantitative description is provided below.
To quantitatively verify the effectiveness of the improved CBAM in the DeepLabv3+ framework, comparative experiments were conducted on different combinations of backbones and convolutional attention mechanisms. Comparing Table 3 and Table 4, it can be seen that, no matter the backbone, adding the attention mechanism has a positive impact on the performance of DeepLabv3+ at a small cost increase. Notably, the combination of MobileNetv2 and the enhanced CBAM improved the ACC by 1.11%, F1-score by 1.9%, and IOU by 1.99%; memory added only 0.1 MB of resource consumption. Compared with the DeepLabv3+ using only Xception, the ACC, F1-score, and IOU improved by 0.53, 0.97, and 0.96%, respectively, whereas the overall memory requirement was reduced by 397.7 MB.
4.3. Overall Performance of the Proposed Algorithm
The orchard image samples were taken in a variety of weather and background conditions, and the primary focus area was weed-cover conditions. The proposed algorithm was compared to Cheng’s [24] method and the classic Mask-RCNN [54] instance segmentation algorithm. Figure 8 provides an example of the experimental results. Typical test images included various weed-cover conditions, as shown in Figure 8a, where trees in the left and middle columns of the image overlapped high-density weeds, whereas trees in the right column overlapped low-density weeds. Figure 8b shows the individual canopies produced by Mask-RCNN. Figure 8c shows the segmentation results of the algorithm proposed by Cheng et al. (2020), and Figure 8d presents the results of the proposed method. The extracted tree canopy is marked with red rectangles (Figure 8b,d), or highlighted patches (Figure 8c).
Figure 8b shows the excellent performance of Mask-RCNN in distinguishing between weeds and tree canopies. However, many image details were missed, resulting in overly smooth tree canopy borders. Additionally, the mask prediction of the target shape was inconsistent. Examining Figure 8c and the results of the preprocessing method that applied the EXG index and Otsu, the previous algorithm failed to discriminate the canopy from the background with heavy overlapping of weeds. Additionally, because lighting conditions have huge effects on the color index-based method, some shaded areas of tree canopies were misclassified as background. However, with the proposed method, the incorrect segmentations were corrected.
Table 5 shows the segmentation results of the 200 test images using three different segmentation methods. The average ACC, F1-score, and IOU values of Mask-RCNN were 88.51, 88.72, and 77.38%, respectively. The overall performance of the proposed method was higher than that of Mask-RCNN, with the average ACC, F1-score, and IOU values increasing by 3.42, 2.29, and 13.03%, respectively. When preprocessing by color index, the ACC, F1-score, and IOU values were 88.4, 87.62, and 82.15%, respectively. Adding the neural network increased these scores to 91.9, 90.53, and 90.41%, respectively.
5. Discussion and Conclusions
This paper applied the LA-dpv3+ neural network for fruit tree canopy and back-ground segmentation to improve the previously effective state-of-the-art method of canopy extraction with weeds and open spaces in the background. The proposed model was built upon the DeepLabv3+ network architecture and integrated the lightweight Mo-bileNetv2 network along with an enhanced CBAM that includes a frequency layer.
Three variants of DeepLabv3+ were tested with ResNet, Xception, and MobileNetv2 backbones. The results align with those specified in Torres et al. [30], demonstrating that the MobileNetv2 variant consistently outperformed its Xception counterpart. The performance was further improved by combining MobileNetv2 with the enhanced CBAM. The model accuracy exceeded 89%, while the model size was only 46.8 MB, showcasing a favorable trade-off between segmentation accuracy and implementation efficiency. In terms of overall canopy extraction performance, the segmentation evaluation metrics, including ACC, F1-score, and IOU, increased by 5.44, 3.39, and 8.62%, respectively, compared to the approach by Cheng et al. [24]. This result is particularly promising because deploying high-end hardware in the field is often impractical due to its exorbitant costs. In contrast, lightweight models designed for embedded terminals offer a more cost-effective, compact, and readily deployable solution.
However, the LA-dpv3+ model is sensitive to light changes, which is minimized when capturing images around noon or on cloudy days. During early morning or evening hours, there is lengthening of the shadows between tree canopies due to the changing position of the sun, which can lead to false detections. Further training and validation would also be required to apply this method to similar fruit trees and to use it in different orchards. This potential adaptation would enable users to capture videos in the field using smartphones and leverage cloud resources for near-real-time detection. Future research efforts should prioritize addressing these challenges with the ultimate goal of applying the proposed model to embedded terminals for the intelligent image-based management of cherry orchards.
Author Contributions
Conceptualization, Z.C.; methodology, Z.C. and Y.C.; software, Y.C.; validation, Z.C. and Y.C.; formal analysis, Z.C.; resources, X.D. and M.L.; funding acquisition: Z.C.; writing—original draft preparation, Z.C.; writing—review and editing, M.L.; visualization, X.D., S.G., and X.M.; investigation, Z.C., Y.C. and X.M. All authors have read and agreed to the published version of the manuscript.
Funding
This research was funded by the Key Scientific and Technological Program of Henan Province, China (232102111118), and The Foundation of the Central Laboratory of Xinyang Agriculture and Forestry University (FCL202106).
Data Availability Statement
Restrictions apply to the availability of these data due to confidentiality and business agreements.
Acknowledgments
The authors would like to acknowledge the financial support provided by the Key Scientific and Technological Program of Henan Province, China, and the Central Laboratory of Xinyang Agriculture and Forestry University. Most of all, Zhenzhen Cheng wants to thank her partner Yifan Cheng for the constant encouragement and support. All authors have read and agreed to the published version of the manuscript.
Conflicts of Interest
The authors declare no conflict of interest.
References
- Khanal, S.; Kushal, K.C.; Fulton, J.P.; Shearer, S.; Ozkan, E. Remote Sensing in Agriculture—Accomplishments, Limitations, and Opportunities. Remote Sens. 2020, 12, 3783. [Google Scholar] [CrossRef]
- Martos, V.; Ahmad, A.; Cartujo, P.; Ordoñez, J. Ensuring Agricultural Sustainability through Remote Sensing in the Era of Agriculture 5.0. Appl. Sci. 2021, 11, 5911. [Google Scholar] [CrossRef]
- Osco, L.P.; Junior, J.M.; Ramos, A.P.M.; Jorge, L.A.d.C.; Fatholahi, S.N.; Silva, J.d.A.; Matsubara, E.T.; Pistori, H.; Gonçalves, W.N.; Li, J. A Review on Deep Learning in UAV Remote Sensing. Int. J. Appl. Earth Obs. Geoinf. 2021, 102, 102456. [Google Scholar] [CrossRef]
- Jung, J.; Maeda, M.; Chang, A.; Bhandari, M.; Ashapure, A.; Landivar-Bowles, J. The Potential of Remote Sensing and Artificial Intelligence as Tools to Improve the Resilience of Agriculture Production Systems. Curr. Opin. Biotechnol. 2021, 70, 15–22. [Google Scholar] [CrossRef]
- Maddikunta, P.K.R.; Hakak, S.; Alazab, M.; Bhattacharya, S.; Gadekallu, T.R.; Khan, W.Z.; Pham, Q.V. Unmanned Aerial Vehicles in Smart Agriculture: Applications, Requirements, and Challenges. IEEE Sens. J. 2021, 21, 17608–17619. [Google Scholar] [CrossRef]
- Delavarpour, N.; Koparan, C.; Nowatzki, J.; Bajwa, S.; Sun, X. A Technical Study on UAV Characteristics for Precision Agriculture Applications and Associated Practical Challenges. Remote Sens. 2021, 13, 1204. [Google Scholar] [CrossRef]
- Radoglou-Grammatikis, P.; Sarigiannidis, P.; Lagkas, T.; Moscholios, I. A Compilation of UAV Applications for Precision Agriculture. Comput. Netw. 2020, 172, 107148. [Google Scholar] [CrossRef]
- Mukherjee, A.; Misra, S.; Raghuwanshi, N.S. A Survey of Unmanned Aerial Sensing Solutions in Precision Agriculture. J. Netw. Comput. Appl. 2019, 148, 102461. [Google Scholar] [CrossRef]
- Xie, C.; Yang, C. A Review on Plant High-Throughput Phenotyping Traits Using UAV-Based Sensors. Comput. Electron. Agric. 2020, 178, 105731. [Google Scholar] [CrossRef]
- Donmez, C.; Villi, O.; Berberoglu, S.; Cilek, A. Computer Vision-Based Citrus Tree Detection in a Cultivated Environment Using UAV Imagery. Comput. Electron. Agric. 2021, 187, 106273. [Google Scholar] [CrossRef]
- Rosa, L.E.C.L.; Zortea, M.; Gemignani, B.H.; Oliveira, D.A.B.; Feitosa, R.Q. Fcrn-based Multi-task Learning for Automatic Citrus Tree Detection from UAV Images. In Proceedings of the ISPRS Annals of the Photogrammetry, Remote Sensing and Spatial Information Sciences, Santiago, Chile, 22–26 March 2020; pp. 403–408. [Google Scholar]
- Osco, L.P.; Arruda, M.D.S.D.; Marcato Junior, J.; da Silva, N.B.; Ramos, A.P.M.; Moryia, A.S.; Imai, N.N.; Pereira, D.R.; Creste, J.E.; Matsubara, E.; et al. A Convolutional Neural Network Approach for Counting and Geolocating Citrus-Trees in UAV Multispectral Imagery. ISPRS J. Photogramm. Remote Sens. 2020, 160, 97–106. [Google Scholar] [CrossRef]
- Wang, X.; Wang, Y.; Zhou, C.; Yin, L.; Feng, X. Urban Forest Monitoring Based on Multiple Features at the Single Tree Scale by UAV. Urban For. Urban Green. 2021, 58, 126958. [Google Scholar] [CrossRef]
- Park, J.Y.; Muller-Landau, H.C.; Lichstein, J.W.; Rifai, S.W.; Dandois, J.P.; Bohlman, S.A. Quantifying Leaf Phenology of Individual Trees and Species in a Tropical Forest Using Unmanned Aerial Vehicle (UAV) Images. Remote Sens. 2019, 11, 1534. [Google Scholar] [CrossRef]
- Franklin, S.E.; Ahmed, O.S.; Williams, G. Northern Conifer Forest Species Classification Using Multispectral Data Acquired from an Unmanned Aerial Vehicle. Photogramm. Eng. Remote Sens. 2017, 83, 501–507. [Google Scholar] [CrossRef]
- Roslan, Z.H.; Kim, J.H.; Ismail, R.; Hamzah, R. Tree Crown Detection and Delineation Using Digital Image Processing. In Proceedings of the Advances in Intelligent Systems and Computing, Phuket, Thailand, 4–6 January 2019; pp. 412–423. [Google Scholar]
- Dong, X.; Zhang, Z.; Yu, R.; Tian, Q.; Zhu, X. Extraction of Information about Individual Trees from High-Spatial-Resolution UAV-Acquired Images of an Orchard. Remote Sens. 2020, 12, 133. [Google Scholar] [CrossRef]
- Ponce, J.M.; Aquino, A.; Tejada, D.; Al-Hadithi, B.M.; Andújar, J.M. A Methodology for the Automated Delineation of Crop Tree Crowns from Uav-Based Aerial Imagery by Means of Morphological Image Analysis. Agronomy 2022, 12, 43. [Google Scholar] [CrossRef]
- Huang, H.; Li, X.; Chen, C. Individual Tree Crown Detection and Delineation from Very-High-Resolution UAV Images Based On. IEEE J. Sel. Top. Appl. Earth Obs. Remote Sens. 2018, 11, 2253–2262. [Google Scholar] [CrossRef]
- Safonova, A.; Hamad, Y.; Dmitriev, E.; Georgiev, G.; Trenkin, V.; Georgieva, M.; Dimitrov, S.; Iliev, M. Individual Tree Crown Delineation for the Species Classification and Assessment of Vital Status of Forest Stands from UAV Images. Drones 2021, 5, 77. [Google Scholar] [CrossRef]
- Kestur, R.; Angural, A.; Bashir, B.; Omkar, S.N.; Anand, G.; Meenavathi, M.B. Tree Crown Detection, Delineation and Counting in UAV Remote Sensed Images: A Neural Network Based Spectral–Spatial Method. J. Indian Soc. Remote Sens. 2018, 46, 1004. [Google Scholar] [CrossRef]
- Jiao, J.; Deng, Z. Individual Building Rooftop and Tree Crown Segmentation from High-Resolution Urban Aerial Optical Images. J. Sens. 2016, 2016, 5205. [Google Scholar] [CrossRef]
- Chen, Y.; Hou, C.; Tang, Y.; Zhuang, J.; Lin, J.; He, Y.; Guo, Q.; Zhong, Z.; Lei, H.; Luo, S. Citrus Tree Segmentation from UAV Images Based on Monocular Machine Vision in a Natural Orchard Environment. Sensors 2019, 19, 5558. [Google Scholar] [CrossRef]
- Cheng, Z.; Qi, L.; Cheng, Y.; Wu, Y.; Zhang, H. Interlacing Orchard Canopy Separation and Assessment Using UAV Images. Remote Sens. 2020, 12, 767. [Google Scholar] [CrossRef]
- Santos, A.A.d.; Junior, J.M.; Araújo, M.S.; Martini, D.R.D.; Tetila, E.C.; Siqueira, H.L.; Aoki, C.; Eltner, A.; Matsubara, E.T.; Pistori, H.; et al. Assessment of CNN-Based Methods for Individual Tree Detection on Images Captured by RGB Cameras Attached to UAVS. Sensors 2019, 19, 3595. [Google Scholar] [CrossRef] [PubMed]
- Zheng, J.; Fu, H.; Li, W.; Wu, W.; Yu, L.; Yuan, S.; Tao, W.Y.W.; Pang, T.K.; Kanniah, K.D. Growing Status Observation for Oil Palm Trees Using Unmanned Aerial Vehicle (UAV) Images. ISPRS J. Photogramm. Remote Sens. 2021, 173, 95–121. [Google Scholar] [CrossRef]
- Zhang, C.; Zhou, J.; Wang, H.; Tan, T.; Cui, M.; Huang, Z.; Wang, P.; Zhang, L. Multi-Species Individual Tree Segmentation and Identification Based on Improved Mask R-CNN and UAV Imagery in Mixed Forests. Remote Sens. 2022, 14, 847. [Google Scholar] [CrossRef]
- Mo, J.; Lan, Y.; Yang, D.; Wen, F.; Qiu, H.; Chen, X.; Deng, X. Deep Learning-Based Instance Segmentation Method of Litchi Canopy from Uav-Acquired Images. Remote Sens. 2021, 13, 3919. [Google Scholar] [CrossRef]
- Braga, J.R.G.; Peripato, V.; Dalagnol, R.; Ferreira, M.P.; Tarabalka, Y.; Aragão, L.E.O.C.; Velho, H.F.d.C.; Shiguemori, E.H.; Wagner, F.H. Tree Crown Delineation Algorithm Based on a Convolutional Neural Network. Remote Sens. 2020, 12, 1288. [Google Scholar] [CrossRef]
- Torres, D.L.; Feitosa, R.Q.; Rosa, L.E.C.L.; Happ, P.N.; Junior, J.M.; Gonçalves, W.N.; Martins, J.; Liesenberg, V. Semantic Segmentation of Endangered Tree Species in Brazilian Savanna Using DEEPLABV3+ Variants. In Proceedings of the International Archives of the Photogrammetry, Remote Sensing and Spatial Information Sciences—ISPRS Archives, Santiago, Chile, 22–26 March 2020; pp. 515–520. [Google Scholar]
- Shelhamer, E.; Long, J.; Darrell, T. Fully Convolutional Networks for Semantic Segmentation. IEEE Trans. Pattern Anal. Mach. Intell. 2017, 39, 640–651. [Google Scholar] [CrossRef]
- Ronneberger, O.; Fischer, P.; Brox, T. U-Net: Convolutional Networks for Biomedical Image Segmentation. In Proceedings of the Medical Image Computing and Computer-Assisted Intervention—MICCAI, Munich, Germany, 5–9 October 2015; Volume 9351, pp. 234–241. [Google Scholar]
- Kattenborn, T.; Eichel, J.; Fassnacht, F.E. Convolutional Neural Networks Enable Efficient, Accurate and Fine-Grained Segmentation of Plant Species and Communities from High-Resolution UAV Imagery. Sci. Rep. 2019, 9, 17656. [Google Scholar] [CrossRef]
- Chen, L.C.; Zhu, Y.; Papandreou, G.; Schroff, F.; Adam, H. Encoder-Decoder with Atrous Separable Convolution for Semantic Image Segmentation. In Proceedings of the Lecture Notes in Computer Science (including Subseries Lecture Notes in Artificial Intelligence and Lecture Notes in Bioinformatics), Munich, Germany, 8–14 September 2018; pp. 801–818. [Google Scholar]
- Badrinarayanan, V.; Kendall, A.; Cipolla, R. SegNet: A Deep Convolutional Encoder-Decoder Architecture for Image Segmentation. IEEE Trans. Pattern Anal. Mach. Intell. 2016, 39, 2481–2495. [Google Scholar] [CrossRef]
- Zhao, H.; Shi, J.; Qi, X.; Wang, X.; Jia, J. Pyramid Scene Parsing Network. In Proceedings of the 2017 IEEE Conference on Computer Vision and Pattern Recognition, Honolulu, HI, USA, 21–26 July 2017; pp. 2881–2890. [Google Scholar]
- Cordts, M.; Omran, M.; Ramos, S.; Rehfeld, T.; Enzweiler, M.; Benenson, R.; Franke, U.; Roth, S.; Schiele, B. The Cityscapes Dataset for Semantic Urban Scene Understanding. In Proceedings of the IEEE Conference on Computer Vision and Pattern Recognition, Las Vegas, NV, USA, 27–30 June 2016; pp. 3213–3223. [Google Scholar]
- Everingham, M.; Eslami, S.M.A.; Van Gool, L.; Williams, C.K.I.; Winn, J.; Zisserman, A. The Pascal Visual Object Classes Challenge: A Retrospective. Int. J. Comput. Vis. 2015, 111, 98–136. [Google Scholar] [CrossRef]
- Baheti, B.; Innani, S.; Gajre, S.; Talbar, S. Semantic Scene Segmentation in Unstructured Environment with Modified DeepLabV3+. Pattern Recognit. Lett. 2020, 138, 223–229. [Google Scholar] [CrossRef]
- Li, Z.; Wang, R.; Zhang, W.; Hu, F.; Meng, L. Multiscale Features Supported DeepLabV3+ Optimization Scheme for Accurate Water Semantic Segmentation. IEEE Access 2019, 7, 155787–155804. [Google Scholar] [CrossRef]
- Sharifzadeh, S.; Tata, J.; Sharifzadeh, H.; Tan, B. Farm Area Segmentation in Satellite Images Using DeepLabv3+ Neural Networks. In Proceedings of the Data Management Technologies and Applications 8th International Conference, Prague, Czech Republic, 26–28 July 2019; Springer: Cham, Switzerland, 2020; Volume 1255, pp. 115–135. [Google Scholar]
- Morales, G.; Kemper, G.; Sevillano, G.; Arteaga, D.; Ortega, I.; Telles, J. Automatic Segmentation of Mauritia Flexuosa in Unmanned Aerial Vehicle (UAV) Imagery Using Deep Learning. Forests 2018, 9, 736. [Google Scholar] [CrossRef]
- Ferreira, M.P.; Almeida, D.R.A.d.; Papa, D.d.A.; Minervino, J.B.S.; Veras, H.F.P.; Formighieri, A.; Santos, C.A.N.; Ferreira, M.A.D.; Figueiredo, E.O.; Ferreira, E.J.L. Individual Tree Detection and Species Classification of Amazonian Palms Using UAV Images and Deep Learning. For. Ecol. Manag. 2020, 475, 118397. [Google Scholar] [CrossRef]
- Russell, B.C.; Torralba, A.; Murphy, K.P.; Freeman, W.T. LabelMe: A Database and Web-Based Tool for Image Annotation. Int. J. Comput. Vis. 2008, 77, 157–173. [Google Scholar] [CrossRef]
- Sandler, M.; Howard, A.; Zhu, M.; Zhmoginov, A.; Chen, L.-C. MobileNetV2: Inverted Residuals and Linear Bottlenecks. In Proceedings of the IEEE Conference on Computer Vision and Pattern Recognition, Salt Lake City, UT, USA, 18–22 June 2018; pp. 4510–4520. [Google Scholar]
- Xiao, D.; Wang, M.; Zhao, L.; Chen, S. Dual ASPP for Lightweight Semantic Segmentation on High-Resolution Image. Comput. Sci. 2020, 10, 1535. [Google Scholar]
- Howard, A.G.; Zhu, M.; Chen, B.; Kalenichenko, D.; Wang, W.; Weyand, T.; Andreetto, M.; Adam, H. MobileNets: Efficient Convolutional Neural Networks for Mobile Vision Applications. arXiv 2017, arXiv:1704.04861. [Google Scholar]
- Woo, S.; Park, J.; Lee, J.-Y.; Kweon, I.S. CBAM: Convolutional Block Attention Module. In Proceedings of the European Conference on Computer Vision, Munich, Germany, 8–14 September 2018; pp. 3–19. [Google Scholar]
- Zhu, X.; Chen, F.; Zhang, X.; Zheng, Y.; Peng, X.; Chen, C. Detection the maturity of multi-cultivar olive fruit in orchard environments based on Olive-EfficientDet. Sci. Hortic. 2024, 324, 112607. [Google Scholar] [CrossRef]
- Min, W.; Wang, Z.; Yang, J.; Liu, C.; Jiang, S. Vision-based fruit recognition via multi-scale attention CNN. Comput. Electron. Agric. 2023, 210, 107911. [Google Scholar] [CrossRef]
- Zhu, Y.; Zhou, J.; Yang, Y.; Liu, L.; Liu, F.; Kong, W. Rapid Target Detection of Fruit Trees Using UAV Imaging and Improved Light YOLOv4 Algorithm. Remote Sens. 2022, 14, 4324. [Google Scholar] [CrossRef]
- Qin, Z.; Zhang, P.; Wu, F.; Li, X. FcaNet: Frequency Channel Attention Networks. In Proceedings of the IEEE/CVF International Conference on Computer Vision, Montreal, QC, Canada, 10–17 October 2021; pp. 783–792. [Google Scholar]
- Ahmed, N.; Natarajan, T.; Rao, K.R. Discrete cosine transform. IEEE Trans. Comput. 1974, 100, 90–93. [Google Scholar] [CrossRef]
- He, K.; Gkioxari, G.; Dollar, P.; Girshick, R. Mask R-CNN. In Proceedings of the 2017 IEEE International Conference on Computer Vision, Venice, Italy, 22–29 October 2017; pp. 2980–2988. [Google Scholar]
Figure 1.
Geographical location of the study area: (a) China; (b) Tongzhou, Beijing; (c) study location; (d–f) detailed cherry tree examples.
Figure 1.
Geographical location of the study area: (a) China; (b) Tongzhou, Beijing; (c) study location; (d–f) detailed cherry tree examples.

Figure 2.
An overall flowchart of the proposed method.

Figure 3.
The architecture of the DeepLabv3+ model.

Figure 4.
The architecture of the enhanced attention module.

Figure 5.
The overall architecture of the proposed LA-dpv3+ network.

Figure 6.
Results of DTC-channel attention and spatial attention: (a) input feature image of DTC-channel attention module; (b) output after DTC-channel attention processing; (c) output feature image of spatial attention module.
Figure 6.
Results of DTC-channel attention and spatial attention: (a) input feature image of DTC-channel attention module; (b) output after DTC-channel attention processing; (c) output feature image of spatial attention module.

Figure 7.
Comparison of different segmentation results: (a) original images; (b) MobileNetv2 Backbone Combined with enhanced CBAM, and MobileNetv2; (c) Xception71 Backbone Combined with enhanced CBAM, and MobileNetv2; and (d) Resnet101 Backbone Combined with enhanced CBAM, and Resnet101.
Figure 7.
Comparison of different segmentation results: (a) original images; (b) MobileNetv2 Backbone Combined with enhanced CBAM, and MobileNetv2; (c) Xception71 Backbone Combined with enhanced CBAM, and MobileNetv2; and (d) Resnet101 Backbone Combined with enhanced CBAM, and Resnet101.

Figure 8.
Segmentation results of canopies in different densities of weeds: (a) original images; (b) Mask-RCNN; (c) the algorithm of Cheng et al. (2020) [24]; (d) the proposed method.
Figure 8.
Segmentation results of canopies in different densities of weeds: (a) original images; (b) Mask-RCNN; (c) the algorithm of Cheng et al. (2020) [24]; (d) the proposed method.


Table 1.
Detailed dataset.
| Dataset | Training Set | Validation Set | Test Set | Total Number | |
|---|---|---|---|---|---|
| Near Ground | Low-Altitude | ||||
| Number of images | 1730 | 215 | 109 | 109 | 2163 |
Table 2.
Experimental software and hardware configuration.
| Item | Detail |
|---|---|
| CPU | Intel® Core (TM) i7-6700 k |
| RAM | 16 GB |
| Operating system | Ubuntu 16.04 LTS |
| CUDA | CUDA10.0 and CUDNN7.5 |
| Python | Python 3.7 and PyTorch 1.4.0 |
Table 3.
Implementation cost and segmentation accuracy for the DeepLabv3+ variant, Resnet, Xception, and MobileNetv2.
Table 3.
Implementation cost and segmentation accuracy for the DeepLabv3+ variant, Resnet, Xception, and MobileNetv2.
| Backbone | Implementation Cost | Segmentation Accuracy | |||||
|---|---|---|---|---|---|---|---|
| Size (MB) | Number of Parameters | Total Training Time (Hours) | Inference Time (Seconds) | ACC (%) | F1-Score (%) | IOU (%) | |
| Resnet101 | 475.3 | 59,339,426 | 12.31 | 0.51 | 94.67 | 95.31 | 89.87 |
| Xception71 | 438.6 | 54,700,434 | 11.59 | 0.57 | 94.01 | 95.18 | 88.68 |
| MobileNetV2 | 46.8 | 5,811,170 | 5.29 | 0.35 | 93.43 | 94.70 | 87.65 |
Table 4.
Comparison of attention mechanism and different backbone network combinations.
| Model | Computational Cost Assessment Index | Segmentation Evaluation Index | |||||
|---|---|---|---|---|---|---|---|
| Size (MB) | Number of Parameters | Total Training Time (h) | Inference Time (s) | ACC (%) | F1-Score (%) | IOU (%) | |
| Resnet101+ Enhanced CBAM | 484.9 | 60,528,388 | 12.57 | 0.55 | 94.75 | 95.78 | 90.01 |
| Xception71+ Enhanced CBAM | 441.0 | 54,998,004 | 11.21 | 0.58 | 94.34 | 95.68 | 89.26 |
| MobileNetV3+ Enhanced CBAM | 46.9 | 5,821,780 | 5.32 | 0.36 | 94.54 | 95.97 | 89.64 |
Table 5.
Average results for 200 images using three different algorithms.
| Method | ACC (%) | F1-Score (%) | IOU (%) |
|---|---|---|---|
| Mask-RCNN | 88.51 | 88.72 | 77.38 |
| Algorithm (Cheng et al. (2020) [24]) | 86.49 | 87.62 | 82.15 |
| Proposed Algorithm | 91.93 | 91.01 | 90.41 |
Disclaimer/Publisher’s Note: The statements, opinions and data contained in all publications are solely those of the individual author(s) and contributor(s) and not of MDPI and/or the editor(s). MDPI and/or the editor(s) disclaim responsibility for any injury to people or property resulting from any ideas, methods, instructions or products referred to in the content. |
© 2023 by the authors. Licensee MDPI, Basel, Switzerland. This article is an open access article distributed under the terms and conditions of the Creative Commons Attribution (CC BY) license (https://creativecommons.org/licenses/by/4.0/).
Share and Cite
MDPI and ACS Style
Cheng, Z.; Cheng, Y.; Li, M.; Dong, X.; Gong, S.; Min, X. Detection of Cherry Tree Crown Based on Improved LA-dpv3+ Algorithm. Forests 2023, 14, 2404. https://doi.org/10.3390/f14122404
AMA Style
Cheng Z, Cheng Y, Li M, Dong X, Gong S, Min X. Detection of Cherry Tree Crown Based on Improved LA-dpv3+ Algorithm. Forests. 2023; 14(12):2404. https://doi.org/10.3390/f14122404
Chicago/Turabian StyleCheng, Zhenzhen, Yifan Cheng, Meng Li, Xiangxiang Dong, Shoufu Gong, and Xiaoxiao Min. 2023. "Detection of Cherry Tree Crown Based on Improved LA-dpv3+ Algorithm" Forests 14, no. 12: 2404. https://doi.org/10.3390/f14122404
Note that from the first issue of 2016, this journal uses article numbers instead of page numbers. See further details here.