
Genetic Diversity of Five Broadleaved Tree Species and Its Spatial Distribution in Self-Regenerating Stands
 , and
, and
Abstract
:1. Introduction
2. Materials and Methods
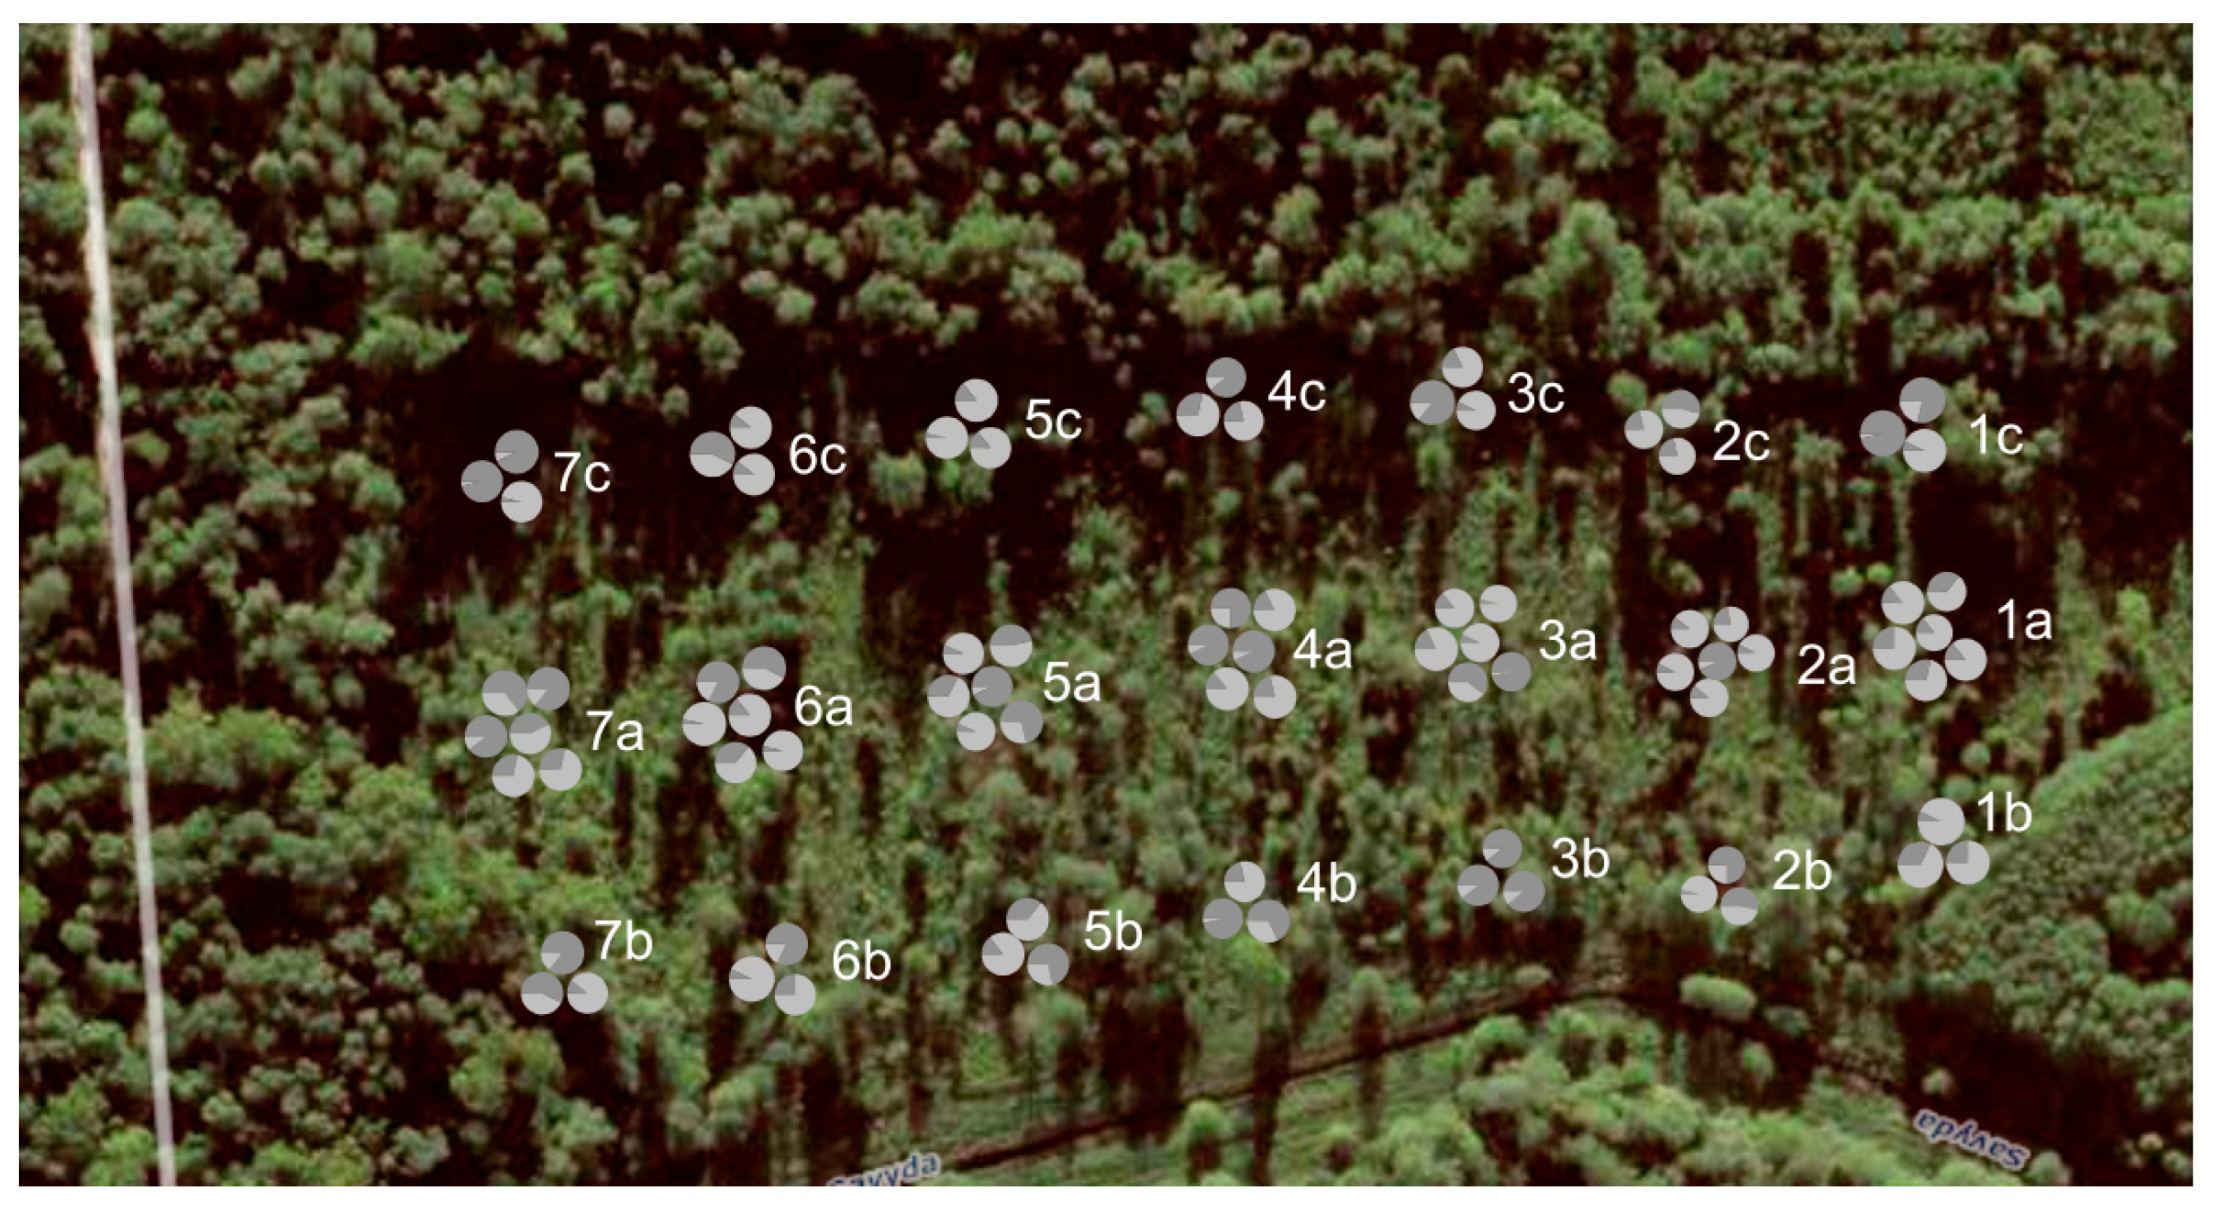
2.1. Study Sites
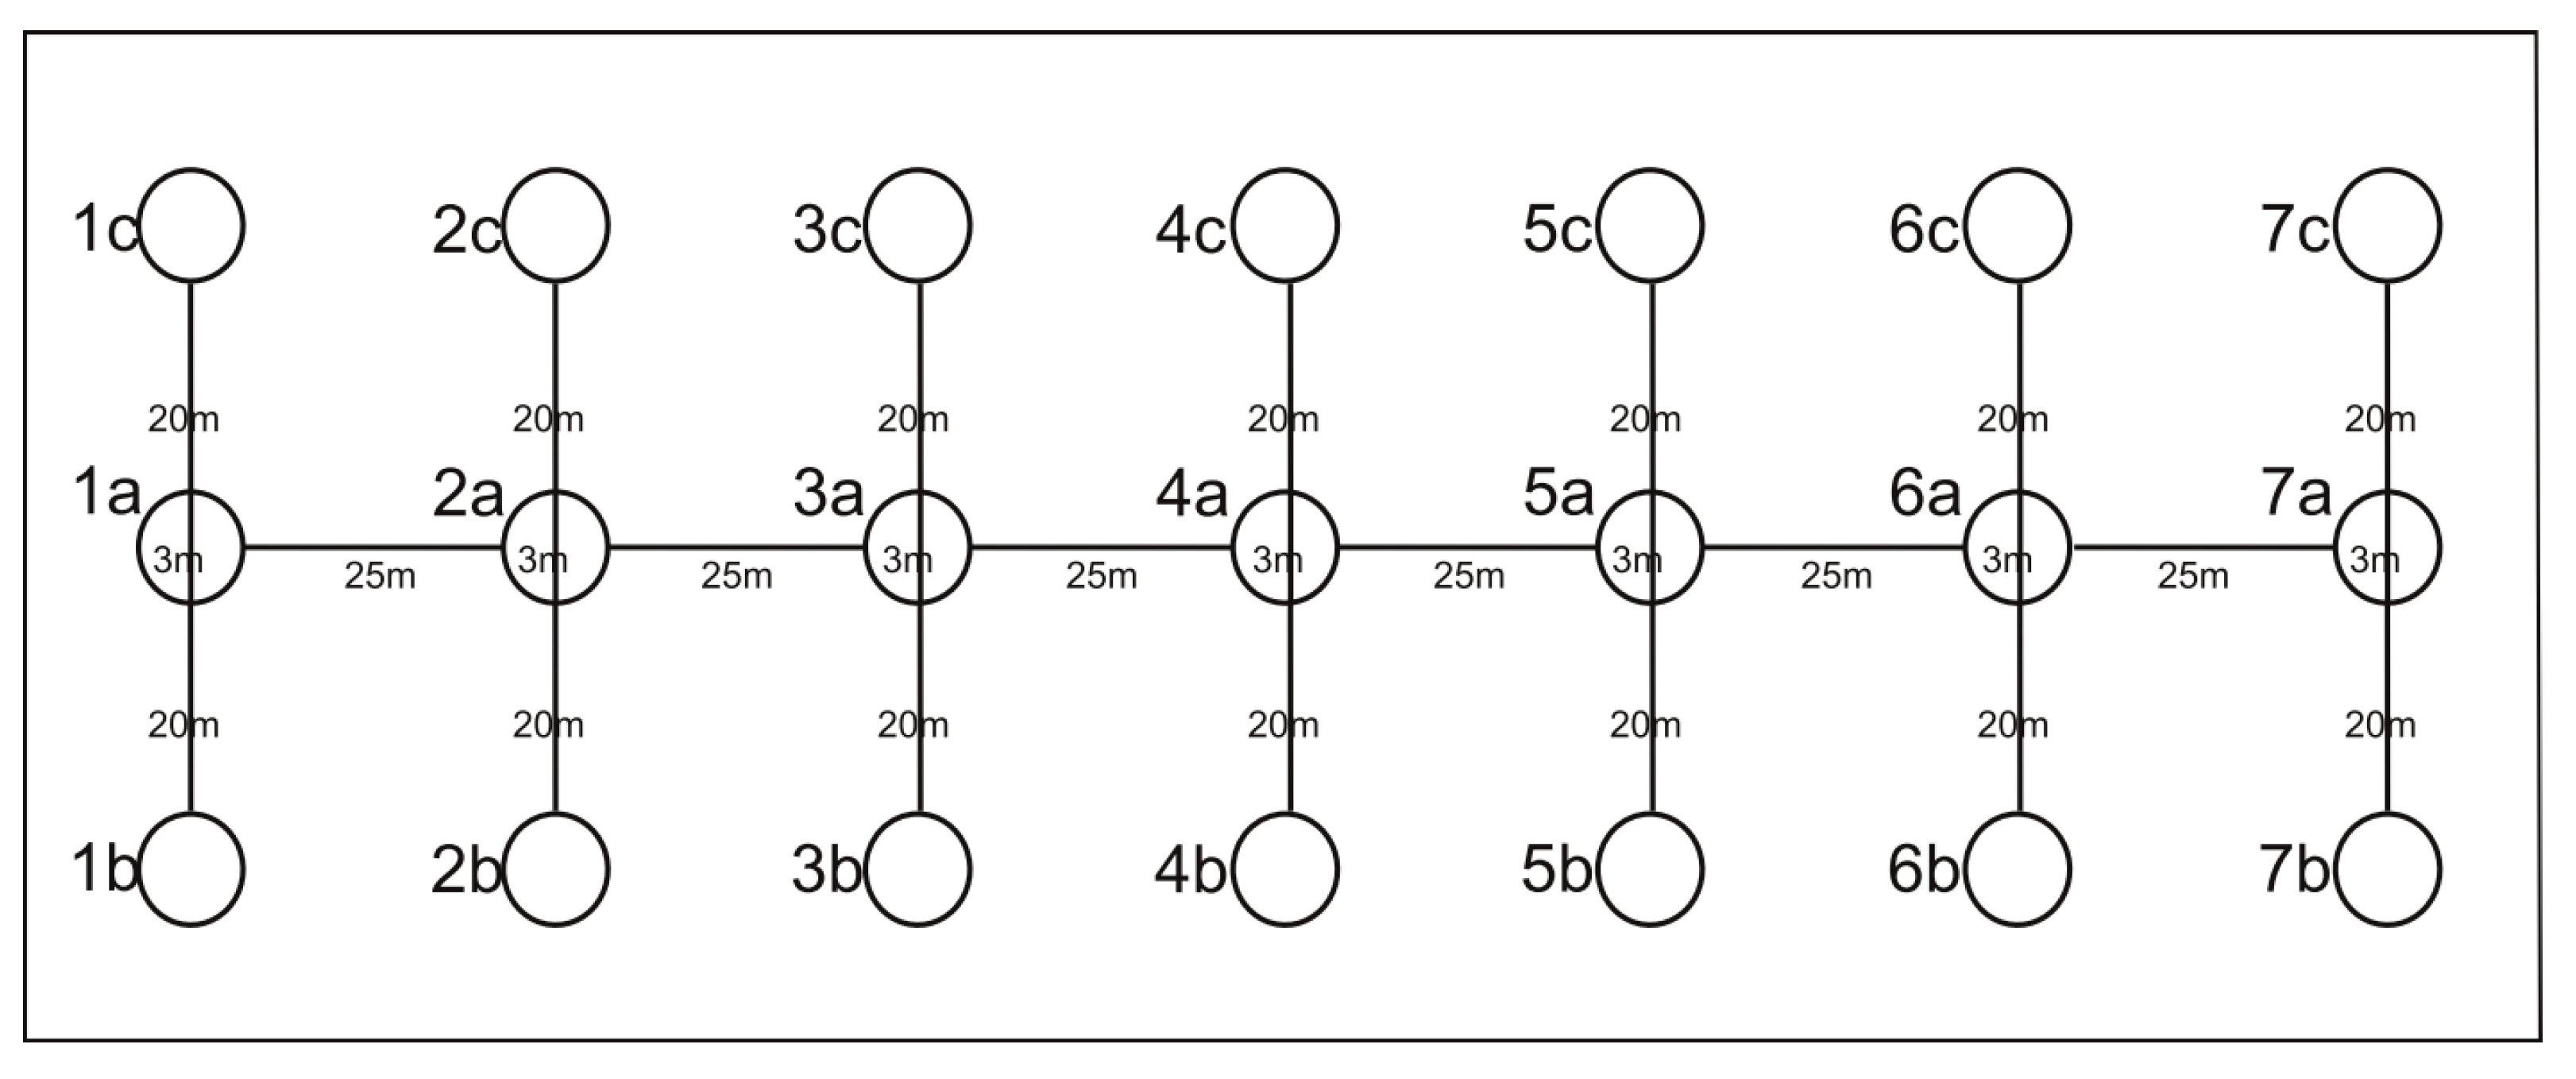
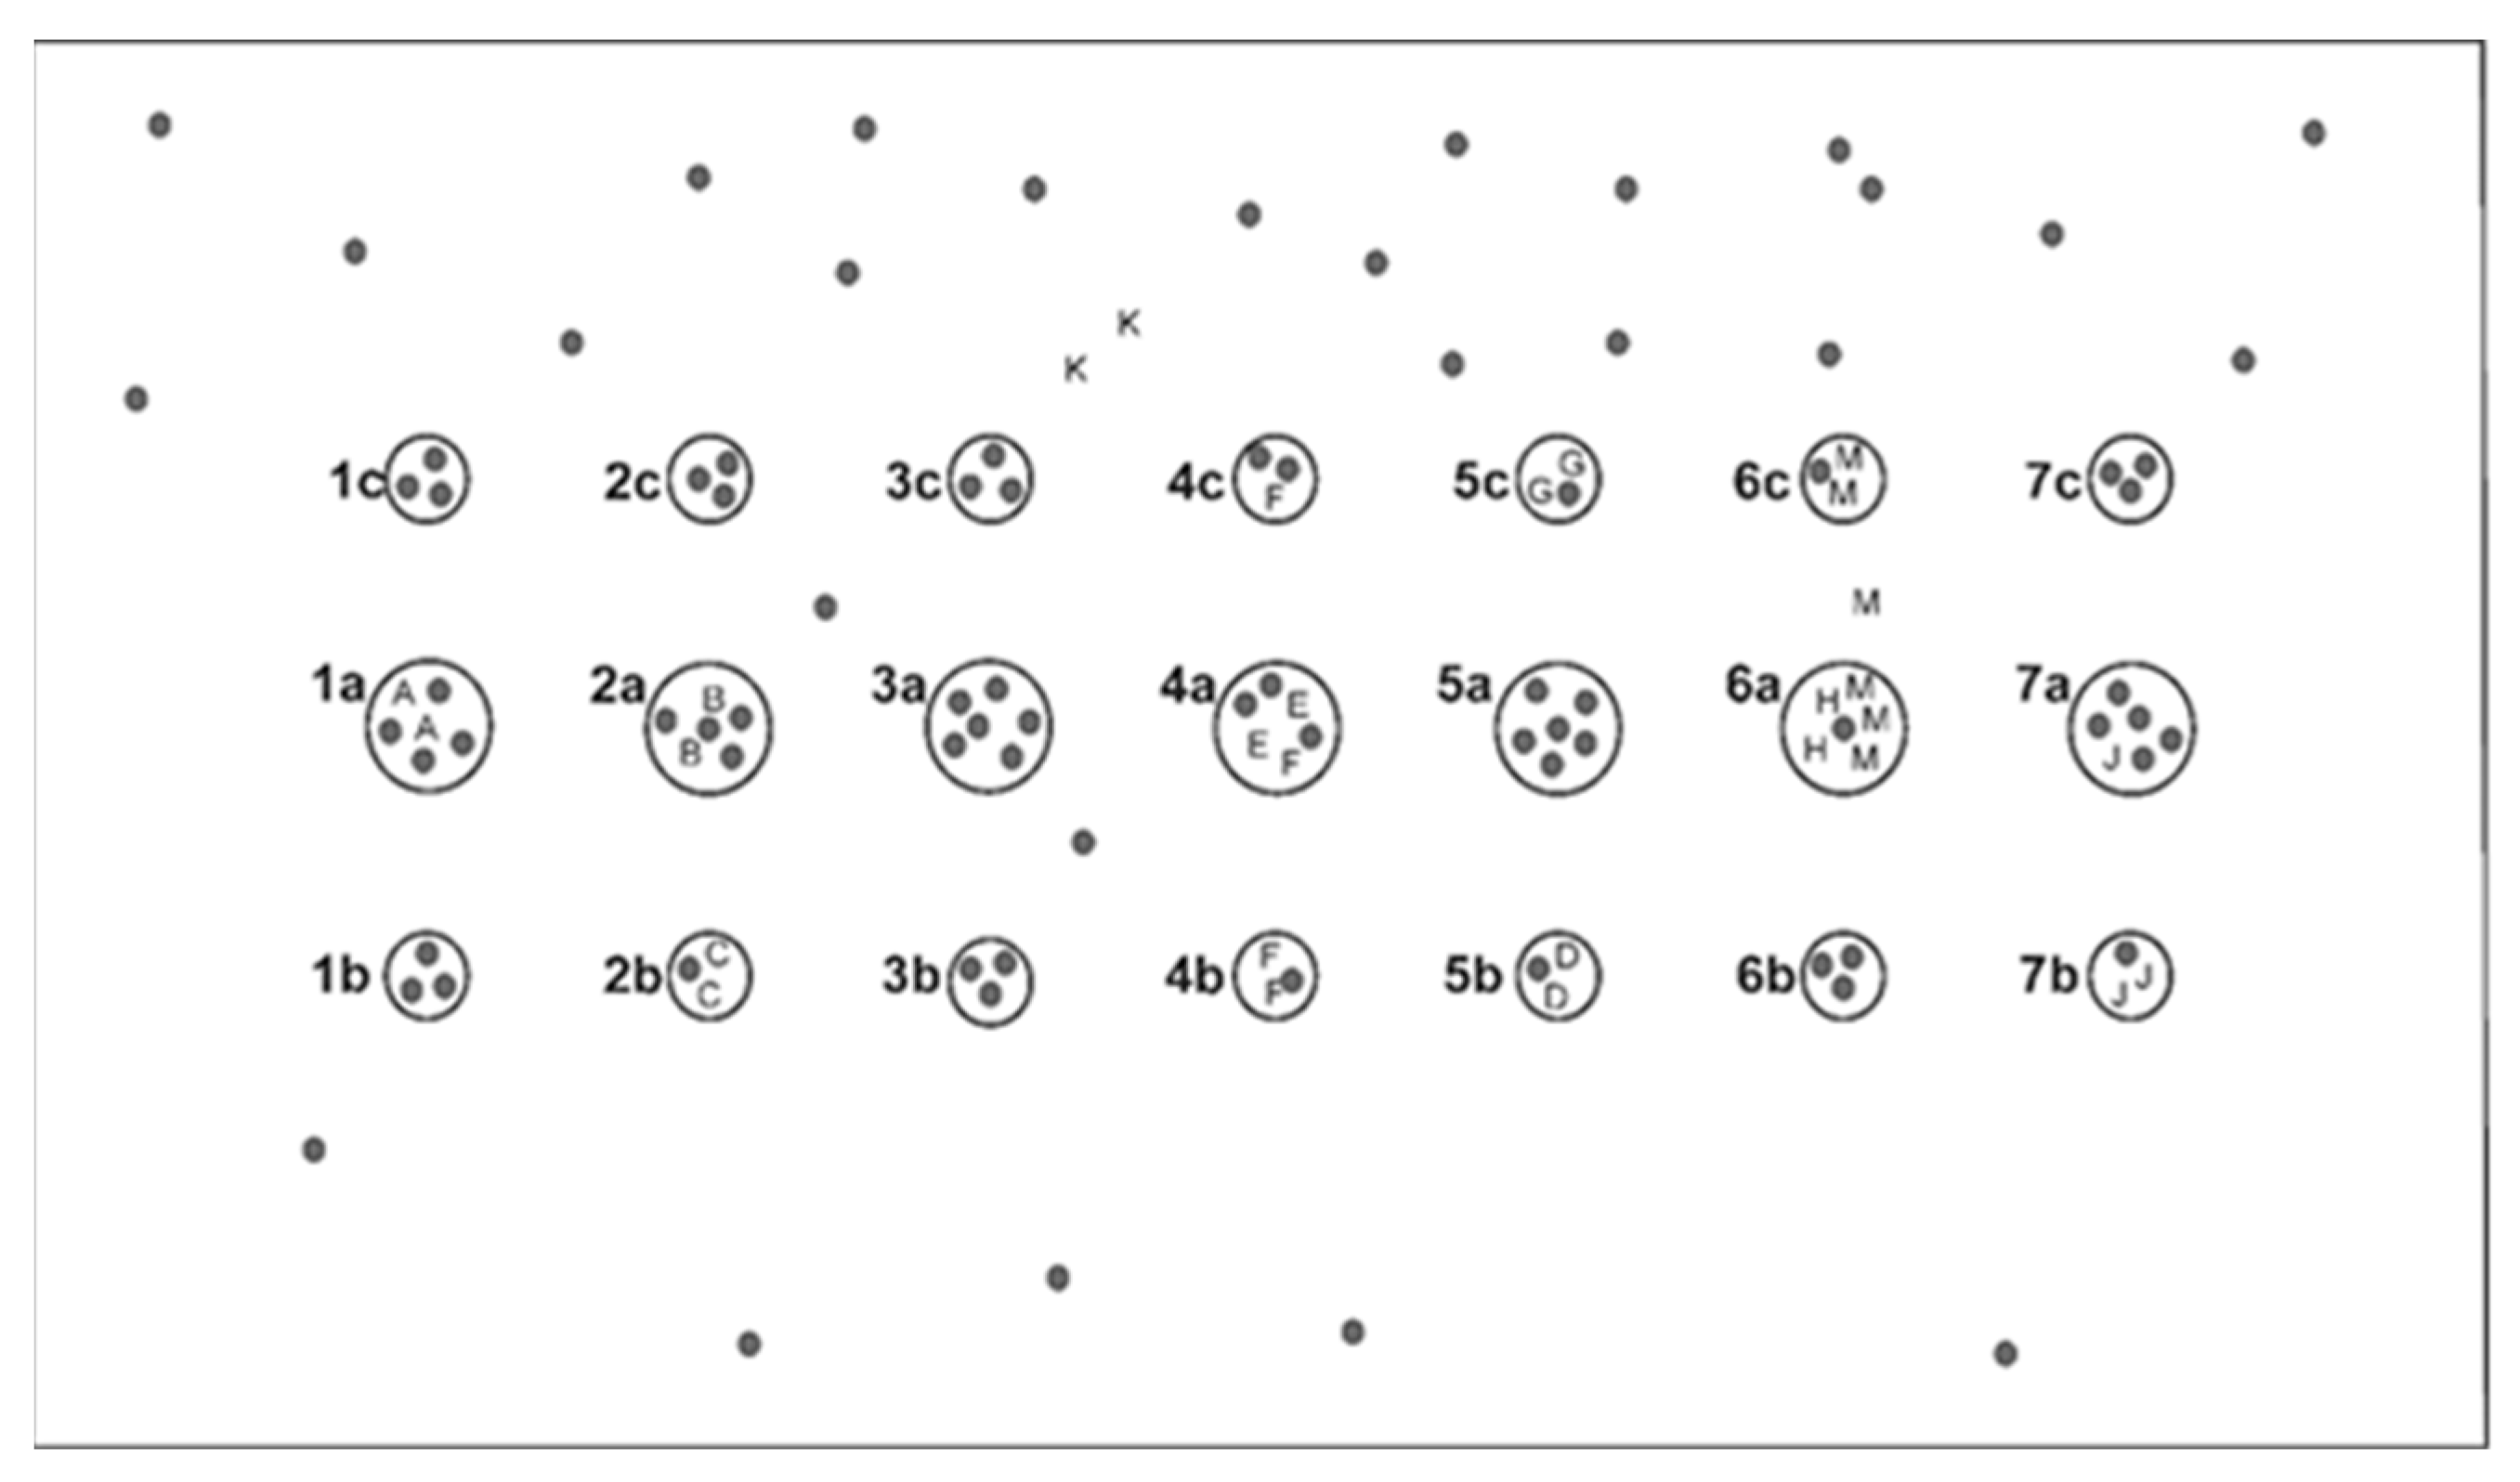
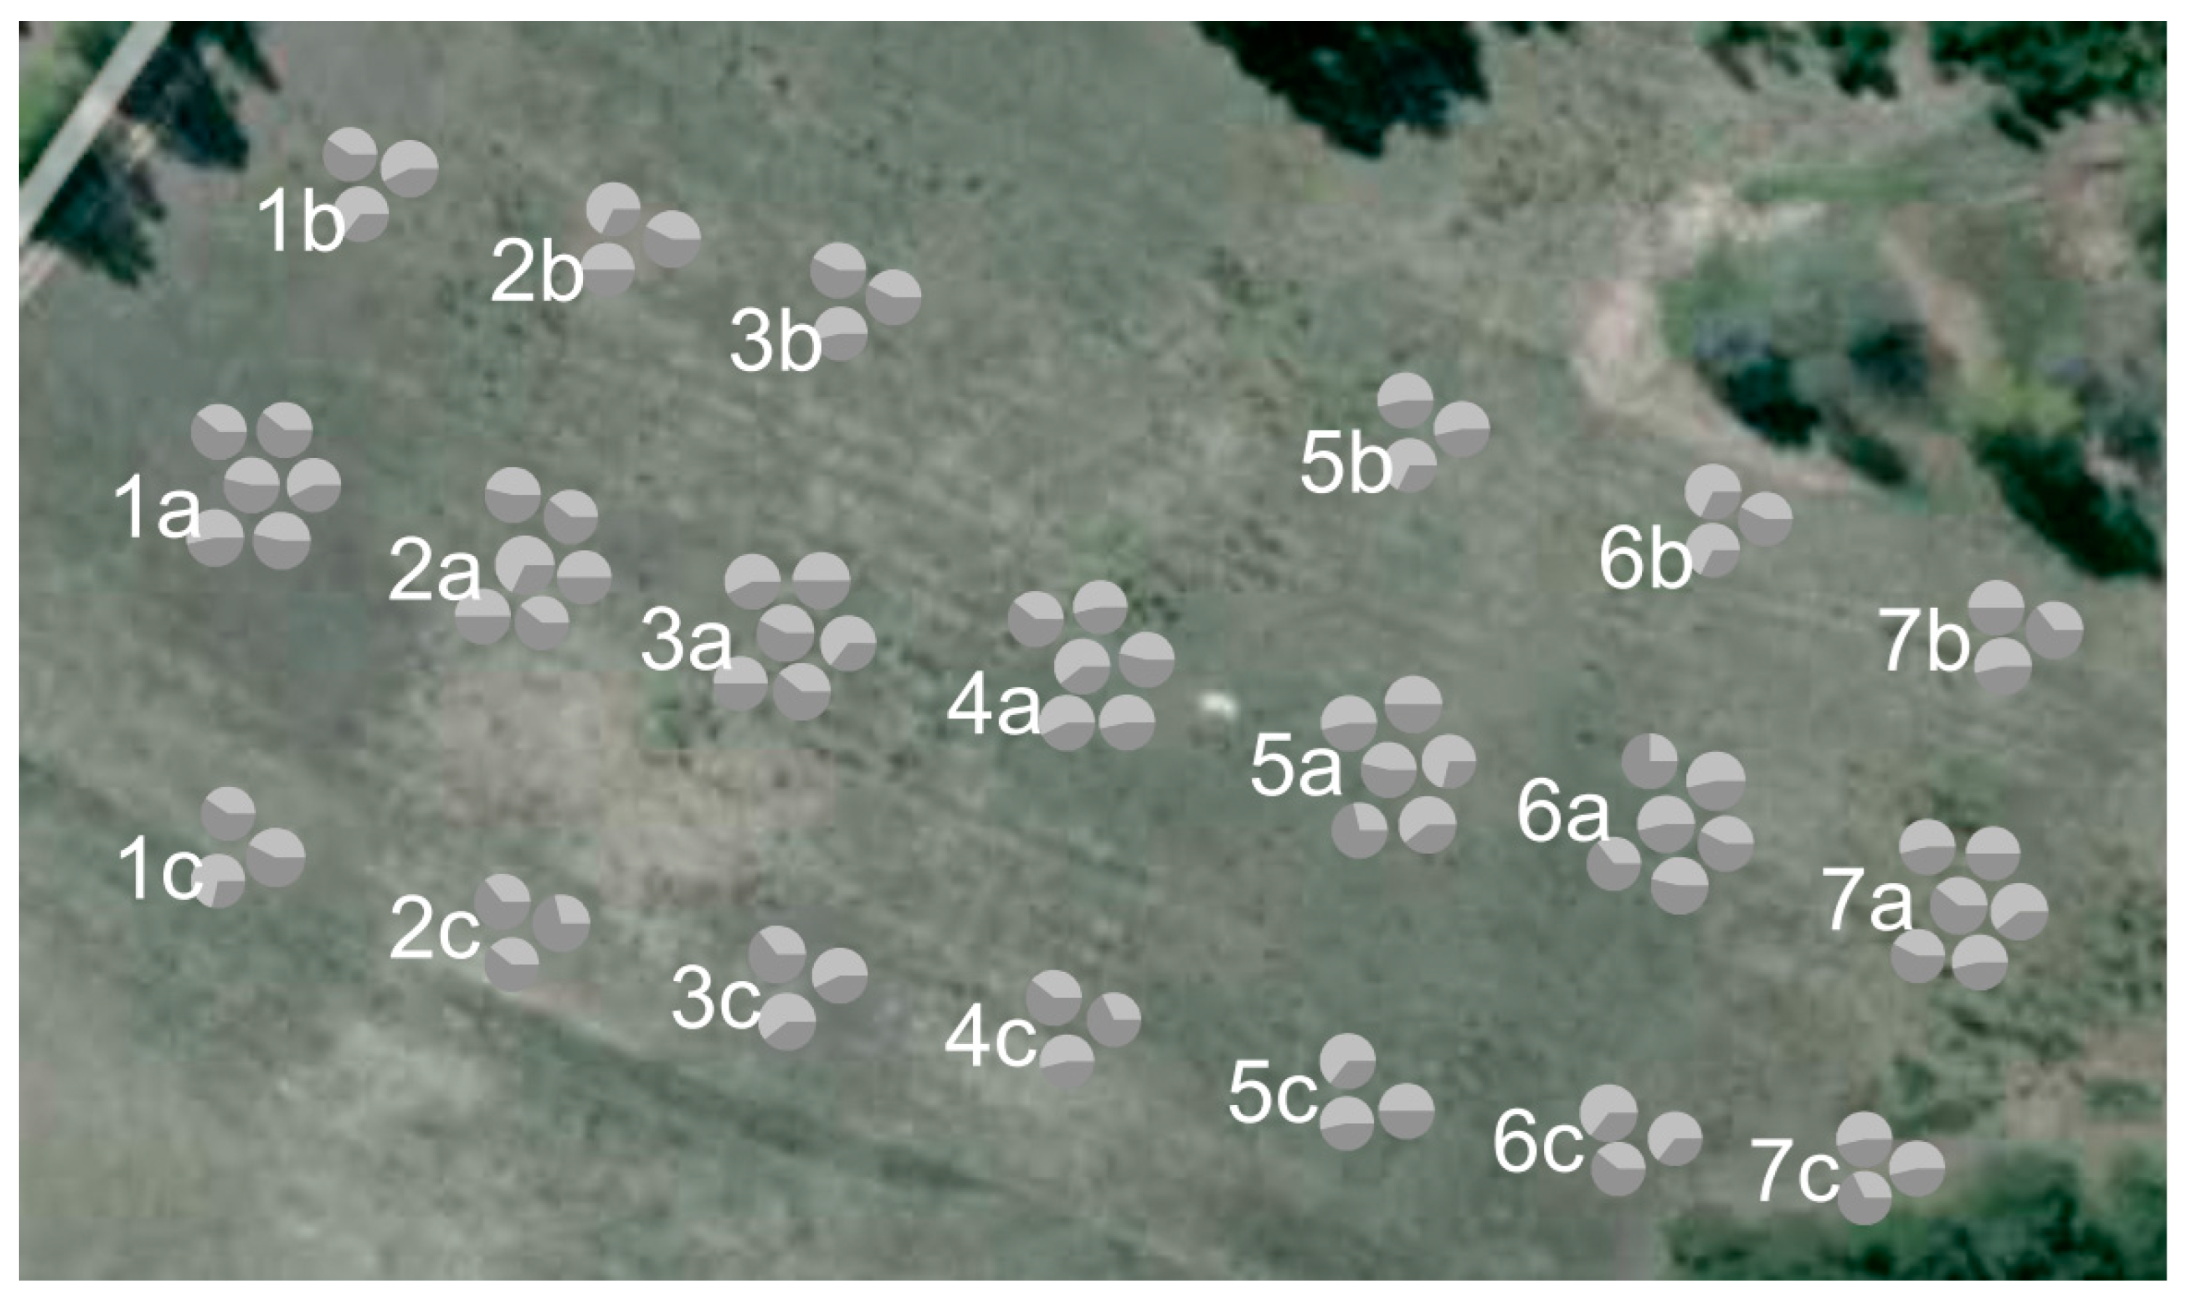
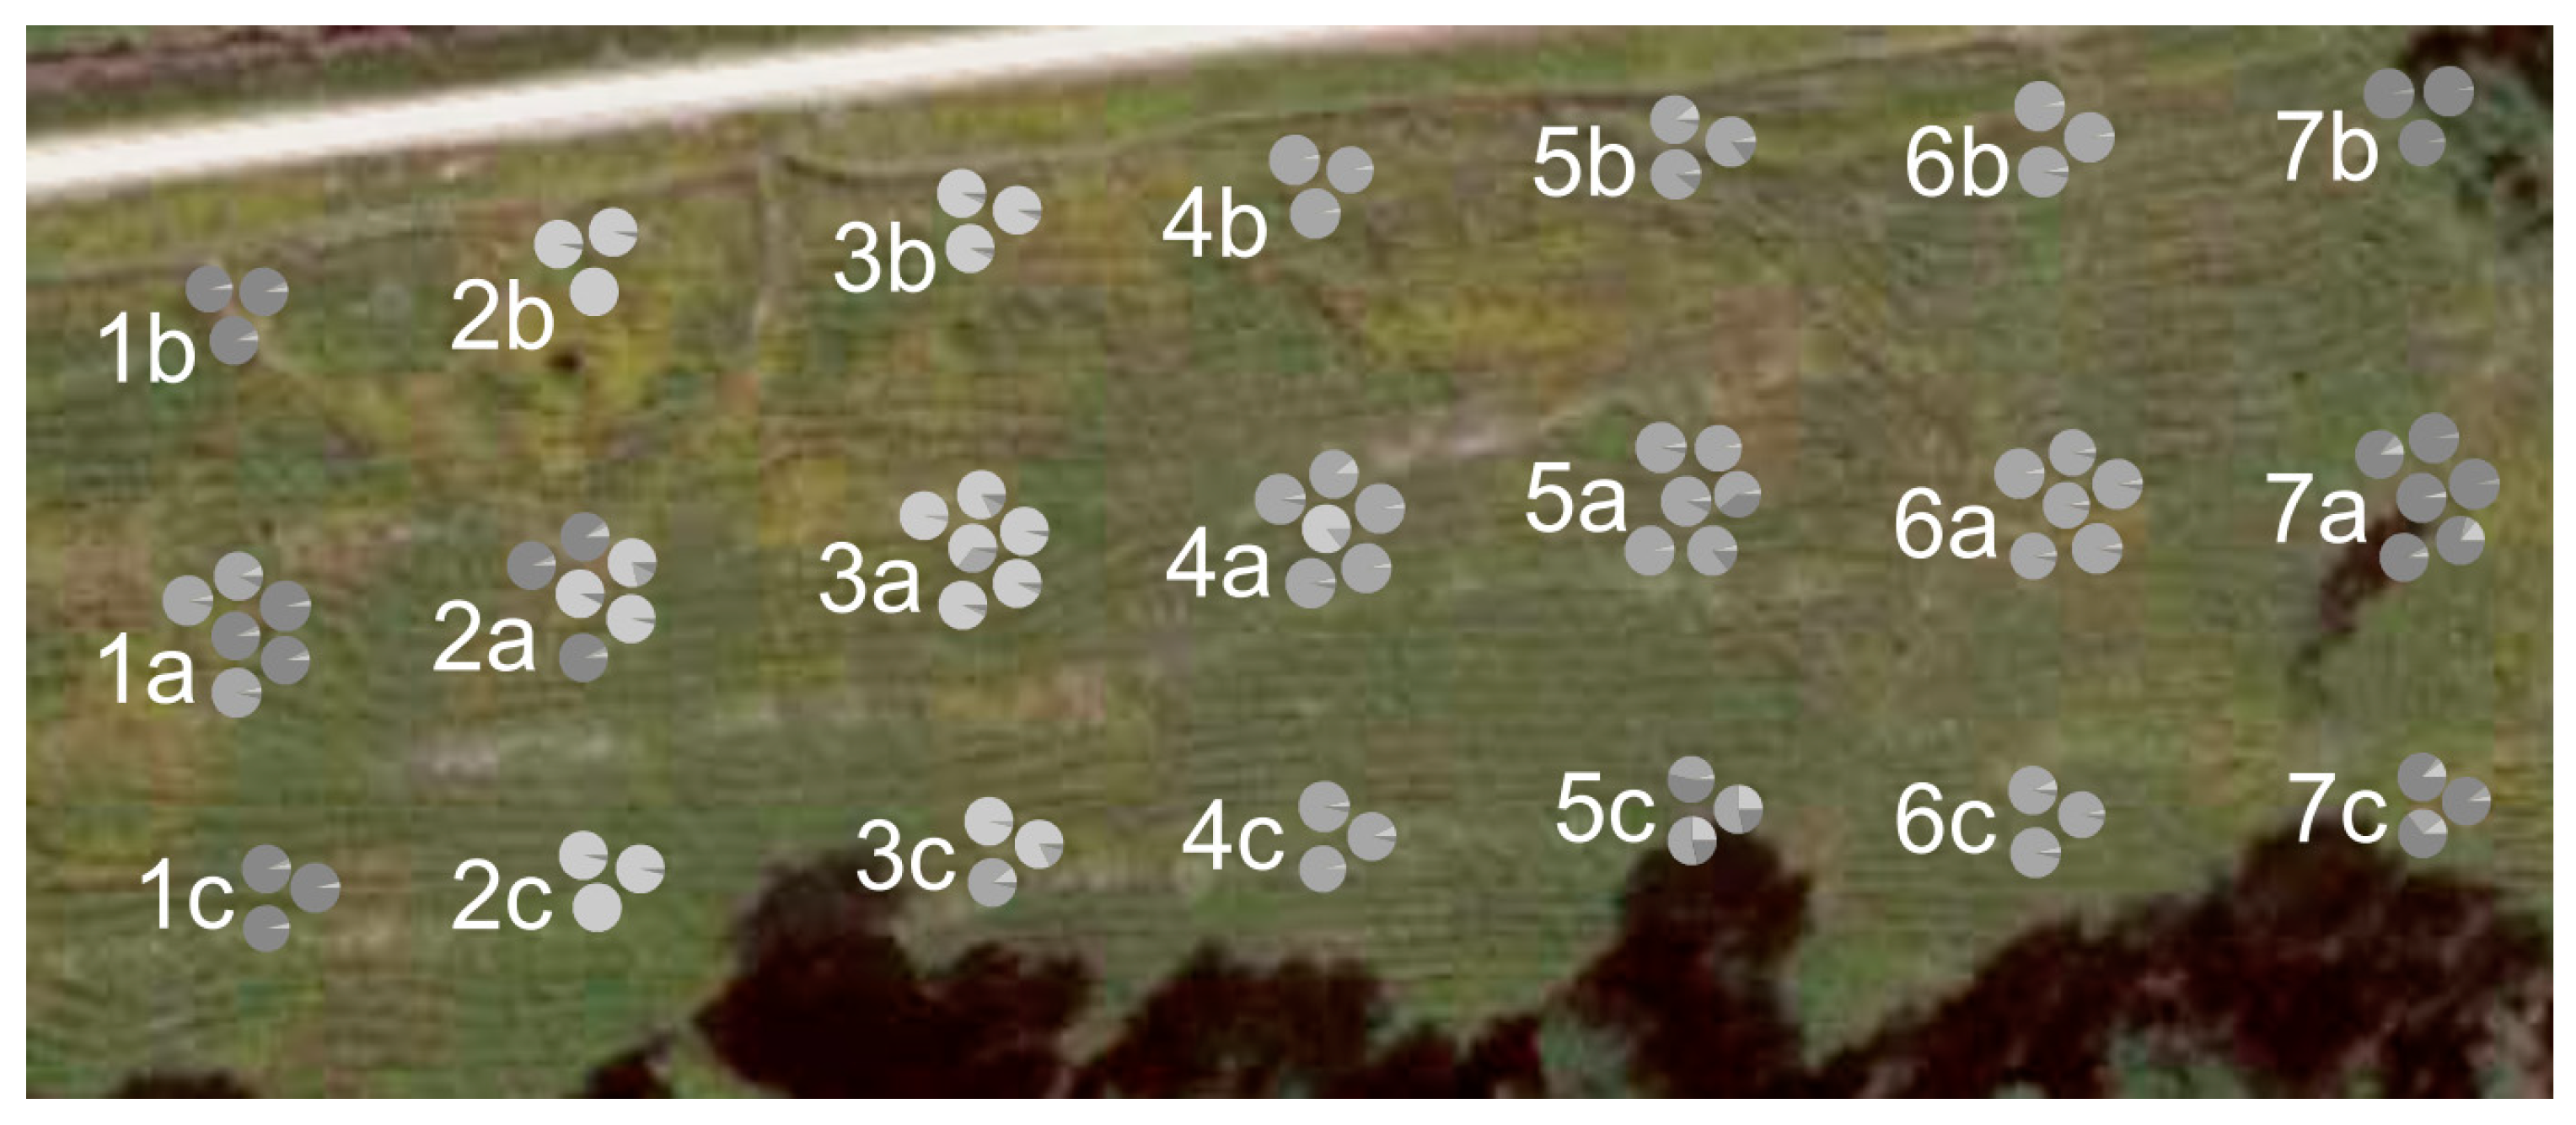
2.2. Sampling of Plant Material
2.3. Microsatellite Analysis
2.4. Statistical Analysis
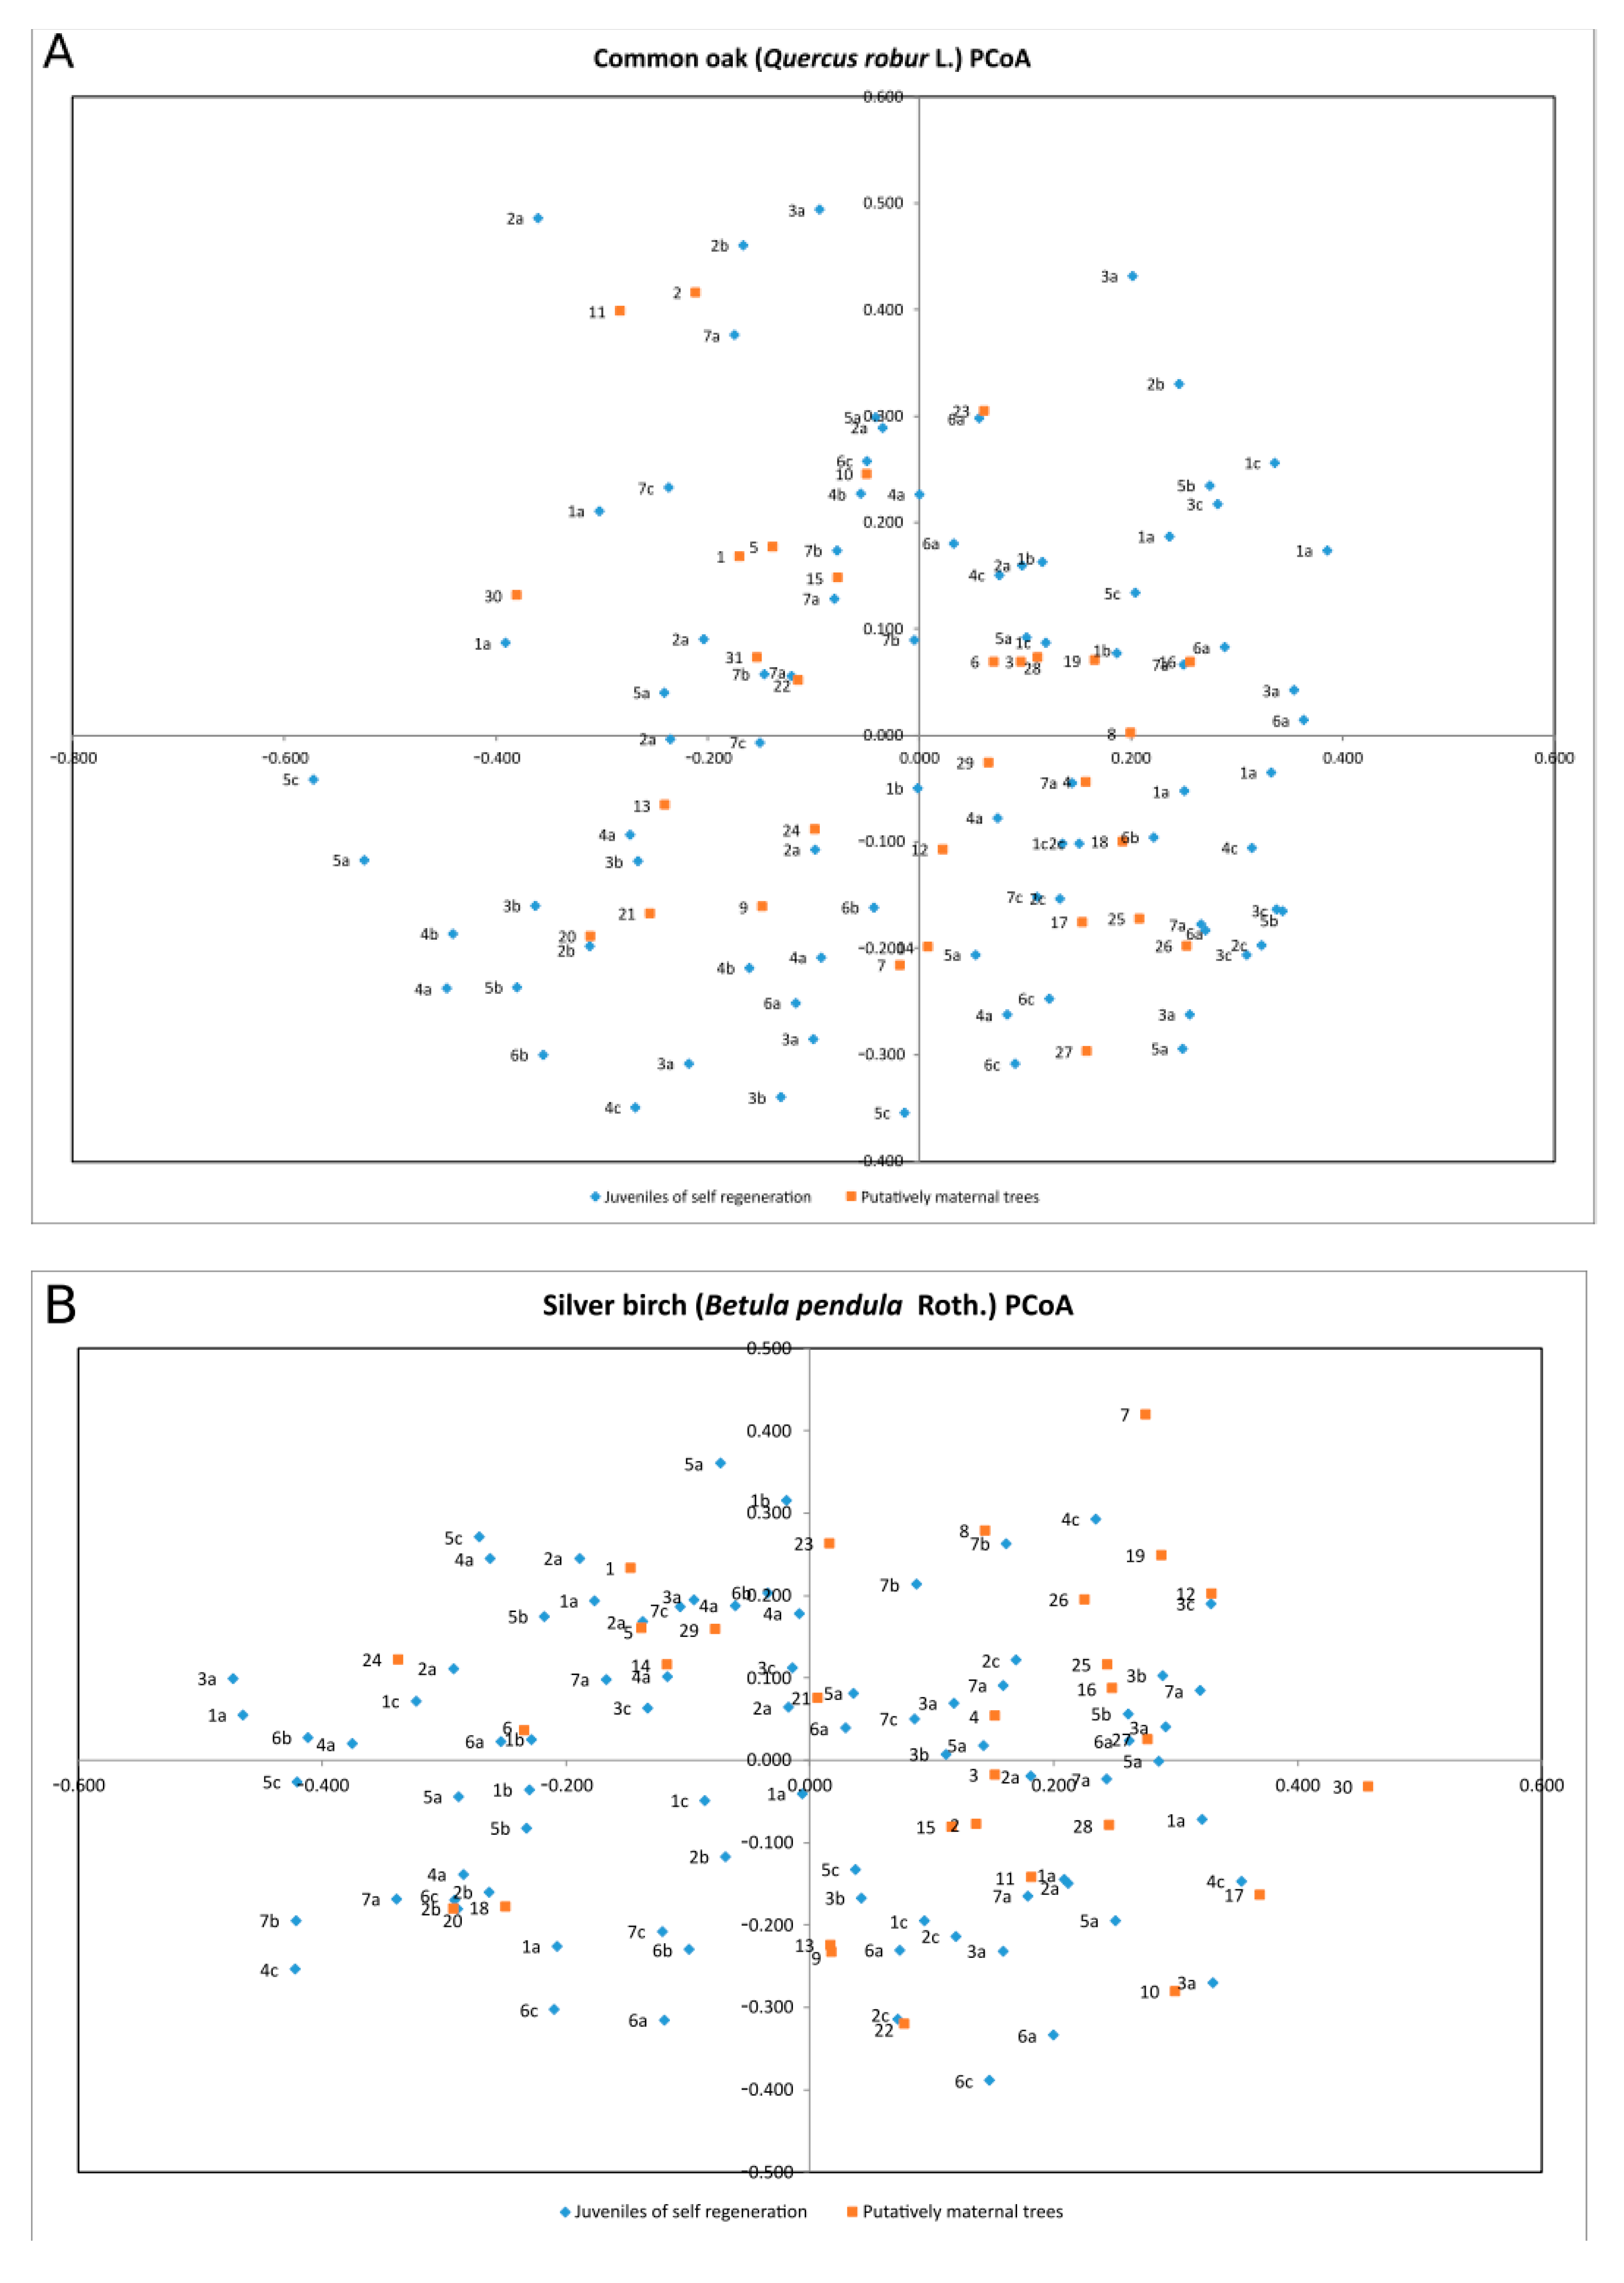
3. Results
4. Discussion
5. Conclusions
Supplementary Materials
Author Contributions
Funding
Data Availability Statement
Conflicts of Interest
References
- Ratnam, W.; Rajora, O.P.; Finkeldey, R.; Aravanopoulos, F.A.; Bouvet, J.M.; Vaillancourtf, R.E.; Kanashiro, M.; Fady, B.; Tomita, M.; Vinson, C. Genetic effects of forest management practices: Global synthesis and perspectives. For. Ecol. Manag. 2014, 333, 52–65. [Google Scholar] [CrossRef]
- Rajendra, K.C.; Seifert, S.; Prinz, K.; Gailing, O.; Finkeldey, R. Subtle human impacts on neutral genetic diversity and spatial patterns of genetic variation in European beech (Fagus sylvatica). For. Ecol. Manag. 2014, 319, 138–149. [Google Scholar] [CrossRef]
- Savolainen, O.; Pyhajarvi, T. Genomic diversity in forest trees. Curr. Opin. Plant. Biol. 2007, 10, 162–167. [Google Scholar] [CrossRef]
- Wójkiewicz, B.; Litkowiec, M.; Wachowiak, W. Contrasting patterns of genetic variation in core and peripheral populations of highly outcrossing and wind pollinated forest tree species. AoB Plants 2016, 8, plw054. [Google Scholar] [CrossRef]
- Aravanopoulos, F.A. Genetic monitoring in natural perennial plant populations. Botany 2011, 89, 75–81. [Google Scholar] [CrossRef]
- Namkoong, G. Biodiversity issues in genetics, forestry and ethics. For. Chron. 1992, 68, 438–443. [Google Scholar] [CrossRef]
- FOREST EUROPE. State of Europe’s Forests 2020. Ministerial Conference on the Protection of Forests in Europe, FOREST EUROPE Liaison Unit Bratislava, Slovenia. Available online: https://foresteurope.org/wp-content/uploads/2016/08/SoEF_2020.pdf (accessed on 1 December 2022).
- FORGER. Project FORGER–Towards the Sustainable Management of Forest Genetic Resources in Europe (2015). Available online: https://cordis.europa.eu/project/rcn/102045/reporting/en (accessed on 1 December 2022).
- Oddou-Muratorio, S.; Klein, E.K.; Demesure-Musch, B. Real-time patterns of pollen flow in the wild-service tree, Sorbus torminalis (Rosaceae). III. Mating patterns and the ecological maternal neighbourhood. Am. J. Bot. 2006, 93, 1650–1659. [Google Scholar] [CrossRef]
- Leimu, R.; Mutikainen, P.; Koricheva, J.; Fisher, M. How general are positive relationships between plant population size, fitness and genetic variation? J. Ecol. 2006, 94, 942–952. [Google Scholar] [CrossRef]
- Buiteveld, J.; Vendramin, G.G.; Leonardi, S.; Kamer, K.; Geburek, T. Genetic diversity and differentiation in European beech (Fagus sylvatica L.) stands varying in management history. For. Ecol. Manag. 2007, 247, 98–106. [Google Scholar] [CrossRef]
- Reed, D.H.; Frankham, R. Correlation between fitness and genetic diversity. Conserv. Biol. 2003, 17, 230–237. [Google Scholar] [CrossRef]
- Eriksson, G.; Ekberg, I.; Clapham, D. Genetics Applied to Forestry: An Introduction, 3rd ed.; Elanders Sverige AB: Uppsala, Sweden, 2013; pp. 1–206. [Google Scholar]
- Dering, M.; Chybicki, I. Assessment of genetic diversity in two-species oak seed and their progeny populations. Scan. J. For. Res. 2012, 27, 2–9. [Google Scholar] [CrossRef]
- Hu, X.S.; Li, B. Linking evolutionary quantitative genetics to the conservation of genetic resources in natural forest populations. Silvae. Genet. 2001, 51, 177–183. [Google Scholar]
- Müller-Starck, G. Protection of genetic variability in forest trees. For. Genet. 1995, 2, 121–124. [Google Scholar]
- Sagnard, F.; Oddou-Muratorio, S.; Pichot, C.; Vendramin, G.G.; Fady, B. Effect of seed dispersal, adult tree and seedling density on the spatial genetic structure of regeneration at fine temporal and spatial scales. Tree Genet. Genomes 2011, 7, 37–48. [Google Scholar] [CrossRef]
- Chybicki, I.J.; Burczyk, J. Realized gene flow within mixed stands of Quercus robur L. and Q. petraea (Matt.) L. revealed at the stage of naturally established seedling. Mol. Ecol. 2010, 19, 2137–2151. [Google Scholar] [CrossRef] [PubMed]
- Dering, M.; Misiorny, A.; Chalupka, W. Inter-year variation in selfing, background pollination, and paternal contribution in a Norway spruce clonal seed orchard. Can. J. For. Res. 2014, 44, 760–767. [Google Scholar] [CrossRef]
- Wojnicka-Półtorak, A.; Wachowiak, W.; Prus-Głowacki, W.; Celiński, K.; Korczyk, A. Genetic heterogeneity in age classes of naturally regenerated old growth forest of Picea abies (L.) Karst. Silvae Genet. 2014, 63, 185–190. [Google Scholar] [CrossRef]
- Wojnicka-Półtorak, A.; Celiński, K.; Chudzińska, E. Temporal dynamics in the genetic structure of a natural population of Picea abies. Biologia 2016, 71, 875–884. [Google Scholar] [CrossRef]
- Wojnicka-Półtorak, A.; Celiński, K.; Chudzińska, E. Genetic diversity among age classes of a Pinus sylvestris (L.) population from Białowieza primeval forest, Poland. Forests 2017, 8, 227. [Google Scholar] [CrossRef]
- Pliūra, A.; Bakys, R.; Suchockas, V.; Marčiulynienė, D.; Gustienė, A.; Verbyla, V.; Lygis, V. Ash dieback in Lithuania: Disease history, research on impact and genetic variation in disease resistance, tree breeding and options for forest management. In Dieback of European Ash (Fraxinus spp.): Consequences and Guidelines for Sustainable Management; Vasaitis, R., Enderle, R., Eds.; Swedish University of Agricultural Sciences: Uppsala, Sweden, 2017; pp. 150–165. [Google Scholar]
- Zolubas, P.; Gustienė, A. Oak decline in Lithuania. In Proceedings of the IUFRO Working Party 7.03.10 “Methodology of Forest Insect and Disease Survey in Central Europe”, Gmunden, Austria, 11–14 September 2006; pp. 150–153. [Google Scholar]
- Zolubas, P.; Žiogas, A. Recent outbreak of Ips typographus in [spruce forests in] Lithuania. In Proceedings of the First Workshop of the IUFRO WP 7.03.10 “Methodology of forest insect and disease survey in Central Europe”, Warsaw, Poland, 21–24 April 1998; pp. 197–198. [Google Scholar]
- Verbylaitė, R.; Pliūra, A.; Lygis, V.; Suchockas, V.; Jankauskienė, J.; Labokas, J. Genetic diversity and its spatial distribution in self-regenerating Norway spruce and Scots pine stands. Forests 2017, 8, 470. [Google Scholar] [CrossRef]
- Karazija, S. Lietuvos Miškų Tipai. In Forest Types of Lithuania; Mokslas: Vilnius, Lithuania, 1988; pp. 1–213. ISBN 5-420-00421-6. (In Lithuanian) [Google Scholar]
- Ryman, N.; Palm, S.; Andre, C.; Carvalho, G.R.; Dahlgren, T.G.; Jorde, P.E.; Laikre, L.; Larsson, C.; Palme, A.; Ruzzante, D.E. Power for detecting genetic divergence: Differences between statistical methods and marker loci. Mol. Ecol. 2006, 15, 2031–2045. [Google Scholar] [CrossRef]
- Haasl, R.J.; Payseur, B.A. Multi-locus inference of population structure: A comparison between single nucleotide polymorphisms and microsatellites. Heredity 2011, 106, 158–171. [Google Scholar] [CrossRef] [PubMed] [Green Version]
- Dow, B.D.; Ashley, M.V.; Howe, H.F. Characterization of highly variable (GA/CT)n microsatellites in the bur oak, Quercus macrocarpa. Theor. Appl. Genet. 1995, 91, 137–141. [Google Scholar] [CrossRef]
- Steinkellner, H.; Fluch, S.; Turetschek, E.; Lexer, C.; Streiff, R.; Kremer, A.; Burg, K.; Glössl, J. Identification and characterization of (GA/CT)n microsatellite loci from Quercus petraea. Plant Mol. Biol. 1997, 33, 1093. [Google Scholar] [CrossRef]
- Kampfer, S.; Lexer, C.; Glössl, J.; Steinkellner, H. Characterization of (GA)n microsatellite loci from Quercus robur. Hereditas 1998, 129, 183–186. [Google Scholar] [CrossRef]
- Dzialuk, A.; Chybicki, I.; Burczyk, J. PCR Multiplexing of Nuclear Microsatellite Loci in Quercus Species. Plant Mol. Biol. Rep. 2005, 23, 121–128. [Google Scholar] [CrossRef]
- Drašnarová, A.; Krak, K.; Vít, P.; Doudová, J.; Douda, J.; Hadincová, V.; Zákravský, P.; Mandák, B. Cross-amplification and multiplexing of SSR markers for Alnus glutinosa and A. incana. Tree Genet. Genomes 2014, 10, 865–873. [Google Scholar] [CrossRef]
- Kulju, K.K.M.; Pekkinen, M.; Varvio, S. Twenty-three microsatellite primer pairs for Betula pendula (Betulaceae). Mol. Ecol. Notes 2004, 4, 471–473. [Google Scholar] [CrossRef]
- Lefort, F.; Brachet, S.; Frascaria-Lacoste, N.; Edwards, K.J.; Douglas, G.C. Identification and characterisation of microsatellite loci in ash (Fraxinus excelsior L.) and their conservation in the olive family (Oleaceae). Mol. Ecol. 1999, 8, 1088–1091. [Google Scholar] [CrossRef]
- Brachet, S.; Jubier, M.F.; Richard, M.; Jung-Muller, B.; Frascaria-Lacoste, N. Rapid identification of microsatellite loci using 5′ anchored PCR in the common ash Fraxinus excelsior. Mol. Ecol. Notes 1999, 8, 160–163. [Google Scholar]
- Van der Schoot, J.; Pospiskova, M.; Vosman, B.; Smulders, M.J.M. Development and characterization of microsatellite markers in black poplar (Populus nigra L.). Theor. Appl. Genet. 2000, 101, 317–322. [Google Scholar] [CrossRef]
- Smulders, M.J.M.; Van Der Schoot, J.; Arens, P.; Vosman, B. Trinucleotide repeat microsatellite markers for black poplar (Populus nigra L.). Mol. Ecol. Notes 2001, 1, 188–190. [Google Scholar] [CrossRef]
- International Populus Genome Consortium. Available online: https://www.ornl.gov/sci/ipgc/ssr_resource.htm (accessed on 13 January 2012).
- Tereba, A.; Woodward, S.; Konecka, A.; Borys, M.; Nowakowska, J.A. Analysis of DNA profiles of ash (Fraxinus excelsior L.) to provide evidence of illegal logging. Wood Sci. Technol. 2017, 51, 1377–1387. [Google Scholar] [CrossRef] [Green Version]
- Bruegmann, T.; Fladung, M. Potentials and limitations of the cross-species transfer of nuclear microsatellite marker in six species belonging to three sections of the genus Populus, L. Tree Genet. Genomes 2013, 9, 1413–1421. [Google Scholar] [CrossRef]
- Kearse, M.; Moir, R.; Wilson, A.; Stones-Havas, S.; Cheung, M.; Sturrock, S.; Buxton, S.; Cooper, A.; Markowitz, S.; Duran, C.; et al. Geneious Basic: An integrated and extendable desktop software platform for the organization and analysis of sequence data. Bioinformatics 2012, 28, 1647–1649. [Google Scholar] [CrossRef]
- Peakall, R.; Smouse, P.E. GENALEX 6: Genetic analysis in Excel. Population genetic software for teaching and research. Mol. Ecol. Notes 2006, 6, 288–295. [Google Scholar] [CrossRef]
- Peakall, R.; Smouse, P.E. GenAlEx 6.5: Genetic analysis in Excel. Population genetic software for teaching and research-An update. Bioinformatics 2012, 28, 2537–2539. [Google Scholar] [CrossRef]
- Smouse, P.E.; Banks, S.C.; Peakall, R. Converting quadratic entropy to diversity: Both animals and alleles are diverse, but some are more diverse than others. PLoS ONE 2017, 12, e0185499. [Google Scholar] [CrossRef]
- Goudet, J. FSTAT (Version 1.2): A Computer Program to Calculate F-Statistics. J. Hered. 1995, 86, 485–486. [Google Scholar] [CrossRef]
- Waples, R.S.; Do, C. Linkage disequilibrium estimates of contemporary N e using highly variable genetic markers: A largely untapped resource for applied conservation and evolution. Evol. Appl. 2010, 3, 244–262. [Google Scholar] [CrossRef]
- Do, C.; Waples, R.S.; Peel, D.; Macbeth, G.M.; Tillett, B.J.; Ovenden, J.R. NeEstimator v2: Re-implementation of software for the estimation of contemporary effective population size (Ne) from genetic data. Mol. Ecol. Resour. 2014, 14, 209–214. [Google Scholar] [CrossRef]
- Aravanopoulos, F.A.; Kavaliauskas, D.; Fussi, B.; Westergren, M.; Alizoti, P.; Bajc, M.; Tourvas, N.; Breznikar, A.; Chasilidis, P.; Damjanić, R.; et al. Indicators, verifiers and background information. In Manual for Forest Genetic Monitoring, 1st ed.; Bajc, M., Aravanopoulos, F., Westergren, M., Fussi, B., Kavaliauskas, D., Alizoti, P., Kiourtsis, F., Kraigher, H., Eds.; Slovenian Forestry Institute, Silva Slovenica Publishing Centre: Ljubljana, Slovenia, 2020; pp. 33–44. [Google Scholar]
- Pritchard, J.K.; Stephens, M.; Donnelly, P. Inference of population structure using multilocus genotype data. Genetics 2000, 155, 945–959. [Google Scholar] [CrossRef] [PubMed]
- Falush, D.; Stephens, M.; Pritchard, J.K. Inference of population structure using Multilocus genotype data: Linked loci and correlated allele frequencies. Genetics 2003, 164, 1567–1587. [Google Scholar] [CrossRef] [PubMed]
- Falush, D.; Stephens, M.; Pritchard, J.K. Inference of population structure using multilocus genotype data: Dominant markers and null alleles. Mol. Ecol. Notes 2007, 7, 574–578. [Google Scholar] [CrossRef]
- Hubisz, M.J.; Falush, D.; Stephens, M.; Pritchard, J.K. Inferring weak population structure with the assistance of sample group information. Mol. Ecol. Res. 2009, 9, 1322–1332. [Google Scholar] [CrossRef] [PubMed]
- Earl, D.A.; vonHoldt, B.M. STRUCTURE HARVESTER: A website and program for visualizing STRUCTURE output and implementing the Evanno method. Conserv. Genet. Resour. 2012, 4, 359–361. [Google Scholar] [CrossRef]
- Stebins, G.L.; Hartl, D.L. Comparative evolution: Latent potentials for anagenetic advance. Proc. Natl. Acad. Sci. USA 1988, 85, 5141–5145. [Google Scholar] [CrossRef]
- Bergmann, F.; Gregorius, H.R.; Larsen, J.B. Levels of genetic variation in European Silver fir (Abies alba)—Are They Related to the Species Decline? Genetica 1990, 82, 1–10. [Google Scholar] [CrossRef]
- Fussi, B.; Konnert, M. Genetic analysis of European common ash (Fraxinus excelsior L.) populations affected by ash dieback. Silvae Genet. 2014, 63, 198–212. [Google Scholar] [CrossRef]
- Mariette, S.; Cottrell, J.; Csaikl, U.M.; Goikoechea, P.; König, A.; Lowe, A.J.; Van Dam, B.C.; Barreneche, T.; Bodenes, C.; Streiff, R.; et al. Comparison of levels of genetic diversity detected with AFLP and microsatellite markers within and among mixed Q. petraea (Matt.) Liebl. and Q. robur L. stands. Silvae Genet. 2002, 51, 72–79. [Google Scholar]
- Mingeot, D.; Husson, C.; Mertens, P.; Watillon, B.; Bertin, P.; Druart, P. Genetic diversity and genetic structure of black alder (Alnus glutinosa [L.] Gaertn.) in the Belgium-Luxembourg-France cross-border area. Tree Genet. Genomes 2016, 12, 24. [Google Scholar] [CrossRef]
- Streiff, R.; Labbe, T.; Bacilieri, R.; Steinkellner, H.; Glössl, J.; Kremer, A. Within-population genetic structure in Quercus robur L. and Quercus petraea (Matt.) Liebl. assessed with isozymes and microsatellites. Mol. Ecol. 1998, 7, 317–328. [Google Scholar] [CrossRef]
- Zeps, M.; Voronova, A.; Smilga, J.; Kanberga-Silina, K.; Lubinskis, L.; Baders, E.; Rungis, D.; Jansons, A. Within- and among-stand genetic diversity of common aspen (Populus tremula L.) in Latvia. Balt. For. 2017, 23, 498–506. [Google Scholar]
- Nowakowska, A.N.; Zachara, T.; Konecka, A. Genetic variability of Scots pine (Pinus sylvestris L.) and Norway spruce (Picea abies L. Karst.) natural regeneration compared with their maternal stands. Lesne Prace Badawcze 2014, 75, 47–54. [Google Scholar] [CrossRef]
- Yazdani, R.; Muona, O.; Rudin, D.; Szmidt, A.E. Genetic structure of Pinus sylvestris seed tree stand and naturally regenerated understory. For. Sci. 1985, 31, 430–436. [Google Scholar] [CrossRef]
- Semizer-Cuming, D.; Chybicki, I.J.; Finkeldey, R.; Kjær, E.D. Gene flow and reproductive success in ash (Fraxinus excelsior L.) in the face of ash dieback: Restoration and conservation. Ann. For. Sci. 2021, 78, 14. [Google Scholar] [CrossRef]
- Enderle, R.; Stenlid, J.; Vasaitis, R. An overview of ash (Fraxinus spp.) and the ash dieback disease in Europe. CAB Rev. 2019, 14, 1–12. [Google Scholar] [CrossRef]
- Lindtke, D.; Gompert, Z.; Lexer, C.; Buerkle, C.A. Unexpected ancestry of Populus seedlings from a hybrid zone implies a large role for postzygotic selection in the maintenance of species. Mol. Ecol. 2014, 23, 4316–4330. [Google Scholar] [CrossRef]
- Petit, R.J.; Hampe, A. Some evolutionary consequences of being a tree. Annu. Rev. Ecol. Evol. Syst. 2006, 37, 187–214. [Google Scholar] [CrossRef]
- Alfaro, R.I.; Fady, B.; Vendramin, G.G.; Dawson, I.K.; Fleming, I.K.; Sáenz-Romero, C.; Lindig-Cisneros, A.; Murdock, T.; Vinceti, B.; Navarro, C.M.; et al. The role of forest genetic resources in responding to biotic and abiotic factors in the context of anthropogenic climate change. For. Ecol. Manag. 2014, 333, 76–87. [Google Scholar] [CrossRef]
- Fussi, B.; Westergren, M.; Aravanopoulos, F.; Baier, R.; Kavaliauskas, D.; Finzgar, D.; Alizoti, P.; Bozic, G.; Avramidou, E.; Konnert, M.; et al. Forest genetic monitoring: An overview of concepts and definitions. Environ. Monit. Assess. 2016, 188, 493. [Google Scholar] [CrossRef]
- Palstra, F.P.; Ruzzante, D.E. Genetic estimates of contemporary effective population size: What can they tell us about the importance of genetic stochasticity for wild population persistence? Mol. Ecol. 2008, 17, 3428–3447. [Google Scholar] [CrossRef] [PubMed]
- Burckhardt, A. Saen und Pflanzen Sowing and Planting, 4th ed.; Carl Rümpler: Hannover, Germany, 1870; pp. 449–460. [Google Scholar]
- Myking, T.; Bøhler, F.; Austrheim, G.; Solberg, E.J. Life history strategies of aspen (Populus tremula L.) and browsing effects: A literature review. Forestry 2011, 84, 61–71. [Google Scholar] [CrossRef]
- Bakys, R.; Pliūra, A.; Bajerkevičienė, G.; Marčiulynas, A.; Marčiulynienė, D.; Lynikienė, J.; Menkis, A. Mycobiota Associated with Symptomatic and Asymptomatic Fraxinus excelsior in Post-Dieback Forest Stands. Forests 2022, 13, 1609. [Google Scholar] [CrossRef]


| Study Site (Stand-Forming Species) | Type and Year of Disturbance | Regional Division of State Forest Enterprise | Forest Site Type a | Latitude N Longitude E |
|---|---|---|---|---|
| Quercus robur L. | Sanitary clearfelling in 2007 | Jonava | Oxalido-nemorosa | 55°9.180′ 24°6.946′ |
| Betula pendula Roth. | Abandoned agricultural land since 2013 | Tytuvėnai | Vaccinio-myrtillosa | 55°31.934′ 23°10.858′ |
| Populus tremula L. | Regular clearfelling in 2013 | Anykščiai | Oxalido-nemorosa | 55°32.354′ 24°51.835′ |
| Alnus glutinosa (L.) Gaertn. | Regular clearfelling in 2013 | Prienai | Oxalido-nemorosa | 54°43.946′ 23°53.748′ |
| Fraxinus excelsior L. | Sanitary clearfelling in 2013 | Kėdainiai | Carico-mixtoherbosa | 55°13.560′ 23°58.127′ |
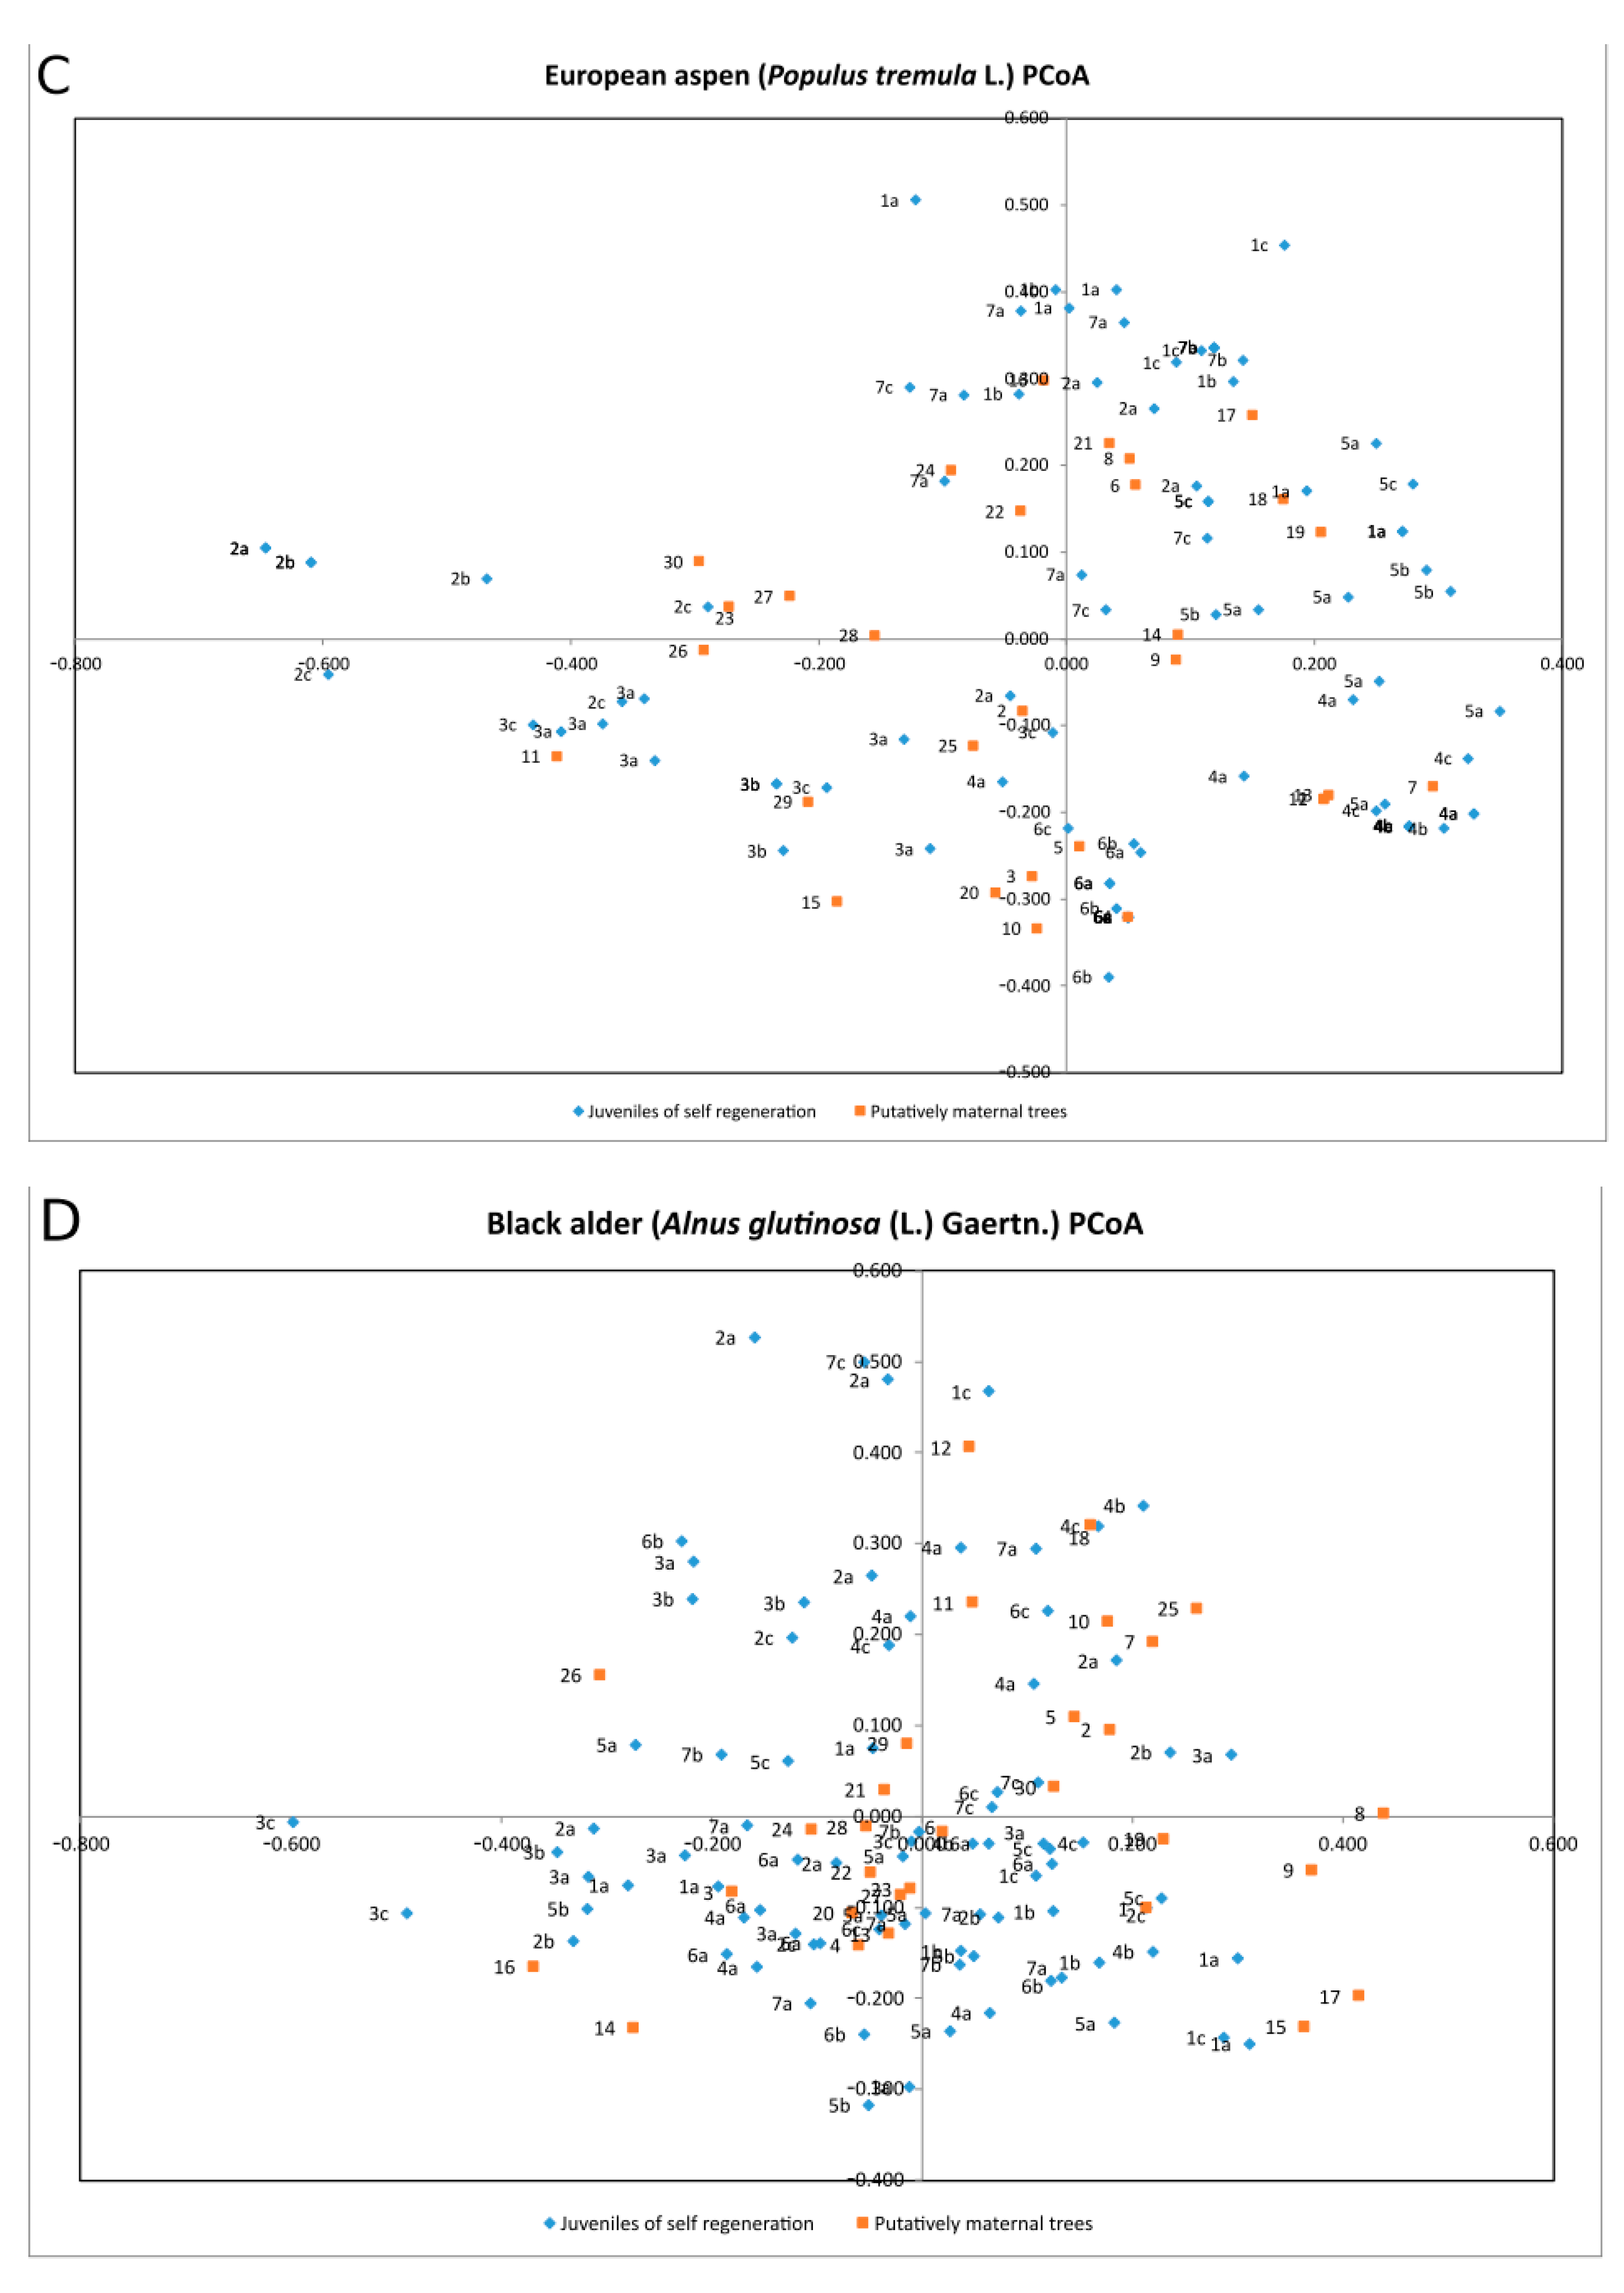
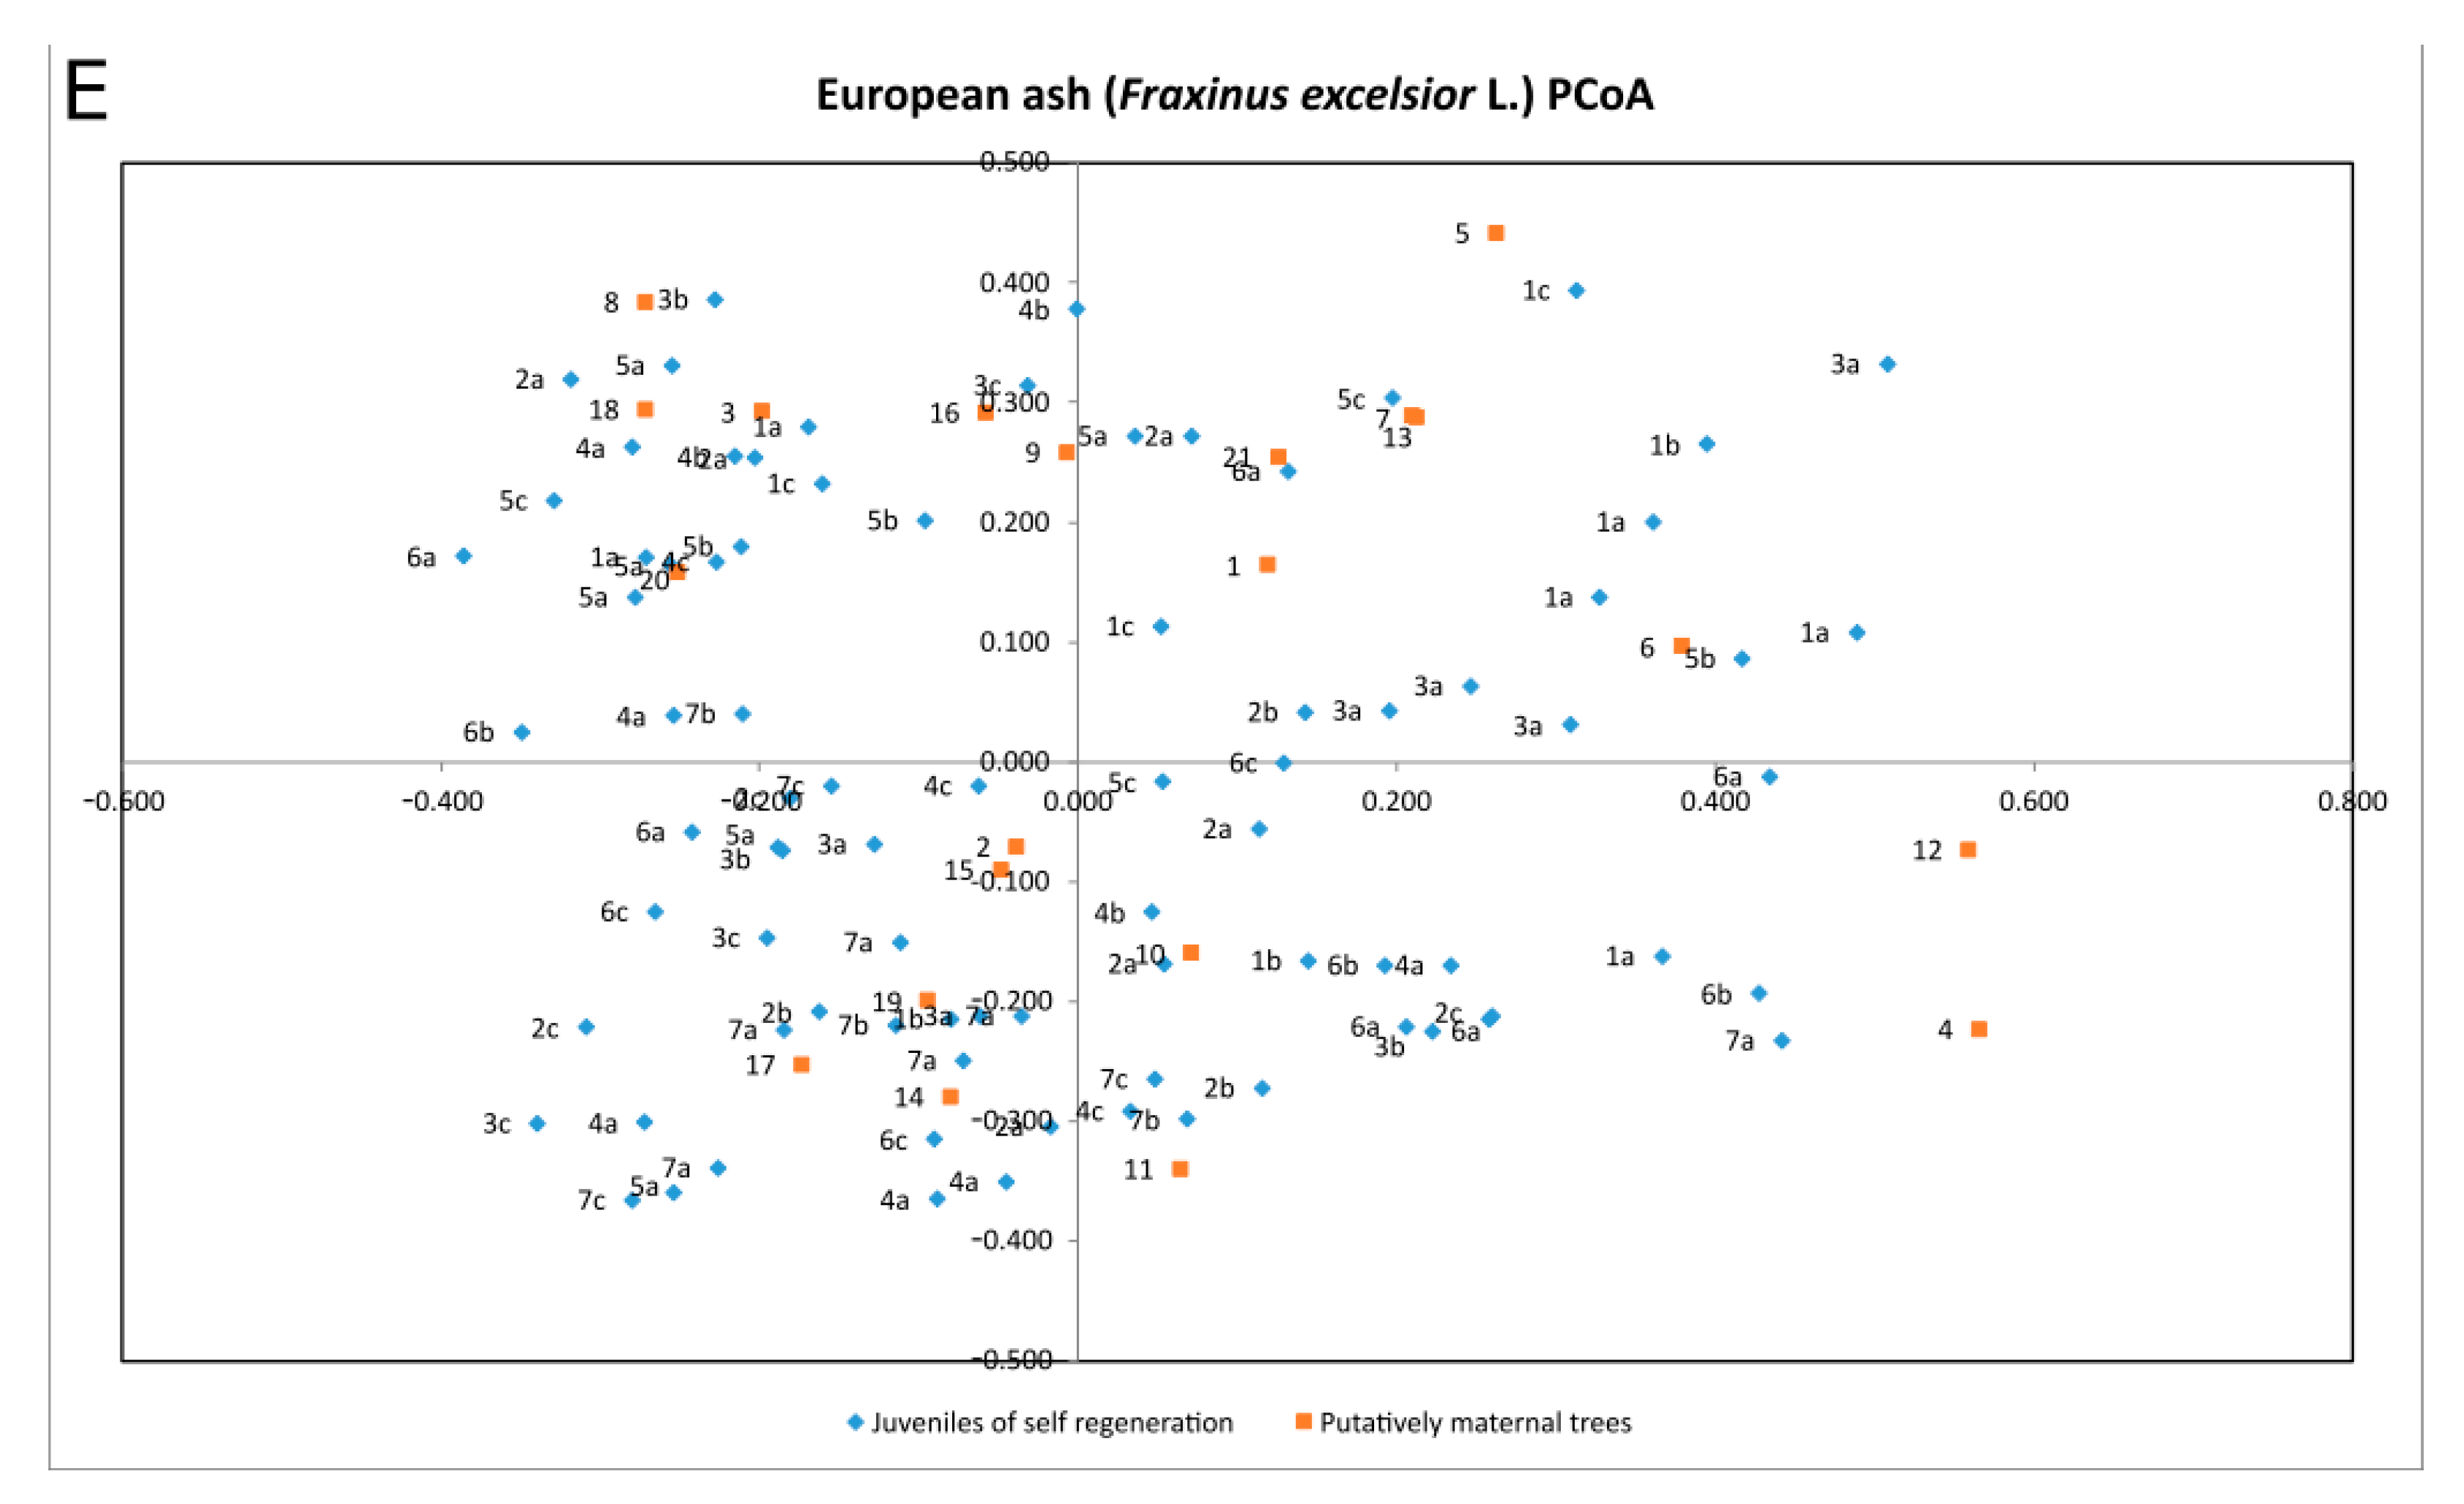
| Species | Percentage of Variation | Coordinate 1 | Coordinate 2 | Coordinate 3 |
|---|---|---|---|---|
| Quercus robur | % | 22.68% | 19.21% | 16.52% |
| Cumulative % | 22.68% | 41.89% | 58.41% | |
| Betula pendula | % | 27.50% | 16.81% | 15.54% |
| Cumulative % | 27.50% | 44.32% | 59.86% | |
| Populus tremula | % | 28.84% | 26.28% | 15.17% |
| Cumulative % | 28.84% | 55.12% | 70.29% | |
| Alnus glutinosa | % | 21.35% | 19.83% | 17.01% |
| Cumulative % | 21.35% | 41.18% | 58.19% | |
| Fraxinus excelsior | % | 23.98% | 22.07% | 15.16% |
| Cumulative % | 23.98% | 46.05% | 61.21% |
| Sample Group | N | Na ± SE | Ne ± SE | Ho ± SE | He ± SE | F ± SE | Ar ± SE | Effective Population Size (95% CI) | LGP ± SE |
|---|---|---|---|---|---|---|---|---|---|
| Q. robur mature | 30 | 12.125 ± 0.972 | 7.241 ± 0.995 | 0.762 ± 0.051 | 0.839 ± 0.026 | 0.093 ± 0.051 | 12.13 ± 0.909 | 129.8 (73.7–421.1) | 4.884 ± 0.412 |
| Q. robur young | 84 | 14.750 ± 0.675 | 6.666 ± 0.969 | 0.769 ± 0.038 | 0.817 ± 0.036 | 0.057 ± 0.028 | 11.44 ± 0.689 | 102.9 (86.3–125.7) | 8.084 ± 0.791 |
| B. pendula mature | 30 | 11.500 ± 1.210 | 4.281 ± 0.583 | 0.754 ± 0.045 | 0.731 ± 0.039 | −0.042 ± 0.062 | 11.50 ± 1.132 | 109.6 (62–361.4) | 7.129 ± 0.893 |
| B. pendula young | 81 | 16.000 ± 2.000 | 5.459 ± 0.799 | 0.853 ± 0.021 | 0.789 ± 0.029 | −0.094 ± 0.052 | 11.75 ± 1.153 | 208.5 (156.3–304.3) | 10.541 ± 1.572 |
| P. tremula mature | 30 | 7.000 ± 0.845 | 3.295 ± 0.450 | 0.829 ± 0.080 | 0.655 ± 0.047 | −0.251 ± 0.072 | 7.00 ± 0.791 | 26.9 (18.4–43.5) | 3.705 ± 0.531 |
| P. tremula young | 84 | 7.375 ± 0.596 | 3.022 ± 0.555 | 0.759 ± 0.109 | 0.598 ± 0.065 | −0.214 ± 0.123 | 6.01 ± 0.408 | 13.5 (11.4–15.8) | 4.353 ± 0.521 |
| A. glutinosa mature | 30 | 9.750 ± 1.098 | 4.562 ± 0.575 | 0.833 ± 0.063 | 0.740 ± 0.051 | −0.128 ± 0.048 | 9.75 ± 1.023 | 66.6 (41.5–143.5) | 5.188 ± 0.557 |
| A. glutinosa young | 84 | 10.500 ± 1.648 | 4.229 ± 0.642 | 0.826 ± 0.067 | 0.704 ± 0.061 | −0.194 ± 0.079 | 8.32 ± 1.114 | 793.9 (284–∞) | 6.271 ± 0.984 |
| F. excelsior mature | 21 | 12.375 ± 1.580 | 7.027 ± 1.440 | 0.625 ± 0.064 | 0.795 ± 0.051 | 0.223 ± 0.053 | 12.38 ± 1.478 | ∞ (138.3–∞) | 5.348 ± 0.944 |
| F. excelsior young | 84 | 20.875 ± 2.341 | 8.252 ± 1.666 | 0.665 ± 0.062 | 0.825 ± 0.050 | 0.196 ± 0.054 | 13.31 ± 1.413 | 1054.4 (504–∞) | 12.623 ± 1.560 |
| Species | FIS (%) | FIT (%) | FST (%) |
|---|---|---|---|
| Q. robur | 0.075 ± 0.037 (91.6%) | 0.085 ± 0.036 (7.5%) | 0.010 ± 0.001 (0.9%) |
| B. pendula | −0.07 ± 0.053 (98.9%) | −0.058 ± 0.054 (0.0%) | 0.011 ± 0.002 (1.1%) |
| P. tremula | −0.239 ± 0.089 (99.2%) | −0.229 ± 0.090 (0.0%) | 0.009 ± 0.002 (0.8%) |
| A. glutinosa | −0.158 ± 0.059 (99.7%) | −0.151 ± 0.058 (0.0%) | 0.006 ± 0.001 (0.3%) |
| F. excelsior | 0.208 ± 0.048 (79.0%) | 0.217 ± 0.047 (20.6%) | 0.011 ± 0.001 (0.4%) |
Disclaimer/Publisher’s Note: The statements, opinions and data contained in all publications are solely those of the individual author(s) and contributor(s) and not of MDPI and/or the editor(s). MDPI and/or the editor(s) disclaim responsibility for any injury to people or property resulting from any ideas, methods, instructions or products referred to in the content. |
© 2023 by the authors. Licensee MDPI, Basel, Switzerland. This article is an open access article distributed under the terms and conditions of the Creative Commons Attribution (CC BY) license (https://creativecommons.org/licenses/by/4.0/).
Share and Cite
Verbylaitė, R.; Pliūra, A.; Lygis, V.; Suchockas, V.; Jankauskienė, J.; Labokas, J. Genetic Diversity of Five Broadleaved Tree Species and Its Spatial Distribution in Self-Regenerating Stands. Forests 2023, 14, 281. https://doi.org/10.3390/f14020281
Verbylaitė R, Pliūra A, Lygis V, Suchockas V, Jankauskienė J, Labokas J. Genetic Diversity of Five Broadleaved Tree Species and Its Spatial Distribution in Self-Regenerating Stands. Forests. 2023; 14(2):281. https://doi.org/10.3390/f14020281
Chicago/Turabian StyleVerbylaitė, Rita, Alfas Pliūra, Vaidotas Lygis, Vytautas Suchockas, Jurga Jankauskienė, and Juozas Labokas. 2023. "Genetic Diversity of Five Broadleaved Tree Species and Its Spatial Distribution in Self-Regenerating Stands" Forests 14, no. 2: 281. https://doi.org/10.3390/f14020281