Article

Transcriptome Analysis Reveals the Central Role of the Transcription Factor MYB in Regulating Anthocyanin Accumulation in Economic Grape Species (Vitis vinifera)

1
Shandong Academy of Grape, Shandong Academy of Agricultural Sciences, Jinan 250100, China
2
The Key Laboratory for Silviculture and Conservation of Ministry of Education, Beijing Forestry University, Beijing 100083, China
3
Grape Industry Development & Promotion Center, Turpan 838000, China
4
Yantai Academy of Agricultural Sciences, Yantai 265500, China
5
College of Agriculture and Animal Husbandry, Qinghai University, Xining 810016, China
*
Author to whom correspondence should be addressed.
These authors contributed equally to the work.
Forests 2023, 14(2), 416; https://doi.org/10.3390/f14020416
Submission received: 13 December 2022 / Revised: 11 February 2023 / Accepted: 13 February 2023 / Published: 17 February 2023
(This article belongs to the Section Genetics and Molecular Biology)

Abstract

:
To cultivate different grape varieties according to market needs, it is necessary to study the regulation mechanism of color changes in different development stages of grapes. In this study, RNA-sequencing (RNA-Seq) technology was used to compare and analyze the transcriptome data of four grape varieties at the same development stage. Among the annotated differential genes, the anthocyanin synthesis pathway in the flavonoid pathway was mainly studied. Further RT-qPCR analysis of key enzyme genes, in the flavonoid synthesis pathway of the anthocyanin metabolism pathway, showed that the MYB transcription factor family had binding sites at the start of the four enzyme genes. The relative expression of the MYB transcription factor and enzyme gene in the transcriptome data was verified by reverse transcription polymerase chain reaction. Subcellular localization and gene function verification of the transcription factor MYB2 confirmed its regulatory role in anthocyanins.

1. Introduction

A grape is a perennial woody vine that needs a lot of light to grow. In the forest, grapes usually climb on tall trees to get light so as to grow and develop properly. With the discovery of their economic value, grapes were planted in large numbers in vineyards to meet people’s daily needs. Since then, the grape has developed into a globally important economic fruit plant. Grapes were one of the earliest fruit trees. As well-known economic fruits, they can be eaten directly or made into raisins or wine [1], and they play an important role in the food processing industry. Grapes contain metabolic components and have important medicinal values. The root and vine, used as medicine, can stop nausea and other symptoms; tartaric acid can be extracted from wine and used as an antioxidant added to food, making food acidic, while they can also be used as raw materials for beverage additives or pharmaceutical formulations [2]. Grapes have become an important part of China’s agricultural industrialization. Different grape varieties have different tastes and colors, such as rose-scented varieties with a fuchsia appearance [3]. Grapes have the advantages of easy cultivation and variety in terms of color, aroma, and taste, alongside other aspects, which promote the cultivation of new grape varieties, not only to meet market demand but also to develop rural industries in remote mountainous areas to help the poor.
Differences in the proportion and accumulation of various anthocyanins in the peel make the grape skin red, purple, or black [4]. Anthocyanins are water-soluble flavonoid compounds [5]. An accumulation of anthocyanins can produce more vivid colors in the plant tissue and remain for a longer period of time, which is of great ornamental value. Anthocyanins in plants play an important role in resisting biological or abiotic stress and attracting pollinating animals such as bees [6]. In addition, anthocyanins are powerful antioxidants and free radical scavengers, which are beneficial properties for human health [7,8]. Plant organs containing anthocyanins are edible and have nutritional value [9]. In addition, people are keen to discover new regulatory genes that make plants more ornamental and practical. Anthocyanins also perform various functions through the co-regulation of complexes, such as the basic helix–loop–helix (bHLH) regulation complex and MYB transcription factors (TFs), which produce more variable colors and increase the ornamental value of plants. MYB10 can regulate the color of pear skin by controlling anthocyanin synthesis [10]. Many special colors of flowers and other ornamental plants are due to bHLH or MYB gene sites or genetic mutations [11]. In general, the transcription factors involved in anthocyanin biosynthesis include MYB, bHLH, and WD-repeat protein (WDR), which mostly regulate downstream structural genes by forming MYB–bHLH–WD40 complexes and participate in the anthocyanin biosynthesis pathway [12]. Mutations such as nucleotide replacement, deletion, and insertion in the bHLH and MYB genes can also cause color changes in plant organs [5]. Besides anthocyanins, other flavonoid secondary metabolites also play important roles in plant growth and development. As an exogenous hormone applied to plants, hyperoside can significantly improve the germination rate of pollen, promote the growth of pollen tubes, and prolong the flowering period of plants. When flavonoid secondary metabolites were applied to apple skin, the synthetic genes associated with anthocyanins showed an upward trend, which can significantly increase the anthocyanin content [13,14]. The study of flavonoids is of great value with regard to plant resistance, disease resistance, etc.
In this study, we investigated important flavonoid secondary metabolites that affect grape color and screened important enzyme genes in the pathways of flavonoid synthesis, ANS, HCT, and CYP75A, which cause the production of different colors in grapes, and functionally verified the screened enzyme genes and transcription factors. VvMYB2 was identified by subcellular localization and its gene function was verified. The results of the study clarify the regulatory mechanism of flavonoid pathways through which grapes produce different colors and lay a foundation for the subsequent study of flavonoids, grape taste, and color, alongside providing a theoretical basis for improving grape varieties and color.

2. Materials and Methods

2.1. Plant Material and Experimental Treatment

The grapes involved in this study were planted at Zhonggong Experimental Base, Licheng District, Jinan City, Shandong Academy of Grape. The open-air cultivation mode was adopted in 2011, and the 8-year-old grape seedlings were tested and sampled in 2019. Drip irrigation was used. The test base is located in a continental monsoon climate, with an average annual temperature of 14.7 °C and average annual precipitation of 671.1 mm. The sample materials used in this study were all produced under the same management conditions. The study investigated four grape varieties: ‘Rose fragrance’, ‘Vineyard Queen’, ‘Princess rose’, and ‘Emerald rose’. Among them, ‘Princess rose’ and ‘Emerald rose’ have ‘Rose fragrance’ as the first-generation female parent and ‘Vineyard Queen’ as the second-generation male parent to produce second-generation offspring.
Using the four varieties as sample types, the color transition period was sampled for transcriptome sequencing. There were 3 biological replicates per sample, for a total of 12 samples.

2.2. Physiological Measurements

Regarding their physiological differences, different varieties of grapes have different colors, sizes, and aromas. Single plants and the four varieties of grapes were photographed with a camera D7000 (Nikon, Tokyo, Japan).

2.3. Determination of Total Anthocyanins

The method for determining the content of anthocyanins was slightly modified from [15]. Each sample, which had been stored in liquid nitrogen, was ground into powder, and 0.2 or 0.3 g was weighed and incubated in 1 mL of 1% (volume ratio) hydrochloric acid–methanol in the dark at room temperature for 24 h. Then, the sample was centrifuged at 13,400× g for 5 min, and the upper aqueous phase was quantified spectrophotometrically at 530, 620, and 650 nm using a microplate reader (Synergy H1, Bio-Tek, VT, USA). The relative anthocyanin content was determined by the following formula: OD = (A530−A620)−0.1·(A650−A620). The anthocyanin content of one unit is expressed as the change of 0.1 OD (unit × 103 g−1 FW).

2.4. RNA Extraction and Transcriptome Sequencing

TRIzol (Thermo Fisher Scientific Inc., Waltham, MA, USA) was used to extract RNA from 12 samples of 4 varieties of grapes. RNA was classified using Illumina NovaSeq 6000 platform (Illumina Inc., San Diego, CA, USA). A NanoDrop 8000 (Thermo Fisher Scientific, Waltham, MA, USA) spectrophotometer was used to evaluate the RNA quality. The clean data of all samples reached 5.96 Gb, and the percentage of Q30 bases was 91.81% or above. We performed transcriptome sequencing and bioinformatics analysis using BMKCloud (www.biocloud.net, accessed on 20 October 2021). Data from these analyses are also presented in the Supplementary Tables S1 and S2.

2.5. Analysis of Differential Expression, Transcriptome Alignment, and Functional Enrichment

In this experiment, we used the BMKCloud website (www.biocloud.net) for transcriptome data analysis. The basic deviation between the data was less than 20. We filtered out reads with an error rate greater than 0.1 and reads that contained more than 10% of ambiguous bases. We also filtered out reads less than 50 bp in length. The remaining high-quality reads were consistent with the Vitis vinifera genome (NCBI: taxon = 29,760). We drew a unique reading map for the next analysis and quantified the read abundance of each gene from the comparative readings using a feature counting program. The differentially expressed genes in seven grape samples of different varieties were compared through transcriptome data, to illustrate the problems related to color differences. We built a model to simplify the explanatory factors into a single column of intercepts and used the parameter method to estimate the dispersion of the model with the estimator function. Then, the DEGs were tested by accurate testing and estimated deviations. The software used was DESeq2_edgeR and the parameters for differential gene expression were as follows: FDR = 0.01, FC = 2, |log2 fold change| > 1, and q value < 0.05. Differentially expressed genes were designated as upregulated or downregulated based on whether their expression level was higher or lower than the untreated state. The FKPM value (average of three biological replicates) of all DEGs was used to draw heat maps and perform cluster analysis. Multiple changes in gene expression at different time points (log2 multiple changes) were used to draw the heat maps with Excel.
In order to classify genes into functional categories, BlastKOALA (https://www.kegg.jp/blastkoala/, accessed on 18 January 2022) was used to compare the protein sequences in the KEGG database for KEGG enrichment (Supplementary Table S3). All DEGs were involved in the KEGG concentration analysis. We used Fisher’s exact test for KEGG enrichment analysis based on the grape genome. KEGG pathways with p-value and enrichment factor lower than 0.05 were significantly enriched.

2.6. Analysis of Transcription Factor Binding Site in Promoter Region and Co-Expression Pattern Cluster

In order to study the transcription factor binding sites in the promoter regions of biosynthetic flavonoid enzyme genes, about 2000 base pairs upstream of the start codon of the genome were searched using DNA sequencing. We used Plant Care (http://bioinformatics.psb.ugent.be/webtools/plantcare/html/, accessed on 10 January 2022), NCBI (https://www.ncbi.nlm.nih.gov/, accessed on 10 January 2022), TB tools (https://github.com/CJ-Chen/TBtools, accessed on 15 January 2022), and other software to analyze the binding sites of the promoter regions. We used BMKCloud software (www.biocloud.net, accessed on 22 May 2022) to analyze the clustering mode of DEGs. We built a K-means tree for clustering and left space to automatically calculate the optimal value. By analyzing multiple variation patterns of mRNA expression abundance between different samples, mRNAs with the same expression trend were divided into a dataset and an expression pattern diagram of the dataset was drawn.

2.7. RNA Isolation and Real-Time Quantitative PCR (RT-qPCR) Validation

For fluorescence quantitative gene function verification, an RNA extraction kit was used to extract total RNA from samples. Then, a rapid quantitative RT Supermix Kit (SYBR Green, Tiangen Biotech Company, Beijing, China) was used to obtain reverse transcribed double-stranded cDNA. Quantitative RT-qPCR was used in the CFX Connect thermal cycler (Bio-Rad Laboratories, CA, USA) for three biologically repeated cDNAs of different species using a rapid polymerase chain reaction premix (SYBR Green, Tiangen Biotech Company, Beijing, China). The internal control was actin (LOC100266293). The primers for these genes are listed in Supplementary Table S4. The 2−△△CT method was used to analyze and calculate the relative expression of RT-qPCR genes. Each sample had at least three biological replicates.

2.8. Subcellular Localization of VvMYB2

The amplified CDS of VvMYB2 and green fluorescent protein (GFP) was inserted into the plasmid vector (pROKII) by homologous recombination. Subcellular localization of VvMYB2 was visualized using transiently expressed 35s:GFP and 35s:VvMYB2-GFP constructs expressed in tobacco leaf epidermal cells. The plasmid was transformed into Agrobacterium tumefaciens GV3101, and the two vectors were transiently co-expressed in tobacco epidermal cells. All fluorescence signals of the samples were detected using a confocal laser scanning microscope system (Leica SP8).

2.9. Instantaneous Transformation of Callus

After pruning, disinfection, and cleaning, sterile grape stem segments were obtained. Sterile grape stem segments were placed in a grape callus induction medium for induction. After several subcultures, the grape callus was obtained. Then, the grape callus was transferred to an embryogenic callus medium for culture, and a stable embryogenic callus was obtained by continuous subculture. Embryogenic callus of Vitis vinifera was taken for transient transfection. The VvMYB2 gene transferred to Agrobacterium GV3101 was overexpressed in the callus. Agrobacterium tumefaciens was absorbed in 200 μL of medium solution resistant to kanamycin and rifampicin in a freezer at −80 °C and cultured at a constant temperature of 28 °C for 20 h at 180 rpm (revolutions per minute). Centrifugation was performed at room temperature at 5500 rpm for 10 min, the supernatant was poured off, and the medium containing 2.22 g/L MS, 20 g/L sucrose, and 200 μmol/L acetosyringone was resuspended twice and incubated at 180 rpm for 2 h at 28 °C. Callus with similar growth status was cut to 5 mm and was infiltrated in the same suspension for vacuum osmosis for 20 min. After the infection was completed, it was inoculated on MS medium with acetosyringone for co-culture in the dark for 48 h.

2.10. Statistical Analysis

Data of physiological parameters were analyzed by one-way analysis of variance and Student’s t-test. The differences between ‘Rose fragrance’ as the control and ‘Vineyard Queen’, ‘Princess rose’, and ‘Emerald rose’ were significant (p < 0.05). The results were obtained by GraphPad software and expressed as the average standard deviation of three independent biological experiments.

3. Results

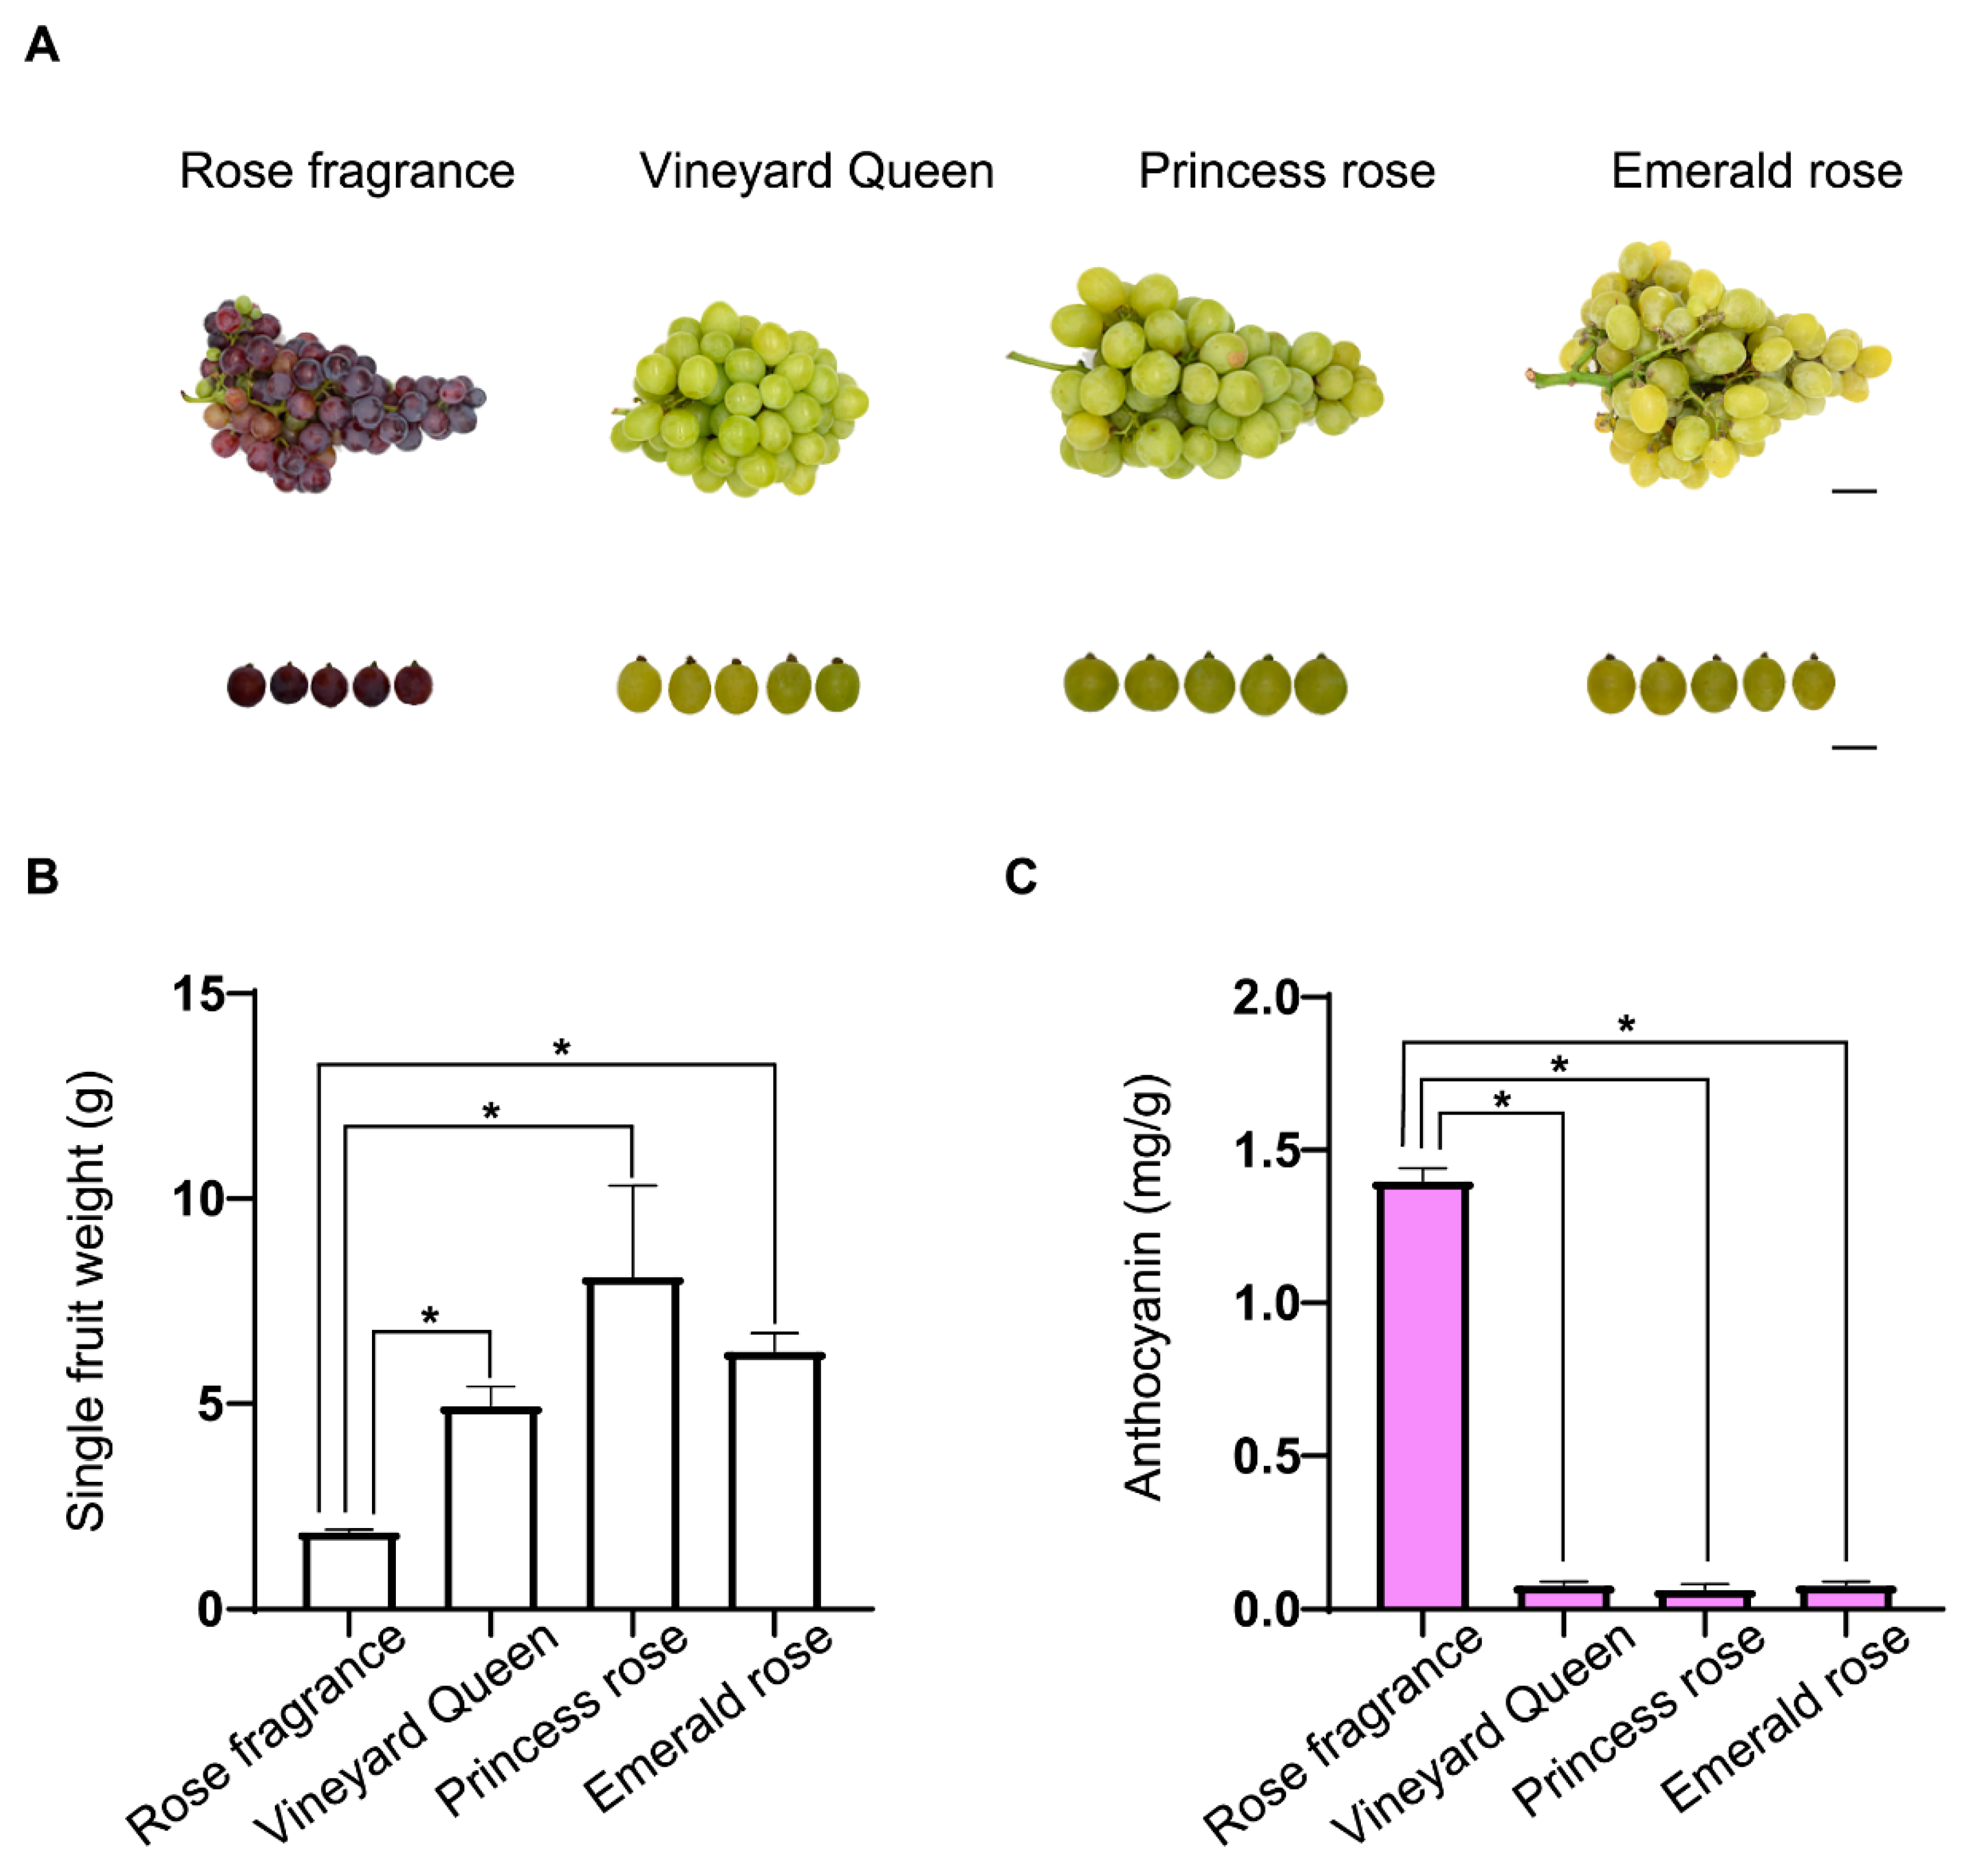
3.1. Physiological Indicator Analysis

Four varieties of grapes were investigated in this study: ‘Rose fragrance’, ‘Vineyard Queen’, ‘Princess rose’, and ‘Emerald rose’ (Figure 1A). The analysis of four grape varieties showed that the peel of ‘Rose fragrance’ is red, and those of ‘Vineyard Queen’, ‘Princess rose’, and ‘Emerald rose’ are green (Figure 1A). We determined the average fruit weight of all varieties of grapes harvested and found that the single fruit weight of ‘Princess rose’ was the largest, followed by ‘Emerald rose’, whereas ‘Vineyard Queen’ and ‘Rose fragrance’ had the smallest fruit weight (Figure 1B). In order to determine why the peels of different varieties produce different colors, we also measured the anthocyanin content of the ripe grapes and found that the darker the skin, the higher the anthocyanin content. Compared with the other three varieties, ‘Rose fragrance’ had the highest anthocyanin content. In addition, there were significant differences in anthocyanin content between ‘Vineyard Queen‘, ‘Princess rose’, and ‘Emerald rose’ (Figure 1C).

3.2. Global Transcriptome Analysis and Functional Classification

Each variety has three development periods, the fruit swelling period, the transition period, and the maturity period. The color transition period was sampled for transcriptome sequencing. There were 3 biological replicates per sample, for a total of 12 samples.
To clarify how anthocyanins affect color changes, transcriptome sequencing was performed on the four varieties of grapes in different periods. Low-quality reads and unfamiliar nucleotides were filtered out. The clean average reads, which were produced by each experimental line, were analyzed. The number of clear reads obtained from the cDNA library of each sample proved the abundance of genes. The high-quality reads in the database amounted to at least 95%, and the correct rate of sample sequencing was relatively high. Integrated analysis of transcriptomic data showed that it was true and reliable and could be used as preliminary data to ensure the smooth progress of the research.
Transcriptome analysis showed that 10,548 DEGs were generated between ‘Rose fragrance’ and ‘Vineyard Queen’; 10,548 differential genes between ‘Rose fragrance’ and ‘Princess rose’; and 9625 differential genes between ‘Rose fragrance’ and ‘Emerald rose’. There were 1591 DEGs for ‘Rose fragrance’ vs. ‘Vineyard Queen’ and ‘Rose fragrance’ vs. ‘Princess rose’; 1665 genes between ‘Rose fragrance’ vs. ‘Princess rose’ and ‘Rose fragrance’ vs. ‘Emerald rose’; and 797 DEGs for the comparison between all three (Figure 2A). In this study, log2 processing was performed on the fold change (FC) and FPKM of differentially expressed genes, and scatter plots were drawn, with red representing upregulated genes and green representing downregulated genes. The three plots represent the comparison results between Rose fragrance and the other three grape varieties. The x-coordinate represents the value range of FPKM after the log2 treatment, and the y-coordinate represents the value range of fold change (FC) after the log2 treatment. It can be seen from the figure that there are more downregulated genes in the three results, indicating that the lightening of grape color is related to the downregulated genes (Figure 2B). To understand the specific function of these genes in the biological process, cellular component, and molecular function categories, we also conducted a GO (Gene Ontology) enrichment analysis of all differential genes (Figure 2C). We can see that the DEGs are mainly concentrated in biological processes, cellular, process behavior, cell, cellular component, binding, protein tags, etc. To determine the direction of our next study, we mapped out the statistics of pathway enrichment (Figure 2D), based on existing genes. By analyzing the KEGG enrichment of DEGs, it can be seen that color change is related to flavonoids; thus, if we want to study color changes, we should focus on the flavonoid and anthocyanidin biosynthesis pathways.

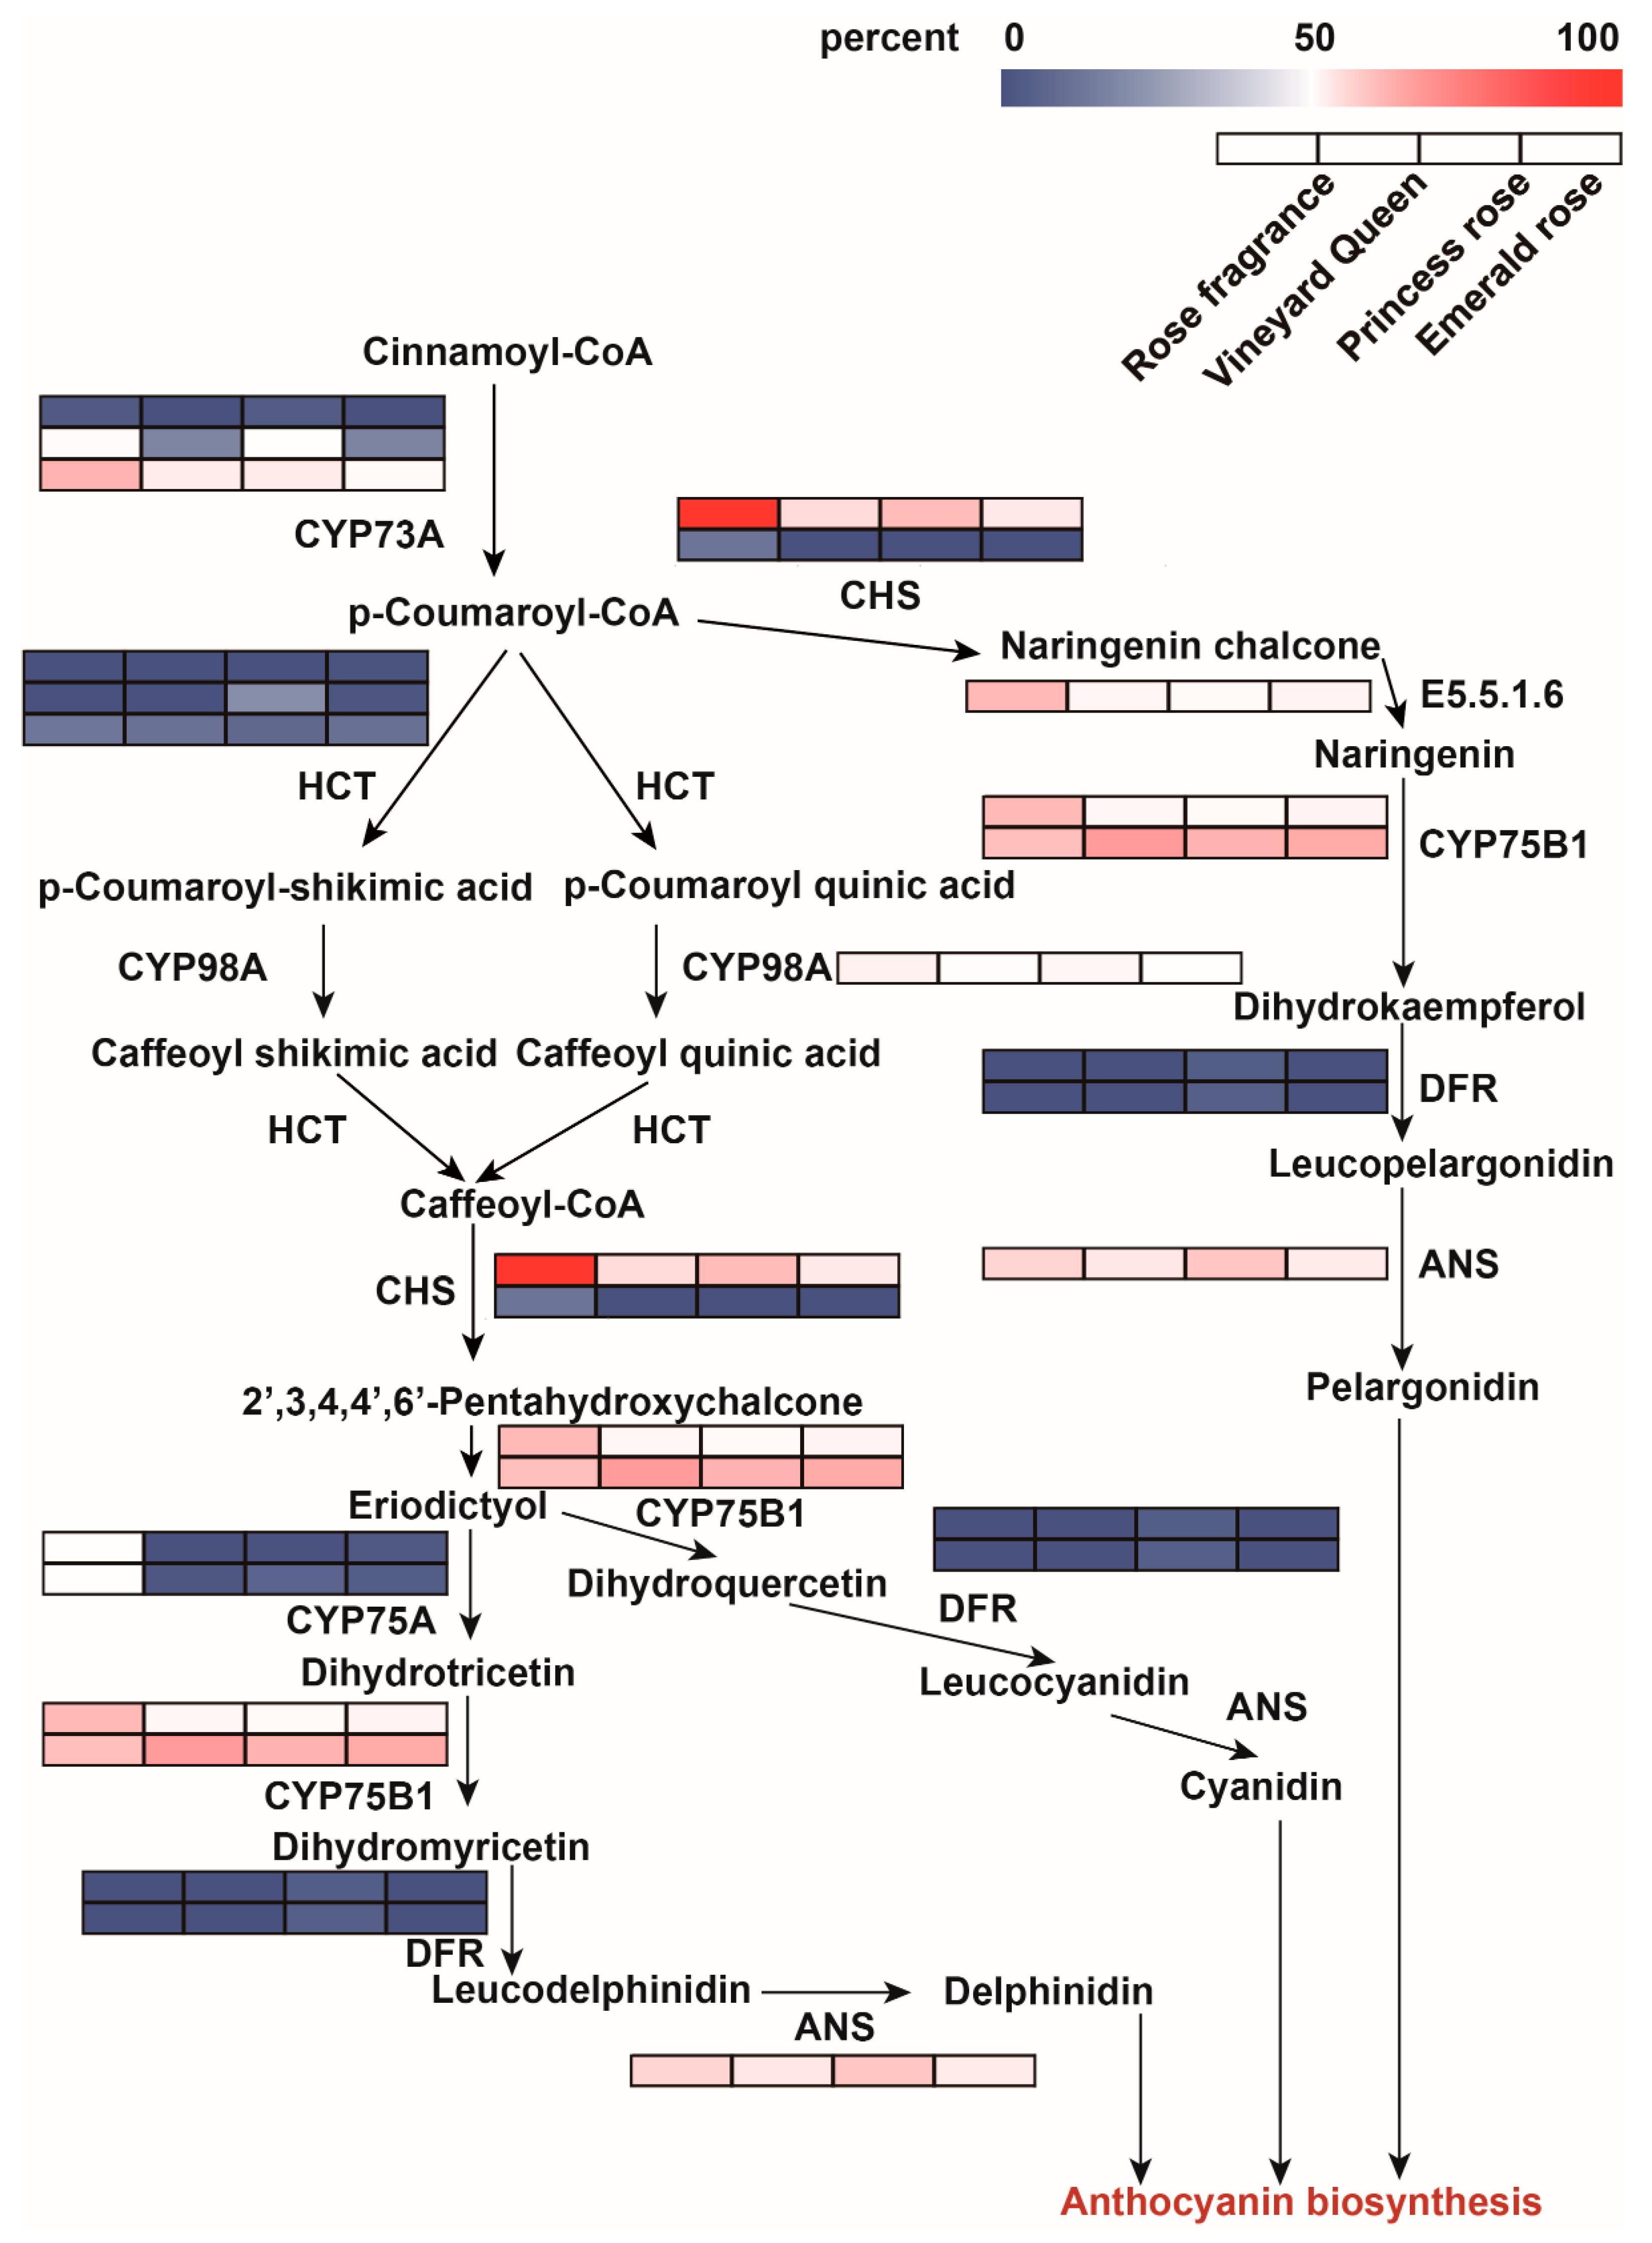
3.3. Screening of Enzyme Genes in Flavonoid Biosynthesis Pathway

We then analyzed the expression changes of the genes in different varieties associated with flavonoid synthesis pathways (Figure 3). It can be seen from Figure 3 that anthocyanin synthesis mostly relies on the phenylpropane pathway of the flavonoid synthesis pathway, in which VvCYP75A (VIT_06s0009g02830), VvHCT (VIT_01s0010g02320), VvANS (VIT_02s0025g04720), VvCYP75B1 (F3H) (VIT_17s0000g07200), and other genes showed a trend of gradual decline in expression. Considering that anthocyanin synthesis-related genes can be directly regulated to the anthocyanin synthesis pathway, we chose to focus on VvCYP75A (VIT_06s0009g02830), VvHCT (VIT_01s0010g02320), VvANS (VIT_02s0025g04720), VvCYP75B1 (F3H) (VIT_17s0000g07200) for further study.

3.4. Screening of Transcription Factors in Flavonoid Biosynthesis Pathway

To study the mechanism of anthocyanin biosynthesis, we mainly analyzed differential transcription factors. Among all differentially expressed transcription factors, MYB family transcription factors have the largest number (Figure 4A), which is speculated to be related to differences in grape peel color. Using PlantPAN v3.0 (http://plantpan.itps.ncku.edu.tw/, accessed on 10 January 2022) and Plant Care (http://bioinformatics.psb.ugent.be/webtools/plantcare/html/, accessed on 10 January 2022), we analyzed the promoter regions of the enzyme genes VvANS, VvHCT, VvCYP75B1, and VvCYP75A (Figure 4B). This analysis showed that the largest number of these enzyme genes also contained MYB binding sites, followed by MYC. Transcription factors that may be regulated by four enzyme genes were found in all transcription factors. Then, we analyzed the differences in the number of promoter binding sites of the four enzyme genes and several transcription factors of the different grape varieties by heat maps. The darker the color on the heat map, the more binding sites in the promoter region of the species (Figure 4C). In summary, all enzyme genes and most transcription factors had more binding sites in the ‘Rose fragrance’ variety.

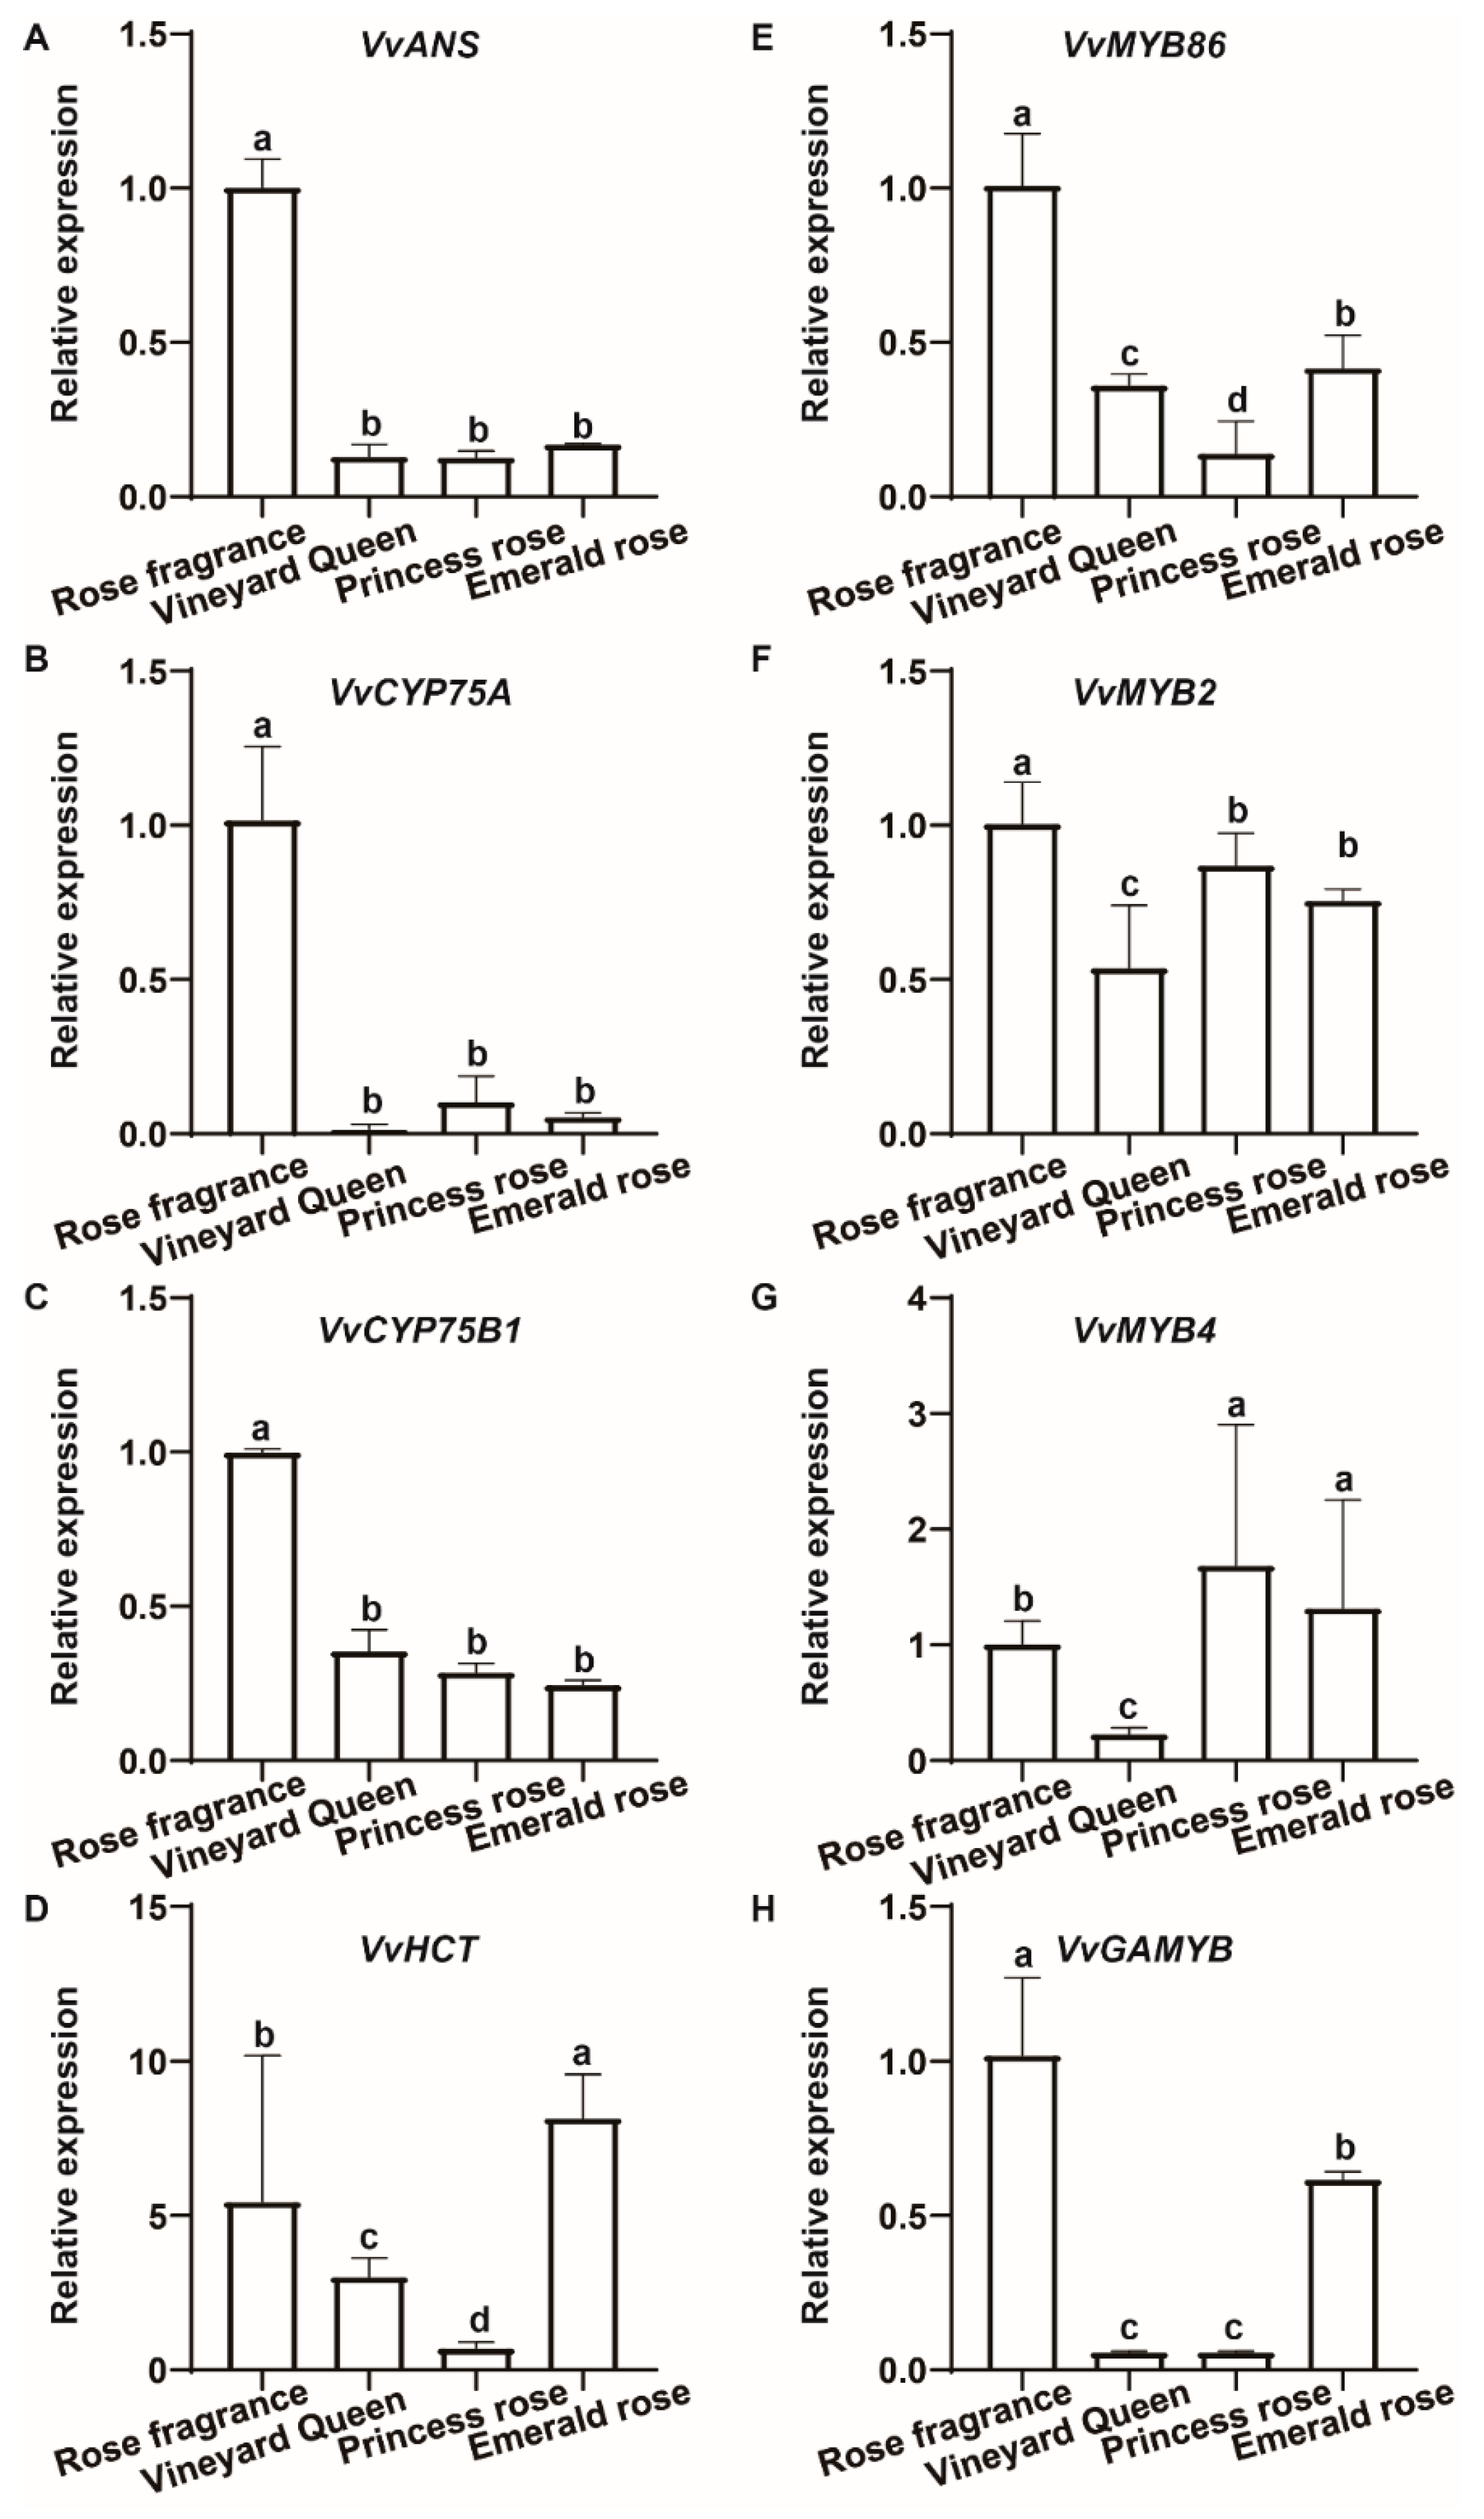
3.5. Verification of DEGs by RT-qPCR

To verify the reliability of the above prediction, we calculated the relative expression of MYB transcription factor and enzyme gene in the transcriptome data by reverse transcription polymerase chain reaction (Figure 5). It was found that the expression trend of most genes in the transcriptome was consistent with the transcriptome data. The results showed that the relative expression levels of VvCYP75B1 (VIT_17s0000g07200), VvCYP75A (VIT_06s0009g02830), VvANS (VIT_02s0025g04720), VvMYB86 (VIT_07s0005g02480), VvMYB2 (VIT_06s0080g00790), and VvGAMYB (VIT_06s0009g02480), in grape varieties with different colors at the maturity stage, were consistent with the transcriptome data.

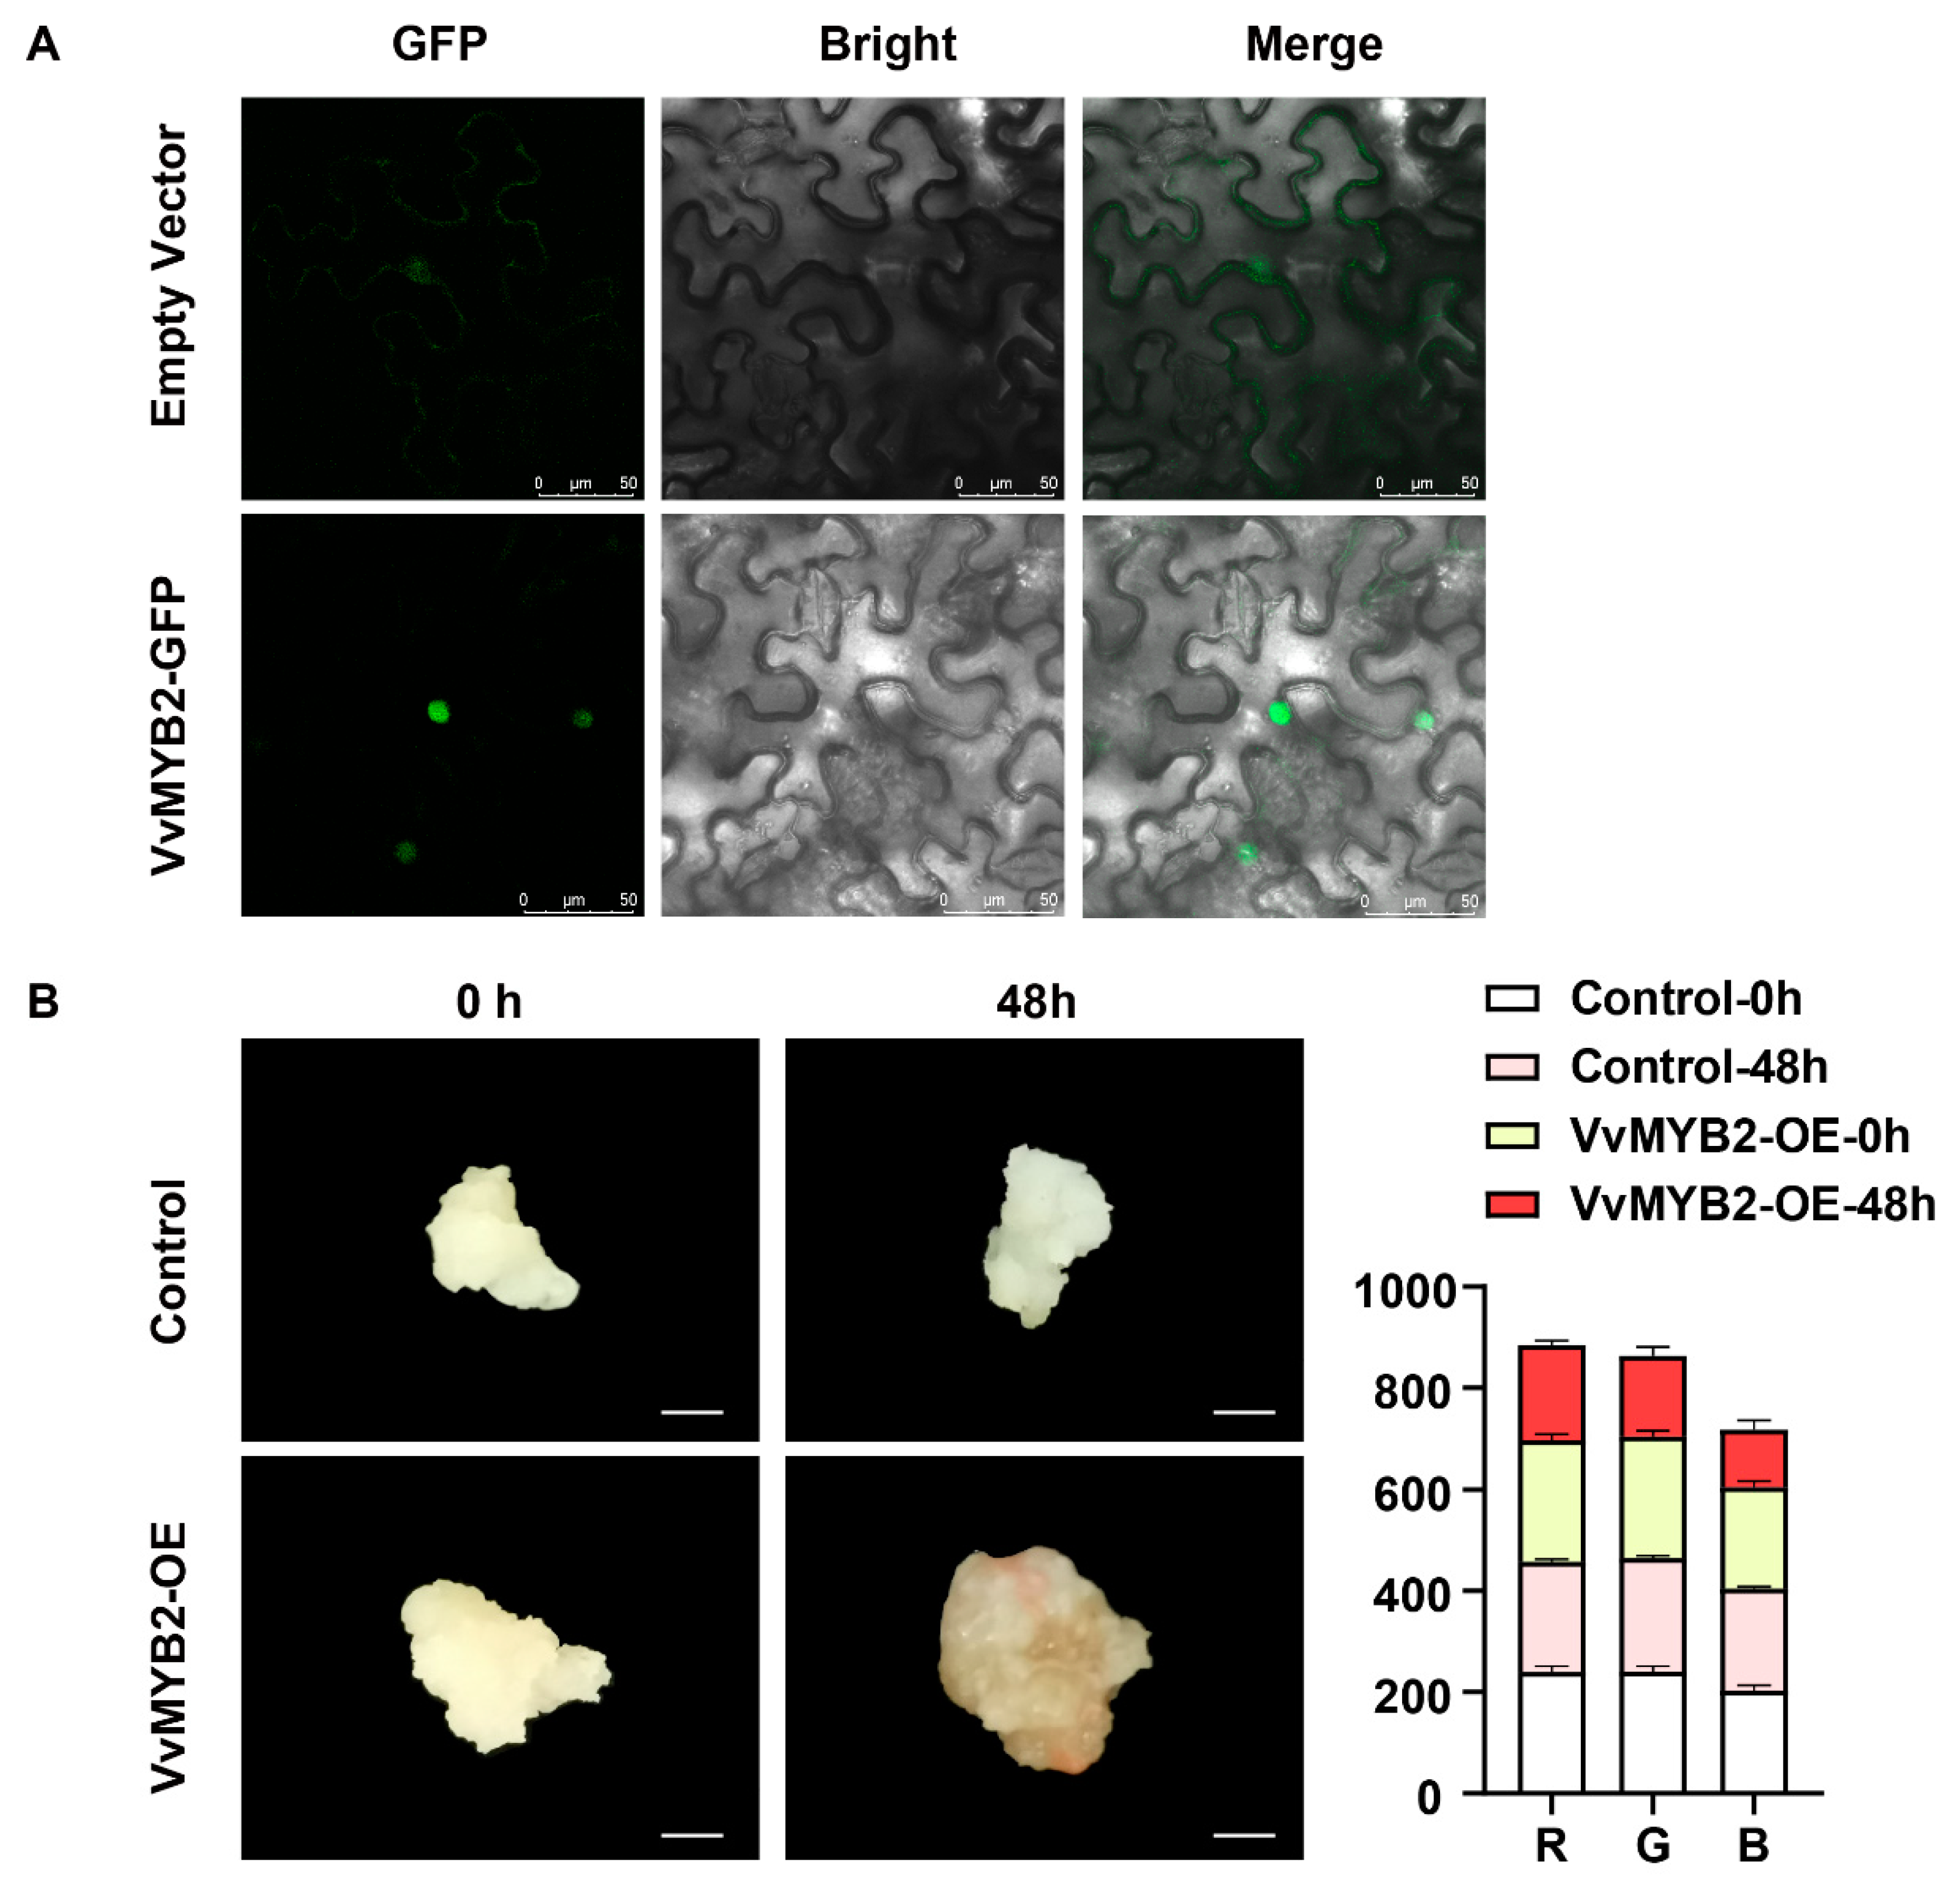
3.6. Subcellular Localization and Callus Transient Transformation Analysis of VvMYB2 Function

In order to verify the gene function, we randomly selected the VvMYB2 gene in Nicotiana benthamiana for subcellular localization (Figure 6A) and found that its expression was mainly reflected in the nucleus. According to the transient transformation of the grape callus (Figure 6B), only the VvMYB2-OE callus after 48 h of treatment clearly showed a decreased RGB value, and the visual effect was that the callus started to turn red. VvMYB2 can promote the accumulation of grape anthocyanin.

4. Discussion

As an important economic fruit, grapes are rich in nutrients. A water-soluble flavonoid, anthocyanin, is widely present in the cell sap of the flowers, fruits, stems, leaves, and root organs of plants, making them appear red, purplish red to blue, and other colors [16,17]. In this study, we discovered the genes, VvANS, VvHCT, VvCYP75A, and VvCYP75B1 alongside the transcription factors, VvMYB2, VvMYB4, VvMYB86, and VvGAMYB. The four enzyme genes are structural genes in the flavonoid pathway and are related to anthocyanin production. The four transcription factors were obtained based on an analysis of the promoter sequence of enzyme genes and transcriptome data; they are also related to anthocyanin synthesis and are located at the front of the regulatory pathway. Genetic changes related to anthocyanin synthesis are located in the flavonoid synthesis pathway [18]. Studies have shown that the transcription levels of genes encoding key enzymes for flavonoid synthesis and anthocyanin synthesis show a higher trend in dark grape varieties [19]. ANS has been proven to be related to anthocyanin content in many studies. The expression level of ANS affects the anthocyanin content in rice [20], pomegranate [21], and Brassica rapa [22]. CYP75A and CYP75B1 belong to the flavonoid 3’-hydroxylases and are also related to the synthesis of flavonoids in multiple species [23]. Similarly, MYB transcription factors usually co-exist with the anthocyanin synthesis-related reactions, mentioned in the Introduction, in economic fruit trees and crops, such as apples and potatoes [24,25]. Therefore, an in-depth study of the above genes is of great value.
Previous research has shown that anthocyanins can deepen the color of fruits and plants. In grape skins, generally, the higher the anthocyanin content, the darker the color. Increased anthocyanin content can obviously promote the deepening of the petal color [26], and our research has also confirmed this. However, studies have shown that there are many different classifications of anthocyanins [27]. There are more than 20 kinds of anthocyanins, and there are six important ones in food: pelargonidin, cyanidin, delphinidin, peonidin, petunidin, and malvidin [28,29]. Currently, we are measuring only the content of total anthocyanins. Different types of anthocyanins and how they affect the coloring of fruits or plants remain to be studied. Different grape varieties contain different anthocyanin content, and their internal gene expression levels are also different [30]. The binding sites of the selected enzyme genes are transcription factor families, such as MYB, MYC, and ARE. Grape varieties with different colors can have significant upregulation of genes in transcription factor families such as MYB. These transcription factors can regulate the expression of enzyme genes by combining with the flavonoid pathway [31].
To ascertain the changes of flavonoid secondary metabolites in different varieties of grapes, the content of flavonoids was determined. The content of anthocyanins was found to be much higher in red grapes than in green grapes. For example, the anthocyanin content of the red variety ‘Rose fragrance’ was 14 times higher than that of the green varieties ‘Vineyard Queen’, ‘Princess rose’, and ‘Emerald rose’. The anthocyanin content determines the color of grape berries to a certain extent. The synthesis of anthocyanins is inseparable from the combination of MYB family transcription factors, with genes such as VvHCT, VvCYP75B1, VvCYP75A, and VvANS (Figure 7). As a preliminary judgment, MYB family transcription factors MYB2, GAMYB, and MYB86 affect anthocyanin synthesis by interacting with VvCYP75B1, VvCYP75A, and VvANS. The effect may be the formation of compounds or the direct regulation between transcription factors and enzyme genes. In order to gain further information on the mechanism of regulating grape color, this needs to be studied further. This study shows that MYB may regulate the expression of VvHCT, VvCYP75B1, VvCYP75A, and VvANS, thereby promoting the increase in anthocyanin content. We will also conduct further verification studies using methods such as ChIP and other experiments in the future.
Previous studies have shown that the MYB transcription factors can affect the flavonoid pathway, thereby affecting plant resistance [32], color changes [33], growth and development, phenotype changes [34], etc. Overall, our research reveals that genes and MYB transcription factors increase anthocyanin content by regulating genes related to flavonoid synthesis, thereby darkening the color of fruits or plants, and proposing the secondary metabolites of flavonoids, genes, and plant color. Follow-up studies on the potential regulatory relationships and molecular mechanisms between the two will be based on the effects of specific compounds in anthocyanins on plant color and will include a more in-depth and comprehensive explanation of color synthesis-related genes.
The results indicate that the upregulation of flavonoid synthesis-related genes leads to the accumulation of flavonoids, and the upregulation of anthocyanin synthesis-related genes can promote the accumulation of anthocyanins. There is a notable relationship between flavonoids and anthocyanins [35]. When controlling the upregulation of genes related to anthocyanin synthesis, sometimes the phenomenon that affects other flavonoid synthesis-related genes is upregulated [36,37]. In addition, increased flavonoids also have the effect of improving the drought resistance of plants [38,39] and promoting early flowering and the growth of pollen tubes. Our previous research also found that secondary metabolites in the flavonoid pathway, such as hyperoside, can prolong the blooming period to a certain extent [40]. The relationship between flavonoid secondary metabolites and related genes needs further research, while the complex molecular mechanism remains to be explored and verified.

5. Conclusions

In summary, anthocyanins can deepen the color of fruits and plants. Different grape varieties contain different anthocyanin contents, and their internal gene expression levels are also different. Grape varieties with different colors can have significant upregulation of MYB transcription factors. These transcription factors can regulate the expression of enzyme genes by combining with the flavonoid pathway. MYB can promote anthocyanin content by interacting with VvHCT, VvCYP75B1, VvCYP75A, and VvANS genes. This can be carried out by forming complexes or directly regulating these enzyme genes, which also affects the increase in related metabolites, and can, in turn, affect the color of plants or fruits and participate in other plant growth processes. Overall, our research reveals the relationship between the MYB transcription factor family and VvHCT, VvCYP75B1, VvCYP75A, and VvANS. Moreover, it ascertains the mechanism through which plants can increase anthocyanin content, by regulating genes related to flavonoid synthesis, thereby deepening the color of fruits or plants, and proposes the potential regulatory relationship and molecular mechanism between flavonoid secondary metabolites, genes, and plant color.

Supplementary Materials

The following supporting information can be downloaded at: https://www.mdpi.com/article/10.3390/f14020416/s1, Table S1. MA plot; Table S2. GO (Gene Ontology) classes; Table S3. KEGG enrichment; Table S4. qPCR primer sequence.

Author Contributions

Conceptualization, L.S., M.Q., L.G., D.M. and Q.Y.; Data curation, L.S., M.Q., L.G., D.M. and Q.Y.; Formal analysis, L.S., M.Q., L.G., D.M., Y.W., F.R., L.Y., Y.C. and M.T.; Funding acquisition, L.G.; Investigation, L.G.; Resources, D.M. and Q.Y.; Writing—original draft, L.S. and M.Q.; Writing—review & editing, L.L., Y.S., L.G. and D.M., Y.W., F.R., L.Y., Y.C. and M.T. All authors have read and agreed to the published version of the manuscript.

Funding

This work was supported by the Key R&D Project of Shandong Province (2017CXGC0210), the China Agriculture Research System (CARS-29), the Agricultural Scientific and Technological Innovation Project of Shandong Academy of Agricultural Sciences (CXGC2021A48, CXGC2016D01), the Major Agricultural Application Technology Innovation Project of Shandong Province (2017), and the second batch of regional collaborative innovation projects in Xinjiang Uygur Autonomous Region in 2022, Shanghai Cooperation Organization Science and Technology Partnership Plan and National Science and Technology Cooperation Project No. 2022E01066.

Data Availability Statement

RNA-seq data for this article can be found online at https://submit.ncbi.nlm.nih.gov/subs/ (accessed on 1 February 2023). PRJNA929589: Vitis vinifera Transcriptome (TaxID: 29760).

Conflicts of Interest

The authors declare no conflict of interest.

References

  1. Girard, B.; Yuksel, D.; Cliff, M.; Delaquis, P.; Reynolds, A. Vinification effects on the sensory, colour and GC profiles of Pinot noir wines from British Columbia. Food Res. Int. 2001, 34, 483–499. [Google Scholar] [CrossRef]
  2. Shaw, P.E.; Wilson III, C.W. Importance of nootkatone to the aroma of grapefruit oil and the flavor of grapefruit juice. J. Agric. Food Chem. 1981, 29, 677–679. [Google Scholar] [CrossRef]
  3. Slegers, A.; Angers, P.; Ouellet, É.; Truchon, T.; Pedneault, K. Volatile compounds from grape skin, juice and wine from five interspecific hybrid grape cultivars grown in Québec (Canada) for wine production. Molecules 2015, 20, 10980–11016. [Google Scholar] [CrossRef] [PubMed] [Green Version]
  4. Fredes, C.; Montenegro, G.; Zoffoli, J.P.; Gómez, M.; Robert, P. Polyphenol content and antioxidant activity of maqui (Aristotelia chilensis Molina Stuntz) during fruit development and maturation in Central Chile. Chil. J. Agric. Res. 2012, 72, 582–589. [Google Scholar] [CrossRef] [Green Version]
  5. Outchkourov, N.S.; Carollo, C.A.; Gomez-Roldan, V.; de Vos, R.C.; Bosch, D.; Hall, R.D.; Beekwilder, J. Control of anthocyanin and non-flavonoid compounds by anthocyanin-regulating MYB and bHLH transcription factors in Nicotiana benthamiana leaves. Front. Plant Sci. 2014, 5, 519. [Google Scholar] [CrossRef] [PubMed] [Green Version]
  6. Naing, A.H.; Kim, C.K. Abiotic stress-induced anthocyanins in plants: Their role in tolerance to abiotic stresses. Physiol. Plant. 2021, 172, 1711–1723. [Google Scholar] [CrossRef]
  7. Giampieri, F.; Tulipani, S.; Alvarez-Suarez, J.M.; Quiles, J.L.; Mezzetti, B.; Battino, M. The strawberry: Composition, nutritional quality, and impact on human health. Nutrition 2012, 28, 9–19. [Google Scholar] [CrossRef]
  8. Simona, O. A review of the current knowledge of thermal stability of anthocyanins and approaches to their stabilization to heat. Antioxidants 2021, 10, 1337. [Google Scholar]
  9. Pantelidis, G.E.; Vasilakakis, M.; Manganaris, G.A.; Diamantidis, G. Antioxidant capacity, phenol, anthocyanin and ascorbic acid contents in raspberries, blackberries, red currants, gooseberries and Cornelian cherries. Food Chem. 2007, 102, 777–783. [Google Scholar] [CrossRef]
  10. Quattrocchio, F.; Wing, J.F.; van der Woude, K.; Mol, J.; Koes, R. Analysis of bHLH and MYB domain proteins: Species-specific regulatory differences are caused by divergent evolution of target anthocyanin genes. Plant J. Cell Mol. Biol. 1998, 13, 475–488. [Google Scholar] [CrossRef]
  11. Wang, Z.; Meng, D.; Wang, A.; Li, T.; Jiang, S.; Cong, P.; Li, T. The methylation of the PcMYB10 promoter is associated with green-skinned sport in Max Red Bartlett pear. Plant Physiol. 2013, 162, 885–896. [Google Scholar] [CrossRef] [Green Version]
  12. Matsui, K.; Umemura, Y.; Ohme-Takagi, M. AtMYBL2, a protein with a single MYB domain, acts as a negative regulator of anthocyanin biosynthesis in Arabidopsis. Plant J. 2008, 55, 954–967. [Google Scholar] [CrossRef]
  13. Abrahams, S.; Lee, E.; Walker, A.R.; Tanner, G.J.; Larkin, P.J.; Ashton, A.R. The Arabidopsis TDS4 gene encodes leucoanthocyanidin dioxygenase (LDOX) and is essential for proanthocyanidin synthesis and vacuole development. Plant J. 2003, 35, 624–636. [Google Scholar] [CrossRef] [PubMed]
  14. Yang, Q.; Song, Z.; Dong, B.; Niu, L.; Cao, H.; Li, H.; Du, T.; Liu, T.; Yang, W.; Meng, D. Hyperoside regulates its own biosynthesis via MYB30 in promoting reproductive development and seed set in okra. Plant Physiol. 2021, 185, 951–968. [Google Scholar] [CrossRef] [PubMed]
  15. XIE, X.B.; Li, S.; ZHANG, R.F.; Zhao, J.; CHEN, Y.C.; Zhao, Q.; YAO, Y.X.; YOU, C.X.; ZHANG, X.S.; HAO, Y.J. The bHLH transcription factor MdbHLH3 promotes anthocyanin accumulation and fruit colouration in response to low temperature in apples. Plant Cell Environ. 2012, 35, 1884–1897. [Google Scholar] [CrossRef] [PubMed]
  16. Keller, M.; Hrazdina, G. Interaction of nitrogen availability during bloom and light intensity during veraison. II. Effects on anthocyanin and phenolic development during grape ripening. Am. J. Enol. Vitic. 1998, 49, 341–349. [Google Scholar] [CrossRef]
  17. Shepard, J.F. The regeneration of potato plants from leaf-cell protoplasts. Sci. Am. 1982, 246, 154–169. [Google Scholar] [CrossRef]
  18. Polashock, J.; Zelzion, E.; Fajardo, D.; Zalapa, J.; Georgi, L.; Bhattacharya, D.; Vorsa, N. The American cranberry: First insights into the whole genome of a species adapted to bog habitat. BMC Plant Biol. 2014, 14, 165. [Google Scholar] [CrossRef] [Green Version]
  19. Cacho, J.; Fernández, P.; Ferreira, V.; Castells, J.E. Evolution of five anthocyanidin-3-glucosides in the skin of the Tempranillo, Moristel, and Garnacha grape varieties and influence of climatological variables. Am. J. Enol. Vitic. 1992, 43, 244–248. [Google Scholar] [CrossRef]
  20. Kim, B.G.; Kim, J.H.; Min, S.Y.; Shin, K.-H.; Kim, J.H.; Kim, H.Y.; Ryu, S.N. Anthocyanin content in rice is related to expression levels of anthocyanin biosynthetic genes. J. Plant Biol. 2007, 50, 156–160. [Google Scholar] [CrossRef]
  21. Ben-Simhon, Z.; Judeinstein, S.; Trainin, T.; Harel-Beja, R.; Bar-Ya’akov, I.; Borochov-Neori, H.; Holland, D. A “White” anthocyanin-less pomegranate (Punica granatum L.) caused by an insertion in the coding region of the leucoanthocyanidin dioxygenase (LDOX.; ANS) gene. PLoS ONE 2015, 10, e0142777. [Google Scholar] [CrossRef] [PubMed]
  22. Ahmed, N.U.; Park, J.-I.; Jung, H.-J.; Hur, Y.; Nou, I.-S. Anthocyanin biosynthesis for cold and freezing stress tolerance and desirable color in Brassica rapa. Funct. Integr. Genom. 2015, 15, 383–394. [Google Scholar] [CrossRef] [PubMed]
  23. Castellarin, S.D.; Di Gaspero, G.; Marconi, R.; Nonis, A.; Peterlunger, E.; Paillard, S.; Adam-Blondon, A.-F.; Testolin, R. Colour variation in red grapevines (Vitis vinifera L.): Genomic organisation, expression of flavonoid 3’-hydroxylase, flavonoid 3’, 5’-hydroxylase genes and related metabolite profiling of red cyanidin-/blue delphinidin-based anthocyanins in berry skin. BMC Genom. 2006, 7, 12. [Google Scholar] [CrossRef] [PubMed]
  24. Liu, Y.; Lin-Wang, K.; Espley, R.V.; Wang, L.; Yang, H.; Yu, B.; Dare, A.; Varkonyi-Gasic, E.; Wang, J.; Zhang, J. Functional diversification of the potato R2R3 MYB anthocyanin activators AN1, MYBA1, and MYB113 and their interaction with basic helix-loop-helix cofactors. J. Exp. Bot. 2016, 67, 2159–2176. [Google Scholar] [CrossRef] [PubMed]
  25. Takos, A.M.; Jaffé, F.W.; Jacob, S.R.; Bogs, J.; Robinson, S.P.; Walker, A.R. Light-induced expression of a MYB gene regulates anthocyanin biosynthesis in red apples. Plant Physiol. 2006, 142, 1216–1232. [Google Scholar] [CrossRef] [PubMed] [Green Version]
  26. He, Y.; Ma, L.; Sang, Z. Preliminary study on formation of flower color in Magnolia wufengensis. Acta Bot. Boreali-Occident. Sin. 2010, 30, 2252–2257. [Google Scholar]
  27. Fournand, D.; Vicens, A.; Sidhoum, L.; Souquet, J.-M.; Moutounet, M.; Cheynier, V. Accumulation and extractability of grape skin tannins and anthocyanins at different advanced physiological stages. J. Agric. Food Chem. 2006, 54, 7331–7338. [Google Scholar] [CrossRef]
  28. Kong, J.-M.; Chia, L.-S.; Goh, N.-K.; Chia, T.-F.; Brouillard, R. Analysis and biological activities of anthocyanins. Phytochemistry 2003, 64, 923–933. [Google Scholar] [CrossRef]
  29. Escribano-Bailón, M.T.; Santos-Buelga, C.; Rivas-Gonzalo, J.C. Anthocyanins in cereals. J. Chromatogr. A 2004, 1054, 129–141. [Google Scholar] [CrossRef]
  30. Vatai, T.; Škerget, M.; Knez, Ž. Extraction of phenolic compounds from elder berry and different grape marc varieties using organic solvents and/or supercritical carbon dioxide. J. Food Eng. 2009, 90, 246–254. [Google Scholar] [CrossRef]
  31. Ravaglia, D.; Espley, R.V.; Henry-Kirk, R.A.; Andreotti, C.; Ziosi, V.; Hellens, R.P.; Costa, G.; Allan, A.C. Transcriptional regulation of flavonoid biosynthesis in nectarine (Prunus persica) by a set of R2R3 MYB transcription factors. BMC Plant Biol. 2013, 13, 68. [Google Scholar] [CrossRef] [PubMed] [Green Version]
  32. Liu, X.; Yang, L.; Zhou, X.; Zhou, M.; Lu, Y.; Ma, L.; Ma, H.; Zhang, Z. Transgenic wheat expressing Thinopyrum intermedium MYB transcription factor TiMYB2R-1 shows enhanced resistance to the take-all disease. J. Exp. Bot. 2013, 64, 2243–2253. [Google Scholar] [CrossRef] [PubMed] [Green Version]
  33. Himi, E.; Maekawa, M.; Noda, K. Differential expression of three flavanone 3-hydroxylase genes in grains and coleoptiles of wheat. Int. J. Plant Genom. 2011, 2011, 369460. [Google Scholar] [CrossRef] [Green Version]
  34. Hichri, I.; Barrieu, F.; Bogs, J.; Kappel, C.; Delrot, S.; Lauvergeat, V. Recent advances in the transcriptional regulation of the flavonoid biosynthetic pathway. J. Exp. Bot. 2011, 62, 2465–2483. [Google Scholar] [CrossRef] [PubMed] [Green Version]
  35. Williams, C.A.; Grayer, R.J. Anthocyanins and other flavonoids. Nat. Prod. Rep. 2004, 21, 539–573. [Google Scholar] [CrossRef] [PubMed]
  36. Nguyen, K.H.; Van Ha, C.; Nishiyama, R.; Watanabe, Y.; Leyva-González, M.A.; Fujita, Y.; Tran, U.T.; Li, W.; Tanaka, M.; Seki, M. Arabidopsis type B cytokinin response regulators ARR1, ARR10, and ARR12 negatively regulate plant responses to drought. Proc. Natl. Acad. Sci. USA 2016, 113, 3090–3095. [Google Scholar] [CrossRef] [Green Version]
  37. Castellarin, S.D.; Matthews, M.A.; Di Gaspero, G.; Gambetta, G.A. Water deficits accelerate ripening and induce changes in gene expression regulating flavonoid biosynthesis in grape berries. Planta 2007, 227, 101–112. [Google Scholar] [CrossRef]
  38. Song, Z.; Dong, B.; Yang, Q.; Niu, L.; Li, H.; Cao, H.; Amin, R.; Meng, D.; Yujie, F. Screening of CBL genes in pigeon pea with focus on the functional analysis of CBL4 in abiotic stress tolerance and flavonoid biosynthesis. Environ. Exp. Bot. 2020, 177, 104102. [Google Scholar] [CrossRef]
  39. Yang, W.; Li, N.; Fan, Y.; Dong, B.; Song, Z.; Cao, H.; Du, T.; Liu, T.; Qi, M.; Niu, L. Transcriptome analysis reveals abscisic acid enhancing drought resistance by regulating genes related to flavonoid metabolism in pigeon pea. Environ. Exp. Bot. 2021, 191, 104627. [Google Scholar] [CrossRef]
  40. Yang, Q.; Dong, B.; Wang, L.; Song, Z.; Niu, L.; Li, H.; Cao, H.; Meng, D.; Fu, Y. AeCDPK6 phosphorylates and stabilizes AeMYB30 promoting hyperoside biosynthesis to prolong full-blooming period in okra. J. Exp. Bot. 2020, 71, 4042–4056. [Google Scholar] [CrossRef]
Figure 1. Phenological and physiological indicators. (A) Single strings and single-tree forms of grape varieties. Bar = 1 cm. (B) Single fruit weight of grapes. (C) Anthocyanin content of grapes. Error bars show the standard error of the mean (SEM; n = three biological replicates). * p < 0.05 (Student’s t-test).
Forests 14 00416 g001
Figure 2. Summary statistics for grape transcription group data. (A) Venn graph shows the number of genes and relationships that differ in the comparisons. (B) MA plots for three comparisons. (C) GO enrichment regarding the biological processes, cellular components, and molecular functions. (D) Statistics of pathway enrichment.
Forests 14 00416 g002
Figure 3. Expression trends and screening of enzyme genes in flavonoid synthesis pathway. Darker color represents higher expression. Heat maps show, from left to right, expressions of ‘Rose fragrance’, ‘Vineyard Queen’, ‘Princess rose’, and ‘Emerald rose’. Different rows represent homologous genes of genes.
Forests 14 00416 g003
Figure 4. Related transcription factor filtering. (A) Individual quantities of differential transcription factors for four grape varieties. (B) Binding site of a transcription factor to pre-2000 bp in the enzyme gene promoter. (C) Heat map of differentially expressed genes.
Forests 14 00416 g004
Figure 5. Relative expression of enzyme genes and transcription factors. (A) VvANS; (B) VvCYP75A; (C) VvCYP75B1; (D) VvHCT; (E) VvMYB86; (F) VvMYB2; (G) VvMYB4 (VIT_04s0023g03710); (H) VvGAMYB. Different lowercase letters indicate significant differences (p < 0.05); n = 3.
Forests 14 00416 g005
Figure 6. (A) Subcellular localization of VvMYB2. (B) Instantaneous transformation of VvMYB2 in grape callus and statistics of color change. Bar = 1 cm.
Forests 14 00416 g006
Figure 7. General mechanism of anthocyanin biosynthesis. Solid lines between MYB2, GAMYB, and MYB86 and the start of the gene promoter indicate that these transcription factors may be able to bind to the three genes and affect gene function. The solid line on the right shows the order in which the genes influence each other; the ultimate goal is to influence the phenotype of grapes by affecting anthocyanin synthesis.
Forests 14 00416 g007
Disclaimer/Publisher’s Note: The statements, opinions and data contained in all publications are solely those of the individual author(s) and contributor(s) and not of MDPI and/or the editor(s). MDPI and/or the editor(s) disclaim responsibility for any injury to people or property resulting from any ideas, methods, instructions or products referred to in the content.

