
Multi-Century Reconstruction of Pandora Moth Outbreaks at the Warmest/Driest Edge of a Wide-Ranging Pinus Species

School of Forestry, Northern Arizona University, Flagstaff, AZ 86011, USA
*
Author to whom correspondence should be addressed.
Forests 2023, 14(3), 444; https://doi.org/10.3390/f14030444
Submission received: 24 January 2023
/
Revised: 17 February 2023
/
Accepted: 20 February 2023
/
Published: 21 February 2023
(This article belongs to the Special Issue Linking Forest Productivity and Tree Growth through Remote Sensing and Tree Ring Analyses)
Abstract
:Pandora moths (Coloradia pandora subsp. davisi Barnes and Benjamin) have been observed to reach epidemic populations on the Kaibab Plateau, resulting in relatively small, localized defoliation events of ponderosa (Pinus ponderosa Lawson). We reconstructed the historical pandora moth outbreak regime using tree rings and forest health records to explore how exogenous factors, climate, and fire, are related to outbreak dynamics close to the driest range of ponderosa pine. We collected eight tree-ring chronologies dating back 400 years, geographically dispersed around the plateau, and inferred past outbreaks by comparison with non-host tree-ring chronologies, weather records, and historical observations. Eleven outbreaks were detected between 1744 and the present, many of them occurring at all the sites. Outbreaks were found to be synchronous, typically lasting 10 years at 25-year intervals. Interruption of the frequent fire regime that prevailed prior to 1880 was associated with a shift to shorter, less frequent outbreaks. Dry to wet oscillations in climate were correlated with outbreak initiations. Pandora moth outbreaks appear to have been an intrinsic part of the Kaibab Plateau’s forest ecosystems, though more research is needed to understand outbreak effects on the ecosystem and future directions of the moth–host relationship under climate warming.
1. Introduction
Understanding ecological disturbances is fundamental to safeguarding ecosystems, especially in the context of a hotter and drier climate [1,2]. Even historically benign disturbances, such as largely non-lethal defoliation outbreaks, may contribute to greater ecosystem perturbations under future forest and climactic conditions [3]. Using natural paleoecological archives to extend the baseline understanding of disturbance regimes, we can quantify future deviations from the historical norm [4]. Tree-ring reconstructions offer a centuries-long proxy for insect defoliations, used extensively for numerous insect and tree taxa [5,6,7,8,9,10].
Defoliating insects can significantly impact ecosystems, drastically altering nutrient cycling, forest productivity, and life cycles of other insects [11,12,13]. The pandora moth (Coloradia pandora Blake) is a defoliator that consumes mature needles of pine species such as ponderosa pine (Pinus ponderosa Lawson), pinyon pine (Pinus edulis Engelm.), coulter pine (Pinus coulteri D.Don), Jeffery pine (Pinus jeffreyi Balf.), lodgepole pine (Pinus contorta Douglas ex Loudon), and sugar pine (Pinus lambertiana Douglas) [11,14]. Pandora moth outbreaks have been observed in Arizona, California, Colorado, Oregon, Utah, and Wyoming [11]. Caterpillars feed on host trees and overwinter as pupae in loose granitic or volcanic soils during their two-year life cycle [11,14]. Caterpillars and pupae are a supplemental food source for generalist predators and were traditionally harvested by native Americans [15]. Defoliation rarely results in host tree mortality as caterpillar feeding occurs in alternate years during outbreaks. However, high defoliation predisposes host trees to other more lethal parasites and disturbances [14,16].
Pandora moth outbreaks are quasi-cyclical, with strong 20- and 40-year periodicity in Oregon [7]. Outbreak periodicity may be tied to climactic variability, with pluvial conditions correlating with outbreaks [6,7,17]. Disturbances such as fire may also interact with outbreak dynamics; pandora moths are significantly more likely to reach epidemic levels during breaks in fire events [6,17]. This fire–moth relationship could be explained by the reduction in surface fuel influx during severe defoliation events [18,19].
Tree rings can be used to identify broad-scale pandora moth defoliation events due to the subsequent growth reduction of the host trees [7]. Consecutive years of biennial defoliation on the host tree result in a series of anomalous small rings with thin latewood and even some instances of missing or uncharacteristically white rings [7,17]. This suppression pattern typically lasts 4–20 years [7,14]. To rule out drought as the causal factor of growth reductions from insect defoliations, a non-host chronology from the same region is typically compared with the host annual growth [7,8,20]. Annual host growth is subtracted from non-host growth to produce a growth suppression index (GSI) [21]. For example, periods of suppressed growth recorded by both the non-host and host are attributed to other factors, such as drought or stand dynamics and produce a normalized GSI near zero. Using observed outbreaks in central Oregon as verification, an algorithm was designed with the visually vetted tree-ring signature to detect pandora moth outbreaks with GSI as the input [7]. With this method, reconstructed outbreaks were found to be synchronous, with an average duration of 10 years. Intervals between outbreaks were quasi-cyclical, alternating between ~20- and 40-year intervals [7,8].
The Kaibab Plateau is the southernmost and warmest region of North America where notable pandora moth outbreaks have occurred [11,14]. The Kaibab Plateau has been subject to other forest insects in all the forest types found there, with extensive impacts from pine engraver bark beetles and western spruce budworm [22]. Pandora moth outbreaks, by the subspecies davisi (Coloradia pandora subsp. davisi Barnes and Benjamin), have been observed twice in the modern record, once from 1978 to 1984 [23], and a second, less severe outbreak from 2010 to 2018 [24]. During the 1978 to 1984 outbreak, 23,000 ha of ponderosa pine were defoliated near Jacob Lake, Arizona [23]. Miller and Wagner [25] reported an 84% reduction of tree growth in heavily defoliated trees, many with missing rings, suggesting the Kaibab Plateau and Oregon outbreak signatures are similar [7]. Two studies have sought to reconstruct the history of pandora moth outbreaks from tree-ring dynamics on the Plateau [5,17]. A thesis by de Graauw [5] did not report evidence of outbreaks, but a report by García-Gonzáles et al. [17] did find evidence of pandora moth outbreaks. They compared three ponderosa pine tree-ring chronologies collected near Jacob Lake with a pinyon pine non-host chronology [17]. This study may not have captured all the outbreaks because the pinyon site was observed to be defoliated at the end of the 1978–1984 outbreak. Pinyon pine is a known secondary host, so other outbreaks that defoliated the pinyon “non-host” may have not been detected.
We initiated the present study to reconstruct a spatiotemporally explicit record of pandora moth outbreaks across the entire Kaibab Plateau and identify exogenous drivers in outbreak dynamics. We sampled six dispersed sites in Kaibab National Forest and added two sites collected previously in Grand Canyon National Park to cover the entirety of the Plateau [26]. Using methods developed by Speer et al. [7], we tested the following hypotheses: (1) scale: pandora moth defoliation events occurred at scales ranging from individual sites to the entirety of the Kaibab Plateau, (2) fire: pandora moth outbreaks became more common with the onset of fire exclusion, and (3) climate: outbreaks were correlated with dry years. The climate link is relevant because this is the first study to investigate pandora moth outbreak dynamics close to the warmest and driest edge of ponderosa pine’s range.
2. Materials and Methods
2.1. Study Area
The Kaibab Plateau is located north of the Grand Canyon and is part of the Colorado Plateau region (Figure 1). The highest plateau in Arizona, the Kaibab Plateau varies from pinyon–juniper woodlands at the low-elevation periphery to spruce–fir and aspen at the highest elevations in the center [27,28]. Dominant species include subalpine fir (Abies lasiocarpa Nutt.), Engelmann spruce (Picea engelmannii Parry), blue spruce (Picea pungens Engelm.), Douglas-fir (Pseudotsuga menziesii Franco.), white fir (Abies concolor Hildebr), quaking aspen (Populus tremuloides Michx.), ponderosa pine, gambel oak (Quercus gambelii Nutt.), pinyon pine, and Utah juniper (Juniperus osteosperma Little). The plateau stretches roughly 48 km N–S and 25 km E–W, ranging from 1830 m to 2800 m elevation. Average annual temperature from 2001 to 2020 was 15.8 °C daily maximum and 2 °C daily minimum near Jacob Lake [29]. Annual precipitation is largely bimodal, with summer monsoonal rains and winter snow providing an average of 53.0 cm of precipitation annually. The southern tip of the Kaibab Plateau is managed by the National Park Service, while the majority of the plateau is part of the Kaibab National Forest. Before European settlement, the natural fire regime was largely low severity, isolated surface fires with the occasional landscape-scale fire burning at 31-year intervals [26]. After the 1880s, natural fires were suppressed on the plateau until recently and no fires were recorded that scarred more than 25% of sampled trees [26].
2.2. Site Selection
The two southernmost study sites were sampled in Grand Canyon National Park in the 1990s [26,30]; we observed characteristic tree-ring signatures associated with pandora moth at these sites, motivating the expanded study. In 2019, we selected six sites in the Kaibab National Forest distributed around the plateau, based on the presence of old-growth ponderosa (Figure 1). Each site was approximately 15 hectares. We used a Douglas-fir chronology, AZ505, as a non-host [31] and updated the chronology by sampling Douglas-fir closest to the chronology’s location in the Kaibab National Forest.

Table 1.
Site chronologies and associated metadata. NR = data not reported by the original authors. Species codes are created from the first two letters of the genus (e.g., PInus) and species (POnderosa).
Table 1.
Site chronologies and associated metadata. NR = data not reported by the original authors. Species codes are created from the first two letters of the genus (e.g., PInus) and species (POnderosa).
| Site (Code) [Citation] | Species | Coordinates | Slope (%) | No. of Trees (Dated/Total) | Dates | Mean Series Length | r-Bar | Sensitivity |
|---|---|---|---|---|---|---|---|---|
| Crazy Jug Canyon (CJ) | PIPO | 36.462°, −112.406° | 17.5 | 16/20 | 1646–2018 | 254 | 0.66 | 0.40 |
| Dog Canyon (DG) | PIPO | 36.437°, −112.092° | 5.9 | 17/20 | 1663–2018 | 266 | 0.48 | 0.26 |
| Dry Park (DP) | PIPO | 36.439°, −112.226° | 12.5 | 16/20 | 1666–2018 | 226 | 0.40 | 0.21 |
| Fire Point (FP) [30] | PIPO | 36.358°, −112.347° | 9.9 | 20/20 | 1783–1997 | 181 | 0.66 | 0.36 |
| Fracas Canyon (FR) | PIPO | 36.684°, −112.285° | 29.1 | 19/20 | 1601–2018 | 272 | 0.51 | 0.32 |
| Little Park (LP) [26] | PIPO | 36.331°, −112.127° | 11.4 | 13/20 | 1645–2000 | 207 | 0.29 | 0.25 |
| Orderville Canyon (OR) | PIPO | 36.768°, −112.182° | 9.6 | 19/20 | 1650–2018 | 281 | 0.69 | 0.43 |
| Telephone Hill (TH) | PIPO | 36.603°, −112.156° | 7.4 | 16/20 | 1695–2018 | 215 | 0.54 | 0.26 |
| South Canyon (SC) | PSME | 36.352°, −112.101° | 22.5 | 8/10 | 1850–2018 | 157 | 0.54 | 0.21 |
| Saddle Mtn. (AZ505) [32] | PSME | 36.42°, −112.00° | NR | 21/21 | 1708–1975 | 133 | 0.60 | 0.20 |
| Yovimpa Point (UT515) [33] | PSME | 37.47°, −112.25° | NR | 17/17 | 1436–1998 | 405 | 0.71 | 0.25 |
2.3. Study Area
The two southernmost ponderosa pine sites, Little Park and Fire Point, were previously sampled in Grand Canyon National Park by Fulé et al. [26,30]. We selected 20 of the oldest cores with the highest visual incidence of pandora moth signatures. We sampled the six ponderosa sites on the Kaibab National Forest in 2019. At each site, we selected and cored 20 of the oldest ponderosa trees (Table 1). Ten Douglas-fir trees were sampled near the original location of an older chronology to be used as the non-host, AZ505 [32]. In addition to large size, we used other visual cues to identify old trees, such as large branches, yellow-red bark, and presence of a flat top [34]. Each tree’s location, diameter at breast height, slope, and azimuth was recorded (Table 1). We extracted one core sample from each tree using a 5 mm increment borer at mid-slope and breast height, avoiding any growth deformities.
2.4. Lab Procedures
We mounted and sanded cores with successively finer grit sandpaper until rings were clearly visible under magnification [20]. We scanned cores at a resolution of 1200 dots per inch using an Epson scanner. Core scans were dated and measured in CooRecorder v9.5 [35]. We crossdated samples with previously dated ponderosa chronologies such as AZ127 and the site chronologies of this project, assisted by the “reference curve display” feature of CooRecorder [20]. Ring width measurements of sites were exported in Tucson Decadal format. We assessed the quality of crossdating using COFECHA [36]. Using the dplR package [37] in R [38], we truncated site host and non-host tree ring width files to maintain an expressed population signal (EPS) of 0.85 or greater, and we standardized them with a 40-year cubic spline [7]. This spline model maintains 50% of the growth variability at 40 years and 90% at 20 years. Pandora moth outbreaks can last up to 20 years, so preserving the inter-annual growth trends at this resolution is critical to identify periods of suppression while removing larger changes in growth. To identify outbreak periods, we used dfoliatR [21], which uses the same method and algorithm as the older OUTBREAK program [7]. Applying user-defined parameters, the standardized annual host growth is subtracted from non-host growth to generate a growth suppression index (GSI). Consecutive years that surpass a normalized GSI threshold indicate a defoliation event. When 25% of trees record a defoliation event, an outbreak is inferred. We used similar parameters as Speer et al. [7] so our study is comparable to previous pandora moth research, employing a robust algorithm validated with known historical accounts of outbreaks. Parameters include a minimum duration of 8 years, normalized GSI of −1.28 (top 10% of growth suppressions), and 25% of trees recording a defoliation event [7]. GSI suppressions that surpass thresholds indicate a tree defoliation event. If 25% or more of trees at a given site (or the entire plateau) are defoliated, an outbreak event is inferred. Using these results, we compared outbreak timing, frequency, and duration, and scale across all study sites for a landscape-scale assessment of pandora moth disturbance.
2.5. Non-Host Chronology Modifications
We encountered difficulties with the non-host chronology because after combining and truncating the non-host ring series, the remaining chronology was about 150 years shorter than the ponderosa site chronologies. To extend the non-host chronology, we added UT515, a Douglas-fir chronology located 110 km north of the Kaibab Plateau dating back to 1476 [33]. To avoid climactic signal variability from the older chronology, ring width data from UT515 was truncated to the EPS threshold of the local non-host chronology, 1781. Therefore, only years earlier than 1781 include UT515 data.
While ponderosa pine and Douglas-fir have been found to have similar correlations with climactic patterns, it is important to examine this locally before using a non-host to correct for host tree climate responses [9]. We used monthly precipitation dating back to 1895 to examine the climate correlations of the host and non-host chronologies using Pearson’s correlation coefficient [39,40].
Many Douglas-fir non-host cores had visually detectable periods of growth suppression in the 20th century. We identified the western spruce budworm (Choristoneura freemani, Razowski) defoliation events of Douglas-fir in the 1950s and 1970s as the likely cause of the suppression noise [22]. The spruce budworm outbreak in the late 1970s to late 1980s was especially severe and appeared to defoliate Douglas-fir across the Southwestern US [22]. This posed a significant problem in our analysis: if the non-host chronology is suppressed, any significant releases from suppression would indicate a host tree suppression. A spruce budworm outbreak in the late 1970s ending in the early 1980s could mask the observed pandora moth outbreak during that time and indicate an outbreak in the mid- to late 1980s. Therefore, we used three non-hosts to check for pandora moth defoliation event agreement: Douglas-fir, pinyon pine [41], and annual precipitation [39], all standardized with 40-year cubic splines.
2.6. Outbreak Analyses
To determine if there were any significant differences between site and plateau-resolution outbreaks, we generated outbreak events using data grouped by each site and combined for plateau-wide outbreaks. Then, we used a nonparametric cluster analysis test to find any common trends in our site ring width series data [42]. This method takes the normalized growth suppression index (nGSI) values of each site and finds nonmonotonic synchronicity after bootstrapping (1000 times), testing the null hypothesis that all site nGSI series are of the same group (alpha = 0.05). Thus, if no groups are identified or groups formed have a p-value greater than 0.05, pandora moth outbreaks are likely at the landscape scale.
We tested the fire hypothesis by splitting defoliation data into years before and after the start of fire suppression, circa 1880 [26]. We calculated duration, frequency, and the number of years that sites were in outbreak status, represented as a percent, for the two groups. Using a Welch’s t-test, we tested if the duration of events was statistically different between the two groups.
We used a superposed epoch analysis (SEA) to find any correlations between climate and pandora moth outbreak temporal attributes. We tested two proxies for climate: the Palmer Modified Drought Index (PMDI) and El Niño/Southern Oscillation (ENSO) reconstructions [4,43]. The PMDI reconstruction is from the Living Blended Drought Atlas Version 2 and is local to the Kaibab Plateau [4]. The ENSO index is a reconstructed Niño3.4 Sea Surface Temperature anomaly [43]. We tested four attributes from each outbreak at the site scale: outbreak initiation, end, year of maximum percent of trees defoliated, and year of minimum normalized GSI. We performed a SEA with 1000 bootstraps and an alpha value of 0.05, interpreting the departure of the actual event year means from the simulated (bootstrap) event year means.
3. Results
Climate–growth relationships of ponderosa pine and Douglas-fir showed significant overlap at 90% confidence intervals, indicating a similar correlation to precipitation for all months (Figure 2). Furthermore, the Pearson’s correlation between the non-host and host chronologies is 0.62. With similar climate and radial growth correlations, the Douglas-fir chronology performs well to reduce noise from factors unrelated to defoliation [9].
All non-hosts indicated similar relative defoliation periods until the two documented western spruce budworm outbreaks in the Douglas-fir non-host chronology (Figure 3). These budworm suppressions of the non-host trees likely had a masking effect on any host outbreaks during the budworm outbreaks. Additionally, when the budworm outbreak ended, the GSI would drop from the non-host released growth, erroneously indicating a host outbreak. This discrepancy may explain the 1960s and late 1980s outbreaks that only appear in the Douglas-fir non-host. The budworm outbreaks also masked the historically observed pandora moth outbreak in 1978–1984, contrary to the visual confirmation of the signature in many cores (Figure 4). The pinyon pine non-host shared many of the same defoliation periods as the Douglas-fir, though the number of trees indicating a defoliation event (relative percent defoliated) was markedly lower. The 1970s observed outbreak was present when using the pinyon non-host, but the signal diminished after about 1980 (Figure 3). The non-host used for the remainder of this study was the Douglas-fir non-host chronology (AZ505, South Canyon, and UT515) truncated from 1925 to the present and combined with observational annual precipitation data from NOAA from 1925 to the present [39].
3.1. Kaibab Pandora Moth Signature
Many suppression periods were apparent when visually inspecting the host core samples, appearing in the 1810s, 1850s, 1880s, and 1930s. Many of the suppression events in the tree rings had the characteristics of pandora moth signatures described in other studies: thin latewood and an anomalously small or missing series of rings that persisted for over ±eight years (Figure 4) [7,14,25]. We dated 181 trees (137 host and 44 non-host) totaling ~39,000 rings, extending back to 1685.
3.2. Scale
At the landscape scale, we found n = 11 outbreaks that were detected in 25% or greater of all host trees, including the 1978–1984 outbreak (Table 2). Mean duration of outbreaks was 10.0 years (SD = 1.73 years). Mean return interval (years between outbreak initiation years) was 25.8 years and highly variable (SD = 12.5). At the site scale, only three outbreak periods detected at sites did not make the threshold for a plateau outbreak (Figure 5). Site outbreaks (n = 76) had a similar mean duration and interval compared to the plateau outbreaks, averaging 9.78 years (SD = 2.7) and 26.5 (SD = 12.78) years, respectively. The nonparametric cluster analysis of the site nGSI series returned one group with low certainty (p > 0.05), failing to reject the null hypothesis that all sites have a common trend.
3.3. Fire Exclusion
Before fire exclusion circa 1880, there were 4.5 outbreaks per century, 48% of years experienced a defoliation event, and the mean duration of an outbreak was 10.7 years. After the start of fire exclusion, there were 4.1 outbreaks per century, 35% of years experienced a defoliation event, and the mean duration of an outbreak was 8.6 years. However, the two longest intervals in the record, 50 and 46 years, occurred after fire exclusion. Paired t-tests of site (n = 8) statistics indicate no change in outbreak frequency (p = 0.25) but a significant reduction in total defoliation years (p = 0.01) and duration (p = 0.004). Figure 5 visually supports this, with sites appearing to have shorter outbreaks with less years of total defoliation.
3.4. Climate
Climate oscillations, from drought to pluvial conditions, were significantly correlated with pandora moth outbreak initiations, as shown by the superposed epoch analysis comparing outbreaks at the site scale (n = 76) with the two climate indices, PMDI and ENSO (Figure 6). The mean departure of PMDI was −0.62 one year prior and +0.53 one year succeeding the outbreak initiation event, both significant at 95% confidence (Figure 6). Other years show a successive drying trend before and wetting trend after the outbreak initiation, though they are not significant. The ENSO SEA showed a similar trend of outbreak initiation years associated with the shift from the regionally drier La Niña phase to the wetter El Niño phase, but none of the years were statistically significant (Figure 6). Among the other outbreak event attributes tested, year of maximum percent defoliated returned a similar oscillating pattern as outbreak initiation years. Thirty-one percent of outbreaks share initiation and maximum defoliation event dates, explaining the similar result. Outbreak end and year of minimum normalized GSI events had no significant climate correlations.
4. Discussion
We identified 11 outbreaks over three centuries worth of tree-ring data that occurred across the landscape using similar methods to those that successfully detected pandora moth outbreaks in central Oregon [7]. However, the complex interactions among multiple tree species and defoliators made it challenging for us to find an appropriate non-host that dated back to the start of our host samples and did not incur defoliation itself. The pinyon pine non-host is subject to low-severity defoliations which may have contributed to a diminished 1978–1984 outbreak signal, likely from pandora moth, as pinyon pine is a secondary host. The Douglas-fir non-host deviated significantly from historical accounts of pandora moth outbreaks after the 1950s, indicating two severe outbreaks before and after the observed outbreak in the late 1970s and 1980s. This may be due to the spruce budworm outbreaks that suppressed Douglas-fir growth in the 1950s and 1980s. Our non-host used for further analysis, a combination of Douglas-fir and mean annual precipitation, removed unwanted noise; however, we recognize that error can be mitigated but not eliminated. The discrepancy between the pinyon and Douglas-fir non-host defoliation in the 1700s could be a complication of supplementing the local Douglas-fir with a chronology ~110 km north (Figure 3). Additionally, the 2002–2008 outbreak detected in tree rings is not supported by observed accounts. It is possible that the growth suppression is more related to the southwestern megadrought of the early 21st century, amplified by high tree densities [30,44]. Many samples were missing a 2002 tree ring and were significantly suppressed in the 2000s. By using precipitation as a non-host, temporary climactic recoveries during the drought period could return a false positive outbreak. A drought suppressed host will not recover as quickly as the precipitation non-host, explaining the unexpected drop in GSI and subsequent outbreak.
In terms of temporal and spatial patterns, we found sites to be highly synchronized. We expected outbreaks to be present at all the sites with a mix of landscape- and site-scale outbreaks. Our results infer many outbreaks were plateau-wide, with only three outbreak periods not meeting the landscape-scale threshold of 25% trees recording an outbreak (Figure 5). The nonparametric cluster analysis of site nGSI time series data returned no significant groups amongst our sites; all sites had similar suppression patterns. The outbreak in 1978–1984 was documented to be local to the Orderville site but was present in six of our eight sites [23,45]. This outbreak was observed and documented annually by Forest Health Protection staff flying fixed-wing aircraft and drawing maps of defoliated stands [23]. Schmid and Bennett (1988) noted that lightly and moderately defoliated areas were challenging to identify during the aerial surveys and a new location, Cape Royale (southern tip of the Kaibab Plateau), had evidence of an outbreak in 1985 but the defoliated area was challenging to delineate. It is possible the aerial and ground surveys documented severely defoliated areas, but other locations on the Kaibab Plateau may have eluded detection. The nuanced findings of these surveys suggest the 1978–1984 outbreak may have been defoliating more areas than what was mapped around Jacob Lake, albeit moderate to light defoliations. Our findings support that pandora moth outbreaks are a landscape-scale phenomenon, similar to outbreaks in Oregon [7,8,23,45]. This expands our spatiotemporal understanding of the pandora moth; what may have been considered a rare defoliation in 1978 is likely a common cyclical pattern of Kaibab Plateau ponderosa forests.
To our knowledge, this is the first study to investigate the effect of fire regime shifts on pandora moth outbreak regime attributes. Our findings showed that the implementation of fire suppression was accompanied by a shift towards shorter outbreaks at the same frequency, leading to fewer years of defoliation overall compared to before fire suppression. Speer (2001) notes a similar pattern of reduced outbreak activity in Oregon may be linked to changes in land management practices, such as fire suppression, but does not explore this connection in more depth. Pandora moths exhibit a complex relationship with fire. While the pupae that overwinter in the soil are killed by radiative and conductive heat from the surface fire, the heat may also kill the virus that is the largest factor in maintaining moth population endemicity [11,23]. It is possible that the historical fire regime favored pandora moth outbreaks by reducing litter and duff depths and “sterilizing” the environment of the virus [23,46]. In contrast, other defoliators such as western spruce budworm have shown mixed responses to periods of fire suppression [9,10,47]. With fire suppression, forest stands in the southwest generally became much denser than pre-settlement standards [48]. Higher density stands may contribute to changes in population dynamics. So, more host trees may reduce caterpillar competition, resulting in longer outbreaks that are less severe [49]. While our findings indicate that there is a strong shift to shorter, less common pandora moth outbreaks that coincide with changes to the natural fire regime, future research should explore the mechanisms behind this relationship.
The superposed epoch analysis suggested that outbreaks were correlated with climatic oscillations from drought to pluvial conditions (Figure 6). This is true for the 1978–1984 outbreak. The year 1977 was extremely dry year and the 1977 PMDI was −2.6, in the 3rd percentile of a 400-year record. Before addressing whether this climate pattern was correlated with the initiation of an outbreak, it is important to differentiate between the true initiation and the suppression signature initiation. True outbreak initiation, when pandora moth population numbers surpass endemic thresholds, likely occurs 1–3 years prior to the outbreaks detected using tree-ring suppressions [7]. Therefore, pandora moth populations are likely to be reaching epidemic levels during the drought years, though it is not until the dry to wet oscillation that the outbreak becomes widespread enough to be detected in the tree core samples. Similar climate–defoliation links have been documented in other regions and with other defoliating insects [6,8,10]. ENSO has an oscillatory nature as well, so we used Niño3.4 reconstructed sea surface temperature anomalies to test if there was a correlation with ENSO and the outbreak results (Figure 6). The ENSO SEA had the same trend as our PDSI findings, but with no statistical significance. This climate-moth relationship may be explained by the secondary effects linked to ENSO phase shifts in the Southwest [50]. ENSO phase shifts are significantly associated with wildfire size and changes in herbaceous cover, which may be the first order effects on moth outbreaks, but more research investigation is needed to test this relationship [50,51]. Increased climate volatility and more frequent droughts may trigger more pandora moth outbreaks in the future. However, further research is needed to understand how complex interactions between other factors, including forest stand composition, moth–virus interactions, and shifts in land management practices may modify this relationship.
A limitation of our study is the use of multiple sources to control for climate-related growth suppressions. We confirmed that all non-hosts were in agreement except for the effects of the budworm suppressions in the Douglas-fir. We only used outbreak metrics that returned similar results when assessed with all the non-hosts, such as outbreak start, end, and duration. Another challenge of this reconstruction was confirming the validity of our outbreak reconstructions with only one documented outbreak, 1978–1984. We used the same algorithm and methods that were substantiated in other regions with many records of outbreaks [7]. Our results matched with the observed outbreak in 1978, suppression signatures that were visually present in the tree core samples, and the only other pandora moth outbreak reconstruction at Jacob Lake on the Kaibab Plateau, García-González et al. [17].
Our research using ponderosa host tree core samples indicates the pandora moth has been an intrinsic part of the Kaibab Plateau ecosystem for at least 400 years. Outbreaks were found to be synchronous, typically lasting 10 years at 25-year intervals. Population dynamics of other forest Lepidoptera are known to be synchronous over large geographic scales [52] and repeatable waves of spread of outbreaks occur for some species [53]. Other forest disturbances and associated anthropogenic changes to them have resulted in mixed effects on the pandora moth regime. Fire exclusion resulted in a 13% reduction in pandora moth activity and shorter outbreaks. Dry–wet climate transitions correlated with pandora moth outbreak initiations. Pandora moth population dynamics are a complex system dependent on fire, climate, stand conditions, predator/virus, and stand dynamics. Climate warming could modify species distributions and population cycles, but mechanisms have not been elucidated and changes in cyclic dynamics are not generally apparent. Integration of top-down and bottom-up influences on cyclic dynamics and quantification of dispersal are necessary for progress in understanding patterns of most insect outbreaks. Density-related infection by insect viruses (such as nucleopolyhedrovirus, NPV) are known to initiate the population decline of several outbreak species, such as the gypsy moth, tussock moths, and tent caterpillars [54]. The continued presence of the virus could promote population cycles as a delayed density-related mechanism that prevents the return of increased population growth. Further research untangling this system into constituent parts is needed before we can forecast how pandora moths will affect forests under future conditions.
Even though disturbance by defoliating insects may be largely non-lethal, they can have notable ecosystem effects. Insect defoliator outbreaks have been found to reduce the wood volume of host trees, increase soil nitrogen content, and serve as a food source for small mammals and birds [15,23,55,56]. These primary effects may have other beneficial secondary outcomes as well, such as the promotion of forbs and graminoids from the influx of nitrogen and the suppression of needle litter, though these relationships remain unstudied. Rather than perceiving pandora moth outbreaks as an unaesthetic reduction in valuable timber growth, land managers should consider the potential benefits of a native, non-lethal defoliator before taking actions to control their spread. Future research is necessary to identify secondary effects from defoliators such as pandora moth, and determine what role they play, if any, in ecosystem resilience.
Author Contributions
L.O.: Formal Analysis, funding acquisition, investigation, visualization, writing—original draft. P.Z.F.: Conceptualization, funding acquisition, investigation, project administration, resources, supervision, writing—review and editing. R.W.H.: Conceptualization, supervision, writing—review and editing. All authors have read and agreed to the published version of the manuscript.
Funding
This project was funded in part by the Northern Arizona University Urdea Undergraduate Research Award and the Northern Arizona University Eminent Scholars Fund.
Data Availability Statement
The data presented in this study are openly available in the International Tree Ring Databank at [URL here].
Acknowledgments
This project wouldn’t have been possible without the help of Alex Spannuth from the Kaibab National Forest and Jacob Kelley from the Northern Arizona University School of Engineering for their help collecting data. We also thank David Cox and Paul Callaway from the Kaibab National Forest for assisting and permitting this project.
Conflicts of Interest
The authors declare no conflict of interest. The funders had no role in the design of the study; in the collection, analyses, or interpretation of data; in the writing of the manuscript; or in the decision to publish the results.
References
- McDowell, N.G.; Allen, C.D.; Anderson-Teixeira, K.; Aukema, B.H.; Bond-Lamberty, B.; Chini, L.; Clark, J.S.; Dietze, M.; Grossiord, C.; Hanbury-Brown, A.; et al. Pervasive Shifts in Forest Dynamics in a Changing World. Science 2020, 368, eaaz9463. [Google Scholar] [CrossRef] [PubMed]
- Seidl, R.; Thom, D.; Kautz, M.; Martin-Benito, D.; Peltoniemi, M.; Vacchiano, G.; Wild, J.; Ascoli, D.; Petr, M.; Honkaniemi, J.; et al. Forest Disturbances under Climate Change. Nat. Clim. Change 2017, 7, 395–402. [Google Scholar] [CrossRef] [PubMed] [Green Version]
- Eschtruth, A.K.; Battles, J.J. Ephemeral Disturbances Have Long-Lasting Impacts on Forest Invasion Dynamics. Ecology 2014, 95, 1770–1779. [Google Scholar] [CrossRef] [PubMed]
- Cook, E.R.; Seager, R.; Heim, R.R.; Vose, R.S.; Herweijer, C.; Woodhouse, C. Megadroughts in North America: Placing IPCC Projections of Hydroclimatic Change in a Long-Term Palaeoclimate Context. J. Quat. Sci. 2010, 25, 48–61. [Google Scholar] [CrossRef] [Green Version]
- de Graauw, K. Tree-Ring Analysis of Outbreak Dynamics across an Insect’s Entire Range: The Pandora Moth. Master’s Thesis, Indiana State University, Terre Haute, IN, USA, 2012. [Google Scholar]
- Pohl, K.A.; Hadley, K.S.; Arabas, K.B. Decoupling Tree-Ring Signatures of Climate Variation, Fire, and Insect Outbreaks in Central Oregon. Tree-Ring Res. 2006, 62, 37–50. [Google Scholar] [CrossRef] [Green Version]
- Speer, J.H.; Swetnam, T.W.; Wickman, B.E.; Youngblood, A. Changes in Pandora Moth Outbreak Dynamics during the Past 622 Years. Ecology 2001, 82, 679–697. [Google Scholar] [CrossRef]
- Clark, P.W.; Speer, J.H.; Winship, L.J. Identifying and Separating Pandora Moth Outbreaks and Climate from A 1500-Year Ponderosa Pine Chronology from Central Oregon. Tree Ring Res. 2017, 73, 113–125. [Google Scholar] [CrossRef]
- Ryerson, D.E.; Swetnam, T.W.; Lynch, A.M. A Tree-Ring Reconstruction of Western Spruce Budworm Outbreaks in the San Juan Mountains, Colorado, U.S.A. Can. J. For. Res. 2003, 33, 1010–1028. [Google Scholar] [CrossRef]
- Flower, A.; Gavin, D.G.; Heyerdahl, E.K.; Parsons, R.A.; Cohn, G.M. Drought-Triggered Western Spruce Budworm Outbreaks in the Interior Pacific Northwest: A Multi-Century Dendrochronological Record. For. Ecol. Manag. 2014, 324, 16–27. [Google Scholar] [CrossRef]
- Carolin, V.M.; Knopf, J.A.E. The Pandora Moth; Department of Agriculture, Forest Service: Washington, DC, USA, 1968; Volume 114.
- Jacquet, J.-S.; Orazio, C.; Jactel, H. Defoliation by Processionary Moth Significantly Reduces Tree Growth: A Quantitative Review. Ann. For. Sci. 2012, 69, 857–866. [Google Scholar] [CrossRef] [Green Version]
- Swank, W.T.; Waide, J.B.; Crossley, D.A.; Todd, R.L. Insect Defoliation Enhances Nitrate Export from Forest Ecosystems. Oecologia 1981, 51, 297–299. [Google Scholar] [CrossRef]
- Patterson, J.E. The Pandora Moth, a Periodic Pest of Western Pine Forests. USDA Tech. Bull. 1929, 137, 20. [Google Scholar] [CrossRef]
- Slaton, M.R.; Holmquist, J.G.; Meyer, M.; Andrews, R.; Beidl, J. Traditional Ecological Knowledge Used in Forest Restoration Benefits Natural and Cultural Resources: The Intersection between Pandora Moths, Jeffrey Pine, People, and Fire. Nat. Areas J. 2019, 39, 461–471. [Google Scholar] [CrossRef] [Green Version]
- Wagner, M.R.; Mathiasen, R.L. Dwarf Mistletoe-Pandora Moth Interaction and Its Contribution to Ponderosa Pine Mortality in Arizona. Great Basin Naturalist 1984, 45, 423–426. [Google Scholar]
- García-González, I.; Baisan, C.; Swetnam, T.; Lynch, A. Fire and Pandora Moth History in Northern Arizona; Department of Agriculture, Rocky Mountain Research Station and University of Arizona: Tucson, AZ, USA, 2005. [Google Scholar]
- Speer, A. A Dendrochronological Record of Pandora Moth (Coloradia Pandora, Blake) Outbreaks in Central Oregon. Ph.D. Thesis, University of Arizona, Tucson, AZ, USA, 1997. [Google Scholar]
- Speer, J.H.; Kulakowski, D. Creating a Buzz: Insect Outbreaks and Disturbance Interactions. In Dendroecology: Tree-Ring Analyses Applied to Ecological Studies; Springer: Berlin/Heidelberg, Germany, 2017; Volume 231, pp. 231–255. [Google Scholar]
- Speer, J. Fundamentals of Tree-Ring Research; University of Arizona Press: Tucson, AZ, USA, 2010. [Google Scholar]
- Guiterman, C.H.; Lynch, A.M.; Axelson, J.N. DfoliatR: An R Package for Detection and Analysis of Insect Defoliation Signals in Tree Rings. Dendrochronologia 2020, 63, 125750. [Google Scholar] [CrossRef]
- Lynch, A.; Anhold, J.; McMillan, J.; Dudley, S.; Fitzgibbon, R.; Fairweather, M. Forest Insect and Disease Activity on the Kaibab National Forest and Grand Canyon National Park, 1918-2006; Department of Agriculture, Rocky Mountain Research Station: Tucson, AZ, USA, 2008.
- Schmid, J.M.; Bennett, D.D. The North Kaibab Pandora Moth Outbreak, 1978–1984; Department of Agriculture, Forest Service, Rocky Mountain Forest and Range Experiment Station: Fort Collins, CO, USA, 1988.
- Hofstetter, R. Personal Communication, 2019.
- Miller, K.; Wagner, M. Effect of Pandora Moth (Lepidoptera: Saturniidae) Defoliation on Growth of Ponderosa Pine in Arizona. Econ. Entomol. 1989, 82, 1682–1686. [Google Scholar] [CrossRef]
- Fulé, P.Z.; Crouse, J.E.; Heinlein, T.A.; Moore, M.M.; Covington, W.W.; Verkamp, G. Mixed-Severity Fire Regime in a High-Elevation Forest of Grand Canyon, Arizona, USA. Landsc. Ecol. 2003, 18, 465–485. [Google Scholar] [CrossRef]
- Flatley, W.T.; Fulé, P.Z. Are Historical Fire Regimes Compatible with Future Climate? Implications for Forest Restoration. Ecosphere 2016, 7, e01471. [Google Scholar] [CrossRef] [Green Version]
- Rasmussen, I. Biotic Communities of Kaibab Plateau, Arizona. Eclological Monogr. 1941, 11, 229–275. [Google Scholar] [CrossRef]
- Cooperative Climatological Data Summaries. Available online: http://wrcc.dri.edu/climatedata/climsum/ (accessed on 4 June 2022).
- Fulé, P.Z.; Covington, W.W.; Moore, M.M.; Heinlein, T.A.; Waltz, A.E.M. Natural Variability in Forests of the Grand Canyon, USA. J. Biogeogr. 2002, 29, 31–47. [Google Scholar] [CrossRef]
- Young, C.E. Tree Rings and Kaibab North Deer Hunting Success, 1925–1975. J. Ariz.-Nev. Acad. Sci. 1979, 14, 61–65. [Google Scholar]
- Young, C.E. NOAA/WDS Paleoclimatology—Young—Saddle Mountain Road—PSME—ITRDB AZ505. NOAA Natl. Cent. Environ. Inf. 1996. [Google Scholar] [CrossRef]
- Grow, D. NOAA/WDS Paleoclimatology—Grow—Yovimpa Point—PSME—ITRDB UT515. NOAA Natl. Cent. Environ. Inf. 2003. [Google Scholar] [CrossRef]
- White, A.S. Presettlement Regeneration Patterns in a Southwestern Ponderosa Pine Stand. Ecology 1985, 66, 589–594. [Google Scholar] [CrossRef]
- Larsson, L.; Larsson, P. CDendro, CooRecorder, Cybis Elektronik & Data AB, Saltsjöbaden, Sweden. 2006. Available online: https://www.cybis.se (accessed on 4 June 2022).
- Holmes, R.L. Computer-Assisted Quality Control in Tree- Ring Dating and Measurement. Tree-Ring Bull. 1983, 43, 69–78. [Google Scholar]
- Bunn, A.G. Statistical and Visual Crossdating in R Using the DplR Library. Dendrochronologia 2010, 28, 251–258. [Google Scholar] [CrossRef]
- R Core Team R: A Language and Environment for Statistical Computing; R Core Team: Vienna, Austria, 2020.
- Vose, R.S.; Applequist, S.; Squires, M.; Durre, I.; Menne, M.J.; Williams, C.N., Jr.; Fenimore, C.; Gleason, K.; Arndt, D. NOAA Monthly U.S. Climate Divisional Database (NClimDiv). NOAA Natl. Clim. Data Cent. 2014. [Google Scholar] [CrossRef]
- Zang, C.; Biondi, F. Treeclim: An R Package for the Numerical Calibration of Proxy-Climate Relationships. Ecography 2015, 38, 431–436. [Google Scholar] [CrossRef]
- Stokes, M.A. NOAA/WDS Paleoclimatology—Stokes—Kaibab Plateau—PIED—ITRDB AZ129. NOAA Natl. Cent. Environ. Inf. 1996. [Google Scholar] [CrossRef]
- Lyubchich, V.; Gel, Y.R. A Local Factor Nonparametric Test for Trend Synchronism in Multiple Time Series. J. Multivar. Anal. 2016, 150, 91–104. [Google Scholar] [CrossRef]
- Li, J.; Xie, S.P.; Cook, E.R.; Morales, M.S.; Christie, D.A.; Johnson, N.C.; Chen, F.; D’Arrigo, R.; Fowler, A.M.; Gou, X.; et al. El Niño Modulations over the Past Seven Centuries. Nat. Clim. Change 2013, 3, 822–826. [Google Scholar] [CrossRef] [Green Version]
- Williams, A.P.; Cook, E.R.; Smerdon, J.E.; Cook, B.I.; Abatzoglou, J.T.; Bolles, K.; Baek, S.H.; Badger, A.M.; Livneh, B. Large Contribution from Anthropogenic Warming to an Emerging North American Megadrought. Science 2020, 368, 314–318. [Google Scholar] [CrossRef] [PubMed]
- Bennett, D.; Andrews, M. Biological Evaluation, Pandora Moth; USDA Forest Service: Washington, DC, USA, 1983.
- Miller, K.K.; Wagner, M.R. Factors Influencing Pupal Distribution of the Pandora Moth (Lepidoptera: Saturniidae) and Their Relationship to Prescribed Burning. Environ. Entomol. 1984, 13, 430–431. [Google Scholar] [CrossRef]
- Swetnam, T.W.; Lynch, A.M. A Tree-Ring Reconstruction of Western Spruce Budworm History in the Southern Rocky Mountains. For. Sci. 1989, 35, 962–986. [Google Scholar]
- Fulé, P.Z.; Covington, W.W.; Moore, M.M. Determining Reference Conditions for Ecosystem Management of Southwestern Ponderosa Pine Forests. Ecol. Appl. 1997, 7, 895–908. [Google Scholar] [CrossRef]
- Cochran, P.H. Reduction in Growth of Pole-Sized Ponderosa Pine Related to a Pandora Moth Outbreak in Central Oregon; U.S. Dept. of Agriculture, Forest Service, Pacific Northwest Research Station: Corvallis, OR, USA, 1998.
- Schoennagel, T.; Veblen, T.T.; Romme, W.H.; Sibold, J.S.; Cook, E.R. ENSO and PDO Variability Affect Drought-Induced Fire Occurrence in Rocky Mountain Subalpine Forests. Ecol. Appl. 2005, 15, 2000–2014. [Google Scholar] [CrossRef]
- Swetnam, T.W.; Betancourt, J.L. Mesoscale Disturbance and Ecological Response to Decadal Climatic Variability in the American Southwest. J. Clim. 1998, 11, 3128–3147. [Google Scholar] [CrossRef]
- Peltonen, M.; Liebhold, A.M.; Bjørnstad, O.N.; Williams, D.W. Spatial Synchrony in Forest Insect Outbreaks: Roles of Regional Stochasticity and Dispersal. Ecology 2002, 83, 3120–3129. [Google Scholar] [CrossRef]
- Klemola, T.; Huitu, O.; Klemola, K.R.; Ruohomäki, O.; Klemola, T.; Huitu, O.; Ruohomä, K. Geographically Partitioned Spatial Synchrony among Cyclic Moth Populations. Oikos 2006, 114, 349–359. [Google Scholar] [CrossRef]
- Cory, J.S.; Myers, J.H. The Ecology and Evolution of Insect Baculoviruses. Annu. Rev. Ecol. Evol. Syst. 2003, 34, 239–272. [Google Scholar] [CrossRef] [Green Version]
- Speer, J.; Holmes, R. Effects of Pandora Moth Outbreaks on Ponderosa Pine Wood Volume. Tree Ring Res. 2004, 60, 69–76. [Google Scholar] [CrossRef] [Green Version]
- Grüning, M.M.; Simon, J.; Rennenberg, H.; L-M-Arnold, A. Defoliating Insect Mass Outbreak Affects Soil N Fluxes and Tree N Nutrition in Scots Pine Forests. Front. Plant Sci. 2017, 8, 954. [Google Scholar] [CrossRef] [PubMed] [Green Version]
Figure 1.
Map of study sites and trees cored on the Kaibab Plateau in northern Arizona. Full study site names and species codes are given in Table 1.
Figure 1.
Map of study sites and trees cored on the Kaibab Plateau in northern Arizona. Full study site names and species codes are given in Table 1.

Figure 2.
Correlations of Douglas-fir non-host and ponderosa host chronologies annual growth with historic monthly precipitation from 1925 to 2018. Shaded regions represent 90% confidence intervals. Months in all capitals are from the current year’s growth; lowercase months are the previous year.
Figure 2.
Correlations of Douglas-fir non-host and ponderosa host chronologies annual growth with historic monthly precipitation from 1925 to 2018. Shaded regions represent 90% confidence intervals. Months in all capitals are from the current year’s growth; lowercase months are the previous year.
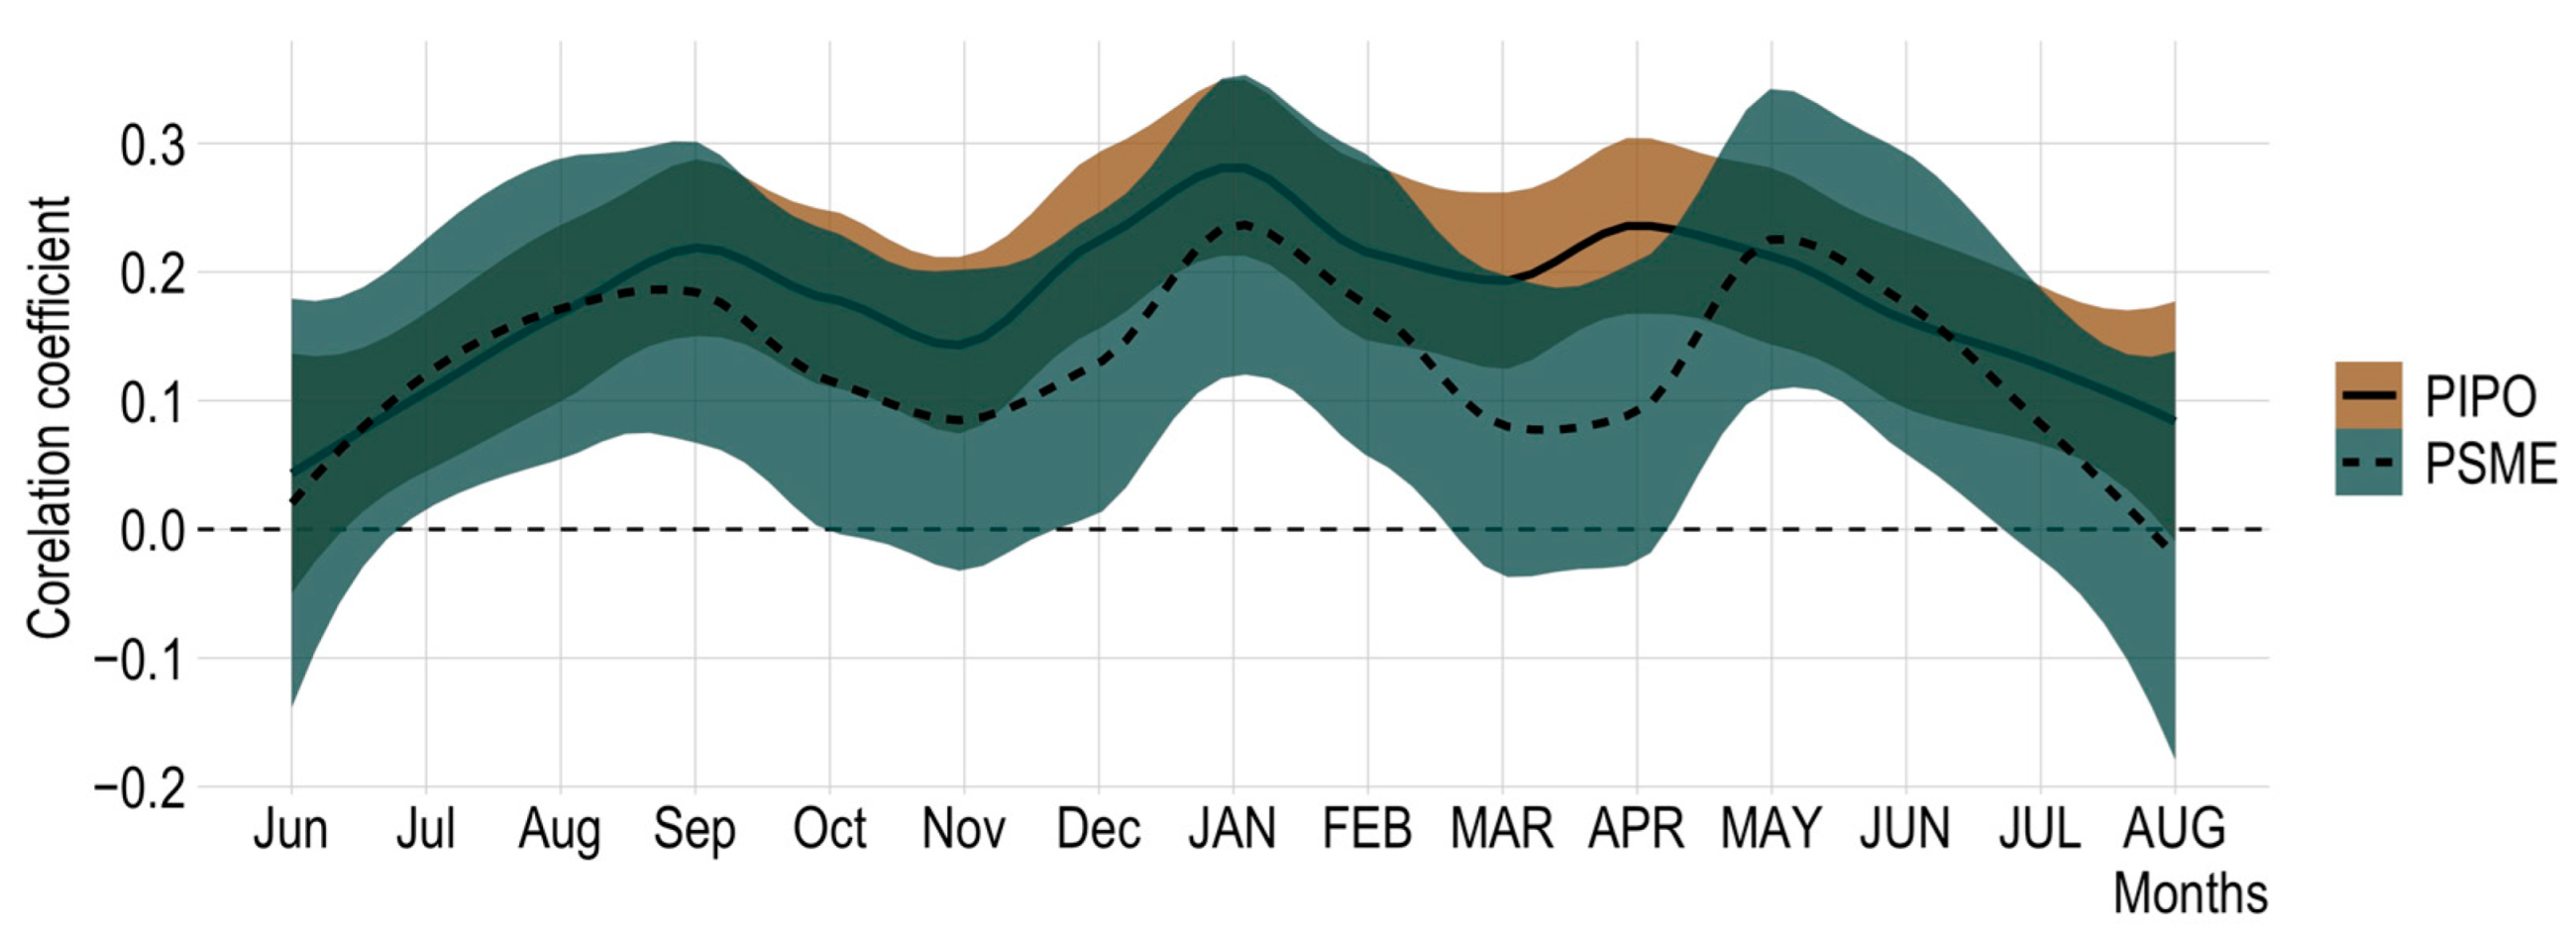
Figure 3.
Effect of using different non-host inputs, represented by percent of defoliation of host tree series: pinyon pine chronology AZ129 (PIED), annual instrumental precipitation (PRECIP), and the combined Douglas-fir chronologies used for this study (PSME). Crosshatched regions are observed outbreak periods. The 1978–1984 outbreak is evident in the precipitation and PIED non-host but masked in the PSME results.
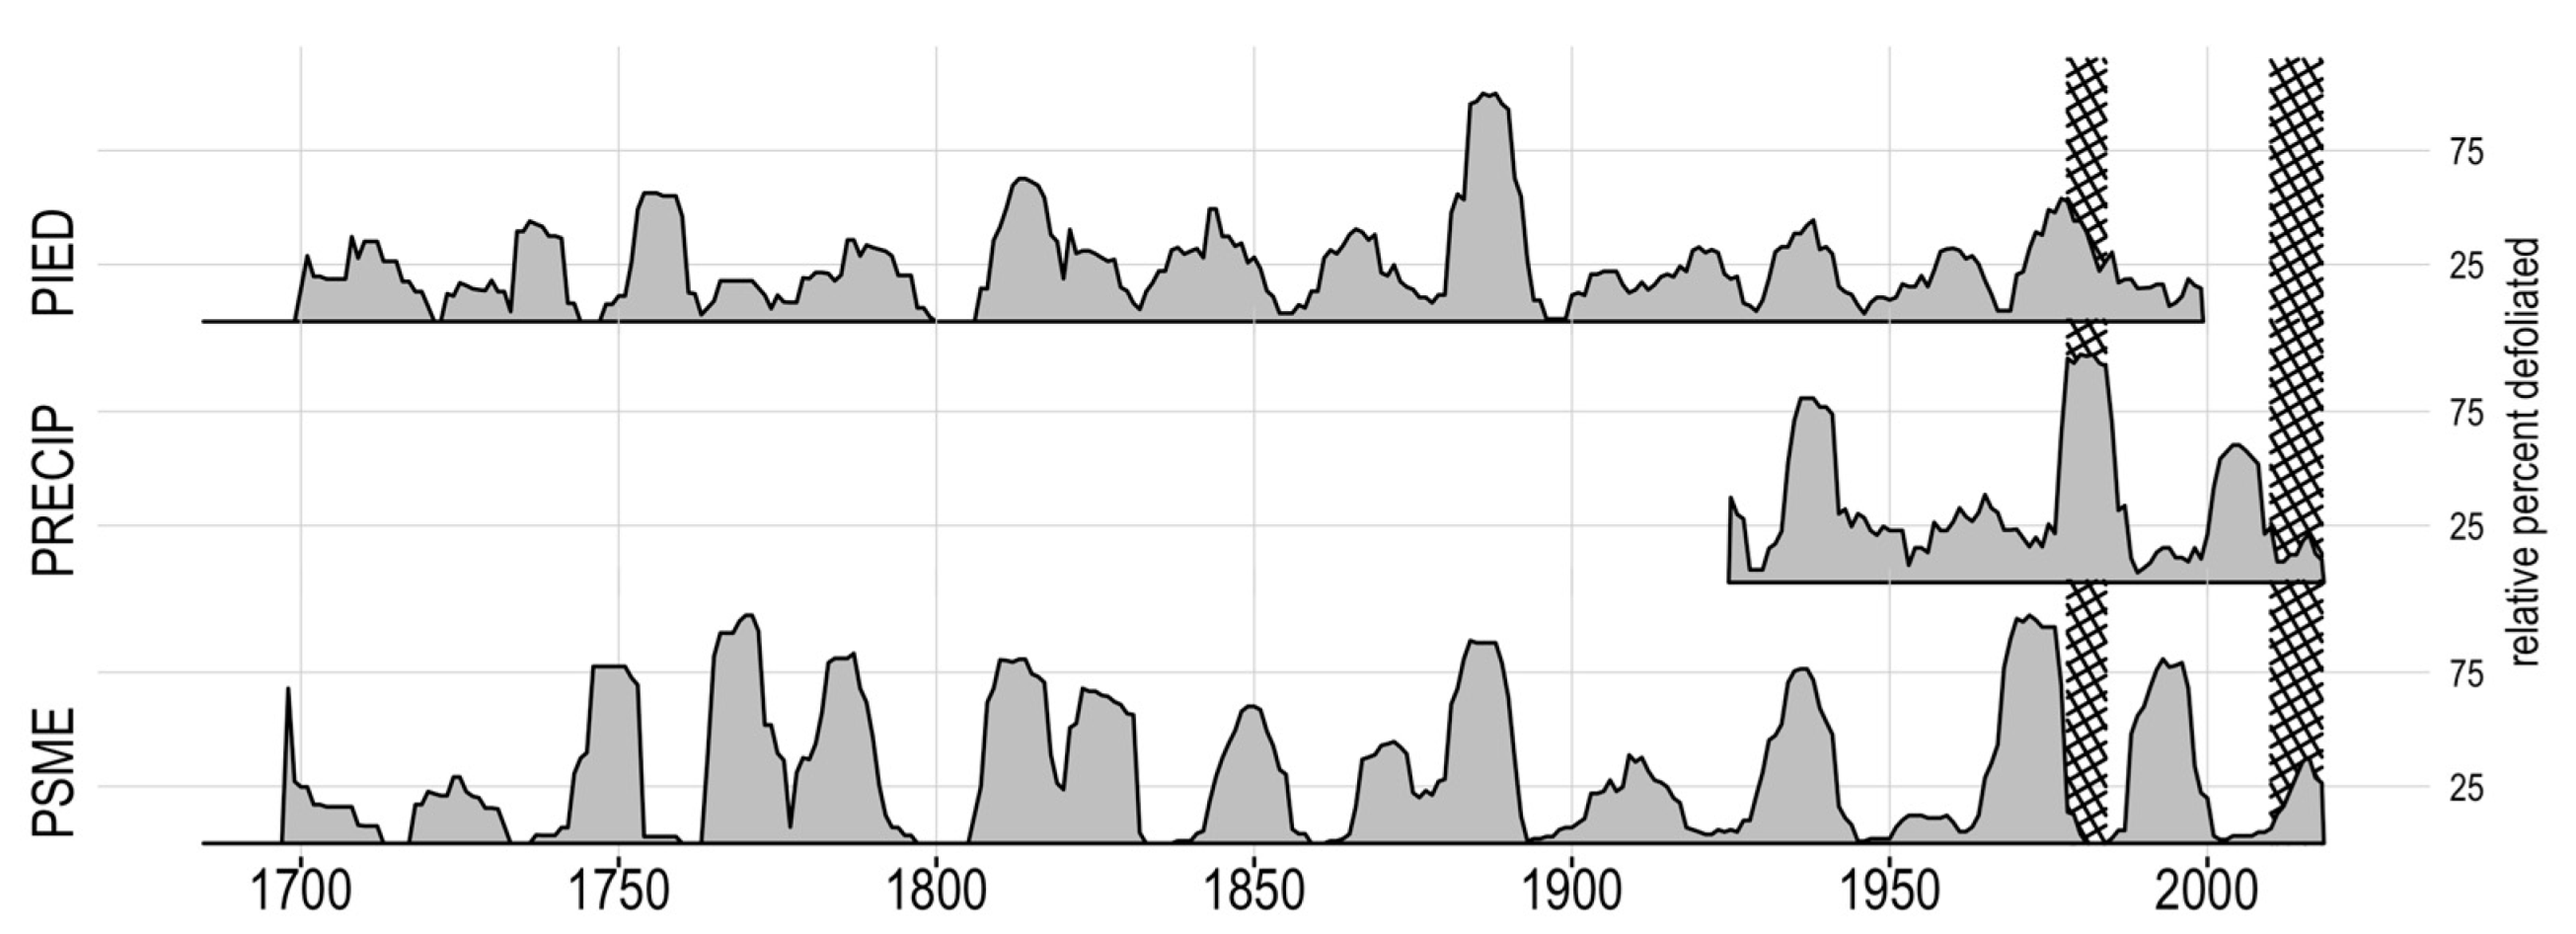
Figure 4.
Examples of pandora moth suppressions from Orderville Canyon. Each black line is a defoliation event specific to the individual sample. The year 1879 is locally absent in the OR-013 sample.
Figure 4.
Examples of pandora moth suppressions from Orderville Canyon. Each black line is a defoliation event specific to the individual sample. The year 1879 is locally absent in the OR-013 sample.
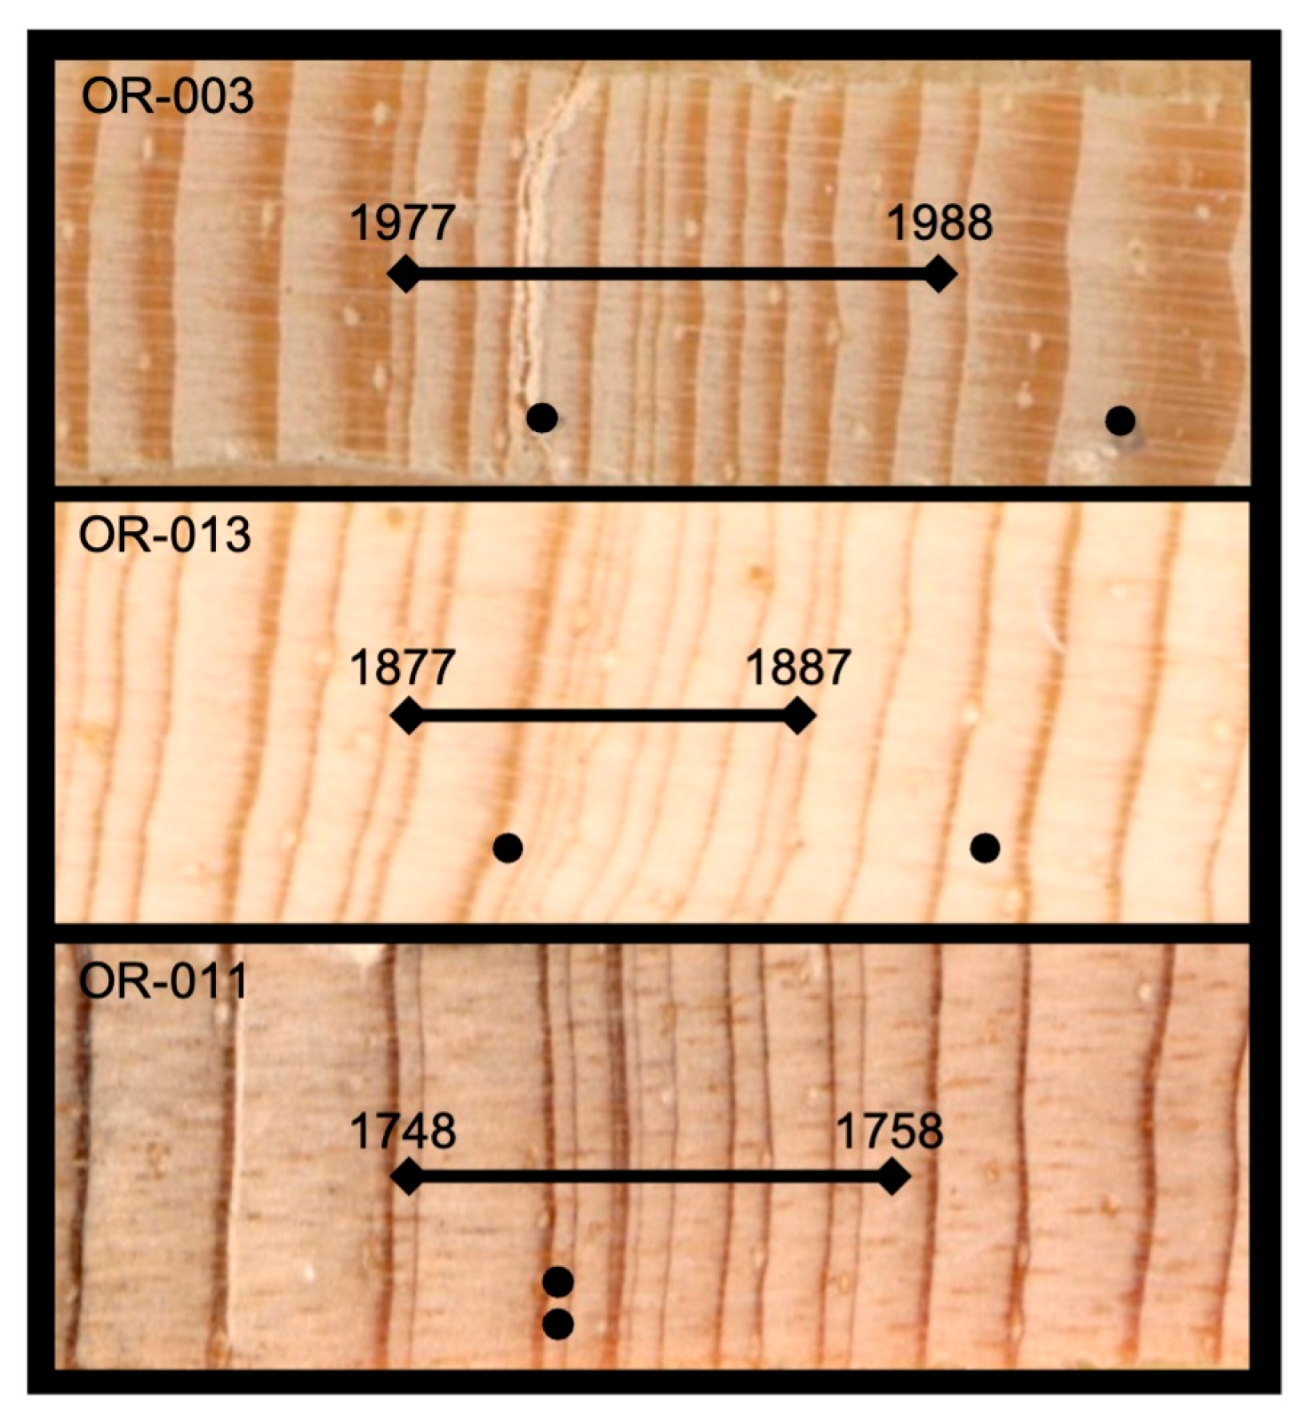
Figure 5.
Pandora moth outbreaks at the landscape (top) and site (bottom) scales. Sites are ordered from north (top) to south. Brown bars represent inferred outbreak periods at the site or plateau scale and crosshatched regions are historically observed outbreaks. The landscape outbreaks are represented in normalized growth suppression index and the site outbreaks are percent of trees indicating a defoliation event by site with shaded regions representing site-wide outbreak periods.
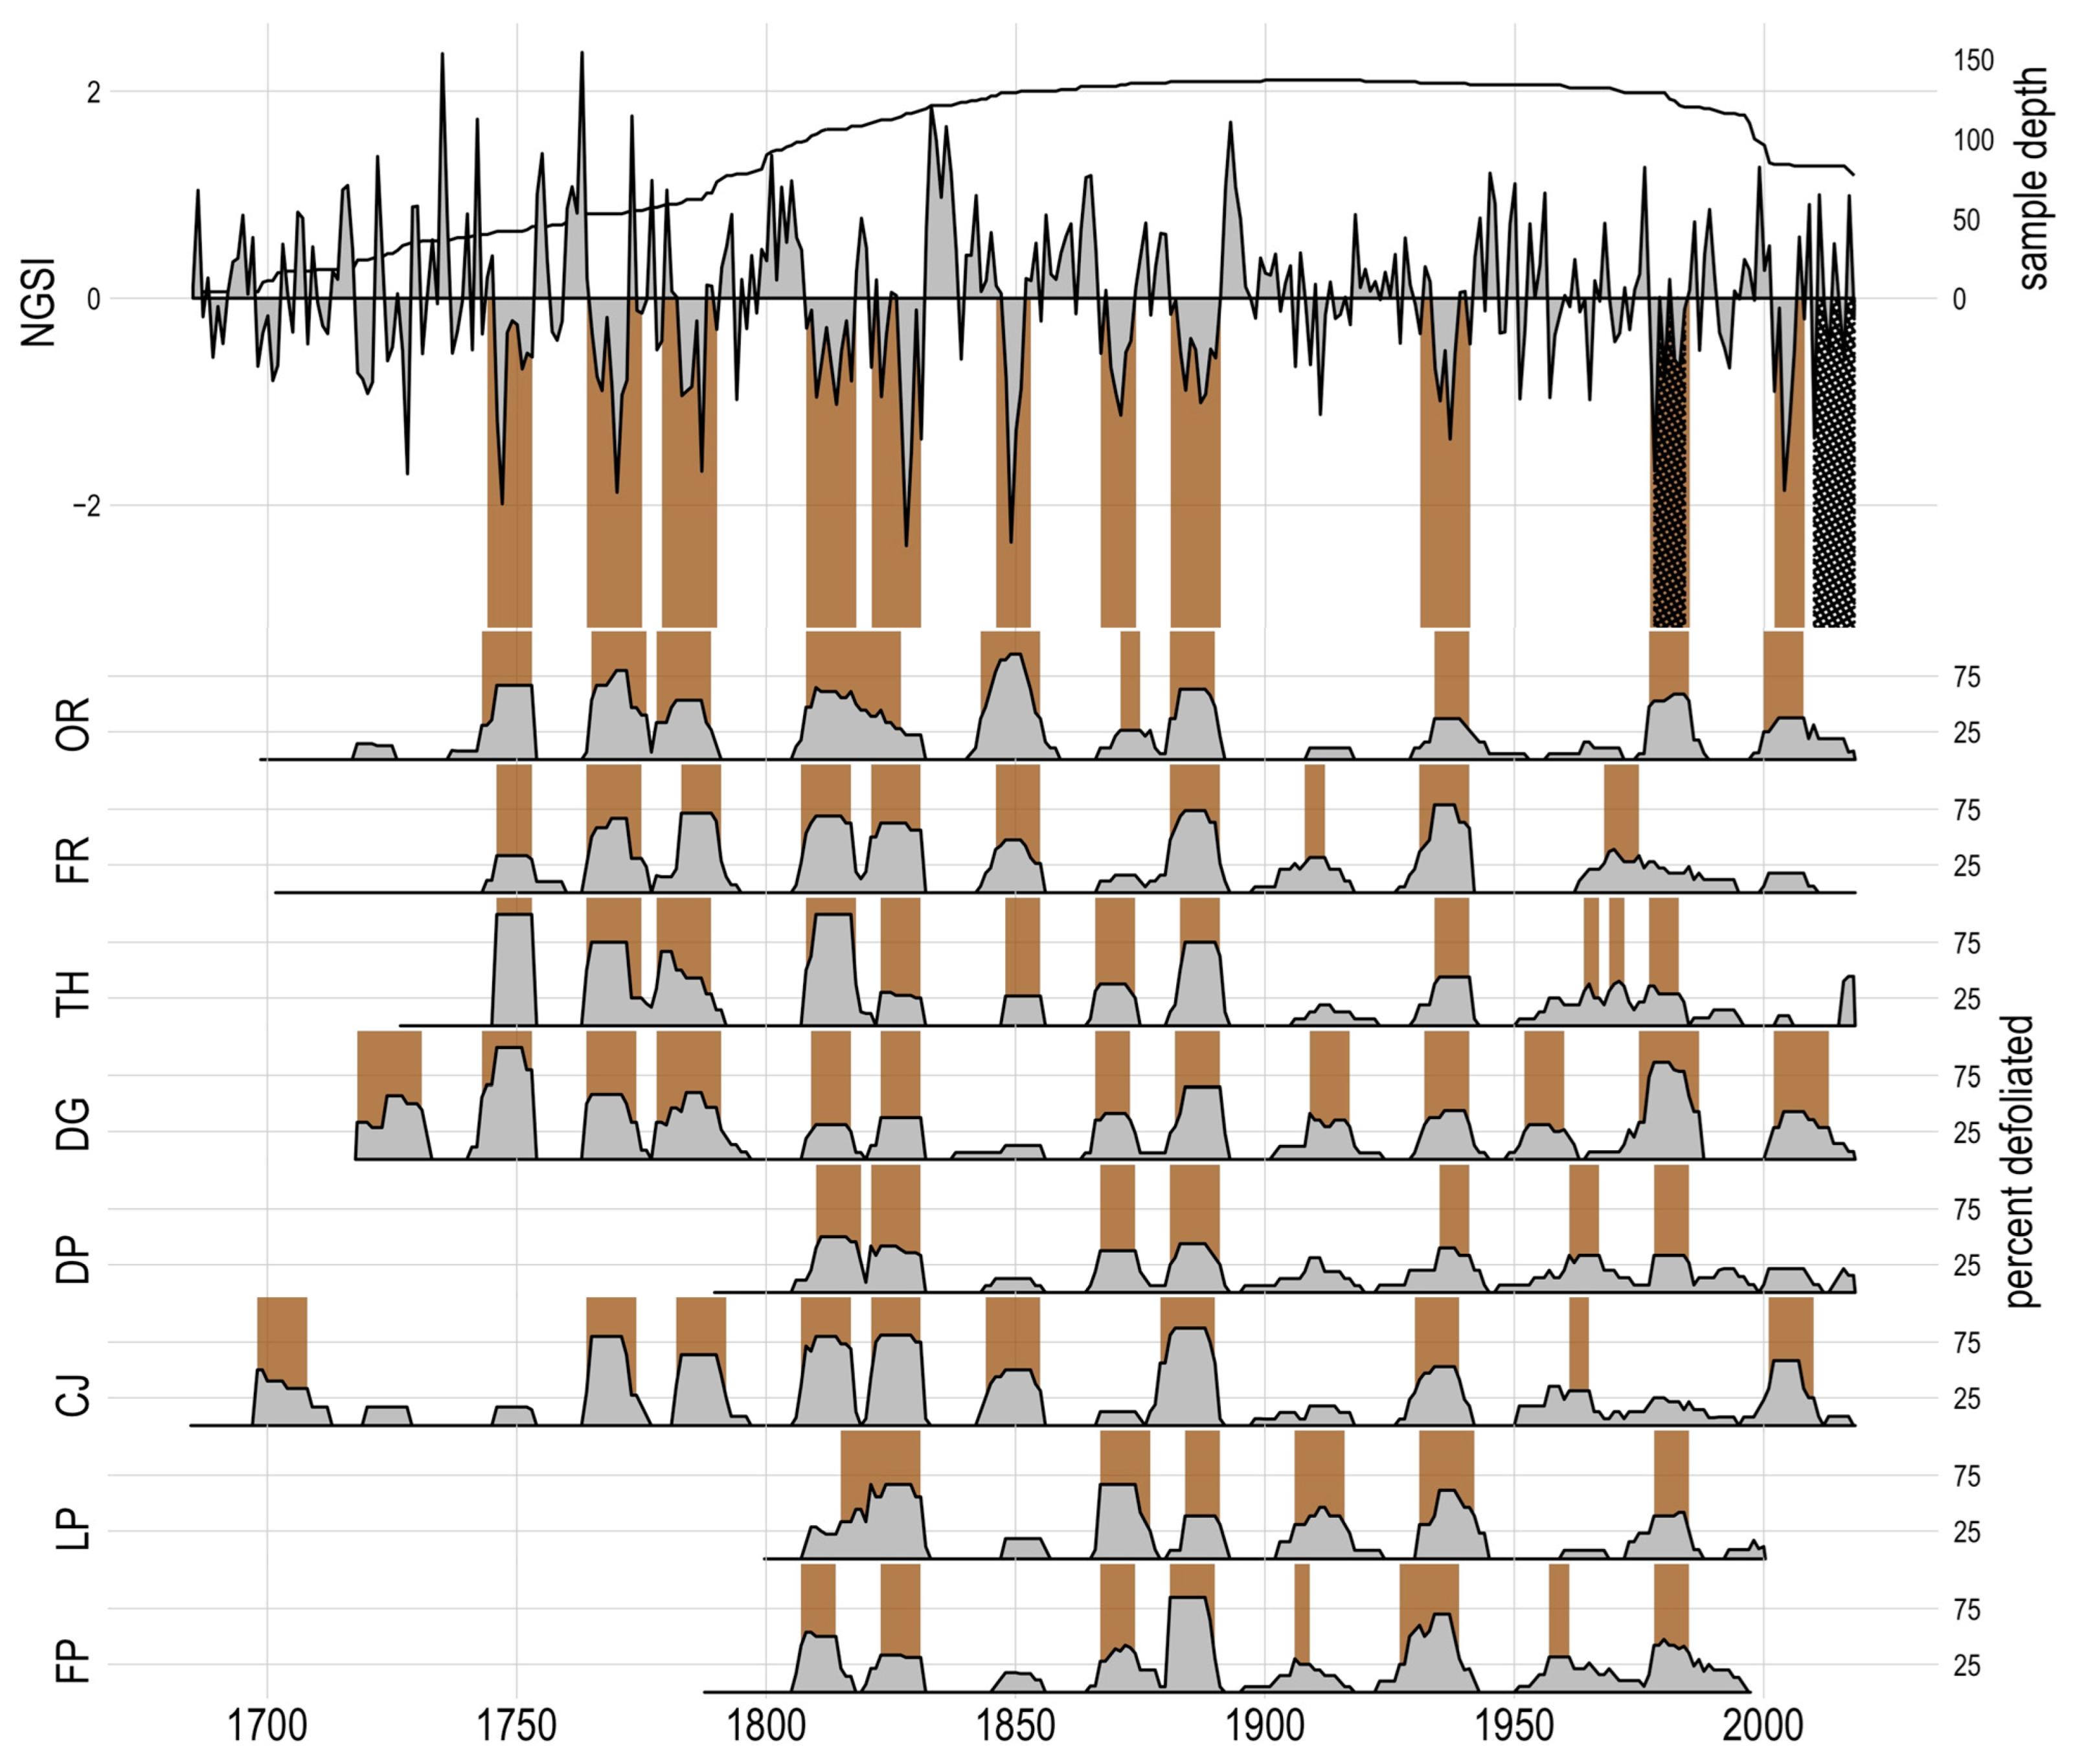
Figure 6.
Superposed epoch analysis comparing site outbreak initiation dates (n = 47) with Palmer Modified Drought Index and El Niño/Southern Oscillation Niño 3.4 reconstructions. Bars represent the departure from mean index at the indexed year—red are dry, blue are wet years. The dotted and dashed lines represent the 95% and 99% confidence intervals, respectively.
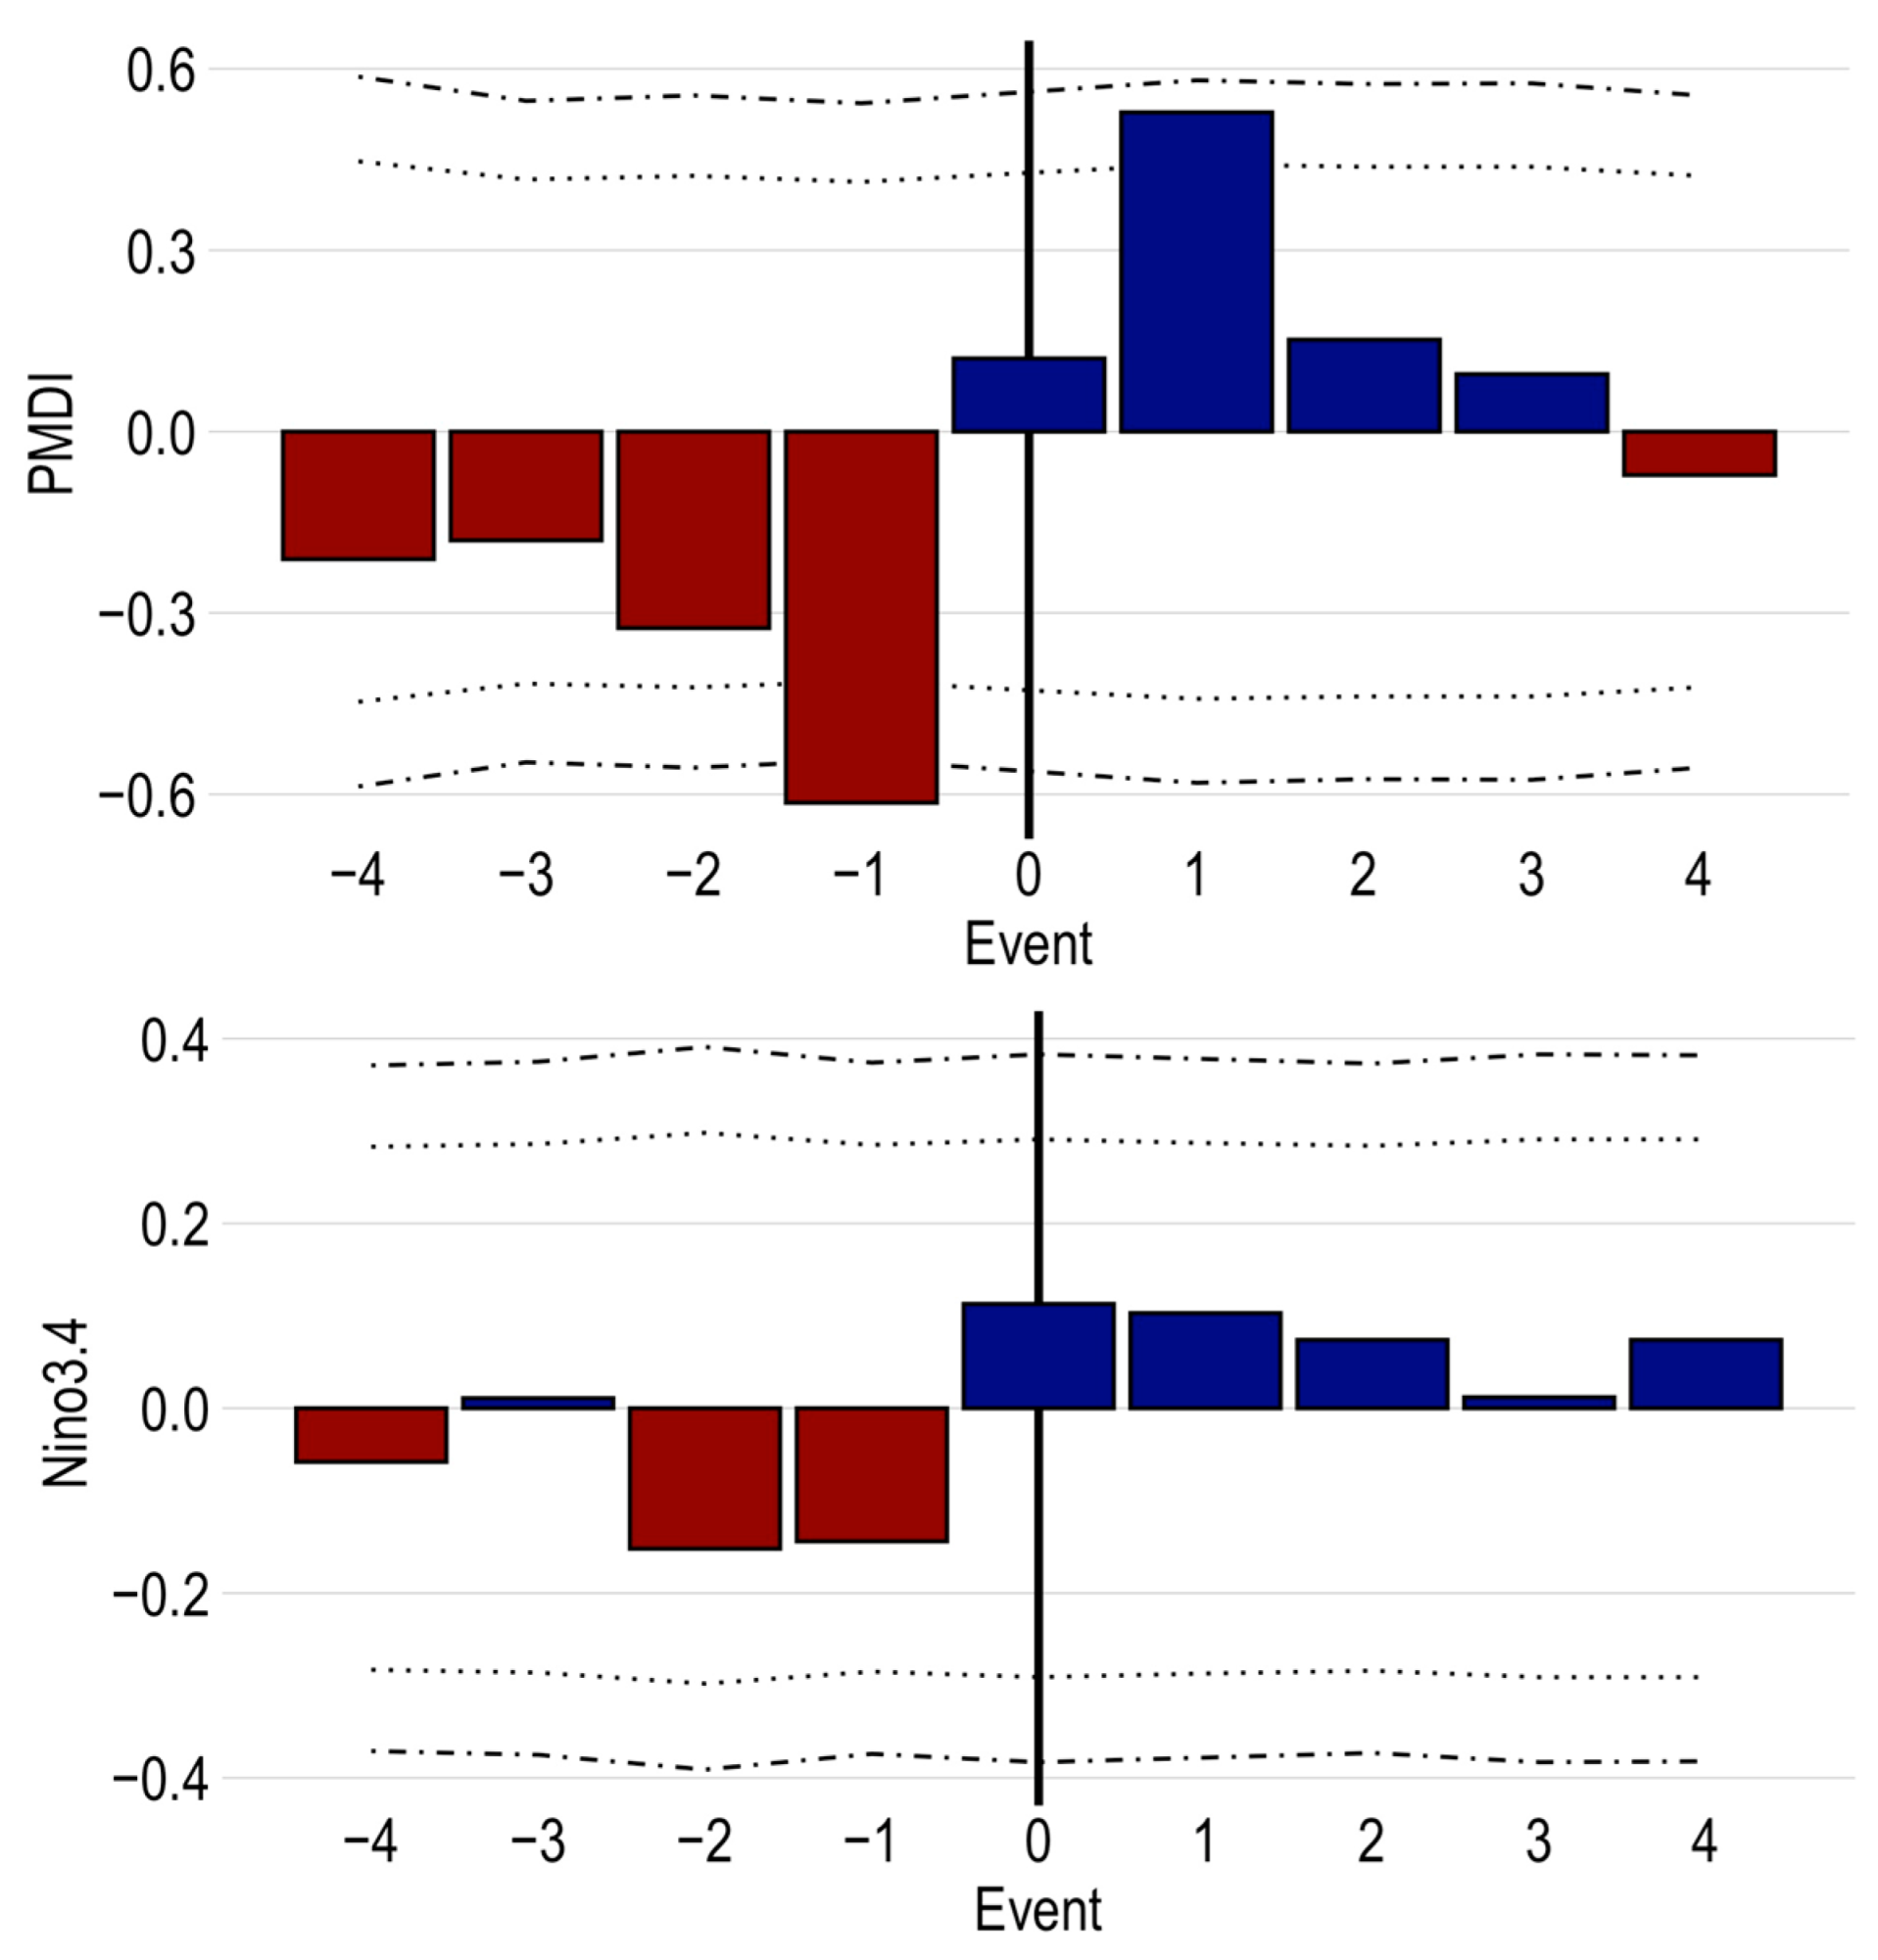
Table 2.
Summary of outbreaks for the Kaibab Plateau. Return intervals are calculated as the time between the current and previous outbreak initiation.
Table 2.
Summary of outbreaks for the Kaibab Plateau. Return intervals are calculated as the time between the current and previous outbreak initiation.
| Dates | Duration | Interval | Min nGSI (Year) |
|---|---|---|---|
| 1744–1753 | 10 | - | −1.986 (1747) |
| 1764–1775 | 12 | 20 | −1.875 (1770) |
| 1779–1790 | 12 | 15 | −1.671 (1787) |
| 1808–1818 | 11 | 29 | −1.025 (1811) |
| 1821–1831 | 11 | 13 | −2.391 (1823) |
| 1846–1853 | 8 | 25 | −2.356 (1849) |
| 1867–1874 | 8 | 21 | −1.130 (1872) |
| 1881–1891 | 11 | 14 | −1.009 (1884) |
| 1931–1941 | 11 | 50 | −1.361 (1936) |
| 1977–1985 | 9 | 46 | −1.669 (1978) |
| 2002–2008 | 7 | 25 | −1.856 (2004) |
Disclaimer/Publisher’s Note: The statements, opinions and data contained in all publications are solely those of the individual author(s) and contributor(s) and not of MDPI and/or the editor(s). MDPI and/or the editor(s) disclaim responsibility for any injury to people or property resulting from any ideas, methods, instructions or products referred to in the content. |
© 2023 by the authors. Licensee MDPI, Basel, Switzerland. This article is an open access article distributed under the terms and conditions of the Creative Commons Attribution (CC BY) license (https://creativecommons.org/licenses/by/4.0/).
Share and Cite
MDPI and ACS Style
O’Neill, L.; Fulé, P.Z.; Hofstetter, R.W. Multi-Century Reconstruction of Pandora Moth Outbreaks at the Warmest/Driest Edge of a Wide-Ranging Pinus Species. Forests 2023, 14, 444. https://doi.org/10.3390/f14030444
AMA Style
O’Neill L, Fulé PZ, Hofstetter RW. Multi-Century Reconstruction of Pandora Moth Outbreaks at the Warmest/Driest Edge of a Wide-Ranging Pinus Species. Forests. 2023; 14(3):444. https://doi.org/10.3390/f14030444
Chicago/Turabian StyleO’Neill, Leo, Peter Z. Fulé, and Richard W. Hofstetter. 2023. "Multi-Century Reconstruction of Pandora Moth Outbreaks at the Warmest/Driest Edge of a Wide-Ranging Pinus Species" Forests 14, no. 3: 444. https://doi.org/10.3390/f14030444
Note that from the first issue of 2016, this journal uses article numbers instead of page numbers. See further details here.