Article

Visual Simulation Research on Growth Polymorphism of Chinese Fir Stand Based on Different Comprehensive Grade Models of Spatial Structure Parameters

1
Institute of Forest Resource Information Techniques, Chinese Academy of Forestry, Beijing 100091, China
2
School of Geography and Environmental Sciences, Guizhou Normal University, Guiyang 550025, China
3
Key Laboratory of Forest Management and Growth Modelling, NFGA, Beijing 100091, China
4
National Long Term Scientific Research Base of Huangfengqiao Forest Monitoring and Simulation in Hunan Province, Beijing 100091, China
*
Author to whom correspondence should be addressed.
Forests 2023, 14(3), 617; https://doi.org/10.3390/f14030617
Submission received: 21 February 2023 / Revised: 14 March 2023 / Accepted: 16 March 2023 / Published: 19 March 2023

Abstract

:
Since tree morphological structure is strongly influenced by internal genetic and external environmental factors, accurate simulation of individual morphological–structural changes in trees is the premise of forest management and 3D simulation. However, existing studies have few descriptions, and the research on the impact of growth environments and stand spatial structures on tree morphological structure and growth is still limited. In our study, we constructed a comprehensive grade model of spatial structure (CGMSS) to comprehensively evaluate individual tree growth states of the stands and grade them from 0 to 10 correspondingly. In addition, we developed a Chinese fir morphological structure growth model based on CGMSS, and dynamically simulate the growth variations of Chinese fir stands. The results showed that the overall stand prediction accuracy of CGMSS-based Chinese fir diameter at breast height, tree height, crown width and under-living branch height growth models was more than 94%. According to the analysis of the comprehensive grade of spatial structure (CGSS) of trees in the stand, except for the prediction accuracy and systematic error of the under-living branch height growth model at the CGSS = 3–5 levels, the systematic error of the Chinese fir growth model at each level was lower than 21.2%, and the prediction accuracy was greater than 73%. Compared with the spatial structural unit (SSU)-based Chinese fir growth model proposed by Ma et al., all growth models fit better at all levels, except for the CGMSS-based Chinese fir tree height and under-living branch height growth models that fit significantly lower than the SSU-based Chinese fir growth model at CGSS = 3–5 levels. In this study, the main conclusion is that the simulation results of CGMSS’s Chinese fir morphological structure growth model are closer to the real growth state of trees, achieving accurate simulation of differential growth of trees in different growth dominance degrees and spatial structure states in forest stands, making visualized forest management more effective and realistic.

1. Introduction

Forest management practices aim to maintain or improve the forest ecosystem function, product, and service value by changing the spatial and temporal distribution of forest resources, intra- and inter-competition relationships and stand spatial distribution pattern [1]. Compared with traditional 2D descriptions, 3D visual simulation technology can directly reveal differences before and after forest management practices, improve the understanding of forest management benefits [2], and enrich information expression approaches [3]. Therefore, realistic individual tree growth and morphological structure simulation with high complexity and diversity [4] play a key role in the analysis of the relationship between tree growth, climate, and spatial environment [5], and is also the premise of the effective visualization of forest management.
However, forest structure and tree growth have complex and variable characteristics, which make it difficult to visualize the stand growth [6]. In the early stages, research into 3D visual simulation of stands was mainly focused on the plant function–structure [7,8,9] under a given environment, combined with the algorithm of plant growth rules or fractal geometry [10,11,12] to simulate and visualize the individual growth process. It can effectively improve the realism of the tree growth process and reflect tree morphological structure in a virtual environment using a refined individual tree growth model [9]. However, the visual simulation of stand growth based on the individual tree model has the characteristics of forest morphological structure similarity and growth environment ideality [13]. Trees are usually faced with complex and diverse environments [14] and different spatial structure of stands during their growth [15]. Therefore, existing research is mainly focused on site conditions, climate factors and combining the biochemical–physics processes to establish a tree growth visual model from the perspective of considering environmental factors, such as using different organ biomass [16,17,18], and achieve the interactive process between tree growth and environmental factors. However, existing studies lack interactive feedback among the target tree and neighboring trees [17], but forest spatial structure parameters based on the relationship between the target tree and neighboring trees play a key role in the quantitative description of the forest state [15]. Therefore, some scholars have realized a visual simulation of forest stands by optimizing forest stand spatial structure parameters [2,19,20], incorporating one or more independent spatial structure parameters to construct tree growth models [21,22,23,24], etc., or using the spatial structure parameters as the constraints on tree growth, combined with the tree shape growth model [25,26,27]. These studies successfully simulated the growth process of tree morphology structure from different perspectives, which could provide effective technical references for visualizing the process of forest management practices [28].
However, there is a lack of comprehensive analysis of tree morphological structure growth changes under different growth potential and spatial structure states in existing visual simulation studies. The growth models for the visual simulation of forest stands are mostly focused on the plot–stand growth model, or based on the single-tree model to realize the visual growth simulation of forest stands [6], resulting in similar growth of trees [26]. They fail to reflect the morphological and structural differences among trees under different growth states in the stand and lack a true simulation of stand growth [4]. Therefore, it is essential to comprehensively analyze the growth and spatial structure of different trees in a stand and to incorporate the differences in tree morphology and structure under different growth states into the existing growth model to realize the growth polymorphism of the stand. We took the Chinese fir plantation in the Huangfengqiao State-owned Forest Farm in Hunan Province, China, as an example. Our main research work is as follows: (1) From the three dimensions of a single-tree–spatial structure unit–stand, through the comprehensive analysis of the growth difference of single-tree morphology and structure in the stand, the comprehensive grade model of forest spatial structure (CGMSS) was constructed to realize the comprehensive classification of the growth state of forest trees; (2) a growth model was constructed of Chinese fir morphological structure based on CGMSS to provide the theoretical basis for the visual simulation of Chinese fir growth; (3) with the help of three-dimensional dynamic visualization technology, the visual simulation of the polymorphic growth of Chinese fir forest was realized.

2. Materials and Methods

2.1. Study Area and Data Collection

The study area is in Huangfengqiao State-owned Forest Farm, which is distributed in a belt across the east and west of Youxian County, Hunan Province, with latitude and longitude between 113°04′ and 113°43′ E, 26° 43′ and 27°06′ N. The altitude of the forest farm ranges from 115 m to 1270 m, with a humid subtropical monsoon climate, average annual temperature of 17.8 °C, annual precipitation of 1410.8 mm, mid–low mountain landforms, and the percentage of forest cover is over 90%. For six consecutive years (2012–2017), we conducted field investigation and sampling in the Huangfengqiao State-owned Forest Farm, and selected six Chinese fir plantation plots with the same range of forest sites, slopes, aspects, and elevations (site index:18, aspect: south slope, slope: 5–10°, elevation: 270–320 m), and used equipment to collect data such as individual tree coordinates, age, diameter at breast height (DBH), tree height (H), crown width (CW), under-living branch height (UBH), etc. Its attribute distribution is shown in Table 1. In this study, the center tree and its four nearest neighbor trees were used as the spatial structure unit of the tree [29]. To eliminate the influence of the edge effect of the sample plot, a buffer zone of 5 m was set inward of the sample plot, and 1787 central trees were calculated, among which 1008 center trees whose adjacent trees did not change, and 779 center trees whose spatial structure changed due to the death or thinning of adjacent trees. In this study, 1008 center trees whose adjacent trees have not changed were used as the modeling data of the tree morphological structure growth model, of which 70% were used for modeling and 30% were used for testing. The location of the study area is shown in Figure 1.

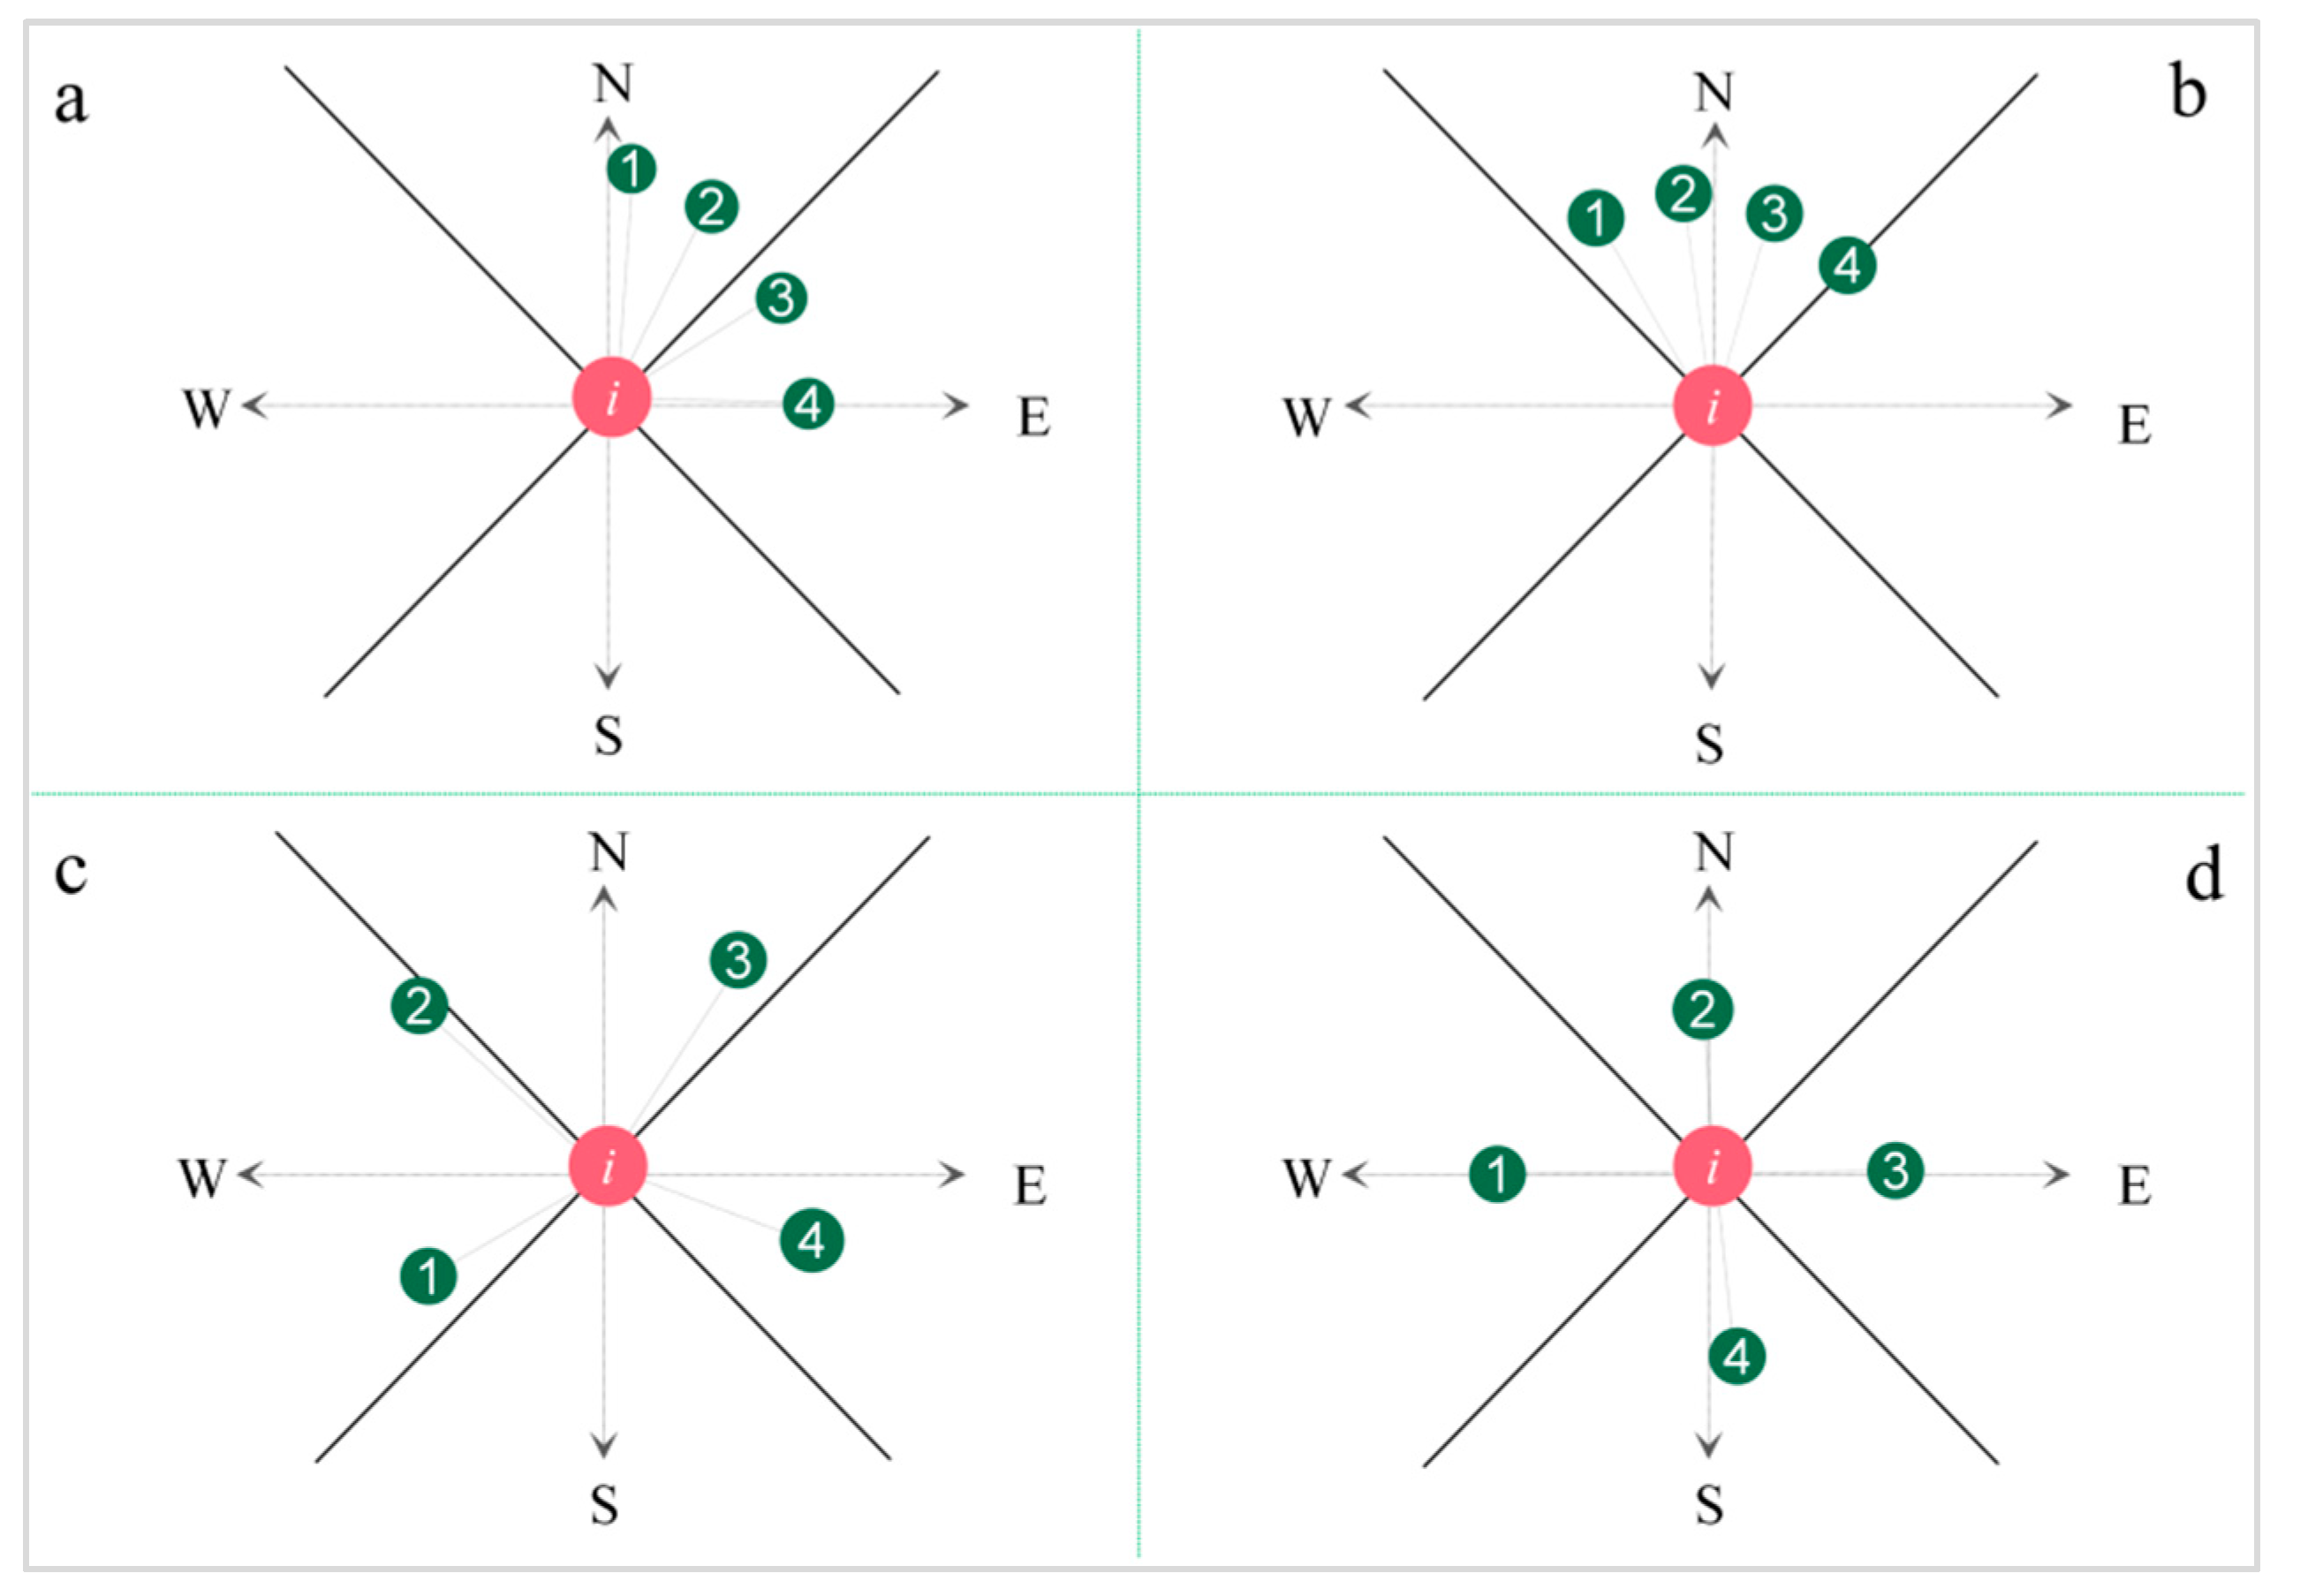
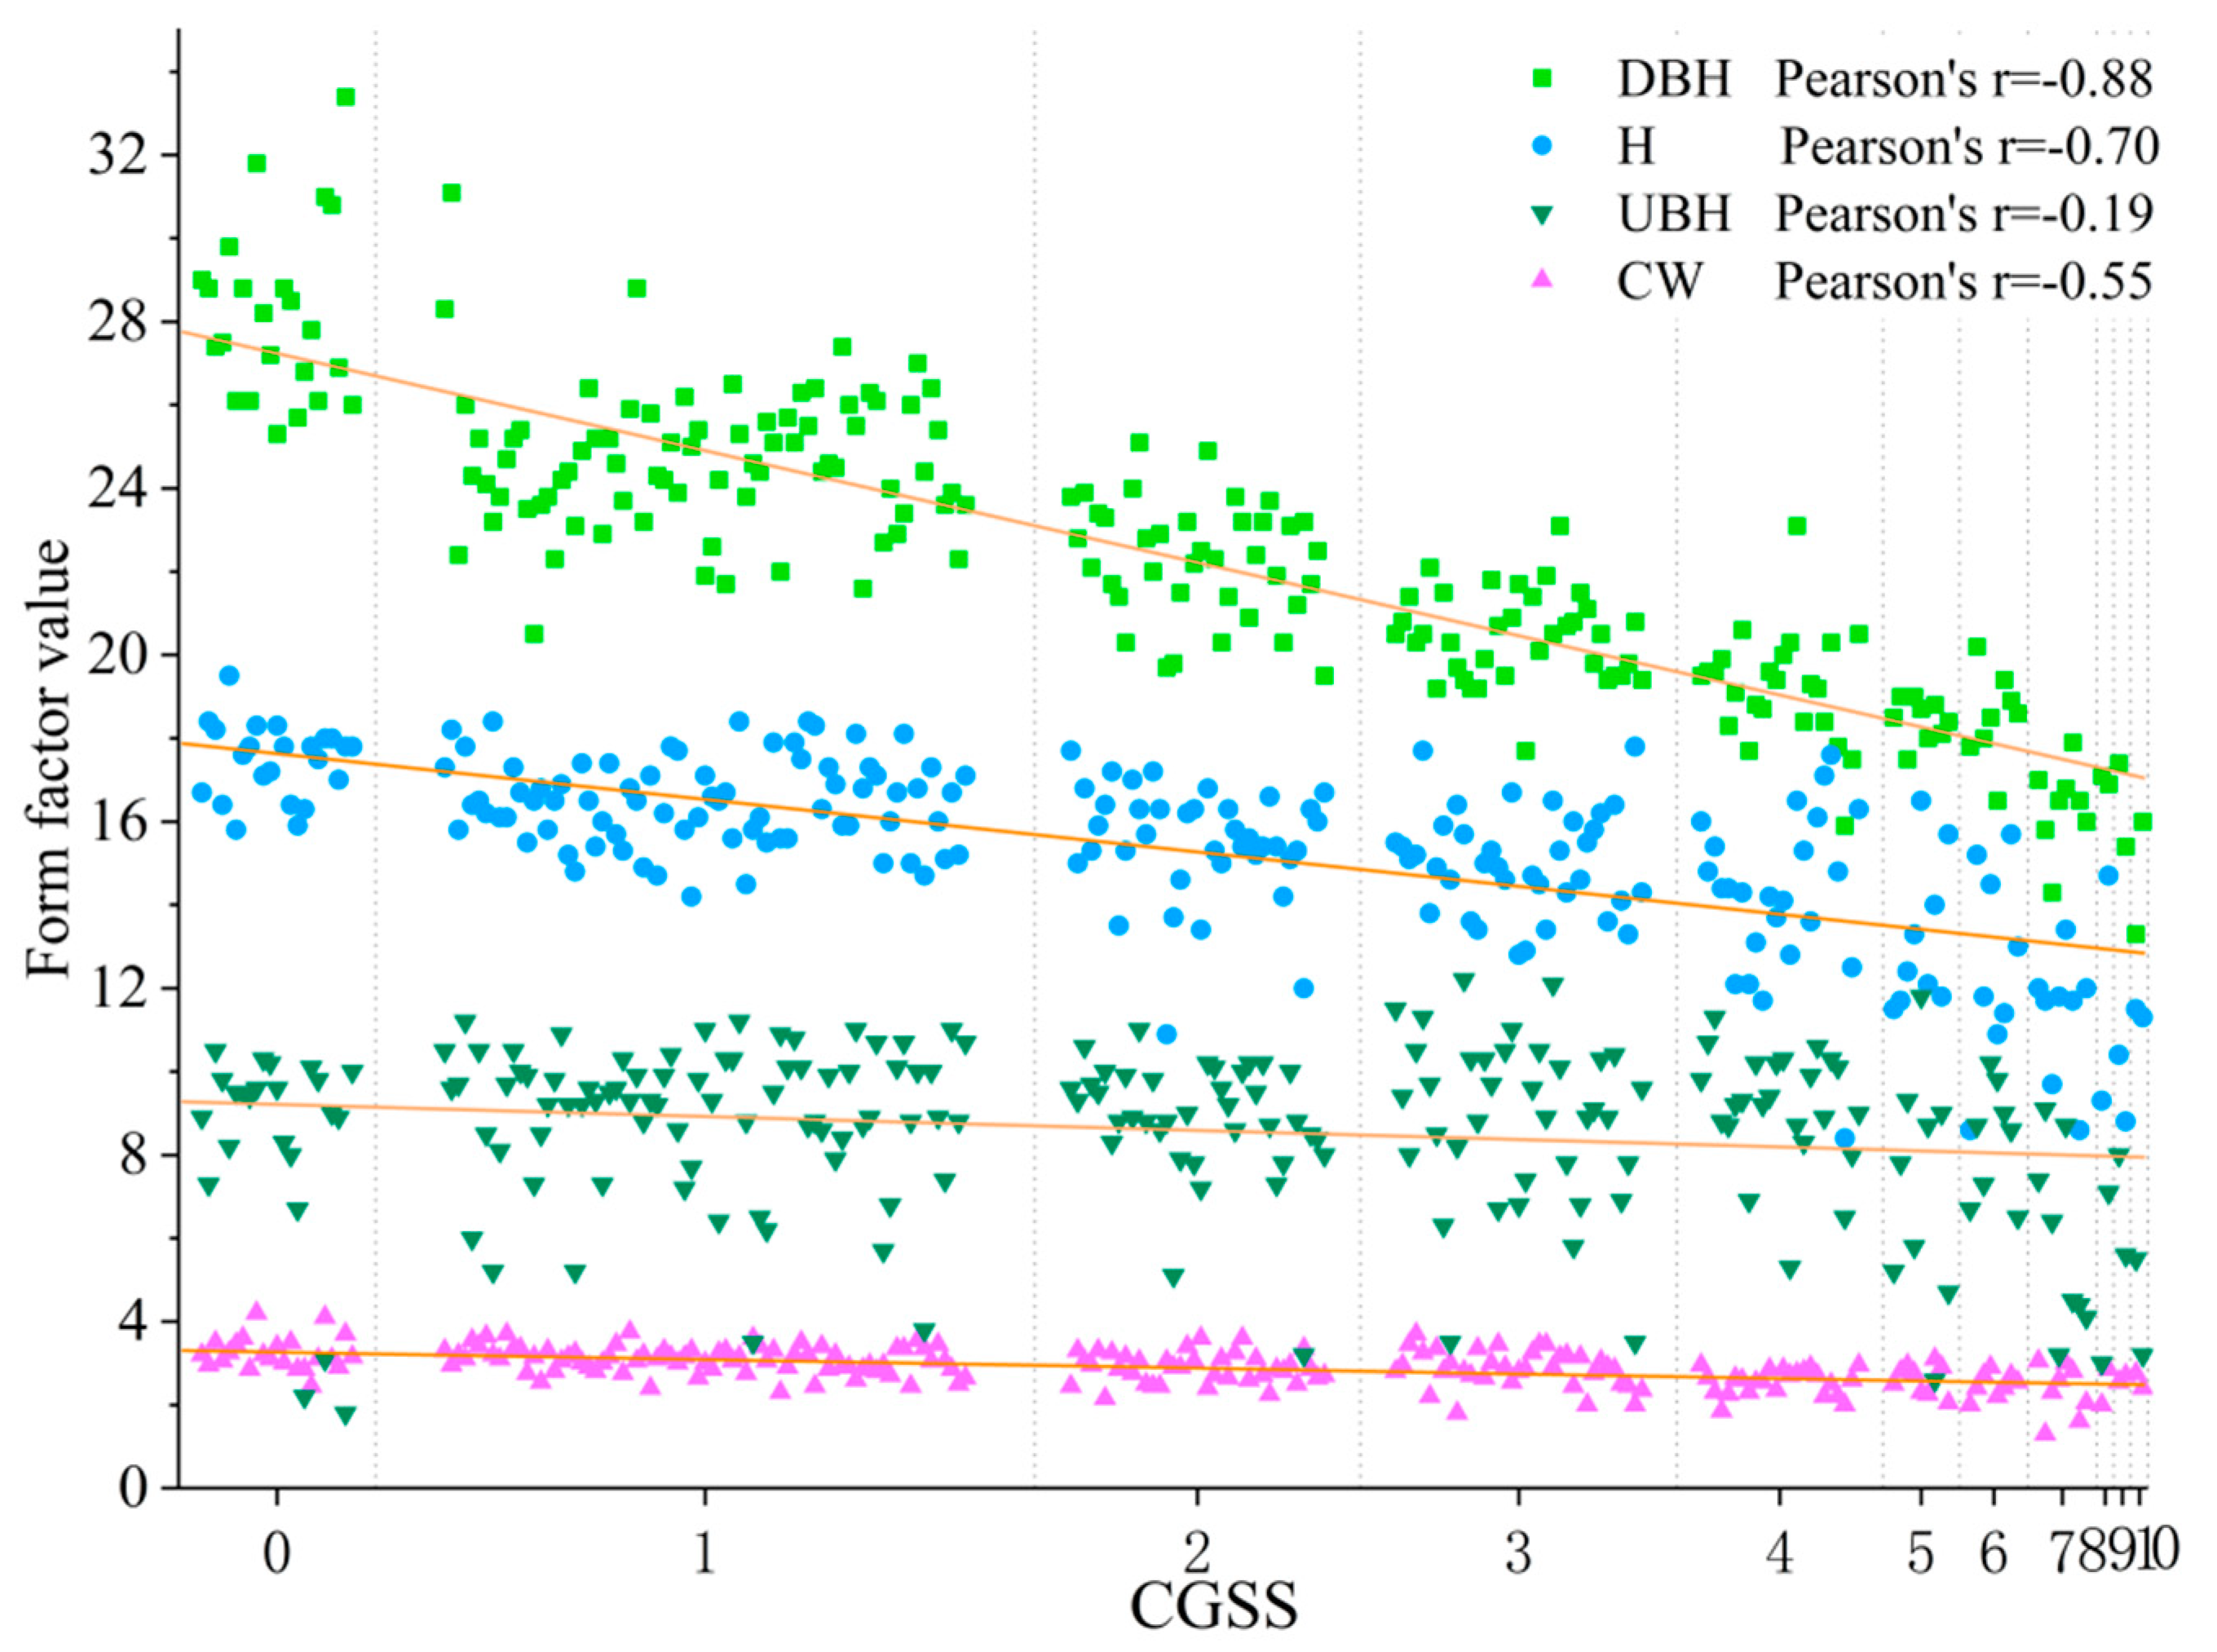
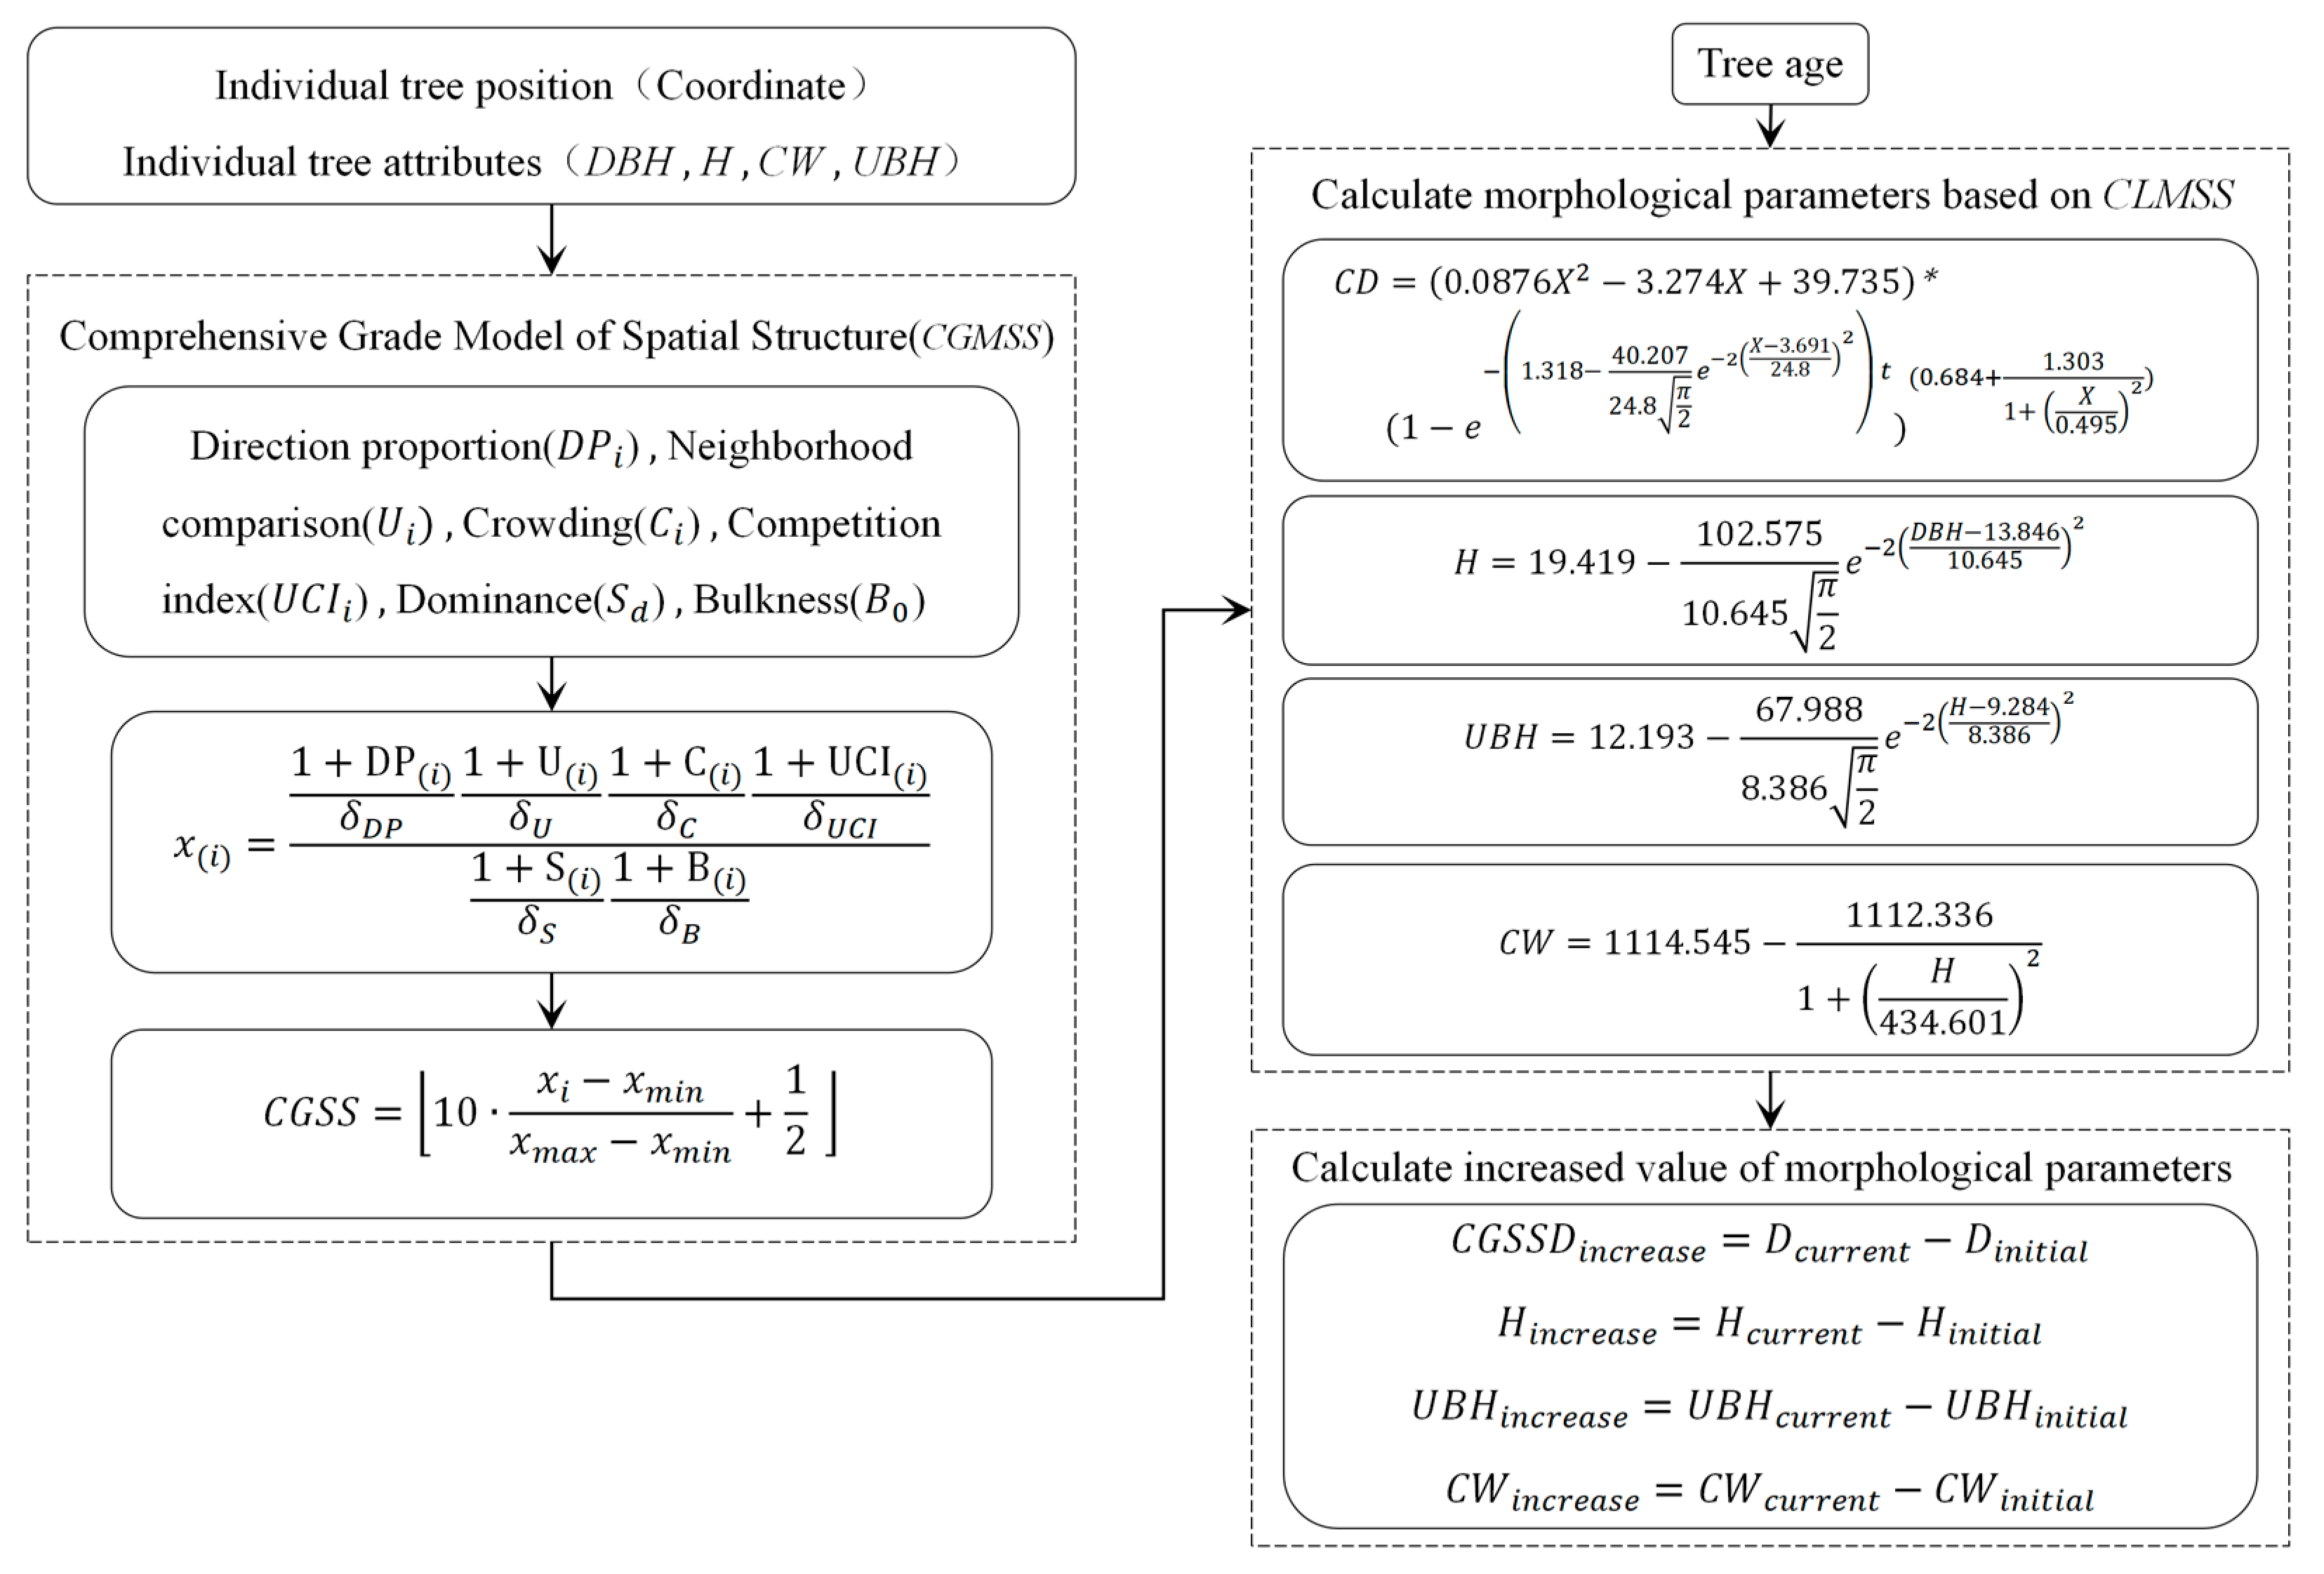
2.2. Construction of Comprehensive Grade Model of Spatial Structure (CGMSS)

The core of comprehensive, integrated, and three-dimensional reflection of the real growth state of a stand is a selection of factors or parameters that can express the growth and spatial structure of different trees in the stand [30], and to evaluate and quantify them [31]. This paper conducts a comprehensive analysis from the three dimensions of individual tree–spatial structure unit–stand, and selects tree spatial advantage degree (S), forest density of stocking (B), direction proportion (DP), neighborhood comparison (U), crowding (C), and forest competition index based on intersection angle (UCI) as parameters to quantitatively describe the growth state of trees. A comprehensive grade model of spatial structural of trees (CGMSS) was constructed using the multiplication and division method to provide a comprehensive and scientific classification of trees in different growth states. Among them, S and B reflect the current growth state and potential maximum growth value of the tree; DP, U, C, and UCI, respectively, reflect the distribution pattern of adjacent trees, the degree of tree differentiation, the degree of crowding, and the magnitude of the competitive pressure on the top of the center tree and on the flanks. The smaller the value of the final calculated comprehensive grade of spatial structure (CGSS), the more sufficient the space for tree growth and the higher the spatial dominance. The calculation formulas and meanings describing each parameter index are shown in Table 2. What needs to be explained is the calculation index of direction proportion proposed in this paper.
In research, the neighborhood pattern parameter is usually used by judging the relationship between the small angle and the standard angle (72°) between the center tree and any two nearest adjacent trees to obtain the random (0.475 < W< 0.517), uniform (W < 0.475), and cluster (W > 0.517) distribution pattern of trees [15]; however, only the relationship between the small angle and the standard angle cannot determine the influence of adjacent trees on the growth of its morphological structure in the specific orientation to the center tree. When considering the distribution of adjacent trees in the east, south, west, and north directions of the center tree [15], as shown in Figure 2a,b, the angle between any two adjacent trees is smaller than the standard angle, i.e., when the value of the neighborhood pattern is 0, the adjacent trees may be distributed in one or two orientations of the center tree. However, when the angle between any two adjacent trees is larger than the standard angle, and the value of neighborhood pattern is 1, the adjacent trees may be distributed in three or four directions of the center tree (Figure 2c,d). To determine the influence of the nearest four adjacent trees on the morphological structure of the center tree in each direction, we use specific parameter values to characterize the number of positions occupied by the adjacent trees in each direction of the center tree. According to the distribution of adjacent trees in the four directions of the center tree, this study proposes the calculation index of direction proportion (DP). Let c i j be the proportion of the nearest four adjacent trees in the east, south, west and north directions of the center tree. When c i j   = 1, it means that the four adjacent trees are in the same direction of the center tree; when c i j   = 2, it means that the four adjacent trees are distributed in two different directions of the center tree; when c i j   = 3, it means that the four adjacent trees are distributed in three different directions of the center tree; when c i j   = 4, it means that the four adjacent trees are evenly distributed in four different directions of the center tree, and finally the calculated expression formula is as follows:
D P i = 1 n j = 1 n c i j ,  
where D P i represents the direction proportion; n represents the number of adjacent trees; D P i ( 0 , 1 ] ,   D P i   takes four values—0.25, 0.5, 0.75, and 1—respectively indicating that the adjacent tree is distributed in 1, 2, 3, and 4 directions of the center tree.
Different parameters are of great significance for analyzing the growth changes in tree morphological structure under different conditions; however, due to the interdependence and mutual exclusion of each parameter, each parameter is required to achieve the best judgment on the growth of tree morphology and structure at the same time, and the above parameters need to be weighed comprehensively. The construction of the CGMSS in this study is shown in Figure 3.
The comprehensive grade value of spatial structure is obtained by synthesizing the six sub-objectives that characterize the growth advantage of trees and the state of spatial structure, and the calculation formula is as follows:
x ( i ) = 1 + D P ( i ) σ D P   ·   1 + U ( i ) σ U ·   1 + C ( i ) σ C   ·   1 + U C I ( i ) σ U C I   [ 1 + S ( i ) ]   ·   σ S   ·   [ 1 + B ( i ) ] ·   σ B ,
where D P ( i ) ,   U ( i ) ,   C ( i ) ,   U C I ( i ) ,   S ( i )   and   ( i ) , respectively, represent direction proportion, neighborhood comparison, crowding, a forest competition index based on intersection angle, tree spatial advantage degree and forest density of stocking, and σ D P , σ U   ,   σ C ,   σ U C I ,   σ S ,   σ B are the standard deviation of direction proportion, neighborhood comparison, crowding, a forest competition index based on intersection angle, tree spatial advantage degree and forest density of stocking, respectively.
To make the data indicators comparable, normalization and other standardized processing methods are usually used to transform the data equivalently into the range of [0, 1]. To analyze and compare the comprehensive grades of the spatial structure of the center tree, this study combined qualitative and quantitative methods [30] to divide the continuous data in the range [0, 1], as shown in Equation (3). By rounding the comprehensive grade value of spatial structure and rounding down, the normalized value is rounded to 0~10, and there are 11 comprehensive grades of tree spatial structure.
CGSS = 10 · x i x m i n x m a x x m i n + 1 2 ,
where CGSS represents the comprehensive grade of spatial structure, x i represents the value of comprehensive grades of the center tree spatial structure before normalization, and x m a x and x m i n represent the maximum and minimum values of the normalized values, respectively.

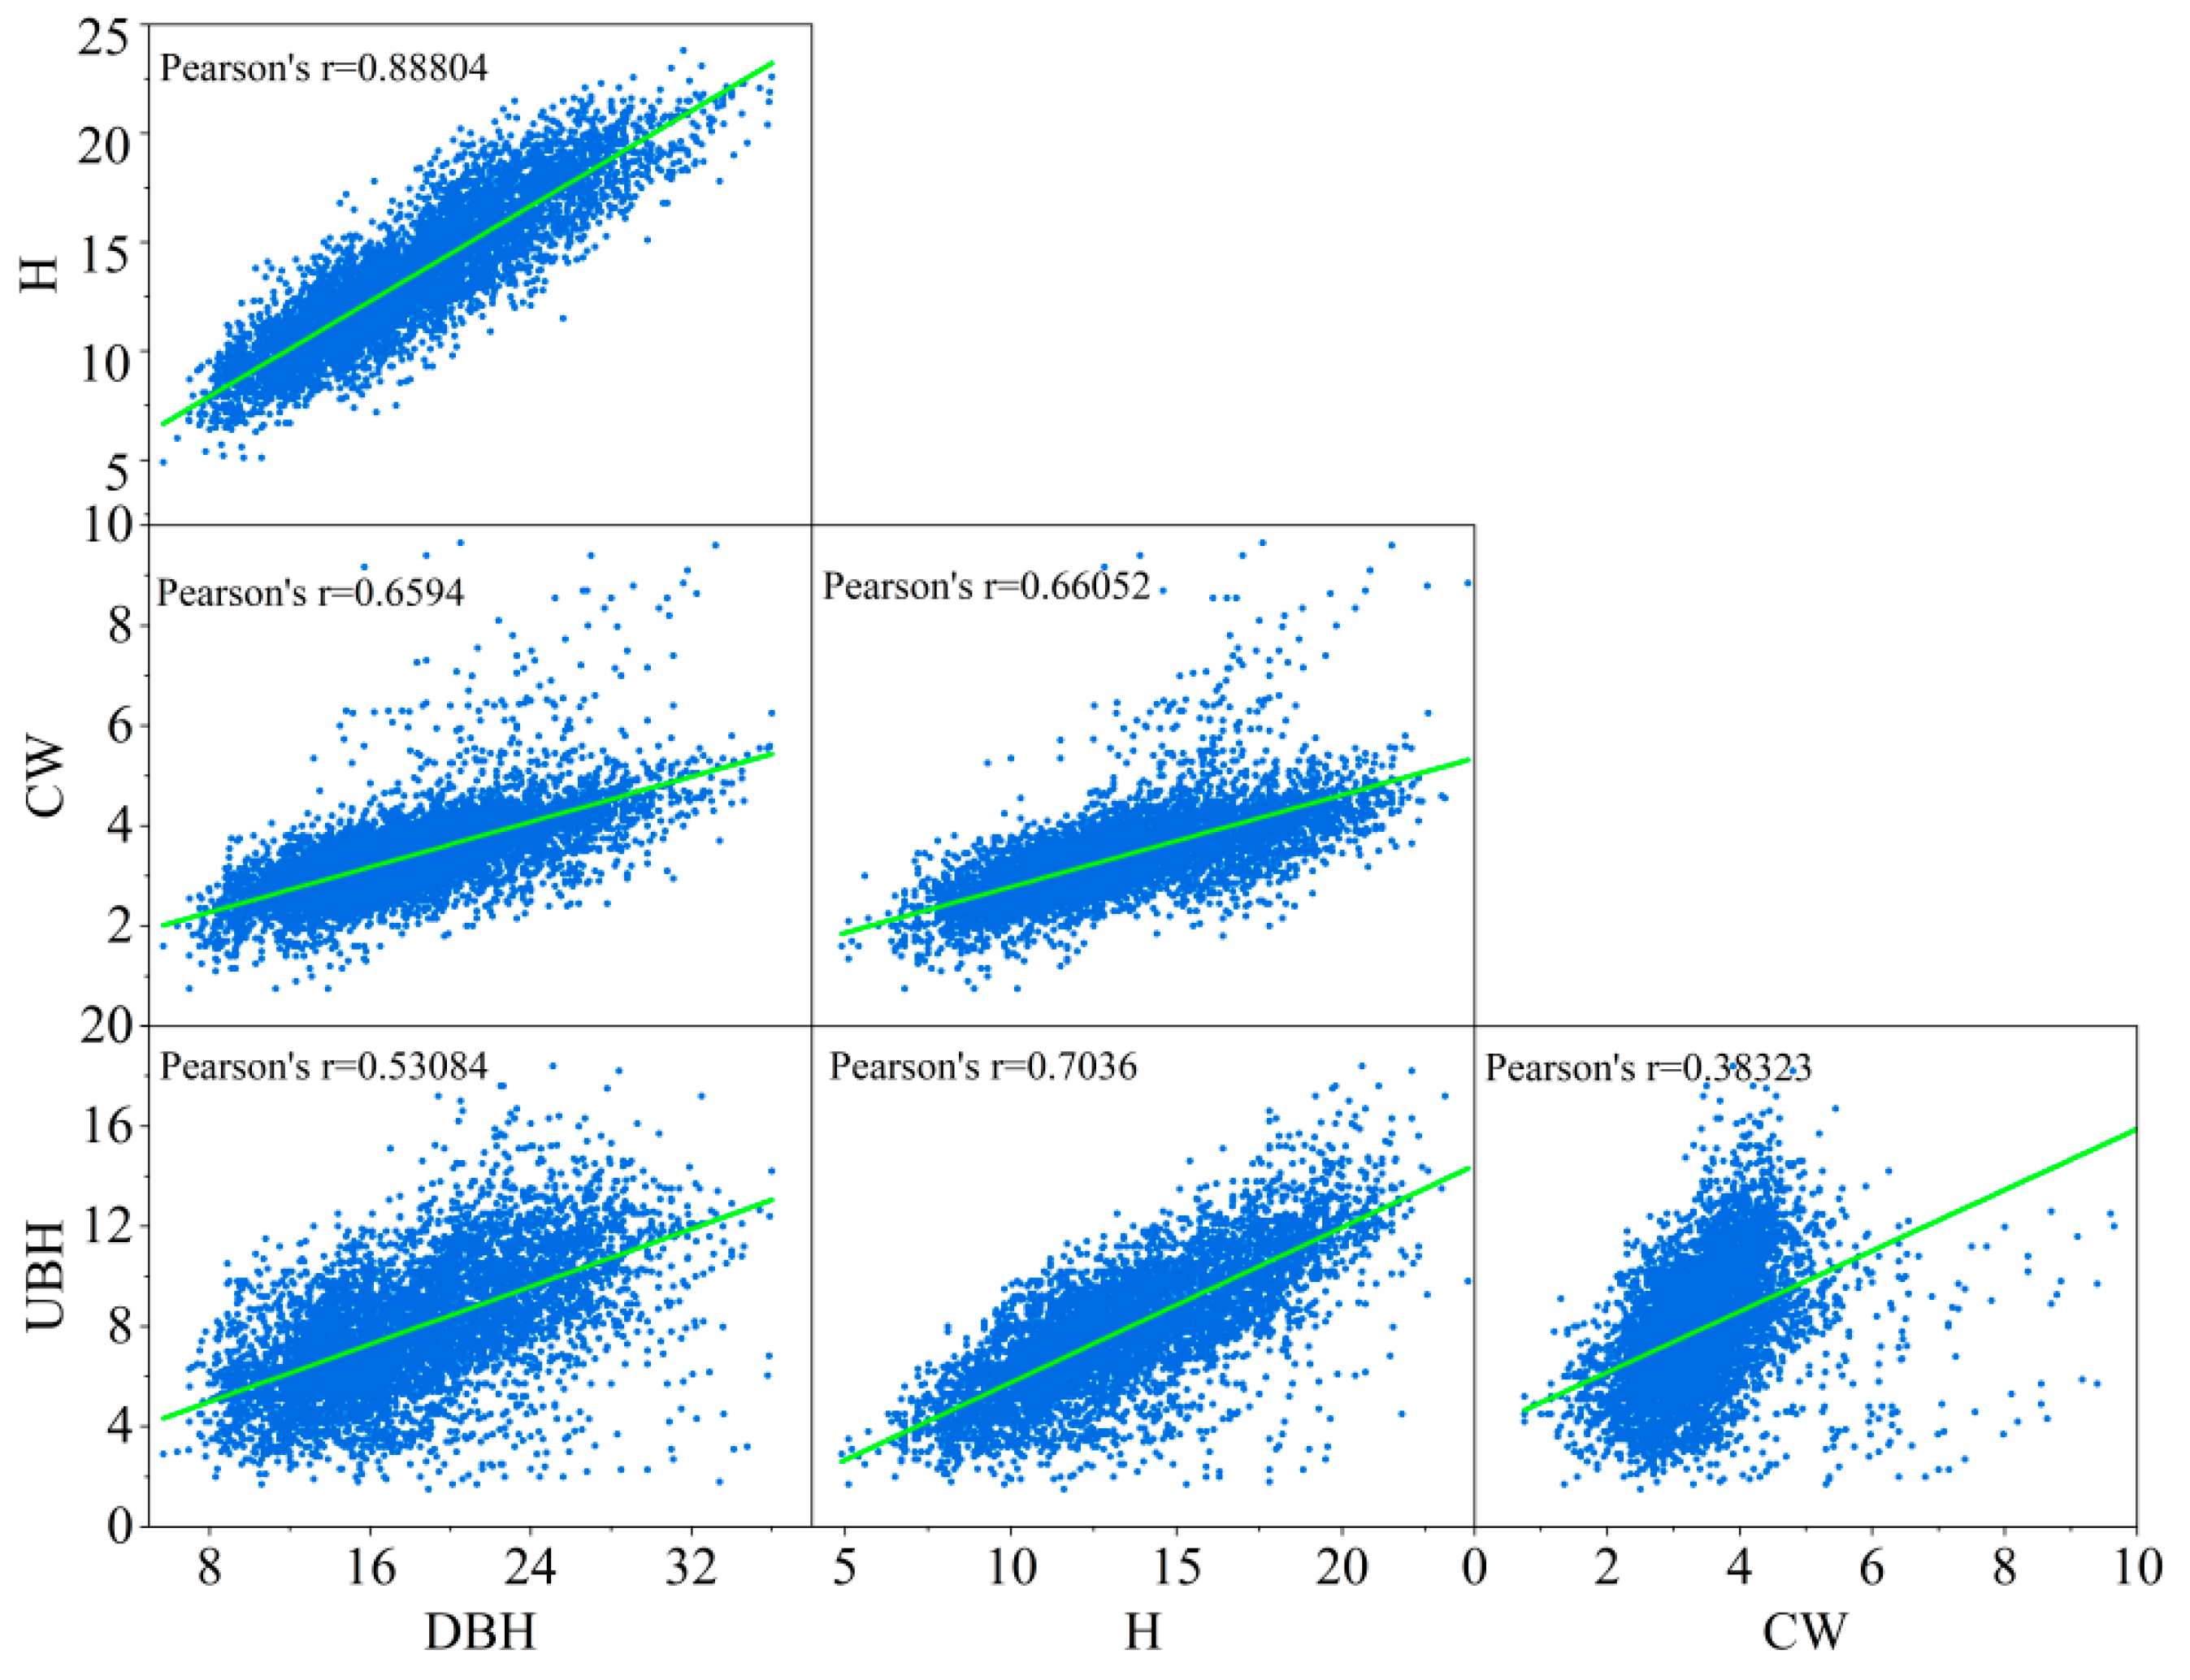
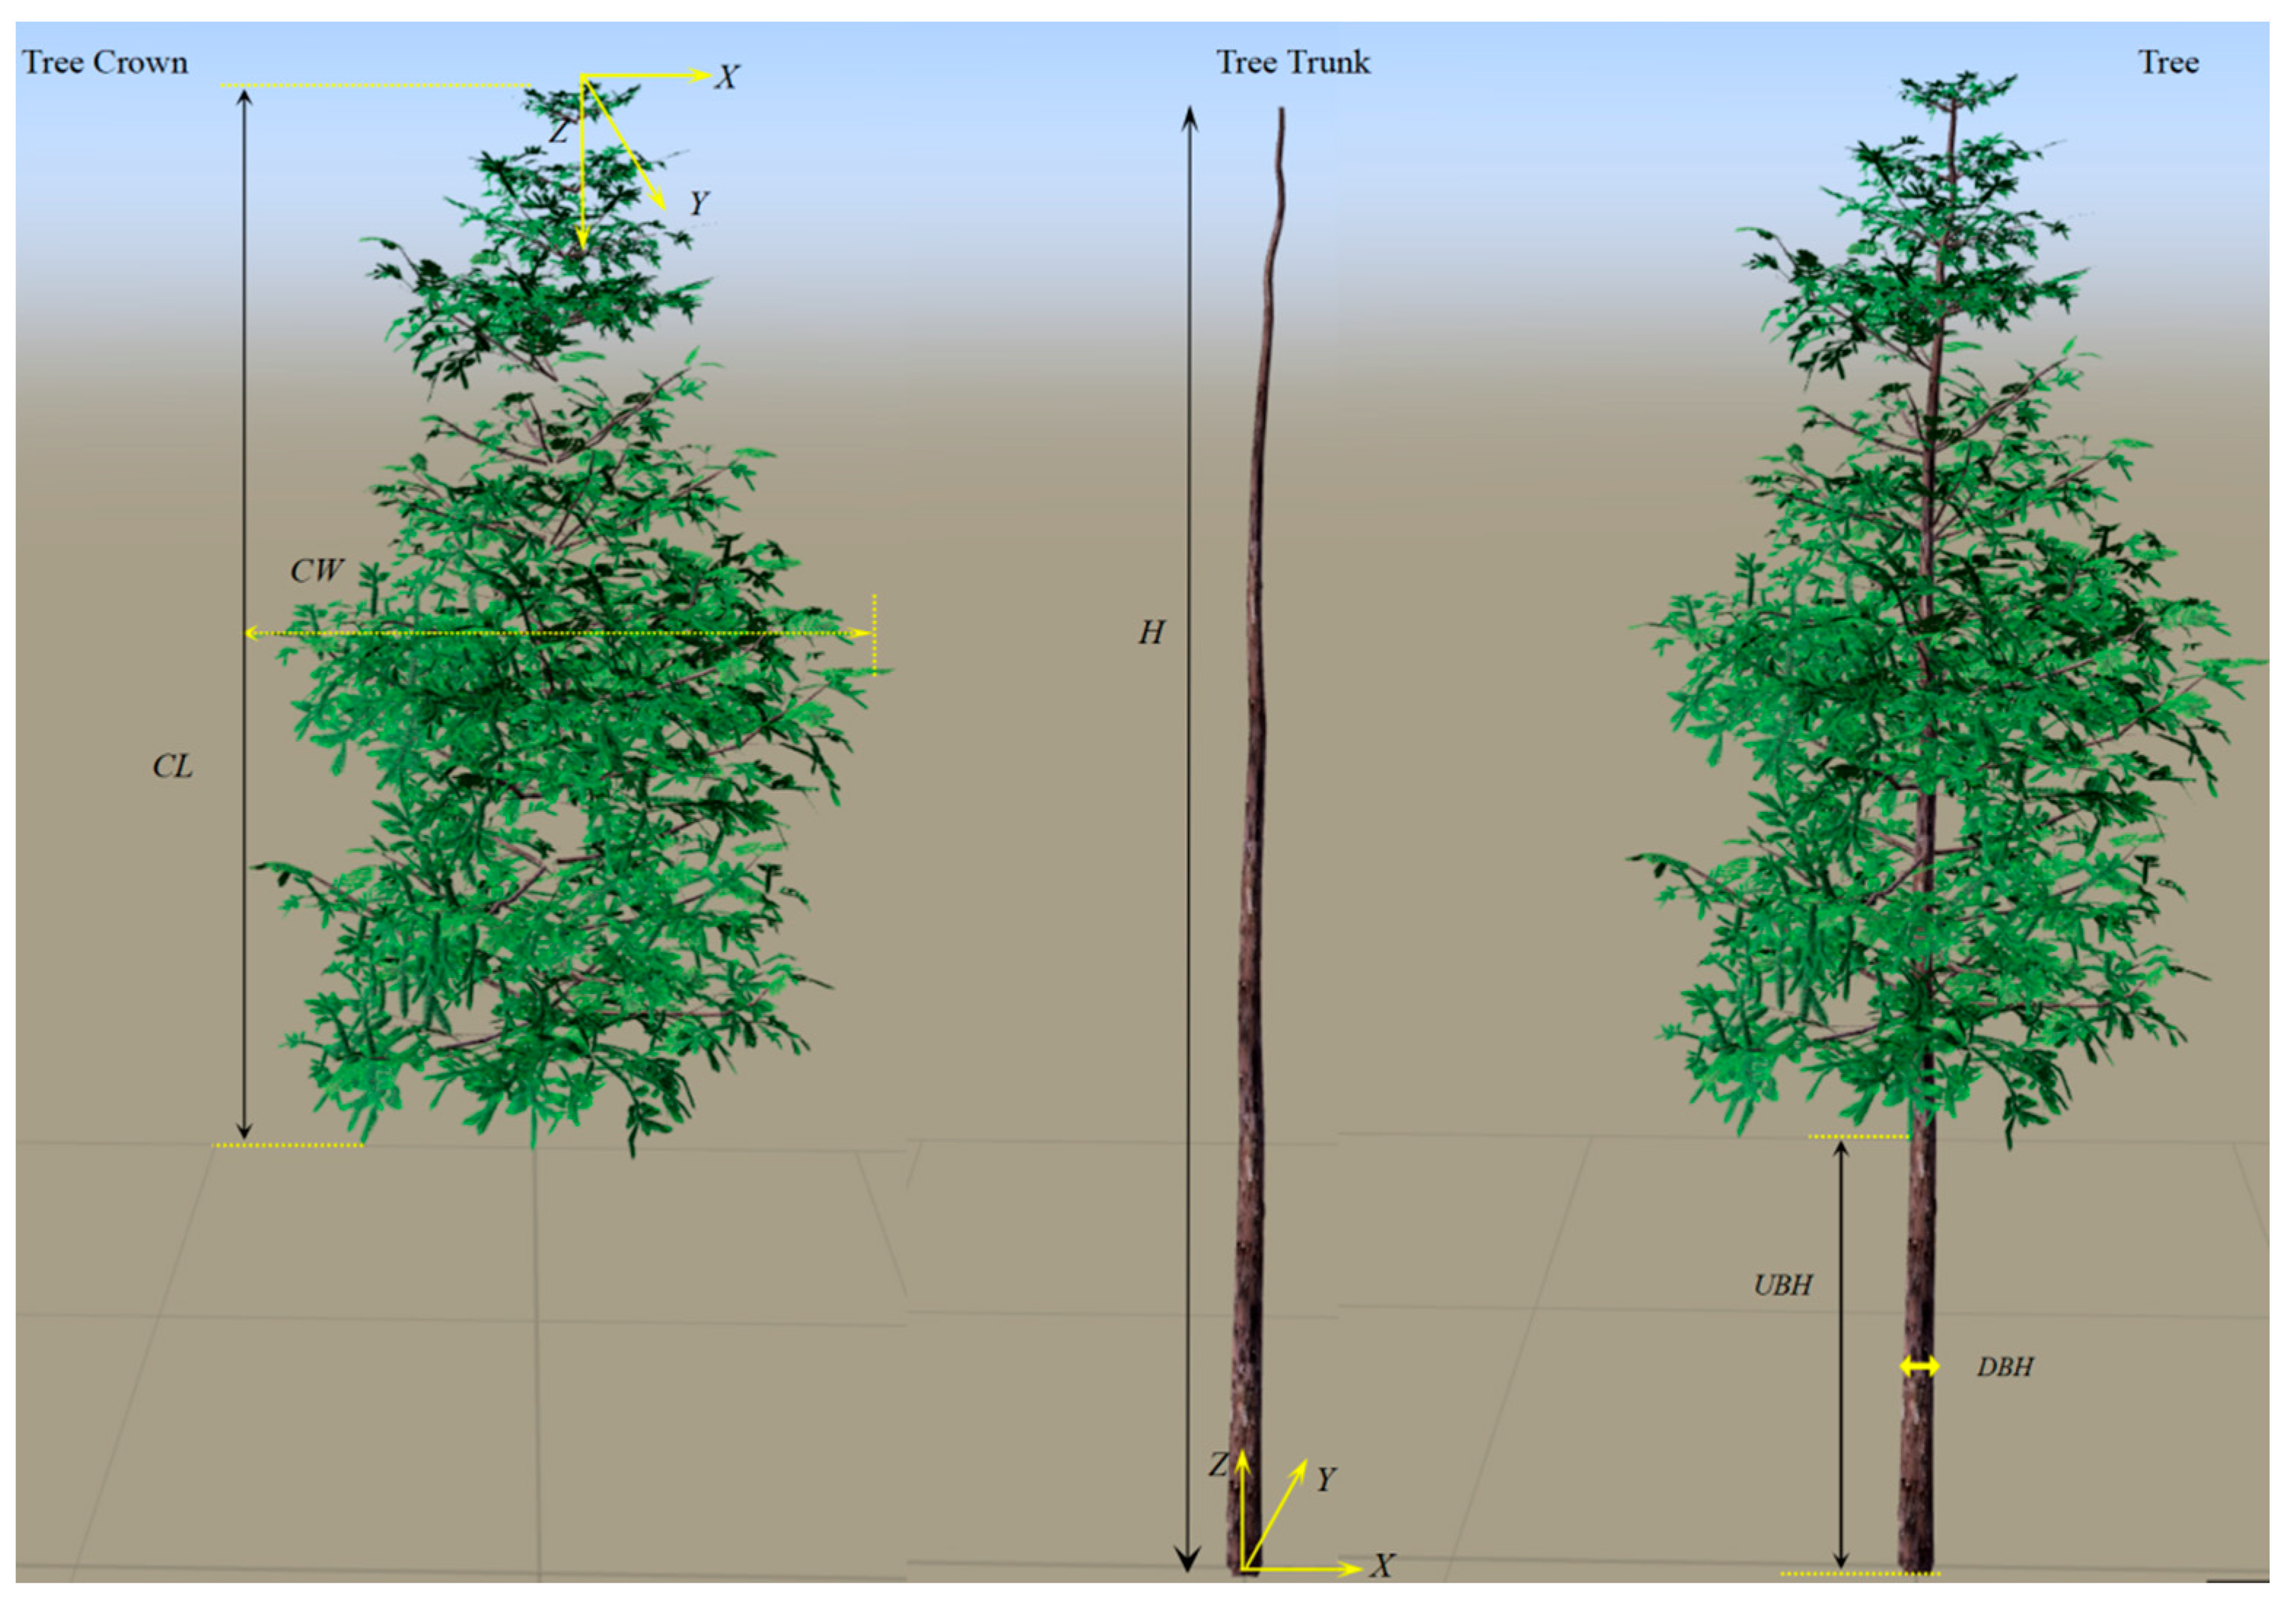
2.3. Fitting of Growth Model of Chinese Fir’s Morphological Structure

2.3.1. DBH Growth Model

The DBH is the basic and the most important variable for expressing both spatial and non-spatial structural characteristics of a stand [37], and it is also the parameter that is easy to obtain relatively and has the highest accuracy in field measurements (accuracy of 0.1 cm) [38,39]. Therefore, DBH is often used as a key variable in predicting tree growth. In this study, the basic growth equation for DBH was established based on the Richards equation [40], as in Equation (4).
D = a ( 1 e k t ) c               a > 0 ,     k > 0 ,     c > 0 ,
where D represents the diameter at breast height; a represents the maximum value of tree growth; k represents the growth rate of the tree; c is related to the shape of the equation curve and determines the location of the inflection point; and t represents the age of the tree. Using this growth equation to fit the tree diameter for different CGSS, 11 DBH growth equations with CGSS of 0 to 10 levels can be obtained. To study the relationship between different grades and growth equation parameters, the function expression f ( x ) between the parameters and CGSS was established by drawing scatter diagrams of   a , k , c   in   the   11   DBH   growth   equations   and the CGSS, respectively. By fitting the correlation analysis between each parameter and the corresponding grade (Figure 4), this paper will use the quadratic polynomial to fit the relationship between a and the rank where it is located and obtain the function f a ( x ) ; the Gauss to fit the relationship between k and the corresponding rank to obtain the function   f k ( x ) ; and the logistics to fit the relationship between c and the rank where it is located to obtain the function   f c ( x ) . The formula is shown in Table 3. We finally obtain the CGMSS-based DBH growth model, as in Equation (5).
C D = f a ( x )   ( 1 e f k ( x ) t ) f c ( x ) ,
where f a ( x ) is to replace parameter a , f k ( x ) is to replace parameter k , and f c ( x ) is to replace parameter c . CD represents the diameter at breast height based on CGMSS, x   represents the comprehensive grade value of the spatial structure of the tree, and   t   represents the current tree age.

2.3.2. H, CW and UBH Growth Model

As basic parameters of tree morphological structure [39], DBH, H, CW and UBH are often used as predictors of forest growth models [41]. We conducted a matrix analysis on 1008 Chinese firs whose spatial structure had not changed (Figure 5) and found that the correlation coefficient between H and DBH was the highest at 0.89, followed by the correlation coefficients between H and UBH and CW at 0.70 and 0.66, respectively. Through nonlinear fitting analysis among various morphological structure factors, this study intends to use the Gauss function describing the relationship between DBH and H and H and UBH, and use the logistic function describing the relationship between H and CW. The expressions are shown in Table 4.

2.4. Evaluation of Model Accuracy

To scientifically and objectively evaluate the fitting effect and validity of the model, this study first used the determination adjustment coefficient ( R 2 , Equation (12)), residual sum of squares (RSS, Equation (13)), root mean square error (RMSE, Equation (14)), and mean absolute error (MAE, Equation (15)) [42] to evaluate the fitting accuracy and applicability of models for DBH, H, CW and UBH, then used the systematic error (Equation (16)) and prediction accuracy (Equation (17)) to test the effectiveness of the Chinese fir growth model based on CGMSS and SSU, respectively, and the expressions are as follows.
R a d j 2 = 1 i = 1 n ( y i y i ^ ) 2 / ( n p 1 ) i = 1 n ( y i y i ¯ ) 2 / ( n 1 ) ,
RSS = i = 1 n ( y i y i ^ ) 2 ,
RMSE = 1 n k i = 1 n ( y i y i ^ ) 2 ,
MAE = 1 n i = 1 n | y i y i ^ | ,
Systematic   error = 1 n y ^ i y i y i × 100 % ,
Accuracy = 1 t × ( y i y ^ i ) 2 y ¯ ^ × n ( n k ) ,
where   y i , y i ¯ , y i ^ , y ¯ ^ , n , p k , t , respectively, represent the observed value, the average of the observed value, the predicted value, the average of the predicted value, the number of samples, the number of independent variables in the model, the number of parameters in the model, and the   t   distribution value of the confidence level   α .

2.5. Dynamic Visual Simulation of Chinese Fir Morphological Structure

In this study, Unreal Engine 4 (UE4) was used as the visualization platform for the Chinese fir forest [43]. First, using the tree-modeling software combined with the model sample, the Chinese fir foundation subdivision model was made, and it was divided into two parts: the crown and the trunk. The coordinate origin (0, 0, 0) of the trunk model at the root was set, took the tree height as the Z-axis variation value of the crown model was taken, and the coordinate origin (0, 0, H) of the crown model at the top of the crown was set, as shown in Figure 6. Using the UE4 blueprint system, through the development of the growth control blueprint of DBH, H, CW, and UBH of Chinese fir, the subdivision model of Chinese fir was coupled with the growth model of morphological structure based on CGMSS, and used the time axis animation curve technology to realize the visual simulation of the differential growths of Chinese fir forest morphology and structure.

3. Results

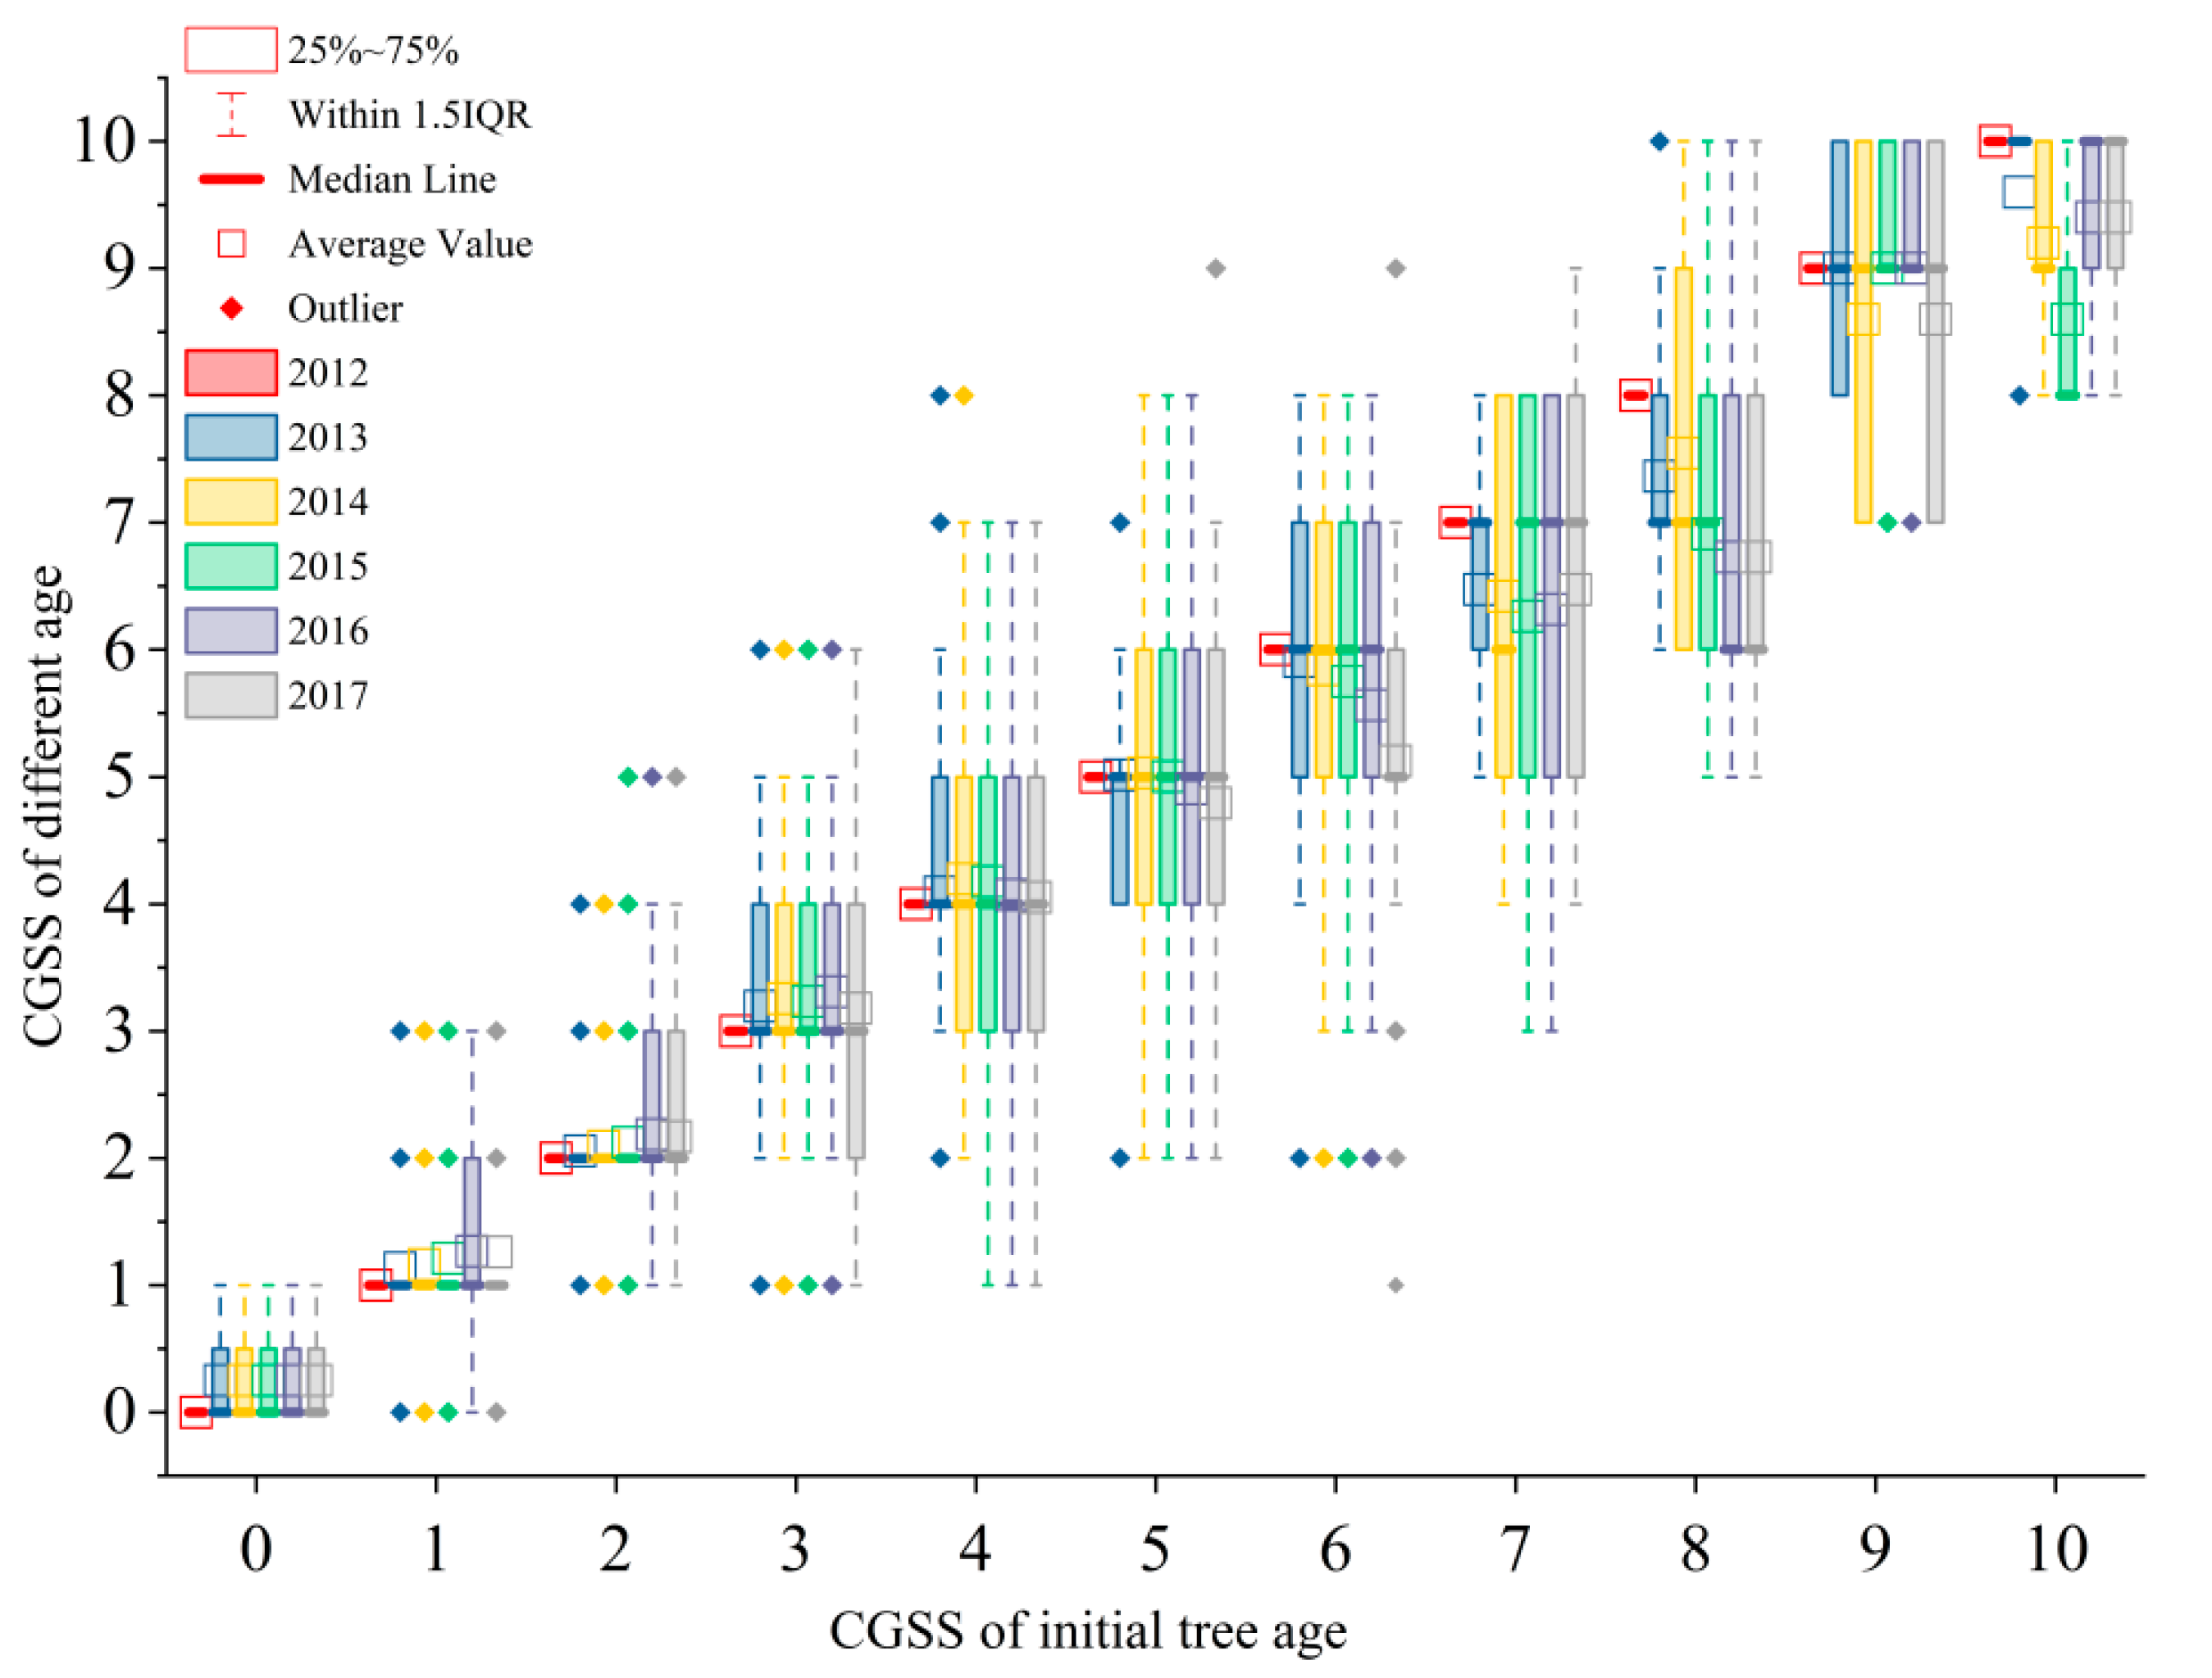
3.1. Comprehensive Grade Model of Spatial Structure (CGMSS)

It can be seen from Table 5 that, except for some of the Pearson correlation coefficients between the crown width of Chinese fir and other morphological factors, CGSS = 1–4 are slightly lower than those when the correlation analysis is carried out without considering the classification of forest trees, and the correlation coefficients among the other grades of morphological structure factors are all higher than the former. As the CGSS value increases, the correlation among morphological factors becomes higher, demonstrating that the use of CGMSS to classify trees in a stand into classes can improve the correlation among tree morphological structure factors better and achieve a more accurate simulation of tree morphological structure under different growth and spatial structures.
When CGSS = 0, tree morphological structure parameters (DBH, H, UBH, CW) are at the maximum state (Figure 7). However, with the gradual increase of CGSS, each morphological structure parameter gradually decreases and shows a significant negative correlation with CGSS. According to the CGMSS calculation, when CGSS = 0, it indicates that the trees in the stand have the maximum growth potential and the growth is not constrained by other neighboring trees. However, as the value of CGSS increasing the potential growth of trees will become less and less, and the competition with the nearest neighboring trees will become more intense. Therefore, when CGSS = 10, its morphological parameters are all the minimum, the tree growth space is severely squeezed, and the growing competitive pressure will also reach the maximum. We also analyzed 1008 center trees with unchanged adjacent trees and obtained that the CGSS at different stand ages basically remained the same as the rank classified at the initial stand age (Figure 8), indicating that the growth condition and spatial structure environment of the classified CGSS will remain relatively unchanged in stands where the spatial structure tends to be stable.
The above results indicate that the CGMSS constructed in this study can make comprehensive judgments and give reasonable ranks to trees with different degrees of growth dominance and spatial structure environment in the stand, while the results of center tree classification are relatively stable for neighboring trees that have not changed.

3.2. Morphological–Structural Growth Model of CHINESE Fir

As shown in Table 6, the R a d j 2 of the three parameter models of f a ( x ) , f k ( x ) and f c ( x ) are more than 0.8. Since parameter a represents the maximum value of DBH growth, the residuals of the predicted values are usually greater than 1, so the RSS is relatively large. The RSS value of each model shows that all three models can express the correlation between parameters and CGSS, and have high fitting accuracy. Substituting the three parameter models into the base DBH growth equation (Equation (4)), we obtain that the R a d j 2 = 0.836 of the CGMSS-based DBH growth model (CD) is higher than the R a d j 2 = 0.5 of the base DBH growth model (D), and the results show that CGMSS improves the fitting accuracy of DBH growth. The R a d j 2 of the H, UBH and CW growth models are 0.871, 0.703 and 0.658, respectively, and the RMSE and MAE are basically less than 1, implying that the fitted model has good applicability.
The CD model is used to test the DBH of trees divided into grades in the forest, and the estimated accuracy of DBH of 0–10 grades is at least 79.19% (Table 7). Combined with Figure 9, it can be seen that the prediction accuracy of more than 73.5% of the trees is above 85%. A negative value in the systematic error indicates that the predicted value is lower than the observed value [44]. Among all levels, the minimum prediction accuracies of the H, CW, and UBH growth models are 73%, 80%, and 55%, respectively, while the percentages of trees with an estimated accuracy greater than 85% are 69.6%, 85.2%, and 54.3%, respectively. From the prediction accuracy and error of each grade, except for the fluctuation of grades 3–5, the prediction accuracy of the rest of the grades is basically more than 80%, the systematic error is less than 10%, and their changes show a fluctuating downward and then upward trend with the increase of CGSS.
In this paper, to verify the accuracy of the CGMSS-based Chinese fir morphological–structural growth model for simulating Chinese fir in different growth states, it was compared with the Chinese fir growth model [27] constructed based on the spatial structure unit (SSU) and integrated with independent spatial structure parameters in the existing research. Table 8 shows the results of the index test of the SSU-based Chinese fir growth model. The overall prediction accuracy of the CGMSS- and SSU-based Chinese fir DBH, H, CW, and UBH growth models reach more than 92% when the CGMSS classification classes are not applied to the sample data for analysis, indicating that both growth models can achieve accurate simulation of most of the morphological–structural growth changes in Chinese fir. In Table 8, the value of systematic error indicates that the estimated value of DBH, H and UBH is high, and the estimated value of CW is low. However, when applying CGMSS classification to individual trees in a forest and testing for different grades of trees, the lowest values of prediction accuracy of SSU-based Chinese fir DBH, H, CW and UBH growth models are obtained below 55%. The proportions of these models for the number of trees with prediction accuracies above 85% in each grade are 66.1%, 86.5%, 16.5%, and 86.5%, respectively, but as the CGSS gradually increases, the prediction accuracy of each model decreases significantly and has great systematic errors. Among them, the prediction accuracy of the DBH growth model at levels 4–10, the H growth model at levels 8–10, the UBH growth model at levels 7–10 and the CW growth model at levels 5–10 are less than 80%. However, the average prediction accuracy of CGMSS’s Chinese fir morphological structure growth model is basically greater than 85% at levels 5–10 except for UBH, and the prediction accuracy of CGMSS’s UBH growth model is equally better than that of the SSU-based UBH growth model obtained from Table 7 and Table 8. The above results show that the CGMSS-based Chinese fir growth model proposed in this study can achieve a better fit at the stand level and provide a more realistic simulation of the growth of trees in different growth states in the stand, especially for trees with limited growth space and fierce competition (CGSS = 5–10), and the results are better than those of the SSU Chinese fir growth model.

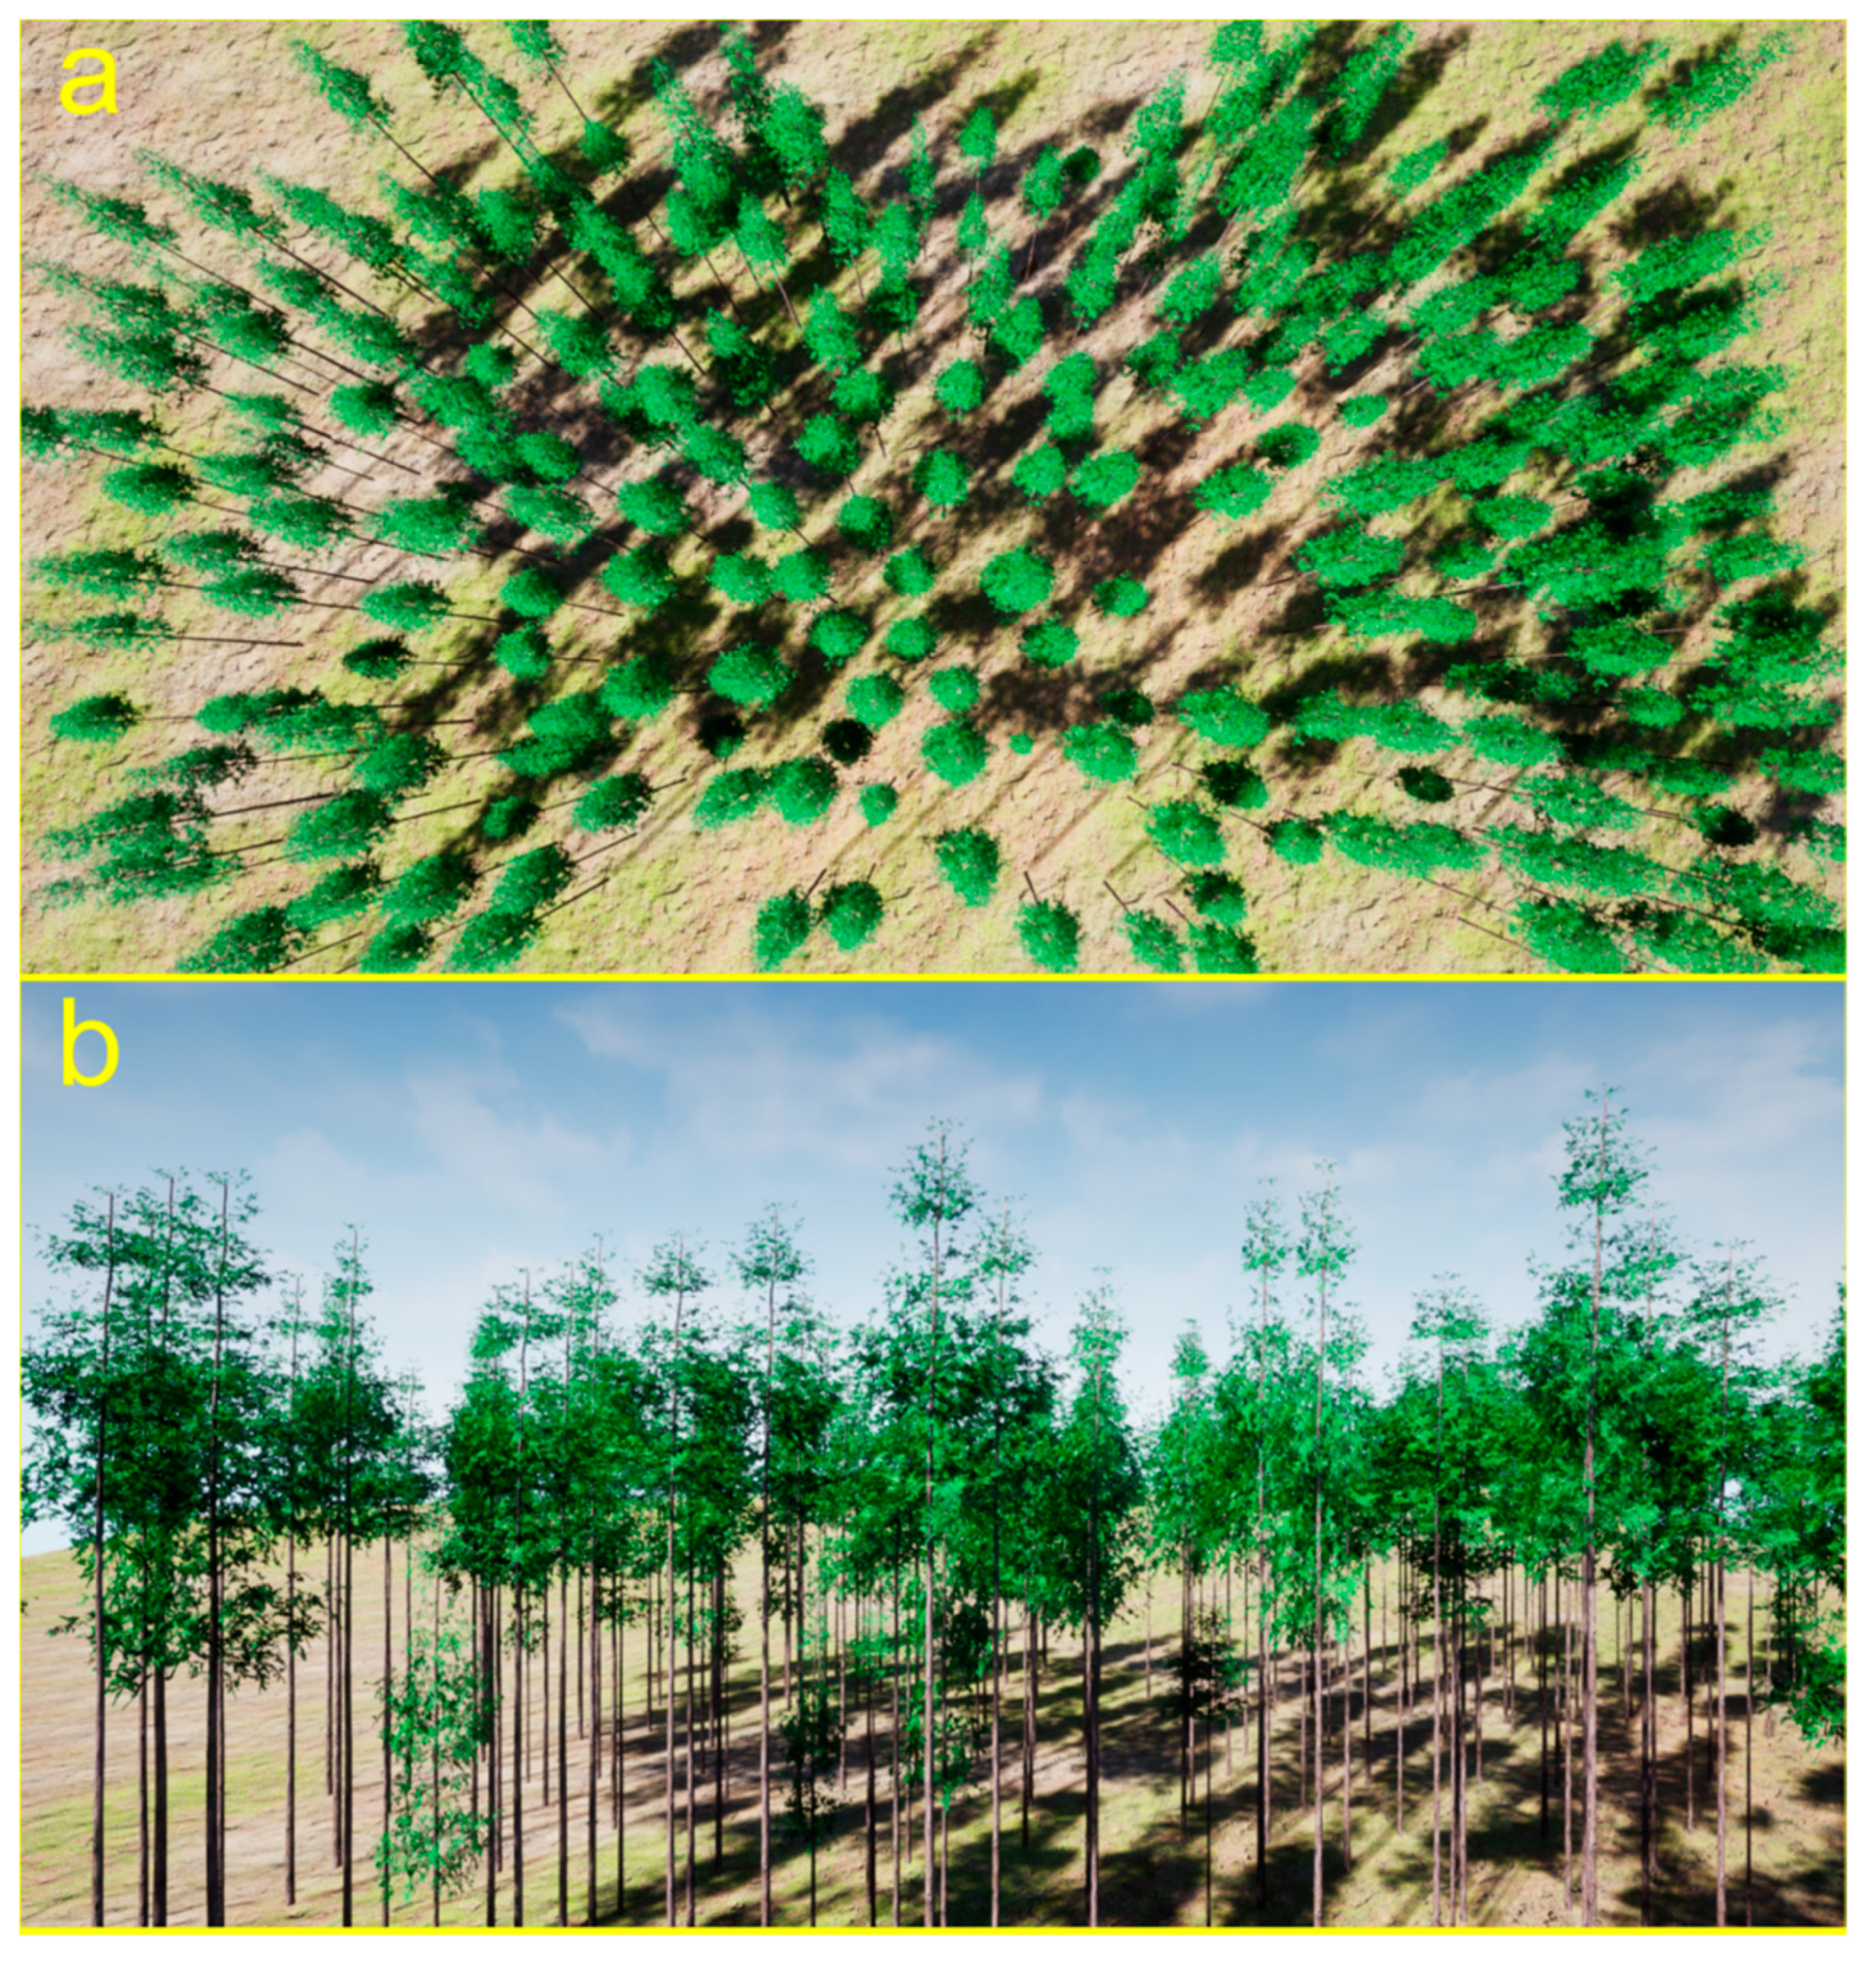
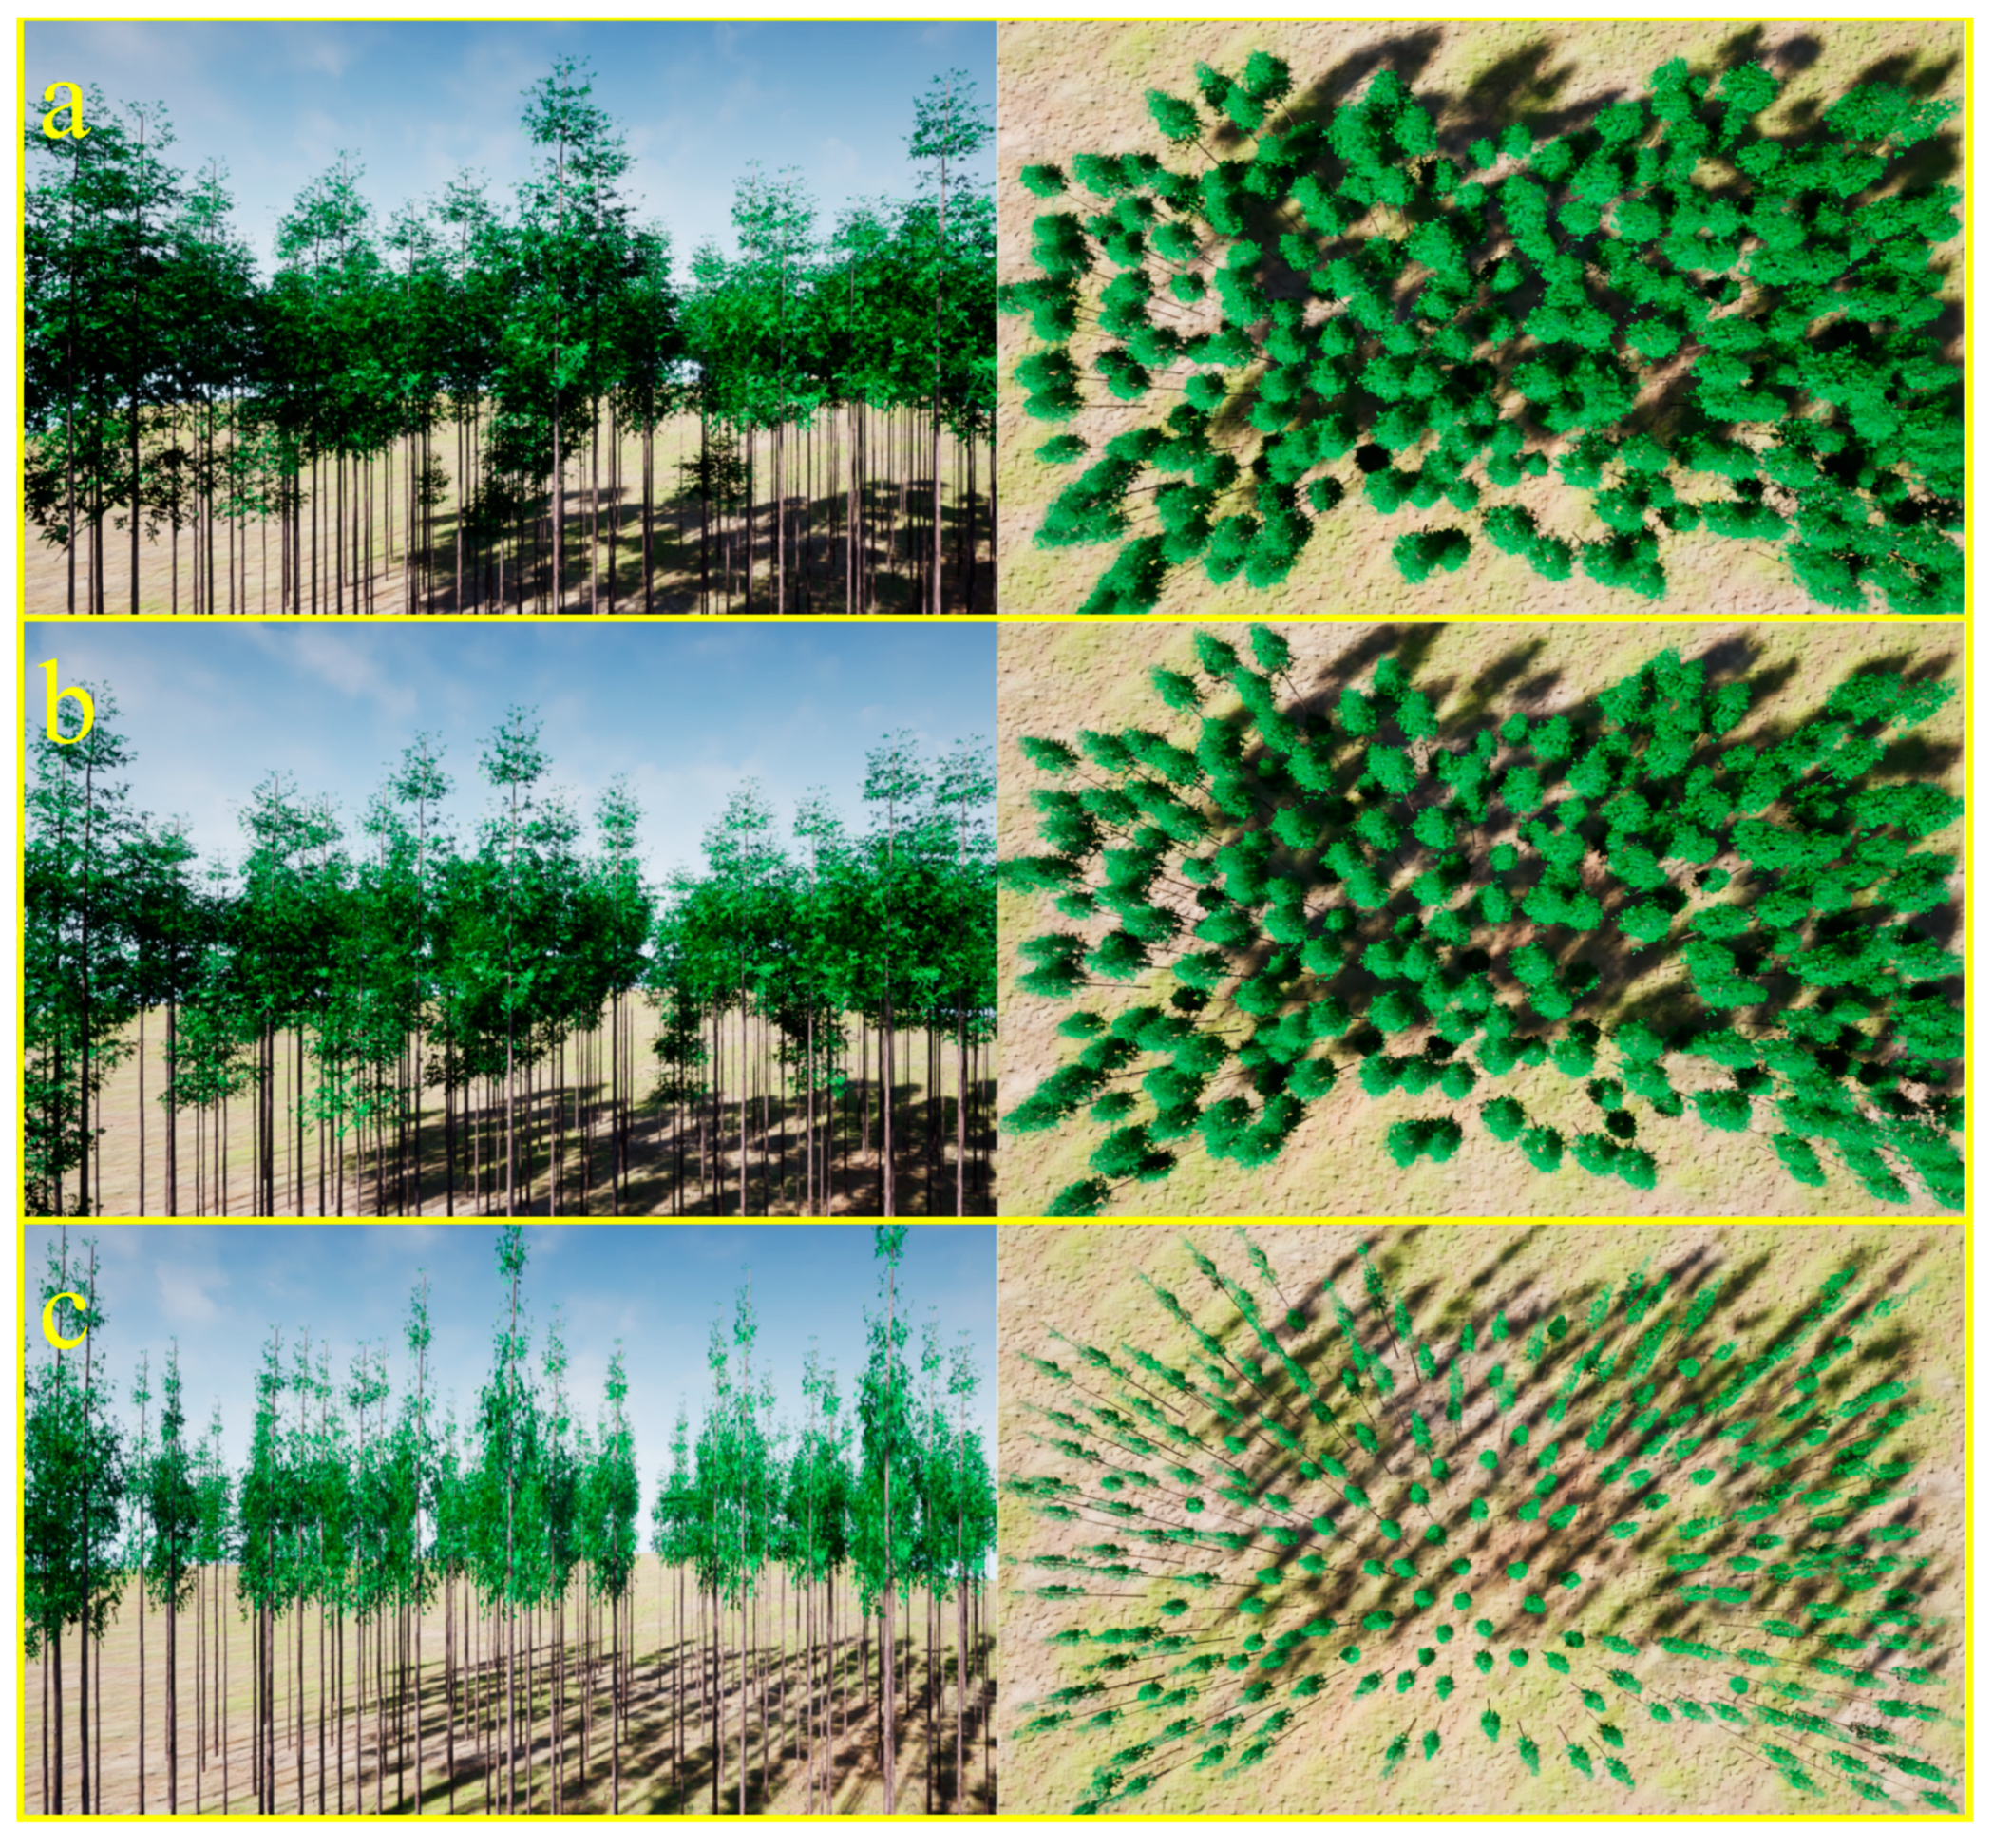
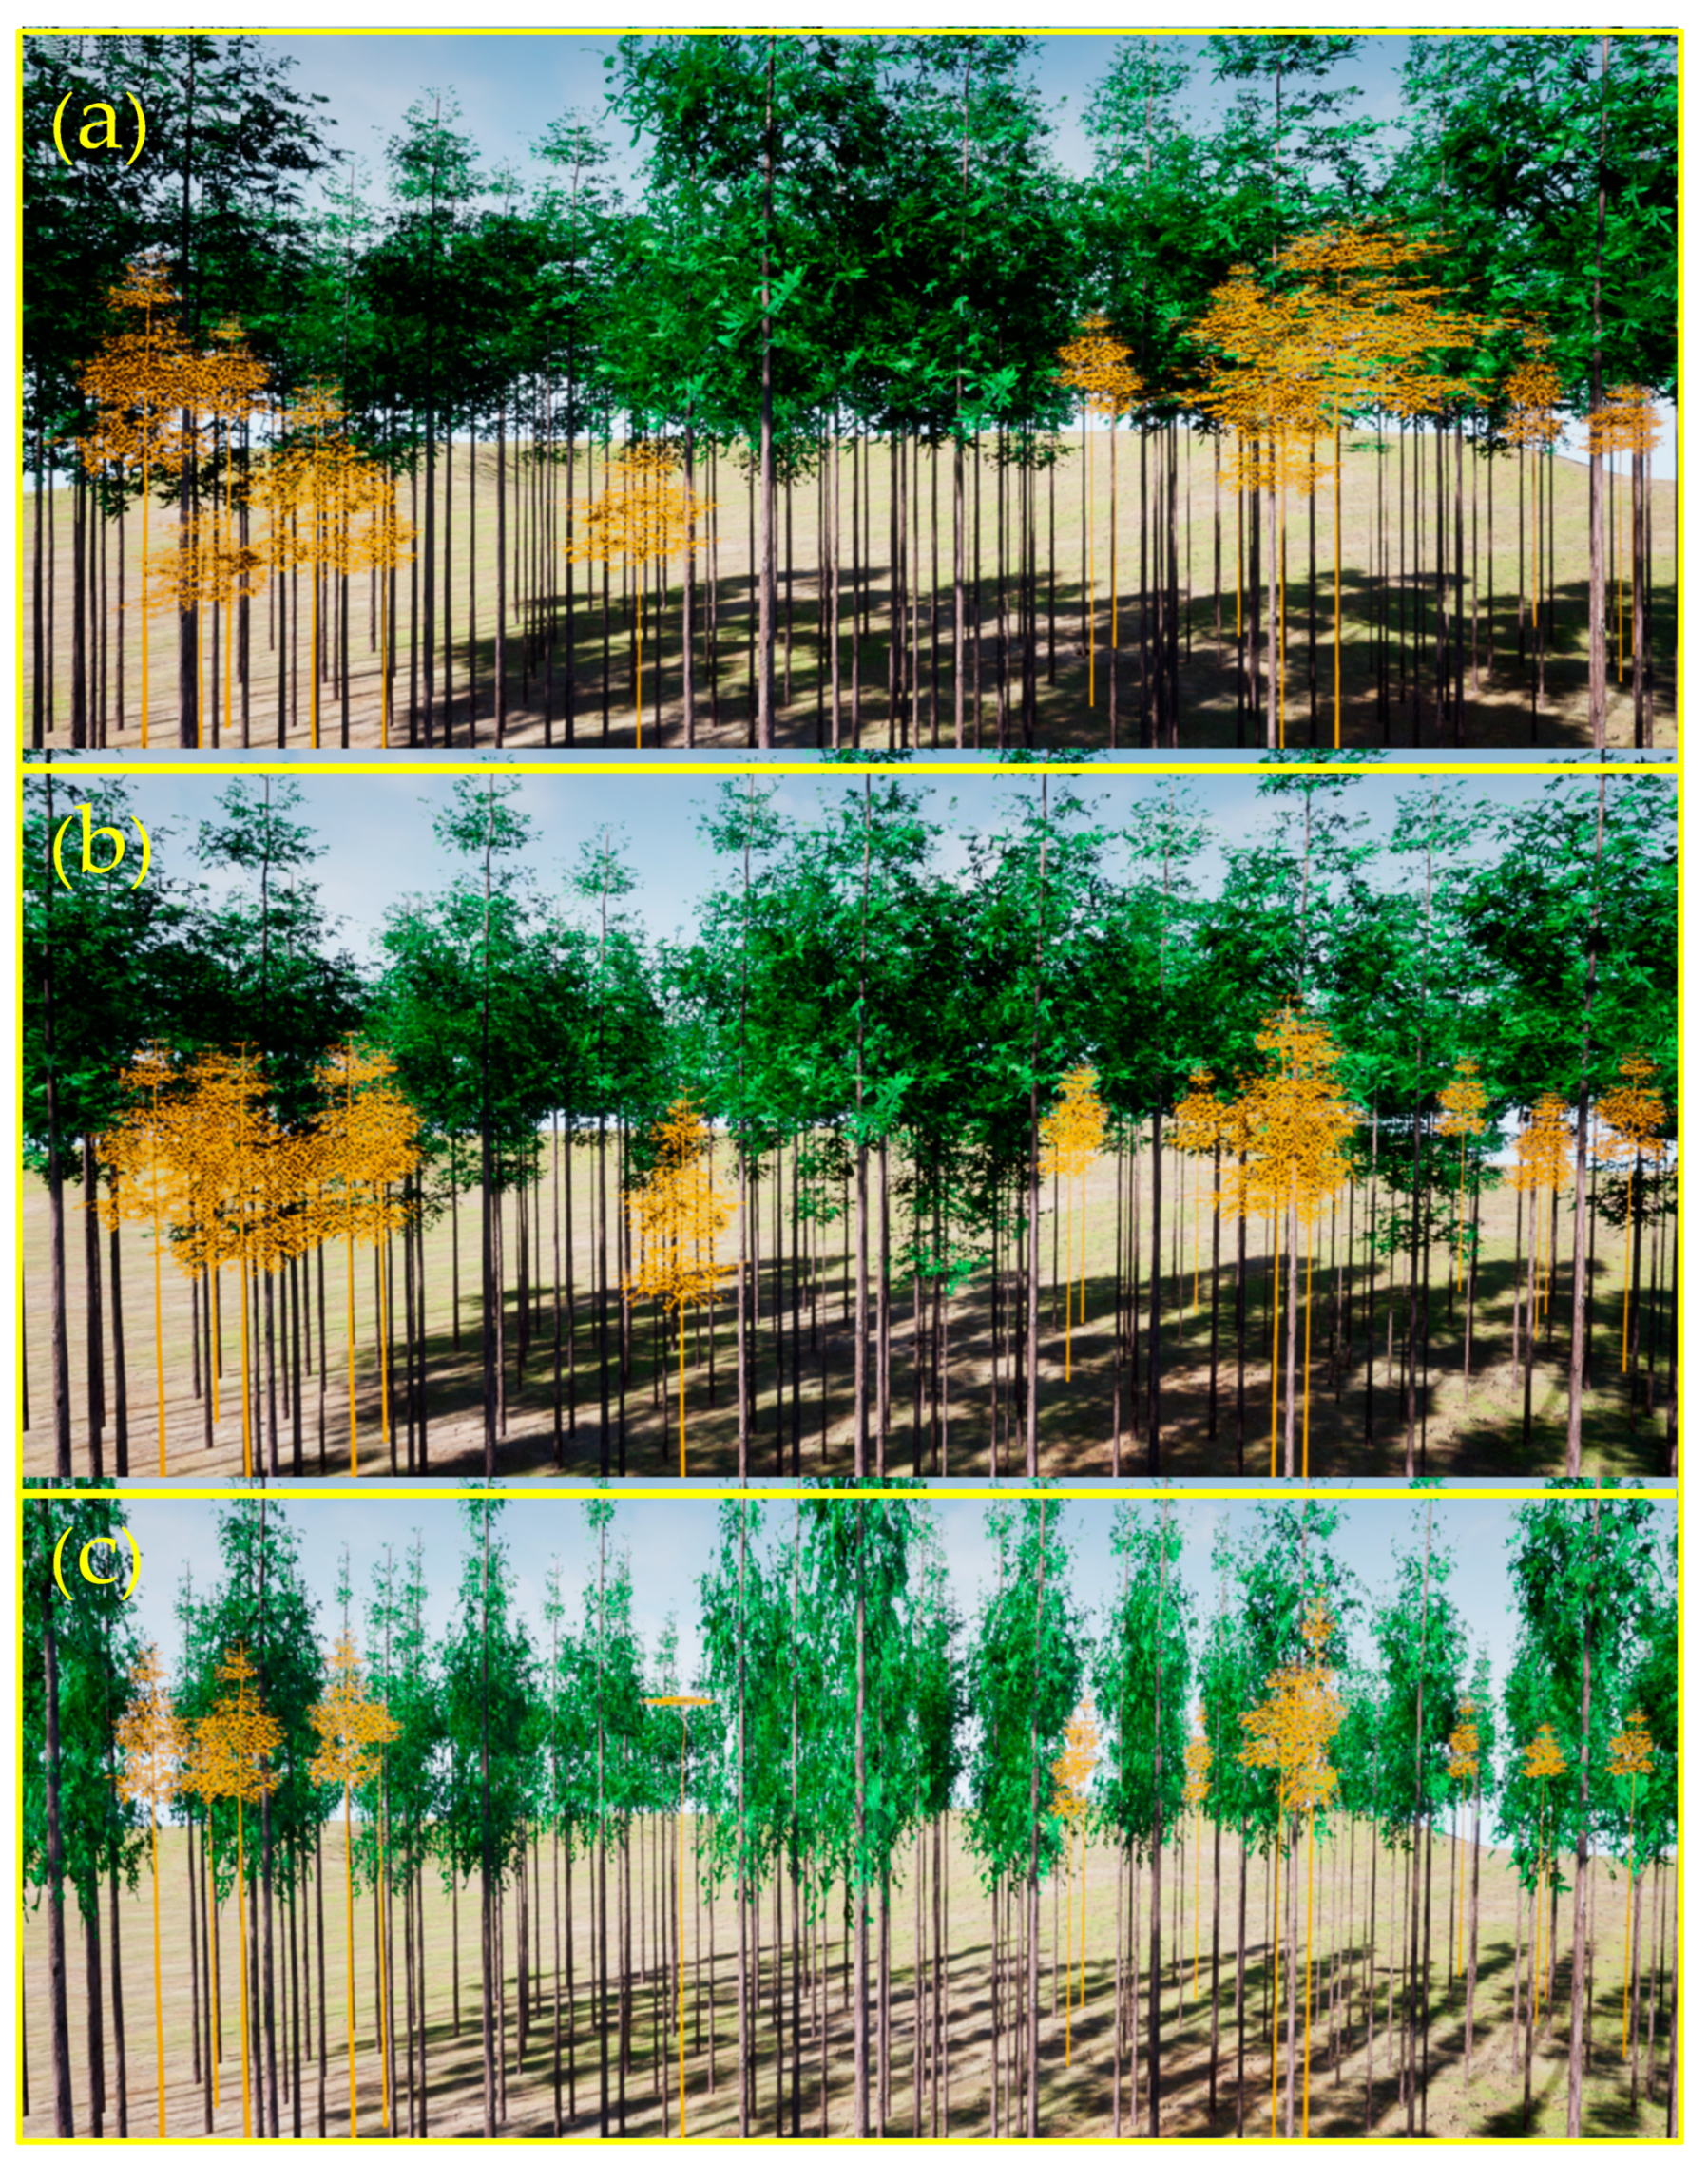
3.3. Dynamic Visual Simulation of the Morphological Structure of Chinese Fir Stand

In this paper, we first imported the tree coordinates and attribute information into the UE4 data structure table, then created a new action class in the blueprint class, organized the two parts into a complete tree model according to the trunk and crown coordinates of the produced Chinese fir split model, and finally developed a Chinese fir morphological structure control blueprint, and used the relative coordinate system to map the tree model into the 3D scene to form the initial plantation scenarios. As shown in Figure 10, the initial fir plantation scenario is the result of a visual simulation using the observed data from study plot F. Figure 10a shows the top view angle of Chinese fir stand with an initial stand age of 23 years old, which can visualize the competition status, CW size and spatial location relationship among trees. Figure 10b clearly shows the differences of the UBH, H, CW and CL among different trees from the side view angle.
The key to achieving polymorphism in tree morphological structure growth in a stand is to achieve control over the morphological structure of each tree. Therefore, this paper achieved scaling control of trunk height and diameter in the subdivision model using the H and DBH growth models, and scaling control of crown size by the CW and CL growth models, where CL was calculated from the difference between H and UBH. The calculation process of tree morphological structure parameter values is shown in Figure 11. First, the CGSS of trees in the plot is calculated in real time, then the tree growth age is input and combined with the morphological structure growth model to realize the differentiated growth of Chinese fir under different growth dominance conditions and spatial structure environment. The increment of the tree morphological structure parameter is the value of the morphological structure parameter at the current input tree age minus the value of the initial tree age morphological structure parameter, and the scaling value of the morphological structure control blueprint is the parameter increment.
After obtaining the morphological structure parameters and location information of the initial stand age, the user can input the stand age and combine it with the Chinese fir growth model to realize the differentiated growth of tree morphological structure under different growth advantage conditions and spatial structure environment. Figure 12 presents the stand scenario when the Chinese fir stands in plot F grows to 28 years. Figure 12a–c represent the results of the real observation data, the Chinese fir growth model of CGMSS and the visual simulation based on the SSU Chinese fir growth model in the same perspective, respectively. It can be seen from the figure that the simulation results of the Chinese fir growth model of CGMSS and the observation data are highly similar in H, UBH and CL (left panel), but from the right panel, it can be seen that the degree of competition among trees CW such as squeezing and shading is slightly lower than that of the Chinese fir forest in the real growth state. However, the simulation results of UBH, CW and CL for trees visualized based on the SSU Chinese fir growth model were worse than the actual growth state, except for H. In particular, the simulation results for competition among CW differed from the actual growth. The analysis results show that when the tree CGSS > 5 in the Chinese fir forest, the fitting effect of the SSU Chinese fir growth model is gradually lower than that of the fitting model proposed in this paper. Figure 13 shows that the morphological structure of the CGMSS Chinese fir growth model simulating growth-limited trees (Figure 13b) is more visually similar to that of trees in the real growth state (Figure 13a); however, the simulation results of H and UBH of trees under different growth states by the SSU-based Chinese fir growth model (Figure 13c) are relatively consistent, and the tree crown width differs more from that of the real growth trees. The above results show that the visualization of Chinese fir stands based on the CGMSS Chinese fir growth model can reflect the differences in H, CL, UBH, and CW growth under different growth states better, and at the same time, the simulation of the tree morphological structure growth under different growth dominance degrees and spatial structure environments is more realistic.

4. Discussion

In this study, tree morphological–structural growth models were represented by establishing H, DBH, CW and UBH growth models. Then CGMSS was coupled with the tree morphological structure growth model to realize the visual simulation of different tree growth polymorphisms in stands with the help of 3D visualization technology. The results show that the morphological structure growth model of CGMSS for Chinese fir can simulate the changes in tree morphological structure growth under different growth dominance conditions and spatial structure environments more accurately, which can provide guidance and reference for simulating the morphological structure polymorphism of trees in different growth states in forest stands. In previous studies, the morphological structure growth model established considering the spatial structure of trees was usually based on single or multiple independent spatial structure parameters to fit the plot data [45], and the results of the studies mostly descried the stand growth in the average state well. However, few studies have considered the differences in morphological structure among trees in the plots and established morphological structure growth models that conform to the growth environment and spatial structure of trees. Therefore, this study achieved the classification of trees in different growth states in the forest by building a comprehensive grade model of spatial structure (CGMSS), and the morphological structure growth model of Chinese fir constructed on this basis successfully simulated the growth polymorphism of Chinese fir forests.
In addition, by comparing with the SSU-based morphological–structural growth model of Chinese fir proposed by other scholars, the prediction accuracy of the two morphological–structural growth models for the stand scale was obtained to be more than 92%, indicating that the two models could provide a better fit for the overall growth variation of trees and the average state of individual tree growth in the stand. However, analysis of the test indicators of the two growth models in different grades showed that the prediction accuracy of the SSU-based morphological–structural growth model of Chinese fir decreased significantly with increasing CGSS and showed a great systematic error, showing completely opposite results compared to the CGMSS-based morphological–structural growth model of Chinese fir for tree prediction with different CGSS. The SSU growth model had a minimum tree prediction accuracy of less than 55% and a maximum of less than 85% at CGSS = 5–10 levels, with the DBH growth model at 5–10 levels, the H growth model at 8–10 levels, the UBH growth model at 5 and 7–10 levels, and the CW growth model at 0 and 5–10 levels all with a prediction accuracy of less than 75%. However, the CGMSS Chinese fir growth model had a minimum prediction accuracy of 71% and a maximum of 97% at CGSS = 5–10 levels, and all models except the UBH growth model had greater than 80% prediction accuracy for CGSS = 5–10 levels. The comparison between Table 7 and Table 8 shows that the prediction accuracy of the UBH growth model of CGMSS is equally better than that of the UBH growth model of SSU. The above results show that the CGMSS-based growth model of Chinese fir proposed in this study can achieve a better fit at the stand level, and can simulate the growth of trees in different growth states in the stand, especially for trees with limited growth space and fierce competition (CGSS = 5–10), and the results are better than those of the SSU-based Chinese fir growth model. The analysis of the plot data showed that there were a large number of trees of the same age in the same plot of Chinese fir plantation [40]; however, the reason for the different morphological structures among trees was that trees of the same age had different growth and spatial structure environments [46]. A growth model that considers only spatial structural parameters is only suitable for fitting the average state of tree growth in a stand. The CGMSS-based morphological–structural growth model of Chinese fir proposed in this study allows for better simulation of the variability in morphological structure exhibited by trees of different growth states in stands of the same age.
In the correlation analysis of DBH, H, CW and UBH of 1787 trees with only the influence of the edge effect of the sample plot eliminated and 1008 center trees with no change in adjacent trees in the spatial structure unit, respectively, the results showed that the correlation coefficients among tree morphological structure factors were all higher than those of the former when the spatial structure of the individual tree was not changed, and the relative growth changes among the morphological structure factors were obtained stably. In this study, we used the tree attribute factors with unchanged spatial structure as the fitted data, and then selected DBH as the independent variable for the H growth model and H as the independent variable for the CW and UBH growth models, and constructed a Chinese fir morphological structure growth model based on CGMSS, which better fitted the trees under natural growth conditions. However, in the process of tree growth, especially in plantation, they are often affected by human factors such as thinning [47], resulting in strong changes in the spatial structure of the trees and altering the growth rate of the trees [48,49]. Based on the premise that all trees in the stand are not eliminated and the spatial structure is relatively stable, and the differences in the morphological structure of trees in the two growth states are not considered at the same time, this paper constructs a compatible morphological structure growth model of Chinese fir suitable for both growth states. Therefore, further perfecting the morphological structure growth model to improve the applicability and fitting accuracy of the model under dynamic conditions will be the core and difficulty of subsequent research.
As previously mentioned, the data of the sample plots in this paper mainly came from the six plots of the Huangfengqiao State-owned Forest Farm in Hunan Province with the age range of 10–28 years. Therefore, the morphological structure growth model of Chinese fir we constructed was validated well for the morphological structure changes in Chinese fir from 10–28 years, but in terms of time scale, there was a lack of verification of the morphological structure of Chinese fir in other forest age stages. There are great differences in the growth rate and spatial structure environment of trees in different forest age stages [50]. Therefore, to describe the tree morphological and structural changes accurately in all growth stages, it is not sufficient to use measurements from certain ages or individual plots only. At the spatial scale, the stand conditions of the six sample plots in this paper are basically the same, and the trees are in a similar environment. However, the forest area for management planning is usually huge, which means that the environmental conditions of forest areas for management planning will have huge differences [51], which will make the site conditions for tree growth change, which in turn will affect the accuracy of the tree growth simulation by this study method, and this will lead to uncertainty in the results of this study. Additionally, the form construction methods of different tree species vary greatly [52], and different methods need to be used when dissecting the basic 3D model of trees to achieve an accurate simulation of the tree morphological structure. Therefore, the application of the tree 3D subdivision model and CGMSS-based tree growth modeling methods proposed in this study needs to be adapted to the location to realize the visual simulation of forest stand growth polymorphism better.

5. Conclusions

In this study, trees in different growth states were analyzed comprehensively from three dimensions: individual tree–spatial structure unit–stand, and combined with quantitative indicators representing tree growth and spatial structure states, a comprehensive grade model of spatial structure (CGMSS) was constructed and based on this. A morphological structure growth model of Chinese fir was developed for simulating tree morphological structure in different growth dominance degrees and spatial structure environments, to achieve stand growth polymorphism. The results showed that the overall prediction accuracy of morphological–structural growth models of Chinese fir DBH, H, CW and UBH based on CGMSS exceeded 90%. The trees in the stand were divided into comprehensive spatial structure classes (CGSS) for analysis, and among the Chinese fir growth models in CGSS, the systematic error of all growth models in other classes was less than 19%, and the prediction accuracy was greater than 80%, except for the UBH growth model in CGSS = 3–5 class, which had a smaller prediction accuracy and larger systematic error. The prediction accuracy of the SSU-based Chinese fir growth model constructed by Ma et al. for the stand was also more than 90%, but the systematic errors of the model fits were all greater than 20% when the CGSS was >5, and the prediction accuracy was mostly below 80%. The results of visual simulation showed that the simulation of the Chinese fir growth model of CGMSS was better than the Chinese fir growth model of SSU, and it was closer to the real tree growth state, and realized the dynamic visual simulation and growth polymorphism of Chinese fir stands better. However, forest management is huge in terms of time and spatial scales relative to the study area, and there is also a greater diversity of tree species. To make the simulation more accurate, we will consider the limitations of tree species, time, and spatial scales for in-depth study in the future.

Author Contributions

Conceptualization, H.Z. and X.H.; methodology, X.H. and H.Q.; software, X.H. and K.L.; formal analysis, G.Y., H.Q. and Z.C.; resources, T.Y., Y.Z., Y.L. and J.W.; writing—original draft preparation, X.H.; writing—review and editing, X.H., H.Z. and H.Q.; visualization, K.L.; supervision, H.Z. and G.Y. All authors have read and agreed to the published version of the manuscript.

Funding

This research was funded by the National Natural Science Foundation of China, grant number 32071681, 32271877 and the Foundation Research Funds of IFRIT, grant number CAFYBB2021ZE005, CAFYBB2019SZ004.

Data Availability Statement

Not applicable.

Conflicts of Interest

The authors declare that there are no conflicts of interest.

References

  1. Meyer, P.; Ammer, C. Forest Management. In Disturbance Ecology; Landscape Series; Springer: Berlin, Germany, 2022; pp. 315–347. [Google Scholar] [CrossRef]
  2. Li, Y.; Zhang, H.; Ju, H.; Jiang, X. Visual Simulation Technique of Decision Making of Interactive Stand Management Methods. In Proceedings of the 2014 International Conference on Virtual Reality and Visualization, Shenyang, China, 30–31 August 2014; pp. 459–466. [Google Scholar] [CrossRef]
  3. Yu, H.; Wu, M.M.; He, H.S. Developing platform of 3-d visualization of forest landscape. Environ. Modell. Softw. 2022, 157, 105524. [Google Scholar] [CrossRef]
  4. Bowman, D.M.; Brienen, R.J.; Gloor, E.; Phillips, O.L.; Prior, L.D. Detecting trends in tree growth: Not so simple. Trends Plant Sci 2013, 18, 11–17. [Google Scholar] [CrossRef]
  5. Jin, S.; Zhang, W.; Shao, J.; Wan, P.; Cheng, S.; Cai, S.; Yan, G.; Li, A. Estimation of Larch Growth at the Stem, Crown, and Branch Levels Using Ground-Based LiDAR Point Cloud. J. Remote Sens. 2022, 2022, 12. [Google Scholar] [CrossRef]
  6. Han, Y.; Wu, B.; Wang, K.; Guo, E.; Dong, C.; Wang, Z. Individual-tree form growth models of visualization simulation for managed larix principis-rupprechtii plantation. Comput. Electron. Agric. 2016, 123, 341–350. [Google Scholar] [CrossRef]
  7. de Reffye, P.; Hu, B.; Kang, M.; Letort, V.; Jaeger, M. Two decades of research with the GreenLab model in agronomy. Ann Bot 2021, 127, 281–295. [Google Scholar] [CrossRef] [PubMed]
  8. Griffon, S.; De Coligny, F. AMAPstudio: A software suite for plants architecture modelling. In Proceedings of the IEEE 4th International Symposium on Plant Growth Modeling, Simulation, Visualization and Applications (PMA12), Shanghai, China, 31 October–3 November 2012; pp. 141–147. [Google Scholar]
  9. Kang, M.; Wang, X.; Hua, J.; Hu, B.; Wang, F.; De Reffye, P. Over two decades of research with Greenlab model. J. Agric. Big Data 2021, 3, 3–12. [Google Scholar] [CrossRef]
  10. Peng, F.; Zheng, H.; Lu, S.; Shi, Z.; Liu, X.; Li, L. Growth model and visualization of a virtual jujube tree. Comput. Electron. Agric. 2019, 157, 146–153. [Google Scholar] [CrossRef]
  11. Söderbergh, I.; Ledermann, T. Algorithms for simulating thinning and harvesting in five european individual-tree growth simulators: A review. Comput. Electron. Agric. 2003, 39, 115–140. [Google Scholar] [CrossRef]
  12. Chen, K.; Zhang, H.-Q.; Liu, M.; Lu, K.-N. Cunninghamia Lanceolata Three-Dimensional Modeling Technology Based on IFS Fractal Algorithms. In Proceedings of the 2010 International Conference on Computational Intelligence and Software Engineering, Wuhan, China, 10–12 December 2010; pp. 1–4. [Google Scholar] [CrossRef]
  13. Lei, X.; Chang, M.; Lu, Y.; Zhao, T. A review on growth modelling and visualization for virtual trees. Sci. Silvae Sin. 2006, 42, 123. [Google Scholar]
  14. Looney, C.E.; Zhang, J. Site quality and intensive early stand management practices affect growth dominance, structural complexity, and tree growth in ponderosa pine plantations. For. Ecol. Manag. 2022, 519, 120318. [Google Scholar] [CrossRef]
  15. Hui, G.; Hu, Y.; Zhao, Z. Research progress of structure-based forest management. For. Res. 2018, 31, 85–93. [Google Scholar] [CrossRef]
  16. Ma, Z.; Zhang, H.; Li, Y.; Yang, T.; Huang, R.; Li, S. 3D visual simulation of Chinese fir based on the influence of different stand spatial structures. In Proceedings of the 2017 2nd International Conference on Image, Vision and Computing (ICIVC), Chengdu, China, 2–4 June 2017; pp. 559–565. [Google Scholar] [CrossRef]
  17. Kang-ning, L.; Huai-qing, Z.; Min, L.; Kang, C. Research on Tree Growth Models and Visual Simulation Technology. In Proceedings of the 2010 International Conference on Computational Intelligence and Software Engineering, Wuhan, China, 10–12 December 2010. [Google Scholar] [CrossRef]
  18. Falcão, A.O.; Santos, M.P.D.; Borges, J.G. A real-time visualization tool for forest ecosystem management decision support. Comput. Electron. Agric. 2006, 53, 3–12. [Google Scholar] [CrossRef]
  19. Kuang, Y.; Zhang, H.; Tan, J.; Jiang, X.; Lu, K.; Zhang, N. The study of the stand simulation based on the spatial structure. In Proceedings of the 2012 IEEE 4th International Symposium on Plant Growth Modeling, Simulation, Visualization and Applications, Shanghai, China, 31 October–3 November 2012; pp. 200–203. [Google Scholar] [CrossRef]
  20. Dong, L.; Liu, Z. Visual management simulation for Pinus svlvestris var. mongolica plantation based on optimized spatial structure. Sci. Silvae Sin. 2012, 48, 77–85. [Google Scholar]
  21. Li, S.; Zhang, H.; Li, Y.; Yang, T.; Shen, K. Three-Dimensional Visualization Simulation of Chinese Fir Stand Growth Based on Unity3D. In Proceedings of the 2018 3rd International Conference on Mechanical, Control and Computer Engineering (ICMCCE), Huhhot, China, 14–16 September 2018; pp. 530–534. [Google Scholar] [CrossRef]
  22. Wang, H. Dynamic Simulating System for Stand Growth of Forests in Northeast China. Ph.D. Thesis, Northeast Forestry University, Harbin, China, 2012. [Google Scholar]
  23. Gao, G.; Ding, G.; Xiao, M.; Zhang, L.; Lv, R.; Zhang, X.; Li, W.; Liu, Y. A Study on Stand Visualization of Artificial Mixed Forests. Bull. Soil Water Conserv. 2012, 32, 158–162. [Google Scholar] [CrossRef]
  24. Kershaw, J.A.; Richards, E.W.; Mccarter, J.B.; Oborn, S. Spatially correlated forest stand structures: A simulation approach using copulas. Comput. Electron. Agric. 2010, 74, 120–128. [Google Scholar] [CrossRef]
  25. Zhu, N.; Zhang, H.; Cui, Z.; Yang, T.; Li, Y.; Liu, H. Visual simulation of Chinese fir under branch height in consideration of spatial structure. J. Nanjing For. Univ. 2022, 46, 51–57. [Google Scholar]
  26. Li, S.; Zhang, H.; Li, Y.; Yang, T.; He, J.; Ma, Z.; Shen, K. Dynamic Visual Simulation of Chinese Fir Stand Growth Based on Sample Library. For. Res. 2019, 32, 21–30. [Google Scholar] [CrossRef]
  27. Ma, Z.; Zhang, H.; Li, Y.; Yang, T.; Chen, Z.; Li, S. Visual Simulation of Chinese Fir Crown Growth Based on Spatial Structure. For. Res. 2018, 31, 150–157. [Google Scholar] [CrossRef]
  28. Haara, A.; Pykäläinen, J.; Tolvanen, A.; Kurttila, M. Use of interactive data visualization in multi-objective forest planning. J. Environ. Manag. 2018, 210, 71–86. [Google Scholar] [CrossRef]
  29. Hui, G.; Gadow, K.V. Principles on Structure-Based; China Forestry Publishing House: Beijing, China, 2016; p. 360. [Google Scholar]
  30. Cao, X.; Li, J.; Feng, Y.; Hu, Y.; Zhang, C.; Fang, X.; Deng, C. Analysis and evaluation of the stand spatial structure of Cunninghamia lanceolata ecological Forest. Sci. Silvae Sin. 2015, 51, 37–48. [Google Scholar]
  31. Põldveer, E.; Korjus, H.; Kiviste, A.; Kangur, A.; Paluots, T.; Laarmann, D. Assessment of spatial stand structure of hemiboreal conifer dominated forests according to different levels of naturalness. Ecol. Indic. 2020, 110, 105944. [Google Scholar] [CrossRef]
  32. Hui, G.; Gadow, K.V.; Albert, M. A new parameter for stand spatial structure neighborhood comparison. For. Res. 1999, 12, 4–9. [Google Scholar]
  33. Hu, Y.; Hui, G. How to describe the crowding degree of trees based on the relationship of neighboring trees. J. Beijing For. Univ. 2015, 37, 1–8. [Google Scholar] [CrossRef]
  34. Hui, G.; Hu, Y.; Zhao, Z.; Yuan, S.; Liu, W. A Forest Competition Index Based on Intersection Angle. Sci. Silvae Sin. 2013, 49, 68–73. [Google Scholar]
  35. Zhao, Z.; Hui, G.; Hu, Y.; Li, Y.; Wang, H. Method and application of stand spatial advantage degree based on the neighborhood comparison. J. Beijing For. Univ. 2014, 36, 78–82. [Google Scholar] [CrossRef]
  36. Hui, G.; Zhao, Z.; Zhang, G. Priority of management measures for natural forests based on the stand state. J. Beijing For. Univ. 2016, 38, 1–10. [Google Scholar] [CrossRef]
  37. Xie, Y.; Yang, H. Relationship between stand spatial structure and DBH increment of principal species in natural spruce-fir mixed forest in Changbai Mountains of northeastern China. J. Beijing For. Univ. 2022, 44, 1–11. [Google Scholar]
  38. Cortini, F.; Filipescu, C.N.; Groot, A.; Macisaac, D.A.; Nunifu, T. Regional models of diameter as a function of individual tree attributes, climate and site characteristics for six major tree species in Alberta, Canada. Forests 2011, 2, 814–831. [Google Scholar] [CrossRef] [Green Version]
  39. Zhou, Z.; Fu, L.; Zhou, C.; Sharma, R.P.; Zhang, H. Simultaneous compatible system of models of height, crown length, and height to crown base for natural secondary forests of Northeast China. Forests 2022, 13, 148. [Google Scholar] [CrossRef]
  40. Wei, X.; Sun, Y.; Ma, W. A height growth model for Cunninghamia lanceolata based on Richards’ equation. J. Zhejiang A&F Univ. 2012, 29, 661–666. [Google Scholar]
  41. Sánchez-González, M.; Cañellas, I.; Montero, G. Generalized height-diameter and crown diameter prediction models for cork oak forests in Spain. Forest Syst. 2007, 16, 76–88. [Google Scholar] [CrossRef] [Green Version]
  42. Dong, C.; Wu, B.; Zhang, H. Parametric prediction models of DBH and height for Cunninghamia lanceolata plantation based on crown width. J. Beijing For. Univ. 2016, 38, 55–63. [Google Scholar] [CrossRef]
  43. Mayerich, D.; Chen, G.; Childs, H. Unreal Chimera: An Unreal Engine Platform for Scientific Visualization of Next-Generation Data. Available online: https://stim.ee.uh.edu/resources/software/unreal-microscopy/ (accessed on 20 February 2022).
  44. Zhang, H. Researchs on Single Wood Growth Model of Fokienia hodginsii. Cent. South For. Inventory Plan. 2006, 25, 1–4. [Google Scholar]
  45. Pretzsch, H. Tree growth as affected by stem and crown structure. Trees 2021, 35, 947–960. [Google Scholar] [CrossRef]
  46. González-Moreno, P.; Quero, J.L.; Poorter, L.; Bonet, F.J.; Zamora, R. Is spatial structure the key to promote plant diversity in mediterranean forest plantations? Basic Appl. Ecol. 2011, 12, 251–259. [Google Scholar] [CrossRef]
  47. Duchateau, E.; Schneider, R.; Tremblay, S.; Dupont-Leduc, L.; Pretzsch, H. Modelling the spatial structure of white spruce plantations and their changes after various thinning treatments. Forests 2021, 12, 740. [Google Scholar] [CrossRef]
  48. Robert, A. Simulation of the effect of topography and tree falls on stand dynamics and stand structure of tropical forests. Ecol. Model. 2003, 167, 287–303. [Google Scholar] [CrossRef]
  49. Gonzalez-Benecke, C.A.; Gezan, S.A.; Leduc, D.J.; Martin, T.A.; Cropper, W.P., Jr.; Samuelson, L.J. Modeling survival, yield, volume partitioning and their response to thinning for longleaf pine plantations. Forests 2012, 3, 1104–1132. [Google Scholar] [CrossRef]
  50. Qiu, H.; Liu, S.; Zhang, Y.; Li, J. Variation in height-diameter allometry of ponderosa pine along competition, climate, and species diversity gradients in the western united states. For. Ecol. Manag. 2021, 497, 119477. [Google Scholar] [CrossRef]
  51. Zhang, M.; Liu, N.; Harper, R.; Li, Q.; Liu, K.; Wei, X.; Ning, D.; Hou, Y.; Liu, S. A global review on hydrological responses to forest change across multiple spatial scales: Importance of scale, climate, forest type and hydrological regime. J. Hydrol. 2017, 546, 44–59. [Google Scholar] [CrossRef] [Green Version]
  52. Lu, K.; Zhang, H. A Review of Plant Architecture. World For. Res. 2010, 23, 17–20. [Google Scholar] [CrossRef]
Figure 1. Location of study area.
Forests 14 00617 g001
Figure 2. Schematic diagram of Adjacent trees in different orientations of the center tree. (a,b) Distribution when the angle between any two adjacent trees is smaller than the standard angle. (c,d) Distribution when the angle between any two adjacent trees is greater than the standard angle. The numbers 1–4 represent the distribution of the four adjacent trees.
Forests 14 00617 g002
Figure 3. Construction of comprehensive grade model of Chinese fir spatial structure.
Forests 14 00617 g003
Figure 4. The relationship between the parameters of the DBH growth equation and the CGSS.
Forests 14 00617 g004
Figure 5. Matrix analysis of morphological structure factors of 1008 center trees.
Forests 14 00617 g005
Figure 6. Schematic diagram of fir split model.
Forests 14 00617 g006
Figure 7. Distribution map of morphological structure factor values of Chinese fir of the same forest age under different comprehensive grades of spatial structure.
Forests 14 00617 g007
Figure 8. Comparison of CGSS of 1008 center trees at the initial stand age and CGSS at stand age changed.
Forests 14 00617 g008
Figure 9. Percentage of trees with different CGSS.
Forests 14 00617 g009
Figure 10. Visual simulation results of a 23-year-old Chinese fir plantation. (a) Top view angle to observe the crown width extrusion and competition between trees in the stand. (b) Side view angle to observe the differences between UBH, H, CW and CL of different trees.
Forests 14 00617 g010
Figure 11. The calculation process of morphological structure parameter values of Chinese fir.
Forests 14 00617 g011
Figure 12. Results of visual simulation of 28-year-old Chinese fir stands. (a) Simulation from observed data; (b) Simulation from predicted data of CGMSS Chinese fir growth model; (c) Simulation from predicted data of SSU Chinese fir growth model. The left panel shows the side view observation angle of the stand visualization simulation, and the right panel shows the top view observation angle.
Forests 14 00617 g012
Figure 13. Visual simulation results of poor growth and growth space restricted trees (CGSS > 5) in 28-year-old Chinese fir stands. (a) Simulation by observed data; (b) Simulation by predicted data from CGMSS Chinese fir growth model; (c) Simulation by predicted data from SSU Chinese fir growth model. Highlighted trees in the figure are growth-limited Chinese fir trees.
Forests 14 00617 g013
Table 1. Statistical table of tree factors in the sample plot.
Plot NumberAge SpanQuantity/PlantArea/hm2DBH Range/cmH Range/mUBH Range/mCW Range/m
A17~225330.367.1~16.2~28.64.3~10.6~18.01.7~5.0~9.30.6~2.7~3.8
B23–283620.413.3~22.6~33.48.4~15.4~20.21.8~8.2~12.21.3~2.9~4.2
C11–163090.255.9~14.2~21.25.3~9.5~13.51.9~4.3~7.50.8~2.7~4.0
D10–159550.483.2~11.6~22.43.2~8.4~13.71.3~4.4~8.00.3~2.2~3.8
E16–212300.3610.5~20.0~29.86.7~12.8~16.82.6~6.6~9.21.6~3.0~4.5
F13–181200.166.2~16.5~23.25.6~11.0~13.81.8~6.3~9.51.8~3.4~5.6
Table 2. Calculation parameters of the comprehensive grade of Chinese fir spatial structure.
Model NameModel ExpressionExplanation
Neighborhood
comparison [32]
U i = 1 n j = 1 n   k i j n represents the number of adjacent trees (the same as below), and   k i j is a discrete variable, which means that when the diameter of the center tree i is smaller than that of the adjacent tree j ,   k i j = 1 , otherwise   k i j = 0 .
Crowding [33] C i = 1 n j = 1 n   y i j C i represents the density of the center tree i ;     y i j is a discrete variable, which takes a value of 1 when the crown of adjacent tree j overlaps with center tree i , otherwise, it is 0.
a forest competition index based on intersection angle [34] U C I i = 1 n j = 1 n   ( α 1 + α 2 · C i j ) 180 ° · U i When the adjacent tree j is larger than the center tree i ,   α 1 = tan 1 H i d i j , otherwise
α 1 = tan 1 H j d i j   ;   α 2 = tan 1 H j H i d i j
When the adjacent tree j is larger than the center tree i ,   C i j = 1 ,   otherwise   C i j = 0 .
U C I i means the intersection angle competition index;   α 1 ,   α 2 means the included angle;   U i means the neighborhood comparison, which means the weight;   H i ,   H j means the height of the center tree and adjacent trees;   C i j means the parameter, value is 0 or 1.
tree spatial advantage degree [35] S d = P D i 1 + G m a x 1 + G m a x G ¯ P D i is the probability that the DBH of other trees in the stand is smaller than the center tree; G m a x is the potential maximum cross-sectional area of the tree, and the value of the largest cross-sectional area of the tree in the stand is used as the potential size of the tree growth; G ¯ is the cross-sectional area of the center tree(the same as below).
forest density
of stocking [36]
B 0 = G ¯ / G m a x
Table 3. Relational expression of each parameter and CGSS.
EquationParametersModel NameModel Expression
(6)aQuadratic polynomial f a ( x ) = b x 2 + c x + d
(7)kGauss f k ( x ) = A 1 + A 2 w π 2 e 2 ( x x 0 w ) 2
(8)cLogistic f c ( x ) = A 2 + A 1 A 2 1 + ( x x 0 ) p
In the formula: x represents the CGSS value, and b , c ,   k 0 , w , A represent the fitting parameter values.
Table 4. Fitting models of Chinese fir tree height, branch height and crown growth.
EquationParametersModel Expression
(9)H H = A 1 + A 2 w π 2 e 2 ( D B H x 0 w ) 2
(10)UBH UBH = A 1 + A 2 w π 2 e 2 ( H x 0 w ) 2
(11)CW CW = A 2 + A 1 A 2 1 + ( H x 0 ) p
Table 5. Correlation coefficient analysis of Chinese fir morphological structure factors.
Pearson’s CorrelationNoCGSS
012345678910
H:DBH0.900.940.910.940.940.950.960.950.950.970.970.98
H:CW0.840.710.650.780.870.870.860.910.910.940.980.96
H:UBH0.840.940.740.850.870.740.910.910.910.950.980.94
DBH:UBH0.610.890.60.770.760.690.840.860.860.930.960.91
DBH:CW0.790.670.670.760.860.850.850.870.870.920.960.95
CW:UBH0.710.780.370.610.740.630.740.810.810.910.970.9
Table 6. Estimation and testing of parameters of Chinese fir morphological structure growth model.
Parameter
Estimates/Test
Model Name
D f a ( x )   f k ( x )   f c ( x )   CDHUBHCW
a29.205
b −3.274
c1.4870.088
d 39.735
k0.078
A1 1.3181.987 19.41912.1932.209
A2 40.2070.684 102.57567.9881114.545
X0 3.6910.495 13.8469.284434.601
w 24.800 10.6458.386
p 2.008 2.008
R a d j 2 0.5000.9130.8190.8200.8360.8710.7030.658
RSS1875.62754.1270.0050.290205.5360.39890.9097.863
RMSE5.4142.4520.0230.1801.7920.9711.1920.351
MAE23.4201.5440.0170.12520.0200.7450.9300.232
Table 7. Test indicators of morphological–structural growth model of Chinese fir based on CGMSS.
Model NameTest Indicators NOCGSS
012345678910
Dsystematic error34.17 0.487.51−1.93−13.81−17.53−10.39−4.709.914.822.896.26
accuracy0.98 0.99 0.93 0.98 0.84 0.79 0.89 0.95 0.91 0.95 0.97 0.94
Hsystematic error−2.19 −0.424.980.95−15.36−21.12−12.61−7.7911.85.9811.25−1.72
accuracy0.97 0.940.930.950.820.730.840.890.890.940.880.94
UBHsystematic error−1.40 12.679.214.44−21.26−30.06−18.22−15.2912.824.750.564.95
accuracy0.94 0.840.870.900.650.550.710.780.850.750.890.74
CWsystematic error−0.03 1.519.775.85−8.96−9.1−6.72−4.939.8111.35−8.31−0.56
accuracy0.96 0.880.880.900.850.820.860.800.880.880.820.91
Table 8. Test indicators of morphological−structural growth model of Chinese fir based on SSU.
Model NameTest IndicatorsNOCGSS
012345678910
Dsystematic error54.40−0.0811.247.1525.54100.23143.18140.73337.27335.07508.27682.48
accuracy0.940.820.920.870.850.780.540.570.460.390.650.72
Hsystematic error18.9420.2818.978.6614.6718.0922.3630.2831.3632.6154.0019.86
accuracy0.980.930.960.950.950.930.840.810.810.460.660.70
UBHsystematic error14.8926.32−1.322.409.224.2958.4020.88100.20135.1578.77152.06
accuracy0.960.870.950.930.920.910.710.820.610.090.100.15
CWsystematic error−33.46−38.77−40.49−17.03−34.56−26.92−27.40−24.17−13.27−21.72−28.81−27.64
accuracy0.920.700.850.800.800.820.650.710.660.280.200.24
Disclaimer/Publisher’s Note: The statements, opinions and data contained in all publications are solely those of the individual author(s) and contributor(s) and not of MDPI and/or the editor(s). MDPI and/or the editor(s) disclaim responsibility for any injury to people or property resulting from any ideas, methods, instructions or products referred to in the content.

