
Topography and Soil Organic Carbon in Subtropical Forests of China
by
Tao Zhou
1,2,3,4,†,
Yulong Lv
5,†,
Binglou Xie
6,
Lin Xu
1,2,3,4,
Yufeng Zhou
1,2,3,4,
Tingting Mei
1,2,3,4,
Yongfu Li
1,2,3,4,
Ning Yuan
1,2,3,4 and
Yongjun Shi
1,2,3,4,* 1
State Key Laboratory of Subtropical Silviculture, Zhejiang A & F University, Lin’an 311300, China
2
Zhejiang Provincial Collaborative Innovation Center for Bamboo Resources and High-Efficiency Utilization, Zhejiang A & F University, Lin’an 311300, China
3
Key Laboratory of Carbon Cycling in Forest Ecosystems and Carbon Sequestration of Zhejiang Province, Zhejiang A & F University, Lin’an 311300, China
4
School of Environmental and Resources Science, Zhejiang A & F University, Lin’an 311300, China
5
Forestry Bureau of Anji County, An’ji 313300, China
6
Forest Resource Monitoring Center of Zhejiang Province, Hangzhou 310000, China
*
Author to whom correspondence should be addressed.
†
These authors contributed equally to this work.
Forests 2023, 14(5), 1023; https://doi.org/10.3390/f14051023
Submission received: 27 March 2023
/
Revised: 11 May 2023
/
Accepted: 15 May 2023
/
Published: 16 May 2023
(This article belongs to the Special Issue Soil Carbon, Nitrogen and Phosphorus Changes in Forests)
Abstract
:Soil organic carbon (SOC) strongly contributes to the operation of the global carbon cycling, and topographical factors largely influence its spatial distribution. However, SOC distribution and its leading topographical impact factors in subtropical forest ecosystems (e.g., the Zhejiang Province in China) have received relatively limited attention from researchers. In this study, 255 forest soil samples were collected from the Zhejiang Province to quantify the spatial variation in SOC and impact factors in subtropical forests. The SOC contents over soil profiles were 35.95 ± 22.58 g/kg, 20.98 ± 15.26 g/kg, and 13.77 ± 11.28 g/kg at depths of 0–10 cm, 10–30 cm, and 30–60 cm, respectively. The coefficient variations at different depths were 62.81% (0–10 cm), 72.74% (10–30 cm), and 81.92% (30–60 cm), respectively. SOC content shows a moderate intensity variation in the Zhejiang Province. The nugget coefficients of the SOC content for the three depths were 0.809 (0–10 cm), 0.846 (10–30 cm), and 0.977 (30–60 cm), respectively. Structural factors mainly influence SOC content. SOC content is positively correlated with elevation and slope, and negatively correlated with slope position (p < 0.05). However, the SOC content was negatively correlated with slope in mixed coniferous and broad-leaved forest. The distribution of the SOC content was relatively balanced between different slope positions. However, the differences became obvious when forest types were distinguished. Topographical factors affected the SOC content differently: elevation > slope > slope position. Slope becomes the main influencing factor in 30–60 cm soil. Forest type significantly influenced the SOC content but with a low statistical explanation compared to topographical factors. Topography has different effects on SOC of different forest types in subtropical forests. This reminds us that in future research, we should consider the combination of topography and forest types.
1. Introduction
Organic carbon (OC) is an indispensable component of soil, which is mainly derived from various types of plant litter, plant residue and root systems [1,2]. OC can provide the nutrients required for plant growth and has an important impact on soil physicochemical properties. Soil organic carbon (SOC) directly affects soil quality through soil function regulation, and indirectly affects global climate change through carbon cycle, so the study of soil organic carbon has become a worldwide focus [3,4].
Global warming significantly and profoundly impacts the climate system [5,6]. Greenhouse gases, including carbon dioxide (CO2), methane (CH4), and nitrous oxide (N2O), are the leading causes of global warming [7]. An increase of 1000 Gt (Gt = 109 t) in CO2 emissions would increase the global mean temperature by 0.27–0.63 °C [8]. Increasing temperatures reduce the stability of the soil carbon pool, causing decomposition and soil carbon oxidation and the release of greenhouse gases into the atmosphere [9]. Globally, the carbon stored in soils exceeds its combined storage in vegetation and the atmosphere [10]. SOC is an essential component of the soil carbon pool that accounts for approximately two-thirds of the global soil carbon pool [4]. Therefore, the formation, fixation, and decomposition of SOC actively contribute to global carbon cycling [11,12]. However, small changes in the SOC pool can significantly influence atmospheric CO2. Research has shown that a 10% change in the SOC pool is approximately equal to 30 years of anthropogenic emissions [13]. Consequently, clarifying the factors influencing SOC can help determine the driving mechanisms of SOC changes, and this can contribute to the effort to maintain a stable soil carbon pool [14].
Soil organic carbon is influenced by topography [15], climatic conditions [16], land-use change [17], litter [18], water content [19], soil depth [20] and microbial communities [21]. Unlike temperature and precipitation, topography does not change and so affects SOC more gradually. At the sample scale, a change in topography is expressed as the slope, magnitude, and degree of surface relief. Changes in microtopography affect SOC by altering the soil’s water-holding capacity. First, topography influences the degree of soil erosion by controlling the surface water flow and water storage, which in turn can change the concentration and storage of SOC [22,23]. In addition, soil moisture controls net primary production and microbial activity, which then affect the input and output of SOC [24,25].
The topography modifies the local microclimate when observed on a larger regional scale [15]. However, at subcontinental and global observational scales, the influence of topography on SOC is attenuated [26,27]. The above studies illustrate the differences in the effects of topography on SOC at different observation scales. Factors affecting topography change with varying scales of observation [28]. As the size of the study area increases, the dominant factors impacting SOC change from topographic factors to soil properties and finally to climate. For example, in a study on SOC distribution in Laos, the slope explained most of the spatial variation in SOC [29]. However, on a continental scale in Australia, climate has become the dominant impact factor on SOC [30].
Forest SOC pools contain about 73% of the global SOC pools and more than 67% of the carbon in forest ecosystems is retained in soil [31,32,33]. In terrestrial ecosystems, forest soils are the largest carbon pools. Changes in forest soil carbon pools have a significant impact on greenhouse gas concentrations. One of the key factors for changes in forest soil respiration is temperature. An increase in temperature enhances the intensity of forest soil respiration, thus gradually changing forest ecosystems from sinks to sources [9,34]. In forest ecosystems, vegetations store about 42%–50% of carbon, while soils store about 44%–45% [35]. Studies have shown that a 10% change in forest SOC is approximately equal to 30 years of anthropogenic emissions [13].
Because they are located in the monsoon region, subtropical forests in China are highly representative and unique [36]. This region contains three main forest types: broad-leaved forest (BLF), coniferous forest (CF), and mixed coniferous and broad-leaved forest (MCBF) [37]. However, the factors influencing SOC in subtropical forests, especially topography, have not been extensively studied. The results showed that the mean SOC density is 71.15 Mg·ha−1, and the SOC storage is 0.47 Pg (Pg = 1015 g). The SOC density gradually decreased from southwest to northeast. This feature is consistent with the topographic characteristics of the Zhejiang Province. The spatial distribution of SOC is mainly influenced by the dominant species and elevation, and SOC content significantly decreases with the deepening of the soil layer [38]. Dong suggested that 65% of SOC is stored in the 0–30 cm soil layer. These studies have demonstrated that topography can significantly affect SOC. In another study on Chinese subtropical forests, SOC densities ranged from 13 Mg·ha−1 to 358.6 Mg·ha−1 [39]. Li’s study results suggest significant differences in SOC density in subtropical forests in China. The mean annual temperature explained most of the variation in SOC storage, followed by elevation. Notably, soil properties and litter biomass did not significantly affect SOC storage in the study by Li et al. This is a reminder that we should incorporate soil properties when studying the factors influencing SOC. Under climatic conditions similar to those in China, Spanish forests also have a variety of SOC contents, ranging from 4 Mg·ha−1 to 465 Mg·ha−1 (0–100 cm) in coniferous, broadleaf, and evergreen broadleaf forests [40]. Precipitation factors and vegetation type mainly influence SOC in Spain’s forests, whereas topography (elevation) and soil properties play a lesser role. However, a study in a Mediterranean forest in southern France showed that precipitation does not affect SOC [41].
Soil organic carbon is affected by various factors, and its strength is highly scale-related. Therefore, accurately quantifying SOC in the soil and identifying the influencing factors are important for forest management. This study investigated the topographical and forest-type effects on SOC in subtropical forests in the Zhejiang Province. We aimed to (1) investigate the horizontal distribution of SOC with three different soil depths (0–10, 10–30, and 30–60 cm) in a typical subtropical forest ecosystem in the Zhejiang Province; (2) reveal the topographical and forest-type impacts on SOC; and (3) quantify the contribution of topographic factors to the spatial variation of SOC.
2. Materials and Methods
2.1. Study Region
This study was conducted in the Zhejiang Province (118°01′–123°10′ E, 27°02′–31°11′ N), southeast China (Figure 1), with a total area of 105,500 km2. The geographical location of the Zhejiang Province belongs to the northern subtropical zone and has a monsoon climate. The mean annual temperature ranges from 15 to 18 degrees centigrade, and the mean annual precipitation ranges from 980 to 2000 mm. The topography of the Zhejiang Province changes in a stepped pattern from the southwest to the northeast (Figure 2). Mountains and hills cover the southwestern part of the study area. Some hills and basins occur in the middle part. The northeastern region is an alluvial plain. Hilly terrain covers 70% of the land in the Province [42]. Among all the soil types in China, red and yellow soils are the main types in the Zhejiang Province [43,44]. The main forest types in the study area are BLF, CF, MCBF, bamboo forest (BF), and shrubland (SL) [45,46]. BLF include alder (Alnus cremastogyne Burkill), hackberry (Celtis sinesis Pers.), schima (Schima superba Gardner & Champ.), liquidambar (Liquidambar formosana Hance), yellow sandalwood (Dalbergia hupeana Hance) and red maple (Acer palmatum ‘Atropurpureum’ (Van Houtte) Schwerim). CF include masson pine (Pinus massoniana Lamb.), wetland pine (Pinus elliottii Engelm.), huangshan pine (Pinus hwangshanensis W. Y. Hsia), china fir (Cunninghamia lanceolata (Lamb.) Hook.), china cedar (Cryptomeria japonica (Thunb. ex L. f.) D. Don), cypress (Cupressus funebris Endl.), and dragon savin (Sabina chinensis (L.) Ant. cv. Kaizuca). MCBF mainly include pine-broadleaf mixed or cypress-broadleaf mixed. BF include moso bamboo (Phyllostachys edulis (Carrière) J. Houz.) and CV.Ventricousinternode (Phyllostachys violascens ‘Prevernalis’ S.Y.Chen et C.). SL mainly include dwarf fruit trees and shrubs for food or medicinal use, such as pear (Pyrus spp.), hickory (Carya cathayensis Sarg.) and tea leaf (Camellia sinensis (L.) Kuntze) (Table 1).
2.2. Data Source
We used a mechanical method to establish a grid system in the subtropical forests of the Zhejiang Province. The sample sites were spaced 4 km (E-W) and 6 km (S-N) apart in the entire grid system. The fixed sample site was a square with a side length of 28.28 m and an area of 800 m2. The survey information included the type of aboveground vegetation, slope gradient, slope position, and slope direction at the fixed sample site. We used the global positioning system (GPS) to obtain the latitude, longitude, and elevation of the fixed sample sites. A total of 255 fixed sample sites were selected based on the survey results of typical sampling (Figure 1a). To reduce interference with the fixed sample sites, we placed the soil sample sites southwest of the fixed sample plots. The northeast corner of the soil sample site was 6 m southwest (45°) of the fixed sample site. The soil sample site was a square with a side length of 8 m and an area of 64 m2 (Figure 1b). If the investigation factor of the soil sample site did not coincide with the fixed sample site, it was adjusted in a clockwise direction. Five soil sample points were established in the southeast, southwest, northeast, northwest, and middle of the sampling site (Figure 1b). Each soil profile was dug to a depth of 60 cm (Figure 1c). Using a tape to measure the distances, a wooden stick was inserted at 10, 30, and 60 cm. For each soil layer, the soil from the five sites was thoroughly mixed before being sent to the laboratory. Climate data were obtained from Climate AP v2.20 [47].
2.3. Sample Treatment and Determination Analysis
All the soil samples were air-dried in lab conditions and then passed through the 0.25 mm and 0.149 mm screens to filter out all roots and gravel. The potassium dichromate oxidation method was used to determine the SOC content [48]. The formula for calculating SOC is as follows:
where SOCC is the soil organic carbon content (g/kg); c is the concentration of 0.8000 mol/L (1/6 K2Cr2O7) standard solution; 5 is the volume of potassium dichromate standard solution added (mL); V0 is the amount of FeSO4 in the control group (mL); V is the amount of FeSO4 in the experimental group (mL); 3.0 is the molar mass of 1/4 carbon atoms (g/mol); 10−3 is the factor to convert mL to L; 1.1 is the oxidation correction factor; m is the mass of soil sample (g); k is the conversion factor between air-dried soil and dried soil.
2.4. Data Analysis
In this study, the GS+ software was used to fit the semi-covariance function model. Radj2 and Residual SS were used to compare the results of the fitted models and select the best-fit model. The fitted model parameters were subjected to ordinary kriging interpolation using Arcgis 10.4 software. Correlation, analysis of variance, and regression analyses were performed using SPSS (version 26.0). In this study, the data were tested for Kolmogorov–Smirnov (K-S) test before analysis. Data that did not follow a normal distribution were transformed logarithmically. Analysis of variance (ANOVA) was used to determine whether there were significant differences in the effects of topographic factors on SOC. In the regression equation, Radj2 indicates the explanatory rate of the individual and combined variables on the spatial variance of SOC [49,50].
3. Results
3.1. Characteristics of SOC in Subtropical Forests
In this study, log transformation was performed on the data, and outliers were removed before geostatistical analysis was performed. This was because the original data did not show a normal distribution (Figure 3). Therefore, the number of samples varied for the different soil layers. The SOC was 1.76–132.99 g/kg with a mean value of 35.95 g/kg at 0–10 cm, 0.67–92.67 g/kg with a mean value of 20.98 g/kg at 10–30 cm, and 0.89–70.11 g/kg with a mean value of 13.77 g/kg at 30–60 cm, respectively (Table 2). The coefficients of variation (CV) were 62.81, 72.74, and 81.92%, respectively.
3.2. Spatial Distribution Characteristics of SOC in Subtropical Forests
Semi-covariance models are often used to analyze the spatial distribution of SOC [51,52]. The semi-covariance model fitting results for the SOC content for the three soil layers are listed in Table 3. In the study area, the SOC content distribution was consistent with the exponential model, with a determination coefficient (Radj2) of 0.506 in the upper soil layer. In addition, the SOC content distribution was consistent with the Gaussian model in the middle and lower soil layers, with determination coefficients (Radj2) of 0.560 and 0.572, respectively. The nugget coefficient C0/(C0 + C) of the SOC content of all soil layers was >0.7, suggesting a weakened spatial autocorrelation in the SOC content. The nugget coefficients indicate that the distribution of the SOC content is mainly influenced by structural factors such as topography and forest type. As shown in Figure 4, the SOC content showed a decreasing trend from southwest to northeast in the upper soil layer. Some high-value areas were distributed in the south and west, and some low-value areas were distributed in the north and east of the upper soil layer. In the middle soil layer, the high-value areas were distributed in the west, and the low-value areas were distributed in the east and north. In the lower soil layer, the high-value areas were patchily distributed in the south, and the lower-value areas were patchily distributed in the northeast.
3.3. Analysis of Topographic Factors of SOC in Subtropical Forests
3.3.1. Elevation and Forest Type
The results indicated that the SOC content of each soil layer increased with increasing elevation (Figure 5 and Figure 6), whereas in the upper soil layer, SOC content was 20.10 g/kg, 32.48 g/kg, 36.50 g/kg, 43.77 g/kg, and 59.36 g/kg, respectively. With the increasing elevation in the middle soil layer, SOC content was 11.24 g/kg, 17.79 g/kg, 21.40 g/kg, 26.61 g/kg, and 36.70 g/kg, respectively. In the lower soil layer, SOC content was 6.99 g/kg, 12.84 g/kg, 14.29 g/kg, 18.23 g/kg, and 20.37 g/kg, respectively. There were differences in the patterns of SOC content with elevation among the different forest types (Figure 5). For the BLF, the pattern of SOC content with elevation in all soil layers was consistent with the total. For the CF, the SOC content in the upper two soil layers increased with elevation, decreased slightly, and then increased. However, elevation differences were insignificant in the lower soil layers (p > 0.05). For the MCBF, there was a reduction in the SOC content of the upper soil layer as it increased with elevation. In contrast, the SOC content of the middle soil layer continuously increased, and there was no significant difference in the SOC content of the lower soil layer (p > 0.05). For the BF, the SOC content showed a bimodal trend of increasing, decreasing, and then increasing. For the SL, the SOC content was lower than that of the other forest types, and the difference between different elevations was insignificant (p > 0.05).
3.3.2. Slope Gradient and Forest Type
The results indicated that the SOC content of each soil layer increased from a gentle slope to a dangerous slope (Figure 7 and Figure 8): in the upper soil layer, with an increasing slope gradient, SOC content was 15.56 g/kg, 31.07 g/kg, 35.63 g/kg, 40.19 g/kg, and 52.34 g/kg, respectively. In the middle soil layer, with an increasing slope gradient, SOC content was 7.52 g/kg, 16.09 g/kg, 20.89 g/kg, 24.46 g/kg, and 30.41 g/kg, respectively. SOC contents in the lower soil layer were 5.25 g/kg, 10.35 g/kg, 13.83 g/kg, 15.75 g/kg, and 20.40 g/kg, respectively. For the BLF, the SOC content of each layer increased with increasing slope gradient, but the difference gradually diminished from the upper soil layer to the lower soil layer. For the CF, the SOC content decreased on steep slopes as the gradient increased. The SOC content of the dangerous slope was significantly higher than that of the gentle slope in the middle and lower soil layers (p < 0.05). However, in the upper soil layer, the SOC content was not significantly different between the slope gradients (p > 0.05). For the MCBF, the SOC content decreased with increasing slope gradient, but the difference was not significant (p > 0.05). For the BF, the SOC content increased with increasing slope gradients in the upper and middle layers, but a decrease occurred from the abrupt slope to the steep slope in the lower layer. For the SL, the SOC content was highest at an abrupt slope, but the difference between slope gradients was insignificant in all soil layers (p > 0.05).
3.3.3. Slope Position and Forest Type
The results indicated that the SOC content gradually decreased from the upper slope to the lower slope (Figure 9 and Figure 10). In the upper soil layer, SOC content from high to low was 42.91 g/kg (upper slope), 39.16 g/kg (middle slope) and 23.71 g/kg (lower slope), respectively. SOC content in the middle soil layer was 24.34 g/kg (upper slope), 23.11 g/kg (middle slope), and 14.18 g/kg (lower slope), respectively. In the lower soil layer, SOC content was 15.15 g/kg (upper slope), 15.06 g/kg (middle slope), and 10.11 g/kg (lower slope). The SOC content of the lower slope was significantly lower than that of the upper and middle slopes (p < 0.05). In the upper soil layer, the SOC content gradually decreased from the upper to the lower slopes for all forest types. For the CF, MCBF, and SL, the SOC content of each soil layer was not significantly different among the slope positions (p > 0.05).
3.3.4. Slope Direction and Forest Type
There were some differences in SOC content between different slope directions in the forest ecosystem of the Zhejiang Province (Figure 11). The slope directions are north (N), northeast (NE), east (E), southeast (SE), south (S), southwest (SW), west (W), and northwest (NW) in clockwise order. SOC contents of the N and NW directions were higher than those of the other slope directions. No significant difference was observed between the SOC contents of the different slope directions in all soil layers (p > 0.05). For the BLF, the SOC content in the upper and middle soil layers was significantly higher than in the SL (p < 0.05). For the CF, the SOC content of the SL was higher than that of the other slope directions. For the MCBF, NW had the highest SOC content.
3.4. Analysis of Main Control Factors
There were significant differences in the average SOC content among the different elevations, slope gradients, and slope positions in all the soil layers (p < 0.01) (Table 4). However, the differences in the average SOC content between the different slope directions were insignificant in all the soil layers (p > 0.05). The influences of elevation, slope gradient, slope position, slope direction, and forest type on the spatial variation in SOC in subtropical forest ecosystems in the Zhejiang Province varied (Table 5). Regression analysis showed that elevation explained the greatest variation in the spatial distribution of the SOC content in the upper soil layer; Radj2 was 0.300. The Radj2 slope gradient, slope position, slope direction, and forest type were 0.210, 0.134, 0.001, and 0.135, respectively. The Radj2 values of the elevation and slope gradient SOC content models were 0.333. The Radj2 value was improved by 0.033–0.366 after introducing the slope gradient into the model. With the deepening of the soil layer, the explanation rate of the spatial variation of SOC by each influencing factor gradually decreased. However, the interpretation rate of the slope gradient increased from the upper to the middle soil layer. The Radj2 values of the SOC model for elevation and slope gradient were 0.343 in the middle soil layer and 0.265 in the lower soil layer.
4. Discussion
4.1. Spatial Distribution of SOC Content in Subtropical Forests
Soil organic carbon is highly spatially variable [53]. A combination of factors influences the spatial distribution of SOC in forests. Environmental factors include climate, topography, and soil properties, and anthropogenic factors include artificial carbon application and fertilizer use [54,55,56,57,58]. The subtropical forest in the Zhejiang Province is a complex and variable ecosystem. The coefficient of spatial variation of the SOC content was 62.81%–81.92%, which was moderate [59]. Dai et al. obtained the same results for the spatial variation in SOC density in subtropical forest ecosystems in southeastern China [43]. High SOC content values were mostly distributed in the southwest part of Zhejiang. Low values were found in the northeast part (Figure 4). This coincides with the topographic trend in which the elevation decreases from southwest to northeast. This is due to the ability of topographic factors to influence the spatial variation in SOC [60]. The nugget coefficient for the SOC content was 0.809–0.977. Cambardella et al. classified nugget coefficients as follows: <0.25, strong spatial dependence; 0.25–0.75, moderate spatial dependence; and >0.75, weak spatial dependence [61]. The results showed that the deeper the soil layer, the greater the nugget coefficient of the SOC content (Table 3). Therefore, SOC content is susceptible to structural factors. The interaction effect of adjacent soils is weak.
The upper soil layer had a higher SOC content than the lower layer (Figure 12). Li et al. demonstrated that soil depth significantly affects the SOC content in karst areas [62]. Yu et al. also found that the SOC content of the Loess Plateau decreased along the vertical profile [63]. The CV of the SOC content increased from 62.81% to 81.92% vertically downward along the soil profile (Table 2). This indicates that the difference among horizontal positions is more pronounced in deeper soil layers than in the surface layers. The explanation is that the surface soil is in contact with the outside world and is influenced more by climate, topography, and other environmental factors. Spatial autocorrelation still exists in a small area with a patchy distribution [43,64]. In deeper layers, the soil is mainly affected by root secretions, decaying roots, and soil microorganisms [65].
4.2. Topographic Factors Influence SOC Content in Subtropical Forests
The aboveground vegetation type strongly influences the distribution of SOC [66]. Subtropical forest ecosystems have complex and diverse vegetation. In this study, all soil samples were divided into five forest types according to aboveground vegetation type (BLF, CF, MCBF, BF, and SL) to control for the effect of aboveground vegetation type as a variable on SOC content. Previous studies have shown that topographic factors can better explain variations in SOC [44,67,68,69,70]. Hence, we selected four topographic factors (elevation, slope gradient, slope position, and direction) to explore their impact on the SOC content of typical subtropical forests in the Zhejiang Province.
It has been demonstrated that in subtropical forest, high elevation areas tend to have higher SOC content [71]. The same conclusion was reached in this paper (Figure 5). This might be due to a decrease in temperature with increasing elevation (Figure 13a), leading to a reduction in the rate of SOC decomposition and mineralization [72,73,74]. These changes create an environment conducive to SOC accumulation. For the BLF, the SOC content increased with increasing elevation. This may be because the vertical distribution of forest vegetation gradually changed from evergreen broad-leaved forests to deciduous broad-leaved forests. An increase in litter promotes organic carbon input [75]. For the CF, a slight decrease in the SOC content was observed between 200 and 800 m elevation with increasing elevation (Figure 5). This is probably because SOC is more sensitive to the temperature at higher elevations, which accelerates the mineralization of SOC, leading to a lower SOC content [76].
For the BF, the influence of elevation on the SOC content did not show a clear pattern (Figure 5). The highest SOC content was found at 600–800 m. In this study, the BF vegetation type was Moso bamboo. As a cash crop, most Moso bamboo forests are under long-term management in the subtropical forests of southeastern China [77]. Many studies have shown that the intensity and duration of artificial management significantly influence the SOC of the Moso bamboo forests [78,79]. In the Zhejiang Province, most of the commercial Moso bamboo forests in the middle- and high-elevation areas have been abandoned due to high operational costs and transportation challenges, which contributes to the increase in SOC [80].
For the SL, the SOC content increased with elevation, but the magnitude gradually decreased (Figure 5). The direct effect of elevation on SOC in SL is less than the indirect effect through a combination of other factors (e.g., soil nutrients such as N, P, and K) [81]. The increase in elevation diminishes these indirect effects, resulting in a weaker increase in SOC. In general, high elevations promote organic carbon accumulation in subtropical forest soils. Usually, higher carbon leaching occurs in the soil at higher slope gradients. Soil organic content and density decrease [82,83,84]. However, in the present study, steeper slopes accumulated more SOC (Figure 7). An increased slope gradient promoted SOC accumulation in the BLF and BF. Some scholars have used soil density to explain this phenomenon (ρ). Zhang et al. found that ρ is negatively correlated with SOC content, indicating that high soil density is not conducive to SOC accumulation [85].
As shown in Figure 13b, precipitation increased with increasing slope and decreasing temperature in subtropical forests. Heavy precipitation creates an environment of low soil density in large slope areas, and lower temperatures reduce the rate of SOC decomposition and promote the accumulation of SOC. However, a reduction in soil density may cause a decrease in SOC density. This relationship needs to be further analyzed in conjunction with soil bulk density. In addition, we surmise that other factors may be involved. Steep slopes are generally unsuitable for the growth of broad-leaved tree species. Moreover, because of its slender shape and shallow roots, bamboo is more likely to fall over than other tree species. As the plant decomposes, the residues enter the soil, thereby increasing the organic carbon input. However, the driving mechanism of the slope gradient on the SOC distribution still needs to be analyzed in greater depth. We observed a decrease in SOC content from an abrupt slope (25–34°) to a steep slope (35–44°) in CF and SL (Figure 7). This is probably because a large slope is not conducive to litter deposition and reduces the organic carbon sources.
For the MCBF, the SOC content decreased and then remained at the same level from a moderate slope to a steep slope. This may be because of the loss of SOC caused by increased soil erosion with increasing slope. A threshold existed between 24° and 29°. After the threshold, soil erosion decreased. As soil erosion decreased, SOC loss no longer increased [86]. In addition, because steep slopes are generally located at high elevations, the change in temperature and humidity after a shift in geographical location affects the decomposition rate of SOC, which may also be a reason for the difference in SOC content.
It has been shown that the slope position (i.e., upper or lower slope) can influence the distribution of SOC (Figure 9). For instance, Lin and Cui found that SOC content was higher at lower slope positions in cool conifer forests in the north of the Great Khingan Mountains [87]. Xue et al. found that in the CF, the SOC content was higher on the lower slope than on the upper slope [88]. The present study obtained the opposite result: the SOC content was in the descending order of upper slope > middle slope > lower slope. All the forest types showed similar patterns. The SOC content was significantly lower in the lower slope than in the upper and middle slopes in the BLF and the upper and middle soils of the BF (p < 0.05). The effects of slope position on SOC are the following: (i) different slope positions change the temperature and humidity, thus changing the SOC content in the soil by affecting the rate of SOC accumulation [89]; (ii) there are different degrees of soil erosion or leaching at different slope locations, which changes the organic carbon content of the soil [90,91].
The temperatures of the middle and upper slopes were lower than those of the lower slopes in the subtropical forests of the Zhejiang Province (Figure 13c). Low temperatures inhibit soil microorganism activity and slow the rate of SOC decomposition. This factor could be the reason why the SOC content of the upper slope was greater than that of the lower slope. There was no significant difference in SOC distribution among the different slope directions (Figure 11). However, differences became apparent after the division of the forest types. The SOC content was significantly higher on the northeast slope than on the southwest slope of the BLF. This trend may be due to the difference in slope direction, which affects the intensity of sunlight. The sunshine intensity on the northeast slope was less than that on the southwest slope because the Zhejiang Province is in the northern hemisphere. Lower ground temperature with low sunlight intensity slows the mineralization rate of SOC [92].
4.3. Topographic Factors Influence SOC Spatial Heterogeneity in Subtropical Forests
The complex topography, unstable subtropical monsoon climate, and anthropogenic disturbances caused by high social development levels have jointly influenced the spatial heterogeneity of SOC in the typical subtropical forest ecosystems in the Zhejiang Province. This study found that elevation explained the highest SOC spatial differentiation characteristics in subtropical forests in the Zhejiang Province (Table 5). The SOC model with elevation and forest type for the upper soil layer (0–10 cm) explained 33.3% of the spatial variation. This result supports that of the study by Oueslati et al., which reported that elevation could explain 31.8% of the variation [93]. After introducing a slope gradient into the model, the explanation rate increased to 36.6%. This suggests that elevation, slope gradient, and forest type should be considered as influencing factors when investigating the spatial variability of soil in the surface layer. The forest-type variable was removed from the model when the regression analysis was performed in the middle (10–30 cm) and lower (30–60 cm) soil layers. Therefore, we can ignore the effect of forest type when studying the spatial differentiation characteristics of soil organic carbon at 10–30 cm.
The distribution characteristics of soil organic carbon density (SOCD) under different topographic conditions were similar to those of SOCC. We could not clearly analyze the distribution characteristics of SOCD in the vertical direction because the depth of each soil layer was not the same. Therefore, we did not include SOCD as an index in our study. The effect of geology and parent material on soil organic carbon content was not within the scope of our study because we did not record geology and parent material data of the soil.
5. Conclusions
The average SOC content of each soil layer in the study area was 35.95 g/kg (0–10 cm), 20.98 g/kg (10–30 cm), and 13.77 g/kg (30–60 cm). The CV was 62.81% (0–10 cm), 72.74% (10–30 cm), and 81.92% (30–60 cm). The SOC content showed moderate intensity variations. The semi-covariance function model shows the structural and spatial variability of SOC in the 0–10 cm soil layer and 10–30 cm soil layers and randomness in the 30–60 cm. The spatial distribution of SOC showed a decreasing trend from southwest to northeast. In the 0–30 cm soil layer, the high- and low-value areas of SOC had a continuous distribution, while 30–60 cm had a patchy distribution.
Elevation was positively correlated with SOC content. The slope was positively correlated with SOC content in broad-leaved, coniferous, bamboo, and shrubland forests but negatively correlated in mixed coniferous and broad-leaved forests. The slope position (upper to lower) was negatively correlated with SOC content. In the upper (0–10 cm) and middle (10–30 cm) soil layers, elevation explained the most spatial variation in SOC. Next were the slope gradient, slope position, and slope direction. The slope gradient had the highest explanation rate in the lower (30–60 cm) soil layer.
The results of the semi-covariance function model illustrate that structural factors primarily influence the spatial distribution of SOC in the upper and middle soil layers. However, the spatial distribution of SOC in the lower soil layer is more likely to be influenced by stochastic factors. In 0–10 cm, the SOC model that integrated forest type was better. This indicates that the effect of forest type should be considered when analyzing the spatial distribution of SOC in the top soil layer.
Author Contributions
Conceptualization, T.Z., Y.L. (Yulong Lv), L.X., Y.Z., T.M. and Y.S.; Methodology, T.Z., Y.L. (Yulong Lv) and N.Y.; Software, T.Z.; Formal analysis, T.Z. and Y.L. (Yulong Lv); Data curation, T.Z.; Writing—original draft preparation, T.Z. and Y.L. (Yulong Lv); Writing—review and editing, T.Z., Y.L. (Yulong Lv), L.X., Y.Z., T.M., Y.L. (Yongfu Li) and Y.S.; Visualization, T.Z., Y.L. (Yulong Lv) and N.Y.; Investigation, B.X. and N.Y.; Sample collection, T.Z., B.X., L.X. and N.Y.; Funding acquisition, L.X., Y.Z. and Y.S.; Supervision, Y.S.; Project administration, Y.S. All authors have read and agreed to the published version of the manuscript.
Funding
This research was funded by the Key Research and Development Program of the Zhejiang Province (Grant number: 2023C02003); the National Natural Science Foundation of China (Grant number: 32001315; U1809208; 31870618); the Key Research and Development Program of the Zhejiang Province (Grant number: 2021C02005); the Scientific Research Development Fund of Zhejiang A&F University (Grant number: 2020FR008); the Key Research and Development Program of the Zhejiang Province (Grant number: 2022C03039).
Data Availability Statement
We cannot release the data for legal reasons.
Acknowledgments
The authors gratefully acknowledge the support of various foundations. The authors are grateful to the editor and the anonymous reviewers whose comments have contributed to improving the quality of this study.
Conflicts of Interest
The authors declare no conflict of interest.
References
- Su, Z.; Su, B.; Shangguan, Z. Progress of Research on the Effect of Decomposition of Plant Apoplastic Matter on Soil Organic Carbon Stability. Soil Water Conserv. Res. 2022, 2, 29. [Google Scholar]
- Han, Z.; Zhan, C.; Shi, B.; Wang, L.; Luo, H.; Xu, Q. Effects of Different Treatments of Apoplastic Inputs on Surface Soil Organic Carbon in Warm Temperate Hemlock Forests. Henan For. Sci. Technol. 2022, 2, 42. [Google Scholar]
- Zhou, M.; Xiao, H.; Nie, X.; Li, Z.; Deng, C.; Liu, J.; Zhang, Y. Analysis and Prospect of Soil Organic Carbon Research Process in China and Abroad in the Past 30a. Soil Water Conserv. Res. 2020, 27, 10. [Google Scholar]
- Batjes, N.H. Total Carbon and Nitrogen in the Soils of the World. Eur. J. Soil Sci. 2014, 65, 10–21. [Google Scholar] [CrossRef]
- Diffenbaugh, N.S.; Field, C.B. Changes in Ecologically Critical Terrestrial Climate Conditions. Science 2013, 341, 486–492. [Google Scholar] [CrossRef] [PubMed]
- Fang, X.; Zhang, J.; Meng, M.; Guo, X.; Wu, Y.; Liu, X.; Zhao, K.; Ding, L.; Shao, Y.; Fu, W. Forest-Type Shift and Subsequent Intensive Management Affected Soil Organic Carbon and Microbial Community in Southeastern China. Eur. J. For. Res. 2017, 136, 689–697. [Google Scholar] [CrossRef]
- Malhi, G.S.; Kaur, M.; Kaushik, P. Impact of Climate Change on Agriculture and Its Mitigation Strategies: A Review. Sustainability 2021, 13, 1318. [Google Scholar] [CrossRef]
- Vitillo, J.G.; Eisaman, M.D.; Aradó, E.S.P.; Passarini, F.; Wang, T.; Sheehan, S.W. The Role of Carbon Capture, Utilization, and Storage for Economic Pathways That Limit Global Warming to below 1.5 °C. iScience 2022, 25, 104237. [Google Scholar] [CrossRef]
- Chabbi, A.; Rumpel, C.; Grootes, P.M.; González-Pérez, J.A.; Delaune, R.D.; Gonzalez-Vila, F.; Nixdorf, B.; Hüttl, R.F. Lignite Degradation and Mineralization in Lignite-Containing Mine Sediment as Revealed by 14C Activity Measurements and Molecular Analysis. Org. Geochem. 2006, 37, 957–976. [Google Scholar] [CrossRef]
- Scharlemann, J.P.W.; Tanner, E.V.J.; Hiederer, R.; Kapos, V. Global Soil Carbon: Understanding and Managing the Largest Terrestrial Carbon Pool. Carbon Manag. 2014, 5, 81–91. [Google Scholar] [CrossRef]
- Martin, M.P.; Wattenbach, M.; Smith, P.; Meersmans, J.; Jolivet, C.; Boulonne, L.; Arrouays, D. Spatial Distribution of Soil Organic Carbon Stocks in France. Biogeosciences 2011, 8, 1053–1065. [Google Scholar] [CrossRef]
- Wang, X.; Zhu, B.; Hua, K.; Luo, Y.; Zhang, J.; Zhang, A. Assessment of Soil Organic Carbon Stock in the Upper Yangtze River Basin. J. Mt. Sci. 2013, 10, 866–872. [Google Scholar] [CrossRef]
- Kirschbaum, M.U.F. Will Changes in Soil Organic Carbon Act as a Positive or Negative Feedback on Global Warming? Biogeochemistry 2000, 48, 21–51. [Google Scholar] [CrossRef]
- Ozlu, E.; Arriaga, F.J.; Bilen, S.; Gozukara, G.; Babur, E. Carbon Footprint Management by Agricultural Practices. Biology 2022, 11, 1453. [Google Scholar] [CrossRef] [PubMed]
- Johnson, A.H.; Xing, H.X.; Scatena, F.N. Controls on Soil Carbon Stocks in El Yunque National Forest, Puerto Rico. Soil Sci. Soc. Am. J. 2015, 79, 294–304. [Google Scholar] [CrossRef]
- Post, W.M.; Emanuel, W.R.; Zinke, P.J.; Stangenberger, A.G. Soil Carbon Pools and World Life Zones. Nature 1982, 298, 156–159. [Google Scholar] [CrossRef]
- Guo, L.B.; Gifford, R.M. Soil Carbon Stocks and Land Use Change: A Meta Analysis. Glob. Change Biol. 2002, 8, 345–360. [Google Scholar] [CrossRef]
- Meentemeyer, V. Macroclimate and Lignin Control of Litter Decomposition Rates. Ecology 1978, 59, 465–472. [Google Scholar] [CrossRef]
- Melillo, J.M.; Aber, J.D.; Muratore, J.F. Nitrogen and Lignin Control of Hardwood Leaf Litter Decomposition Dynamics. Ecology 1982, 63, 621–626. [Google Scholar] [CrossRef]
- Mitra, A.; Banerjee, K.; Sett, S. Spatial Variation in Organic Carbon Density of Mangrove Soil in Indian Sundarbans. Natl. Acad. Sci. Lett. 2012, 35, 147–154. [Google Scholar] [CrossRef]
- Parton, W.; Silver, W.L.; Burke, I.C.; Grassens, L.; Harmon, M.E.; Currie, W.S.; King, J.Y.; Adair, E.C.; Brandt, L.A.; Hart, S.C.; et al. Global-Scale Similarities in Nitrogen Release Patterns during Long-Term Decomposition. Science 2007, 315, 361–364. [Google Scholar] [CrossRef] [PubMed]
- Doetterl, S.; Berhe, A.A.; Nadeu, E.; Wang, Z.; Sommer, M.; Fiener, P. Erosion, Deposition and Soil Carbon: A Review of Process-Level Controls, Experimental Tools and Models to Address C Cycling in Dynamic Landscapes. Earth-Sci. Rev. 2016, 154, 102–122. [Google Scholar] [CrossRef]
- Seibert, J.; Stendahl, J.; Sørensen, R. Topographical Influences on Soil Properties in Boreal Forests. Geoderma 2007, 141, 139–148. [Google Scholar] [CrossRef]
- Mayes, M.; Marin-Spiotta, E.; Szymanski, L.; Akif Erdoǧan, M.; Ozdoǧan, M.; Clayton, M. Soil Type Mediates Effects of Land Use on Soil Carbon and Nitrogen in the Konya Basin, Turkey. Geoderma 2014, 232–234, 517–527. [Google Scholar] [CrossRef]
- Vasques, G.M.; Grunwald, S.; Comerford, N.B.; Sickman, J.O. Regional Modelling of Soil Carbon at Multiple Depths within a Subtropical Watershed. Geoderma 2010, 156, 326–336. [Google Scholar] [CrossRef]
- Gray, J.M.; Bishop, T.F.A.; Wilson, B.R. Factors Controlling Soil Organic Carbon Stocks with Depth in Eastern Australia. Soil Sci. Soc. Am. J. 2015, 79, 1741–1751. [Google Scholar] [CrossRef]
- Hobley, E.; Wilson, B.; Wilkie, A.; Gray, J.; Koen, T. Drivers of Soil Organic Carbon Storage and Vertical Distribution in Eastern Australia. Plant Soil 2015, 390, 111–127. [Google Scholar] [CrossRef]
- Wiesmeier, M.; Urbanski, L.; Hobley, E.; Lang, B.; von Lützow, M.; Marin-Spiotta, E.; van Wesemael, B.; Rabot, E.; Ließ, M.; Garcia-Franco, N.; et al. Soil Organic Carbon Storage as a Key Function of Soils—A Review of Drivers and Indicators at Various Scales. Geoderma 2019, 333, 149–162. [Google Scholar] [CrossRef]
- Chaplot, V.; Bouahom, B.; Valentin, C. Soil Organic Carbon Stocks in Laos: Spatial Variations and Controlling Factors. Glob. Change Biol. 2010, 16, 1380–1393. [Google Scholar] [CrossRef]
- Rossel, R.A.V.; Lee, J.; Behrens, T.; Luo, Z.; Baldock, J.; Richards, A. Continental-Scale Soil Carbon Composition and Vulnerability Modulated by Regional Environmental Controls. Nat. Geosci. 2019, 12, 547–552. [Google Scholar] [CrossRef]
- Sedjo, R.A.; Wisniewski, J.; Sample, A.V.; Kinsman, J.D. The Economics of Managing Carbon via Forestry: Assessment of Existing Studies. Environ. Resour. Econ. 1995, 6, 139–165. [Google Scholar] [CrossRef]
- Dixon, R.K.; Brown, S.; Houghton, R.A.; Solomon, A.M.; Trexler, M.C.; Wisniewski, J. Carbon Pools and Flux of Global Forest Ecosystems. Science 1994, 263, 185–190. [Google Scholar] [CrossRef] [PubMed]
- Li, C.; Zhou, G.; Shi, Y.; Zhou, Y.; Xu, L.; Fan, Y.; Shen, Z.; Li, S.; Lv, Y. Effects of Different Management Measures on the Net Carbon Sink Capacity of Moso Bamboo Forest Ecosystems. For. Sci. 2017, 53, 9. [Google Scholar]
- Yan, L.; Yang, W.; Lin, G.; Dong, P. Impacts of Climate Warming on Forest Ecosystems. Trop. Geogr. 2013, 33, 621–627. [Google Scholar]
- Bonan, G.B. Forests and Climate Change: Forcings, Feedbacks, and the Climate Benefits of Forests. Science 2008, 320, 1444–1449. [Google Scholar] [CrossRef]
- Yu, G.; Chen, Z.; Piao, S.; Peng, C.; Ciais, P.; Wang, Q.; Lia, X.; Zhu, X. High Carbon Dioxide Uptake by Subtropical Forest Ecosystems in the East Asian Monsoon Region. Proc. Natl. Acad. Sci. USA 2014, 111, 4910–4915. [Google Scholar] [CrossRef]
- Kögel-Knabner, I.; Amelung, W. Soil Organic Matter in Major Pedogenic Soil Groups. Geoderma 2021, 384, 114785. [Google Scholar] [CrossRef]
- Dong, J.; Zhou, K.; Jiang, P.; Wu, J.; Fu, W. Revealing Horizontal and Vertical Variation of Soil Organic Carbon, Soil Total Nitrogen and C:N Ratio in Subtropical Forests of Southeastern China. J. Environ. Manag. 2021, 289, 112483. [Google Scholar] [CrossRef]
- Li, Y.; Liu, X.; Xu, W.; Bongers, F.J.; Bao, W.; Chen, B.; Chen, G.; Guo, K.; Lai, J.; Lin, D.; et al. Effects of Diversity, Climate and Litter on Soil Organic Carbon Storage in Subtropical Forests. For. Ecol. Manag. 2020, 476, 118479. [Google Scholar] [CrossRef]
- Chiti, T.; Díaz-Pinés, E.; Rubio, A. Soil Organic Carbon Stocks of Conifers, Broadleaf and Evergreen Broadleaf Forests of Spain. Biol. Fertil. Soils 2012, 48, 817–826. [Google Scholar] [CrossRef]
- Santonja, M.; Pereira, S.; Gauquelin, T.; Quer, E.; Simioni, G.; Limousin, J.M.; Ourcival, J.M.; Reiter, I.M.; Fernandez, C.; Baldy, V. Experimental Precipitation Reduction Slows Down Litter Decomposition but Exhibits Weak to No Effect on Soil Organic Carbon and Nitrogen Stocks in Three Mediterranean Forests of Southern France. Forests 2022, 13, 1485. [Google Scholar] [CrossRef]
- Zhang, F.; Du, Q.; Ge, H.; Liu, A.; Fu, W.; Ji, B. Spatial Distribution of Forest Carbon in Zhejiang Province with Geostatistics Based on CFI Sample Plots. Acta Ecol. Sin. 2012, 32, 5275–5286. [Google Scholar] [CrossRef]
- Dai, W.; Zhao, K.; Fu, W.; Jiang, P.; Li, Y.; Zhang, C.; Gielen, G.; Gong, X.; Li, Y.; Wang, H.; et al. Spatial Variation of Organic Carbon Density in Topsoils of a Typical Subtropical Forest, Southeastern China. Catena 2018, 167, 181–189. [Google Scholar] [CrossRef]
- Fang, H.; Ji, B.; Deng, X.; Ying, J.; Zhou, G.; Shi, Y.; Xu, L.; Tao, J.; Zhou, Y.; Li, C.; et al. Effects of Topographic Factors and Aboveground Vegetation Carbon Stocks on Soil Organic Carbon in Moso Bamboo Forests. Plant Soil 2018, 433, 363–376. [Google Scholar] [CrossRef]
- Fu, W.; Fu, Z.; Ge, H.; Ji, B.; Jiang, P.; Li, Y.; Wu, J.; Zhao, K. Spatial Variation of Biomass Carbon Density in a Subtropical Region of Southeastern China. Forests 2015, 6, 1966–1981. [Google Scholar] [CrossRef]
- Zhang, J.; Ge, Y.; Chang, J.; Jiang, B.; Jiang, H.; Peng, C.; Zhu, J.; Yuan, W.; Qi, L.; Yu, S. Carbon Storage by Ecological Service Forests in Zhejiang Province, Subtropical China. For. Ecol. Manage. 2007, 245, 64–75. [Google Scholar] [CrossRef]
- Wang, T.; Wang, G.; Innes, J.L.; Seely, B.; Chen, B. ClimateAP: An Application for Dynamic Local Downscaling of Historical and Future Climate Data in Asia Pacific. Front. Agric. Sci. Eng. 2017, 4, 448–458. [Google Scholar] [CrossRef]
- Bao, S. Agricultural Chemistry Committee of China Determination of Soil Organic Matter. In Soil and Agricultural Chemistry Analysis; Agricultural Publishing House Agriculture Press: Beijing, China, 2000; pp. 30–34. [Google Scholar]
- Bell, M.J.; Worrall, F. Estimating a Region’s Soil Organic Carbon Baseline: The Undervalued Role of Land-Management. Geoderma 2009, 152, 74–84. [Google Scholar] [CrossRef]
- Johnson, K.D.; Harden, J.; McGuire, A.D.; Bliss, N.B.; Bockheim, J.G.; Clark, M.; Nettleton-Hollingsworth, T.; Jorgenson, M.T.; Kane, E.S.; Mack, M.; et al. Soil Carbon Distribution in Alaska in Relation to Soil-Forming Factors. Geoderma 2011, 167–168, 71–84. [Google Scholar] [CrossRef]
- Blanchet, G.; Libohova, Z.; Joost, S.; Rossier, N.; Schneider, A.; Jeangros, B.; Sinaj, S. Spatial Variability of Potassium in Agricultural Soils of the Canton of Fribourg, Switzerland. Geoderma 2017, 290, 107–121. [Google Scholar] [CrossRef]
- Goovaerts, P. Geostatistics in Soil Science: State-of-the-Art and Perspectives. Geoderma 1999, 89, 1–45. [Google Scholar] [CrossRef]
- Wang, D.D.; Shi, X.Z.; Lu, X.X.; Wang, H.J.; Yu, D.S.; Sun, W.X.; Zhao, Y.C. Response of Soil Organic Carbon Spatial Variability to the Expansion of Scale in the Uplands of Northeast China. Geoderma 2010, 154, 302–310. [Google Scholar] [CrossRef]
- Beillouin, D.; Cardinael, R.; Berre, D.; Boyer, A.; Corbeels, M.; Fallot, A.; Feder, F.; Demenois, J. A Global Overview of Studies about Land Management, Land-Use Change, and Climate Change Effects on Soil Organic Carbon. Glob. Change Biol. 2022, 28, 1690–1702. [Google Scholar] [CrossRef] [PubMed]
- Chen, M.; Zhang, S.; Liu, L.; Liu, J.; Ding, X. Organic Fertilization Increased Soil Organic Carbon Stability and Sequestration by Improving Aggregate Stability and Iron Oxide Transformation in Saline-Alkaline Soil. Plant Soil 2022, 474, 233–249. [Google Scholar] [CrossRef]
- Han, J.; Zhang, A.; Kang, Y.; Han, J.; Yang, B.; Hussain, Q.; Wang, X.; Zhang, M.; Khan, M.A. Biochar Promotes Soil Organic Carbon Sequestration and Reduces Net Global Warming Potential in Apple Orchard: A Two-Year Study in the Loess Plateau of China. Sci. Total Environ. 2022, 803, 150035. [Google Scholar] [CrossRef]
- Huang, X.; Zhang, Z.; Zhou, Y.; Wang, X.; Zhang, J.; Zhou, X. Characteristics of Soil Organic Carbon under Different Karst Landforms. Carbonates Evaporites 2021, 36, 40. [Google Scholar] [CrossRef]
- Tsozue, D.; Noubissie, N.M.M.; Mamdem, E.L.T.; Basga, S.D.; Oyono, D.L.B. Effects of Environmental Factors and Soil Properties on Soil Organic Carbon Stock in a Natural Dry Tropical Area of Cameroon. SOIL 2021, 7, 677–691. [Google Scholar] [CrossRef]
- Fu, W.J.; Jiang, P.K.; Zhou, G.M.; Zhao, K.L. Using Moran’s i and GIS to Study the Spatial Pattern of Forest Litter Carbon Density in a Subtropical Region of Southeastern China. Biogeosciences 2014, 11, 2401–2409. [Google Scholar] [CrossRef]
- Tian, H.; Zhang, J.; Zhu, L.; Qin, J.; Liu, M.; Shi, J.; Li, G. Revealing the Scale- and Location-Specific Relationship between Soil Organic Carbon and Environmental Factors in China’s North-South Transition Zone. Geoderma 2022, 409, 115600. [Google Scholar] [CrossRef]
- Cambardella, C.A.; Moorman, T.B.; Novak, J.M.; Parkin, T.B.; Karlen, D.L.; Turco, R.F.; Konopka, A.E. Field-Scale Variability of Soil Properties in Central Iowa Soils. Soil Sci. Soc. Am. J. 1994, 58, 1501–1511. [Google Scholar] [CrossRef]
- Li, Y.; Gong, J.; Liu, J.; Hou, W.; Moroenyane, I.; Liu, Y.; Jin, J.; Liu, J.; Xiong, H.; Cheng, C.; et al. Effects of Different Land Use Types and Soil Depth on Soil Nutrients and Soil Bacterial Communities in a Karst Area, Southwest China. Soil Syst. 2022, 6, 20. [Google Scholar] [CrossRef]
- Yu, H.; Zha, T.; Zhang, X.; Ma, L. Vertical Distribution and Influencing Factors of Soil Organic Carbon in the Loess Plateau, China. Sci. Total Environ. 2019, 693, 133632. [Google Scholar] [CrossRef] [PubMed]
- Dad, J.M.; Shafiq, M. ul Spatial Distribution of Soil Organic Carbon in Apple Orchard Soils of Kashmir Himalaya, India. Carbon Manag. 2021, 12, 485–498. [Google Scholar] [CrossRef]
- Zhang, Y.J.; Guo, S.L. Contribution of Root Biomass to Soil Organic Carbon Under Complex Landforms Conditions. Huanjing Kexue/Environ. Sci. 2019, 40, 961–969. [Google Scholar]
- Du, Y.X.; Wu, C.J.; Zhou, S.X.; Huang, L.; Han, S.M.; Xu, X.F.; Ding, Y. Forest Soil Organic Carbon Density and Its Distribution Characteristics along an Altitudinal Gradient in Lushan Mountains of China. Chin. J. Appl. Ecol. 2011, 22, 1675–1681. [Google Scholar]
- Jakšić, S.; Ninkov, J.; Milić, S.; Vasin, J.; Živanov, M.; Jakšić, D.; Komlen, V. Influence of Slope Gradient and Aspect on Soil Organic Carbon Content in the Region of Niš, Serbia. Sustainability 2021, 13, 8332. [Google Scholar] [CrossRef]
- Tu, C.; He, T.; Lu, X.; Luo, Y.; Smith, P. Extent to Which PH and Topographic Factors Control Soil Organic Carbon Level in Dry Farming Cropland Soils of the Mountainous Region of Southwest China. Catena 2018, 163, 204–209. [Google Scholar] [CrossRef]
- Yu, H.; Zha, T.; Zhang, X.; Nie, L.; Ma, L.; Pan, Y. Spatial Distribution of Soil Organic Carbon May Be Predominantly Regulated by Topography in a Small Revegetated Watershed. Catena 2020, 188, 104459. [Google Scholar] [CrossRef]
- Yuan, Z.Q.; Fang, C.; Zhang, R.; Li, F.M.; Javaid, M.M.; Janssens, I.A. Topographic Influences on Soil Properties and Aboveground Biomass in Lucerne-Rich Vegetation in a Semi-Arid Environment. Geoderma 2019, 344, 137–143. [Google Scholar] [CrossRef]
- Ke, X.; Zhang, L.; Su, Z. Changes in Soil Organic Carbon along an Altitudinal Gradient in Subtropical Mountain Forests of Northern Guangdong. J. Ecol. Rural Environ. 2012, 28, 6. [Google Scholar]
- Njeru, C.M.; Ekesi, S.; Mohamed, S.A.; Kinyamario, J.I.; Kiboi, S.; Maeda, E.E. Assessing Stock and Thresholds Detection of Soil Organic Carbon and Nitrogen along an Altitude Gradient in an East Africa Mountain Ecosystem. Geoderma Reg. 2017, 10, 29–38. [Google Scholar] [CrossRef]
- Yu, F.; Zhang, Z.; Chen, L.; Wang, J.; Shen, Z. Spatial Distribution Characteristics of Soil Organic Carbon in Subtropical Forests of Mountain Lushan, China. Environ. Monit. Assess. 2018, 190, 545. [Google Scholar] [CrossRef] [PubMed]
- Yüksek, T.; Yüksek, F. Effects of Altitude, Aspect, and Soil Depth on Carbon Stocks and Properties of Soils in a Tea Plantation in the Humid Black Sea Region. L. Degrad. Dev. 2021, 32, 4267–4276. [Google Scholar] [CrossRef]
- Sauer, T.J.; Cambardella, C.A.; Brandle, J.R. Soil Carbon and Tree Litter Dynamics in a Red Cedar-Scotch Pine Shelterbelt. Agrofor. Syst. 2007, 71, 163–174. [Google Scholar] [CrossRef]
- Wang, G.; Zhou, Y.; Xu, X.; Ruan, H.; Wang, J. Temperature Sensitivity of Soil Organic Carbon Mineralization along an Elevation Gradient in the Wuyi Mountains, China. PLoS ONE 2013, 8, e53914. [Google Scholar] [CrossRef]
- Tang, X.; Xia, M.; Pérez-Cruzado, C.; Guan, F.; Fan, S. Spatial Distribution of Soil Organic Carbon Stock in Moso Bamboo Forests in Subtropical China. Sci. Rep. 2017, 7, srep42640. [Google Scholar] [CrossRef]
- Ni, H.; Su, W.; Fan, S.; Chu, H. Effects of Intensive Management Practices on Rhizosphere Soil Properties, Root Growth, and Nutrient Uptake in Moso Bamboo Plantations in Subtropical China. For. Ecol. Manag. 2021, 493, 119083. [Google Scholar] [CrossRef]
- Yang, C.; Wang, A.; Zhu, Z.; Lin, S.; Bi, Y.; Du, X. Impact of Extensive Management System on Soil Properties and Carbon Sequestration under an Age Chronosequence of Moso Bamboo Plantations in Subtropical China. For. Ecol. Manag. 2021, 497, 119535. [Google Scholar] [CrossRef]
- Deng, X.; Yin, J.; Xu, L.; Shi, Y.; Zhou, G.; Li, Y.; Chen, G.; Ye, Y.; Zhang, F.; Zhou, Y.; et al. Effects of Abandonment Management on Soil C and N Pools in Moso Bamboo Forests. Sci. Total Environ. 2020, 729, 138949. [Google Scholar] [CrossRef]
- Zhang, X.; Li, X.; Ji, X.; Zhang, Z.; Zhang, H.; Zha, T.; Jiang, L. Elevation and Total Nitrogen Are the Critical Factors That Control the Spatial Distribution of Soil Organic Carbon Content in the Shrubland on the Bashang Plateau, China. Catena 2021, 204, 105415. [Google Scholar] [CrossRef]
- Dad, J.M.; Abdollahi, L. Changes in Soil Organic Carbon, Nitrogen and Sulphur along a Slope Gradient in Apple Orchard Soils of Kashmir Himalaya. J. Mt. Sci. 2021, 18, 2377–2387. [Google Scholar] [CrossRef]
- Hu, W.; Zhai, X.; Du, S.; Zhang, X. Impacts of Slope and Longitudinal Ridge on Soil Organic Carbon Dynamics in the Typical Mollisols Sloping Farmland (China). Eurasian Soil Sci. 2021, 54, 951–963. [Google Scholar] [CrossRef]
- Sun, W.; Zhu, H.; Guo, S. Soil Organic Carbon as a Function of Land Use and Topography on the Loess Plateau of China. Ecol. Eng. 2015, 83, 249–257. [Google Scholar] [CrossRef]
- Zhang, X.; Adamowski, J.F.; Liu, C.; Zhou, J.; Zhu, G.; Dong, X.; Cao, J.; Feng, Q. Which Slope Aspect and Gradient Provides the Best Afforestation-Driven Soil Carbon Sequestration on the China’s Loess Plateau? Ecol. Eng. 2020, 147, 105782. [Google Scholar] [CrossRef]
- Jin, C. A Theoretical Study on Critical Erosion Slope Gradient. Acta Geograohica Sinca 1995, 50, 234–239. [Google Scholar]
- Lin, W.; Cui, X. The Influences of Topographic Factors on Soil Organic Carbon Storage in Cool Conifer Forest in the North of Great Xing ’ an Mountain. Fore. Eng. 2017, 33, 1–6. [Google Scholar] [CrossRef]
- Xue, L.; Xue, Y.; Lie, G.; Ye, L.; Huang, X. Soil Organic Carbon Storage on Different Slope Positions in Cunninghamia Lanceolata Stands. Bull. Soil Water Conserv. 2012, 32, 43–46. [Google Scholar] [CrossRef]
- Jakšić, S.; Ninkov, J.; Milić, S.; Vasin, J.; Živanov, M.; Perović, V.; Banjac, B.; Vučković, S.; Dozet, G.; Komlen, V. Topographic Position, Land Use and Soil Management Effects on Soil Organic Carbon (Vineyard Region of Niš, Serbia). Agronomy 2021, 11, 1438. [Google Scholar] [CrossRef]
- Abebe, G.; Tsunekawa, A.; Haregeweyn, N.; Takeshi, T.; Wondie, M.; Adgo, E.; Masunaga, T.; Tsubo, M.; Ebabu, K.; Berihun, M.L.; et al. Effects of Land Use and Topographic Position on Soil Organic Carbon and Total Nitrogen Stocks in Different Agro-Ecosystems of the Upper Blue Nile Basin. Sustainability 2020, 12, 2425. [Google Scholar] [CrossRef]
- Schöning, I.; Totsche, K.U.; Kögel-Knabner, I. Small Scale Spatial Variability of Organic Carbon Stocks in Litter and Solum of a Forested Luvisol. Geoderma 2006, 136, 631–642. [Google Scholar] [CrossRef]
- Román-Sánchez, A.; Vanwalleghem, T.; Peña, A.; Laguna, A.; Giráldez, J.V. Controls on Soil Carbon Storage from Topography and Vegetation in a Rocky, Semi-Arid Landscapes. Geoderma 2018, 311, 159–166. [Google Scholar] [CrossRef]
- Oueslati, I.; Allamano, P.; Bonifacio, E.; Claps, P. Vegetation and Topographic Control on Spatial Variability of Soil Organic Carbon. Pedosphere 2013, 23, 48–58. [Google Scholar] [CrossRef]
Figure 1.
Research area. (a) Sampling distribution; (b) Soil sample sites; (c) Soil stratification.

Figure 2.
Topographic map of the Zhejiang Province.
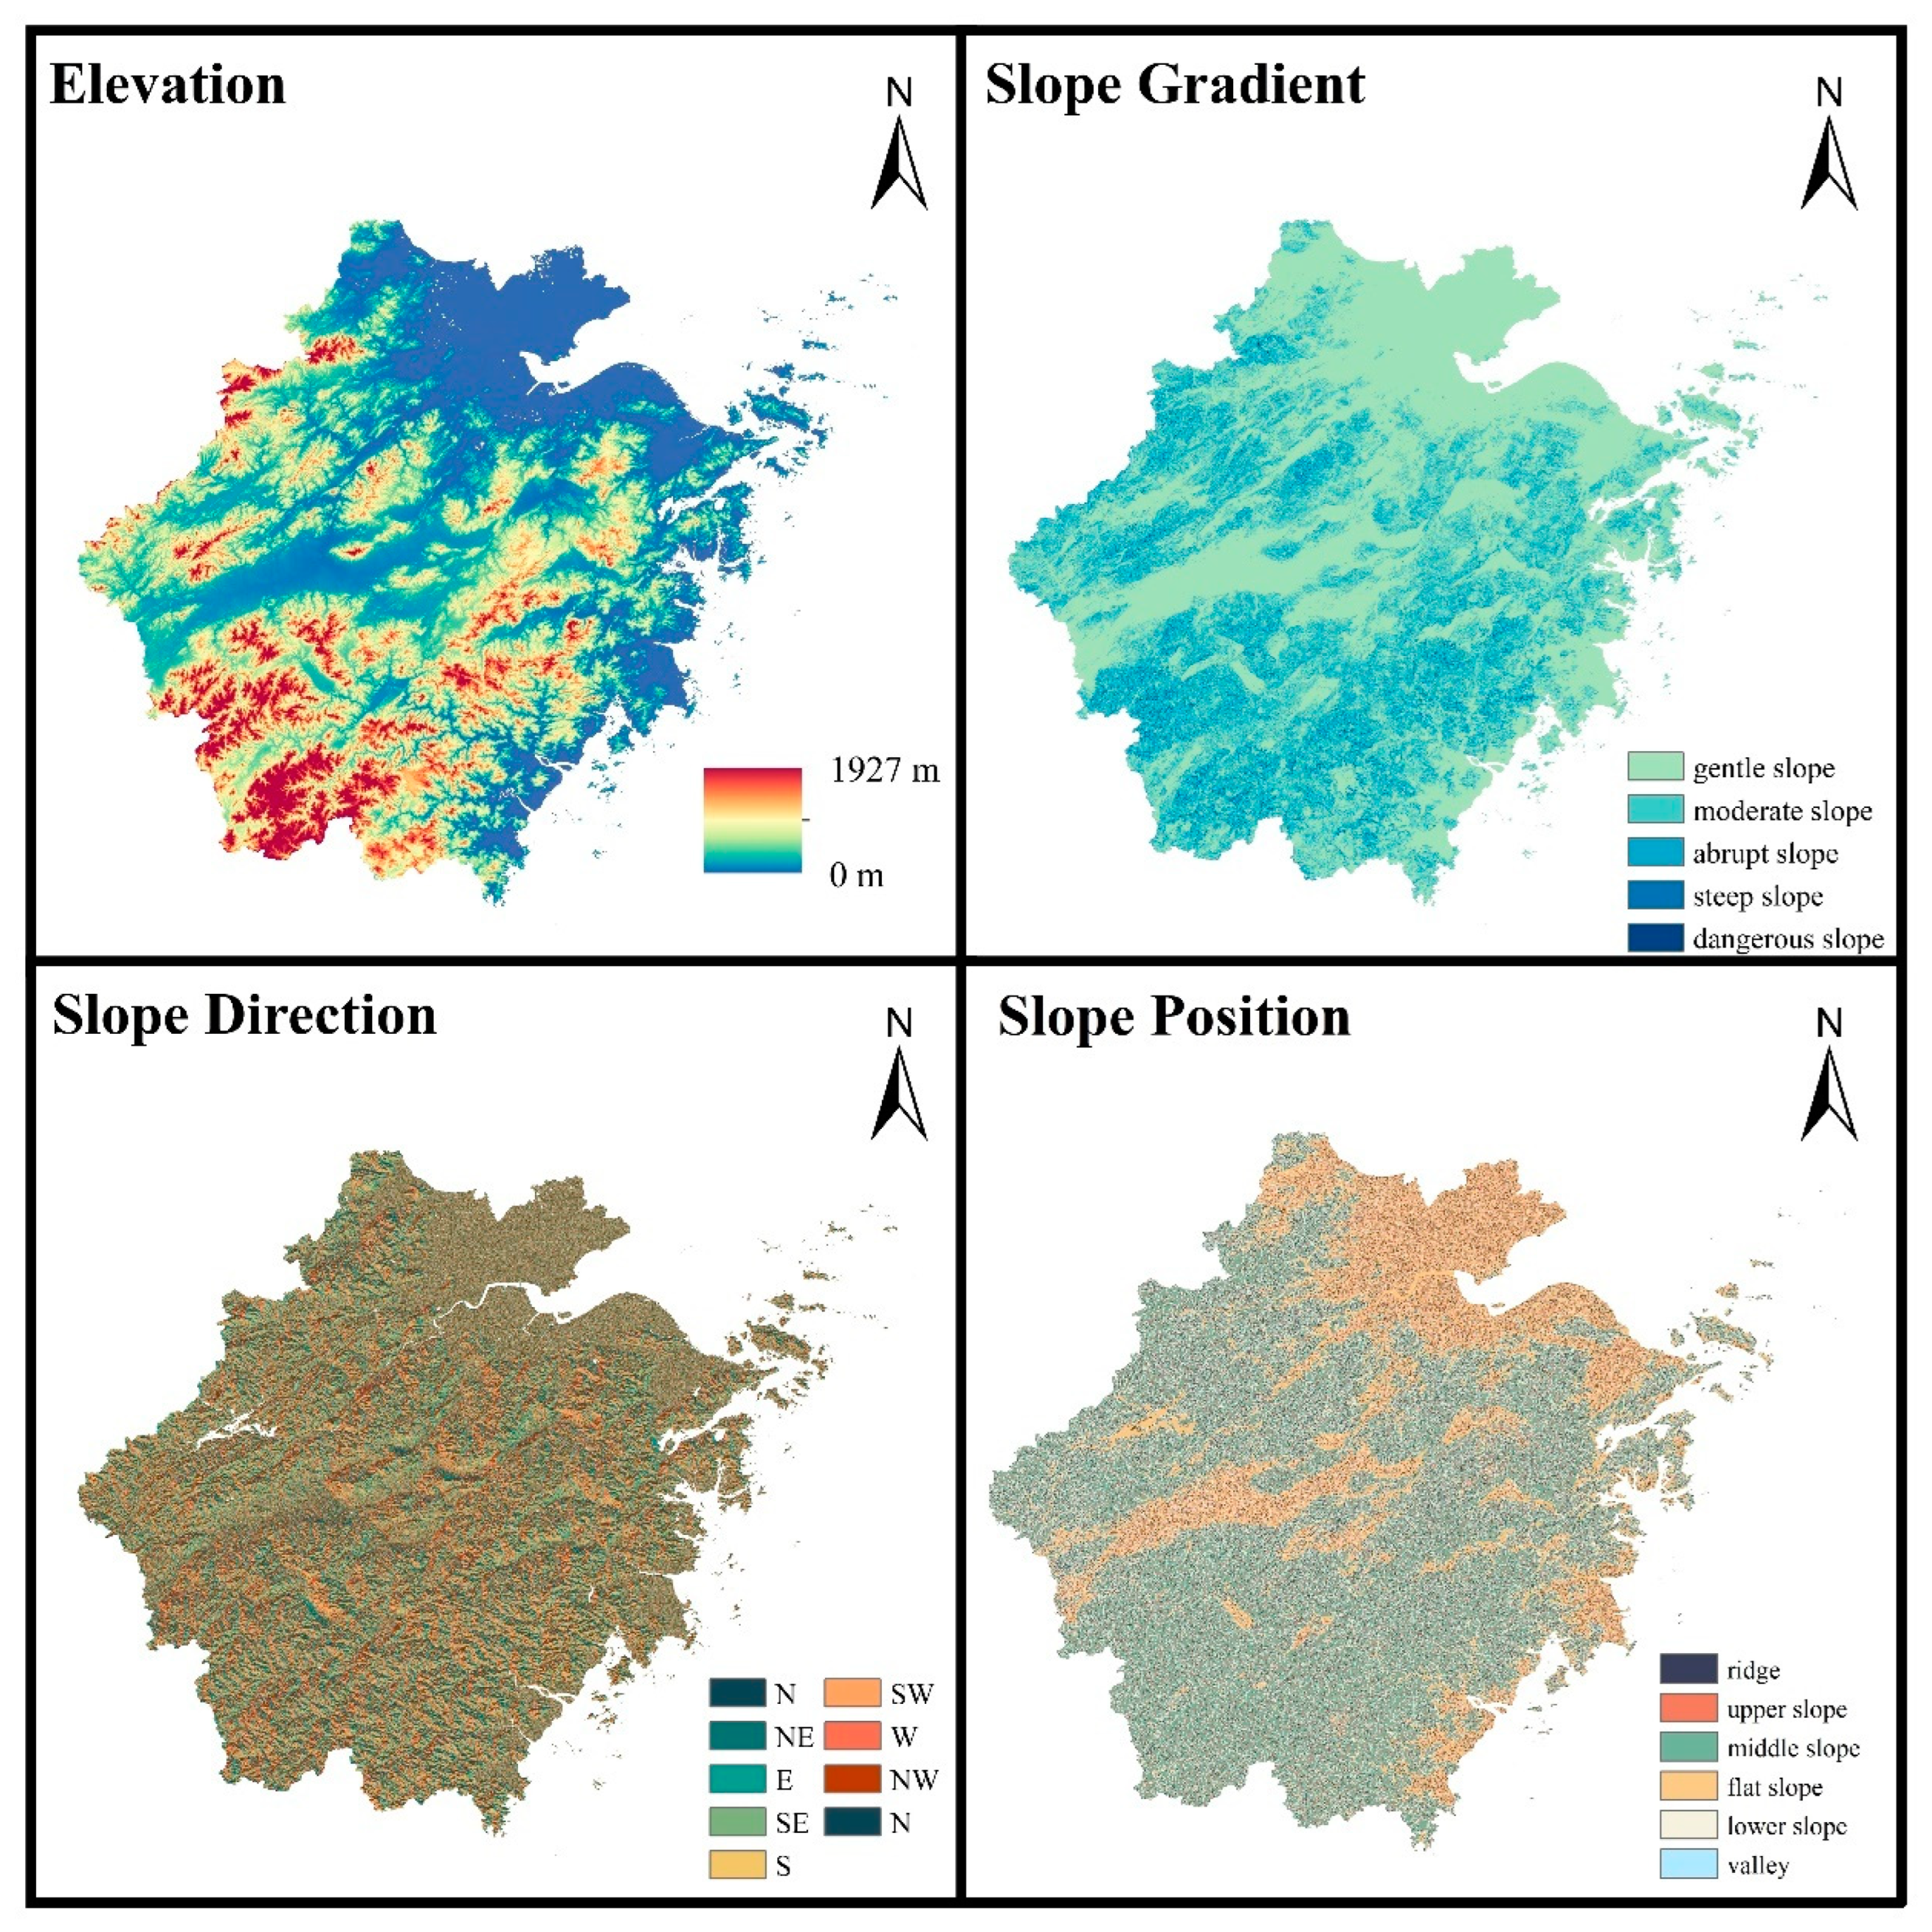
Figure 3.
Frequency distribution of SOCC and the logarithmic conversion value in the Zhejiang Province. SOCC: soil organic carbon content.
Figure 3.
Frequency distribution of SOCC and the logarithmic conversion value in the Zhejiang Province. SOCC: soil organic carbon content.
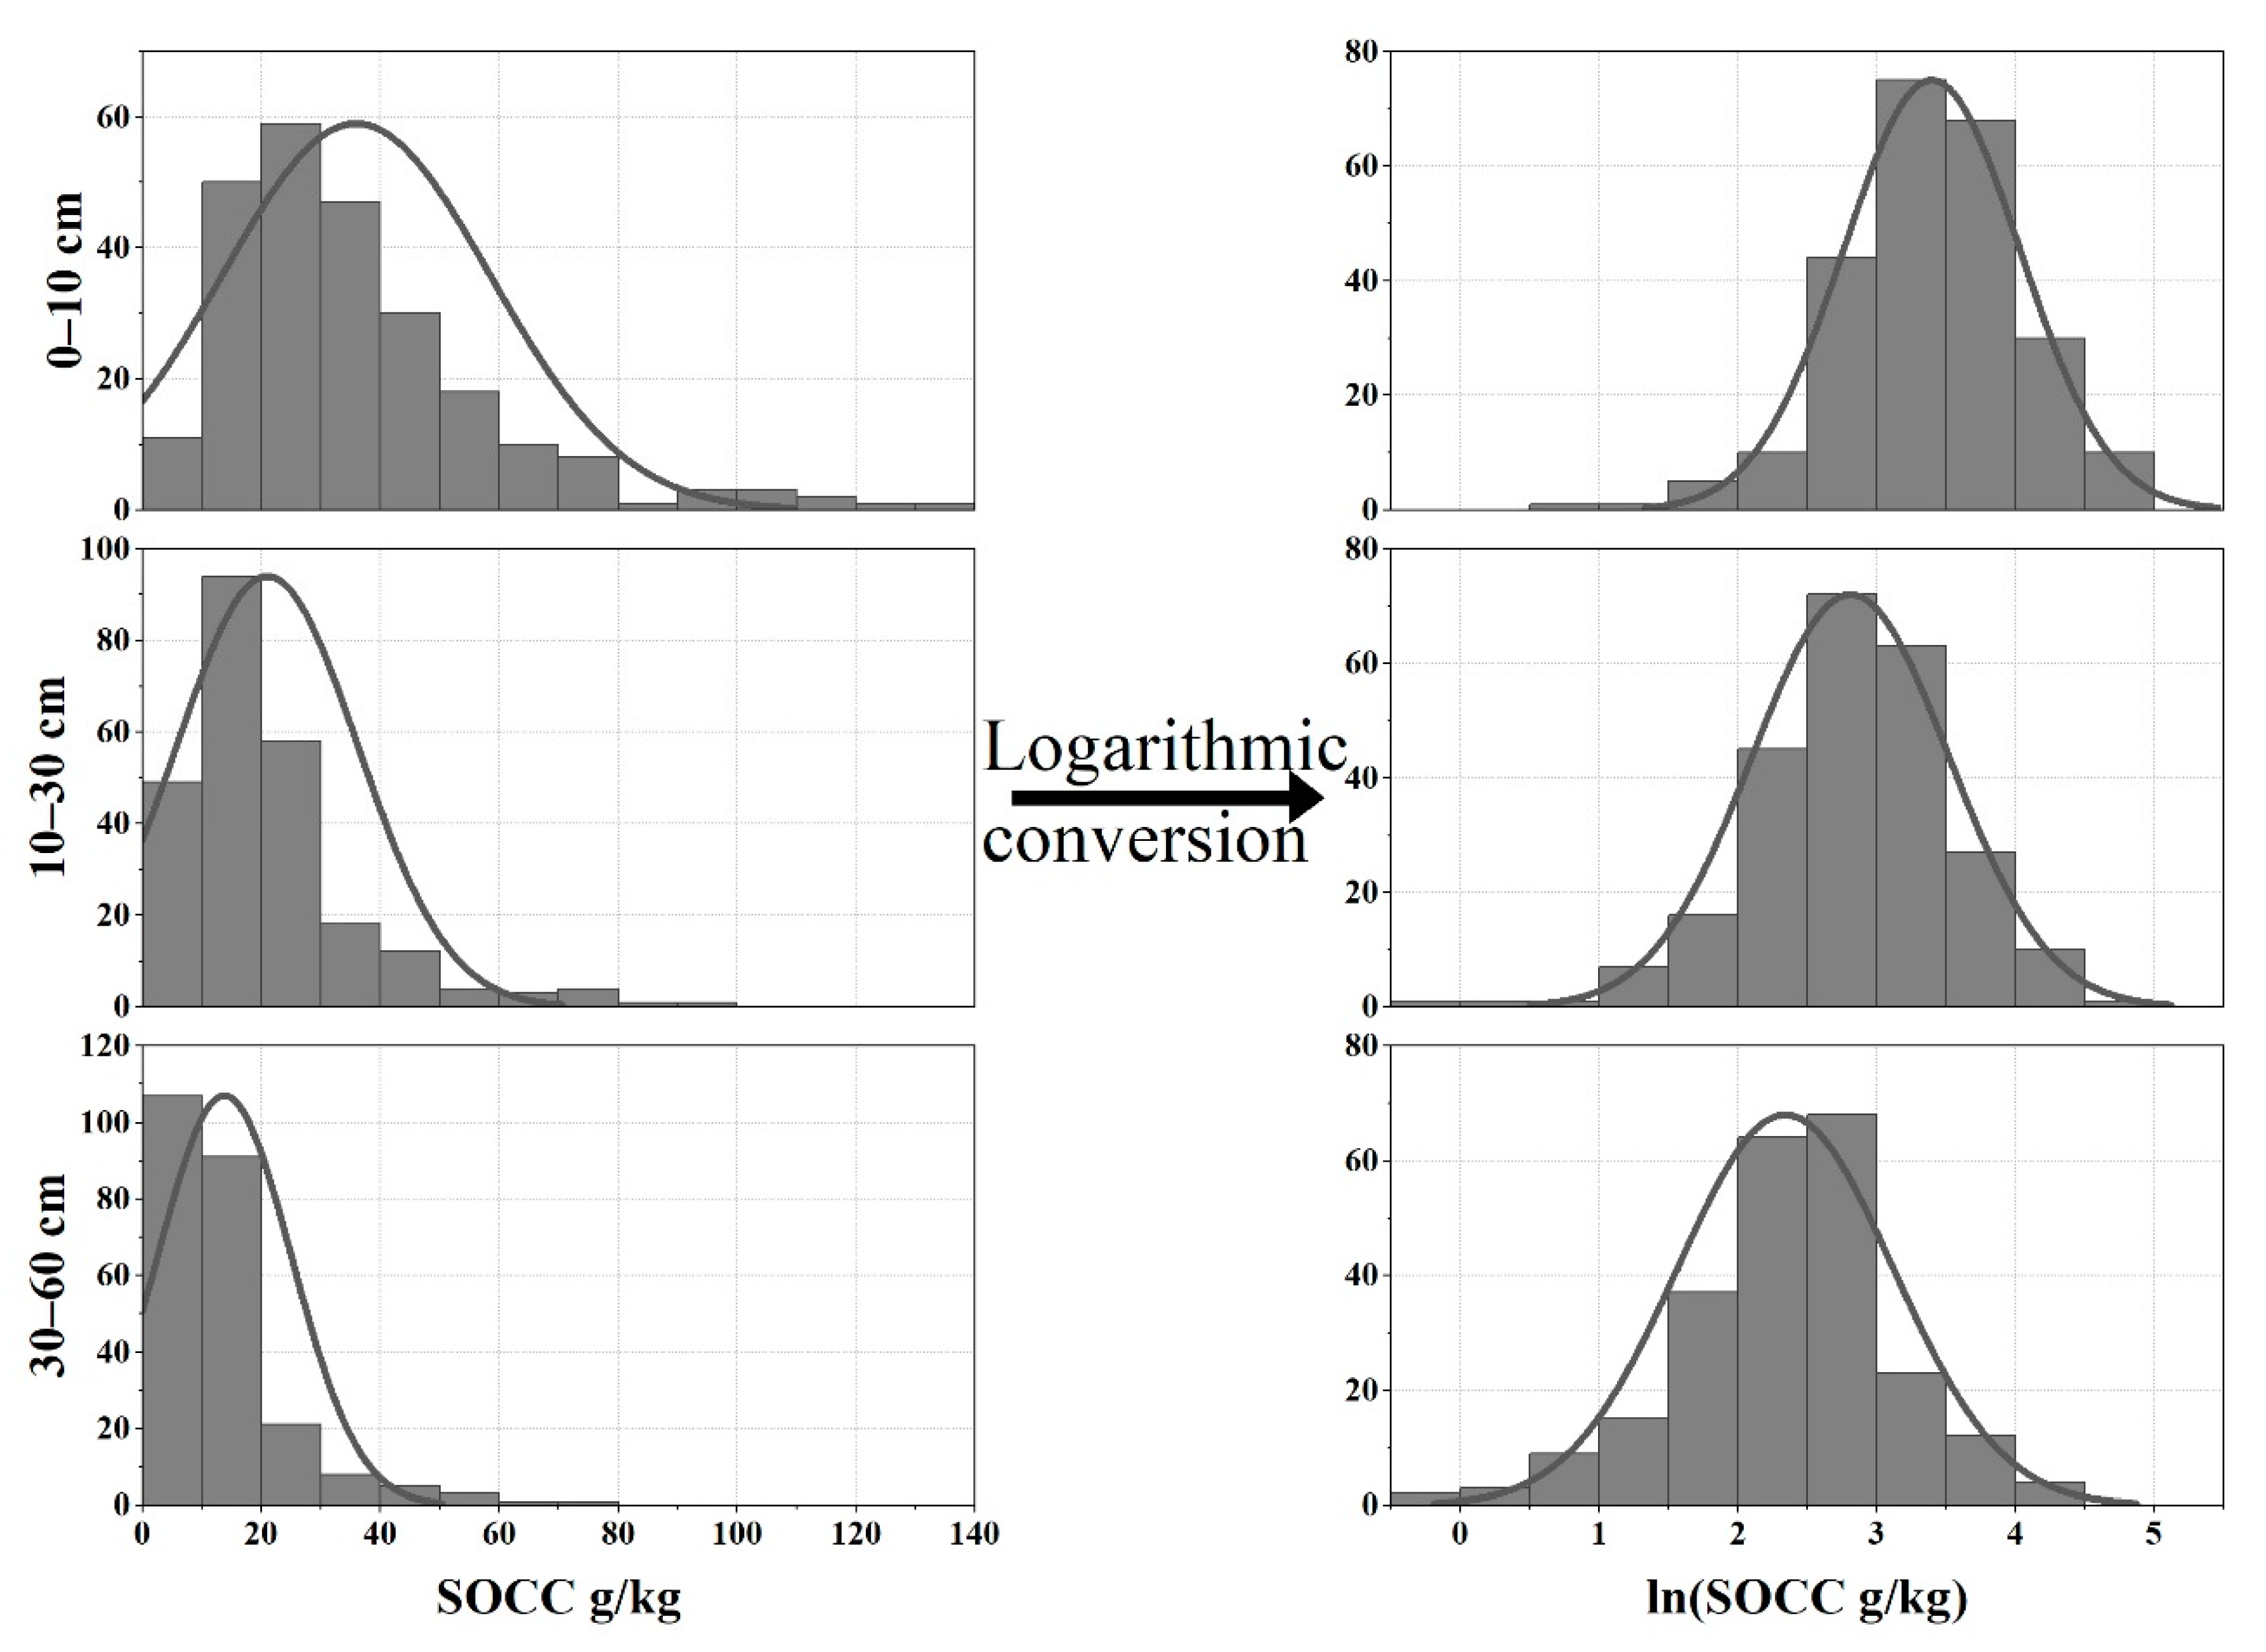
Figure 4.
Spatial distribution of SOCC of three soil layers (0–10 cm, 10–30 cm, 30–60 cm) in the Zhejiang Province.
Figure 4.
Spatial distribution of SOCC of three soil layers (0–10 cm, 10–30 cm, 30–60 cm) in the Zhejiang Province.
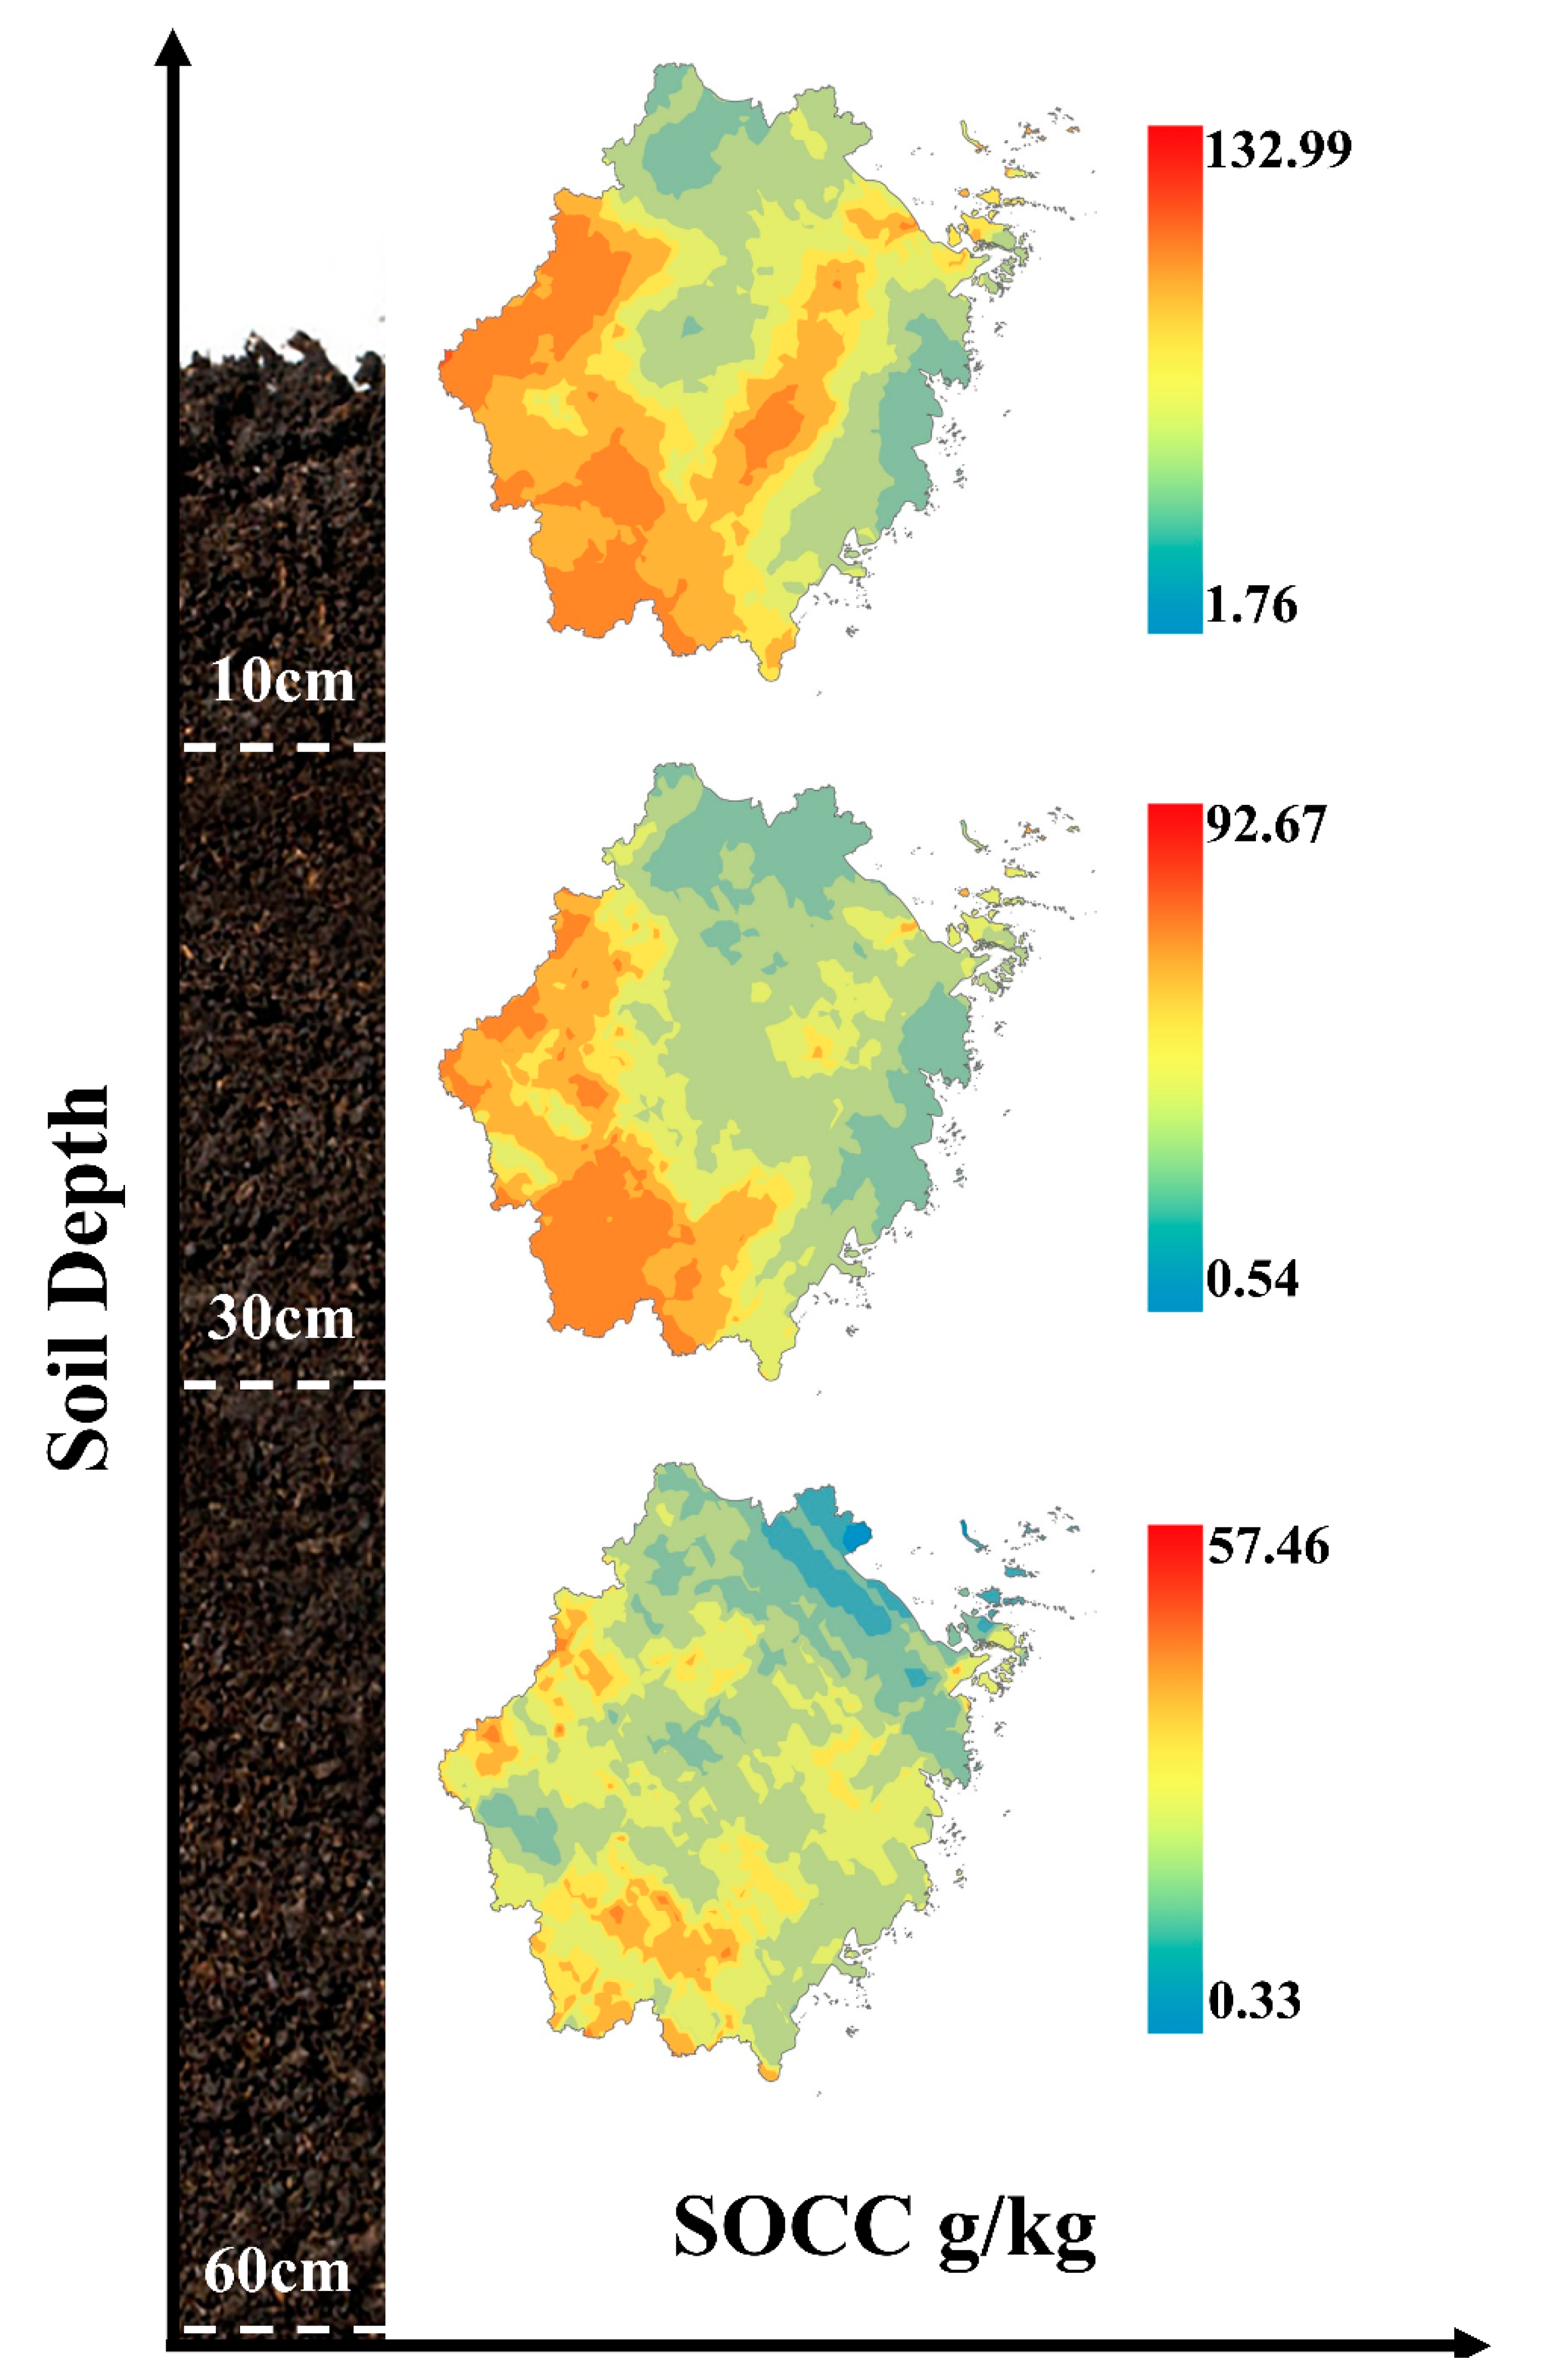
Figure 5.
Distributions of SOCC by elevation and forest type. BLF: broad-leaved forest; CF: coniferous forest; MCBF: mixed broad-leaved and coniferous forest; BF: bamboo forest; SL: shrubland; green indicates 0–10 cm; yellow indicates 10–30 cm; red indicates 30–60 cm. The same below. Lowercase letters show a significant difference between different elevations at the same soil depth (p < 0.05). Vertical bars refer to the standard deviation. Blank indicates no data.
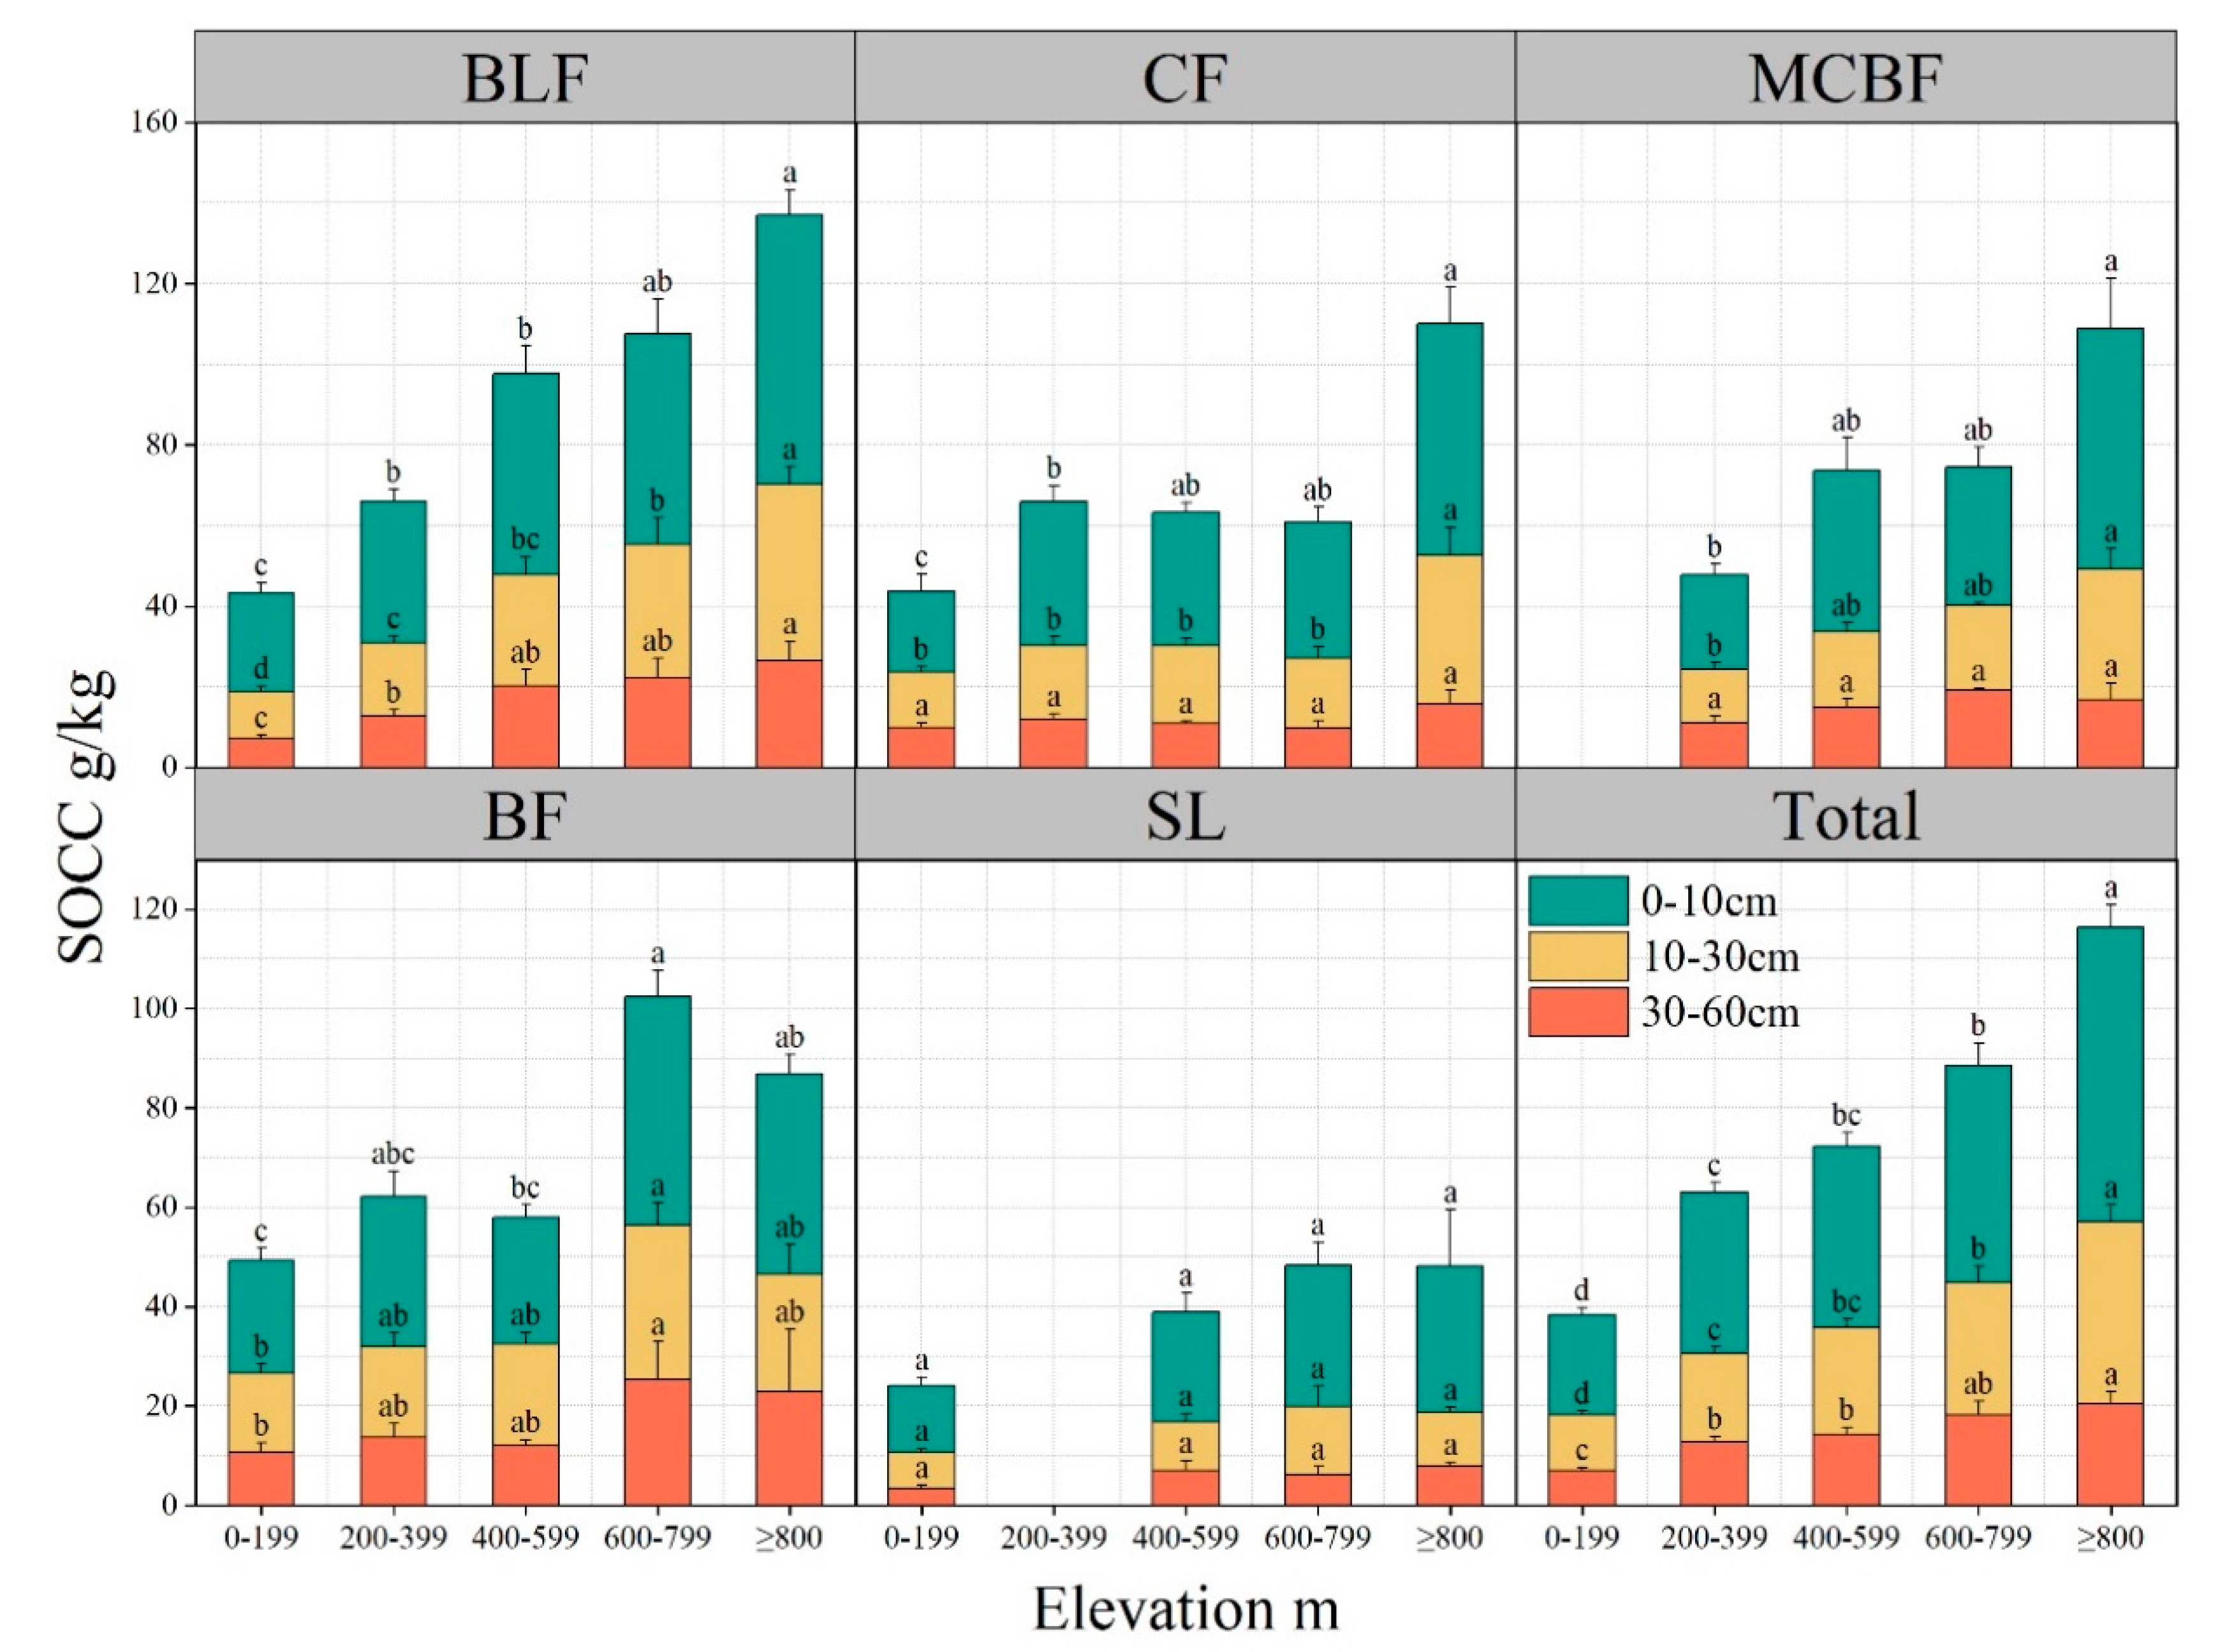
Figure 6.
Linear regression of SOCC and elevation. Radj2 is adjusted R-squared. Square indicates 0–10 cm; cycle indicates 10–30 cm; triangle indicates 30–60 cm. The same below.
Figure 6.
Linear regression of SOCC and elevation. Radj2 is adjusted R-squared. Square indicates 0–10 cm; cycle indicates 10–30 cm; triangle indicates 30–60 cm. The same below.

Figure 7.
Distributions of SOCC by slope gradient and forest type. Lowercase letters show a significant difference between different slope gradients at the same soil depth (p < 0.05). Vertical bars refer to the standard deviation. Blank indicates no data.
Figure 7.
Distributions of SOCC by slope gradient and forest type. Lowercase letters show a significant difference between different slope gradients at the same soil depth (p < 0.05). Vertical bars refer to the standard deviation. Blank indicates no data.
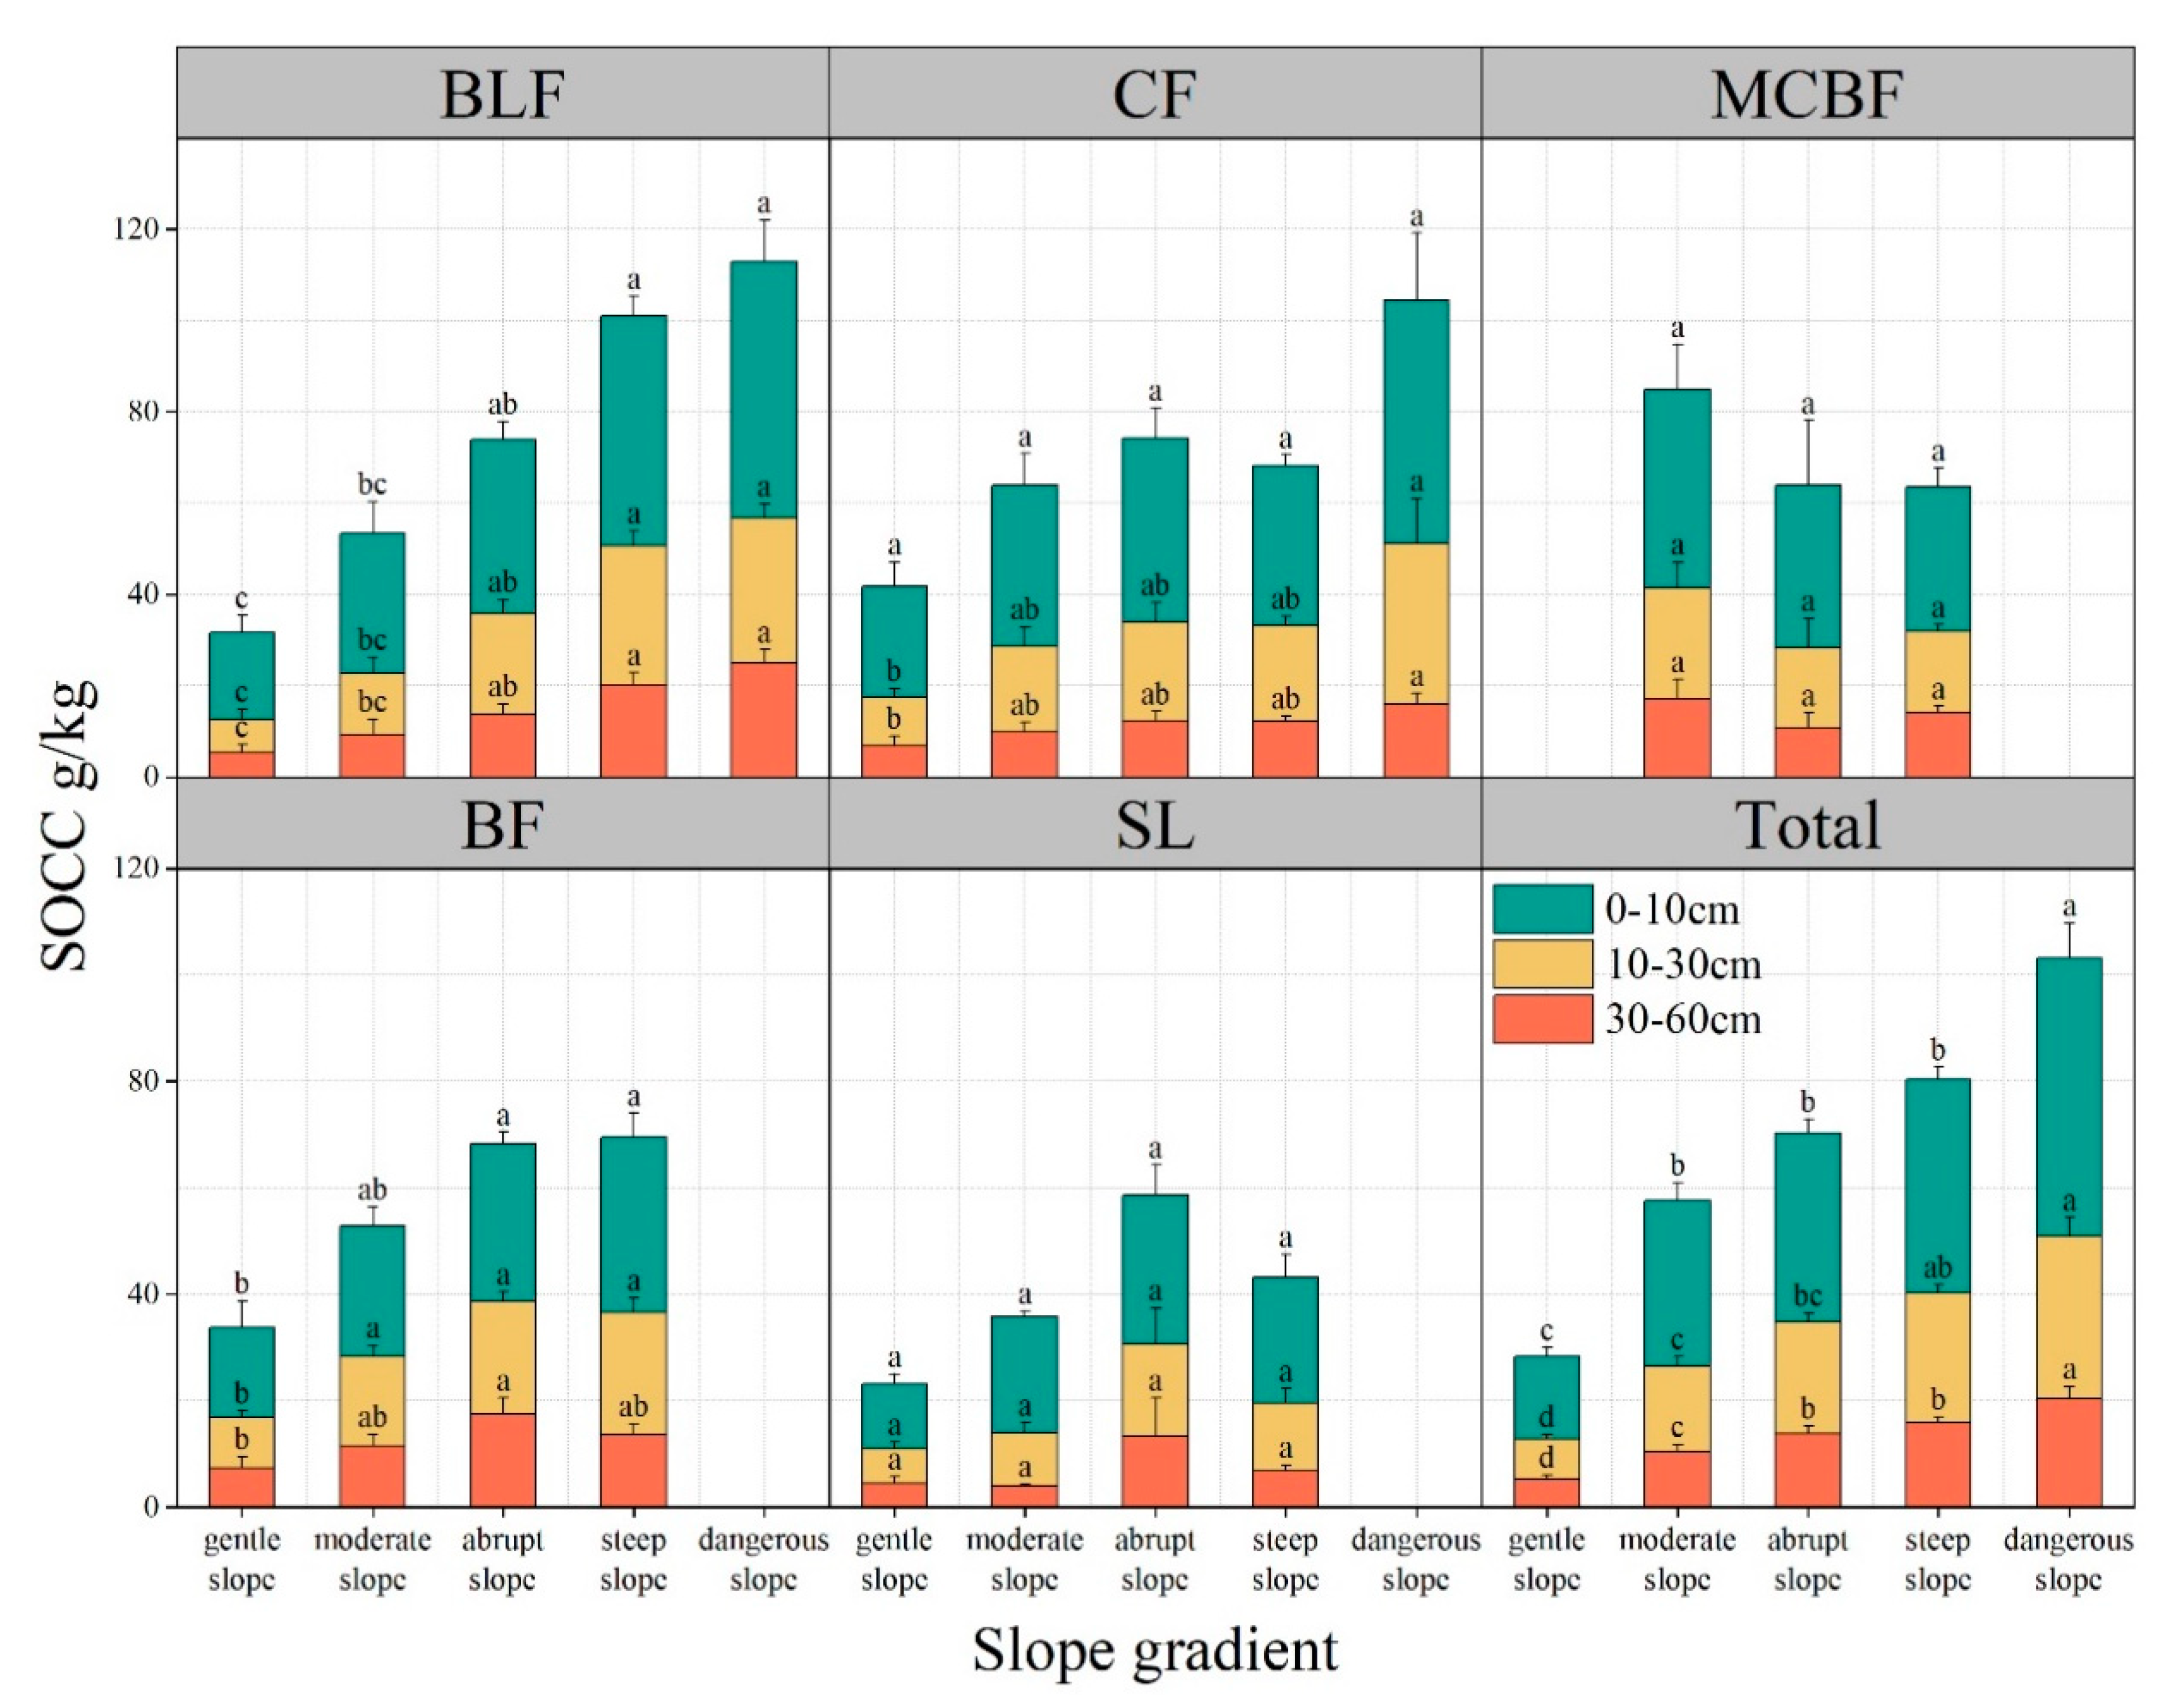
Figure 8.
Linear regression of SOCC and slope.
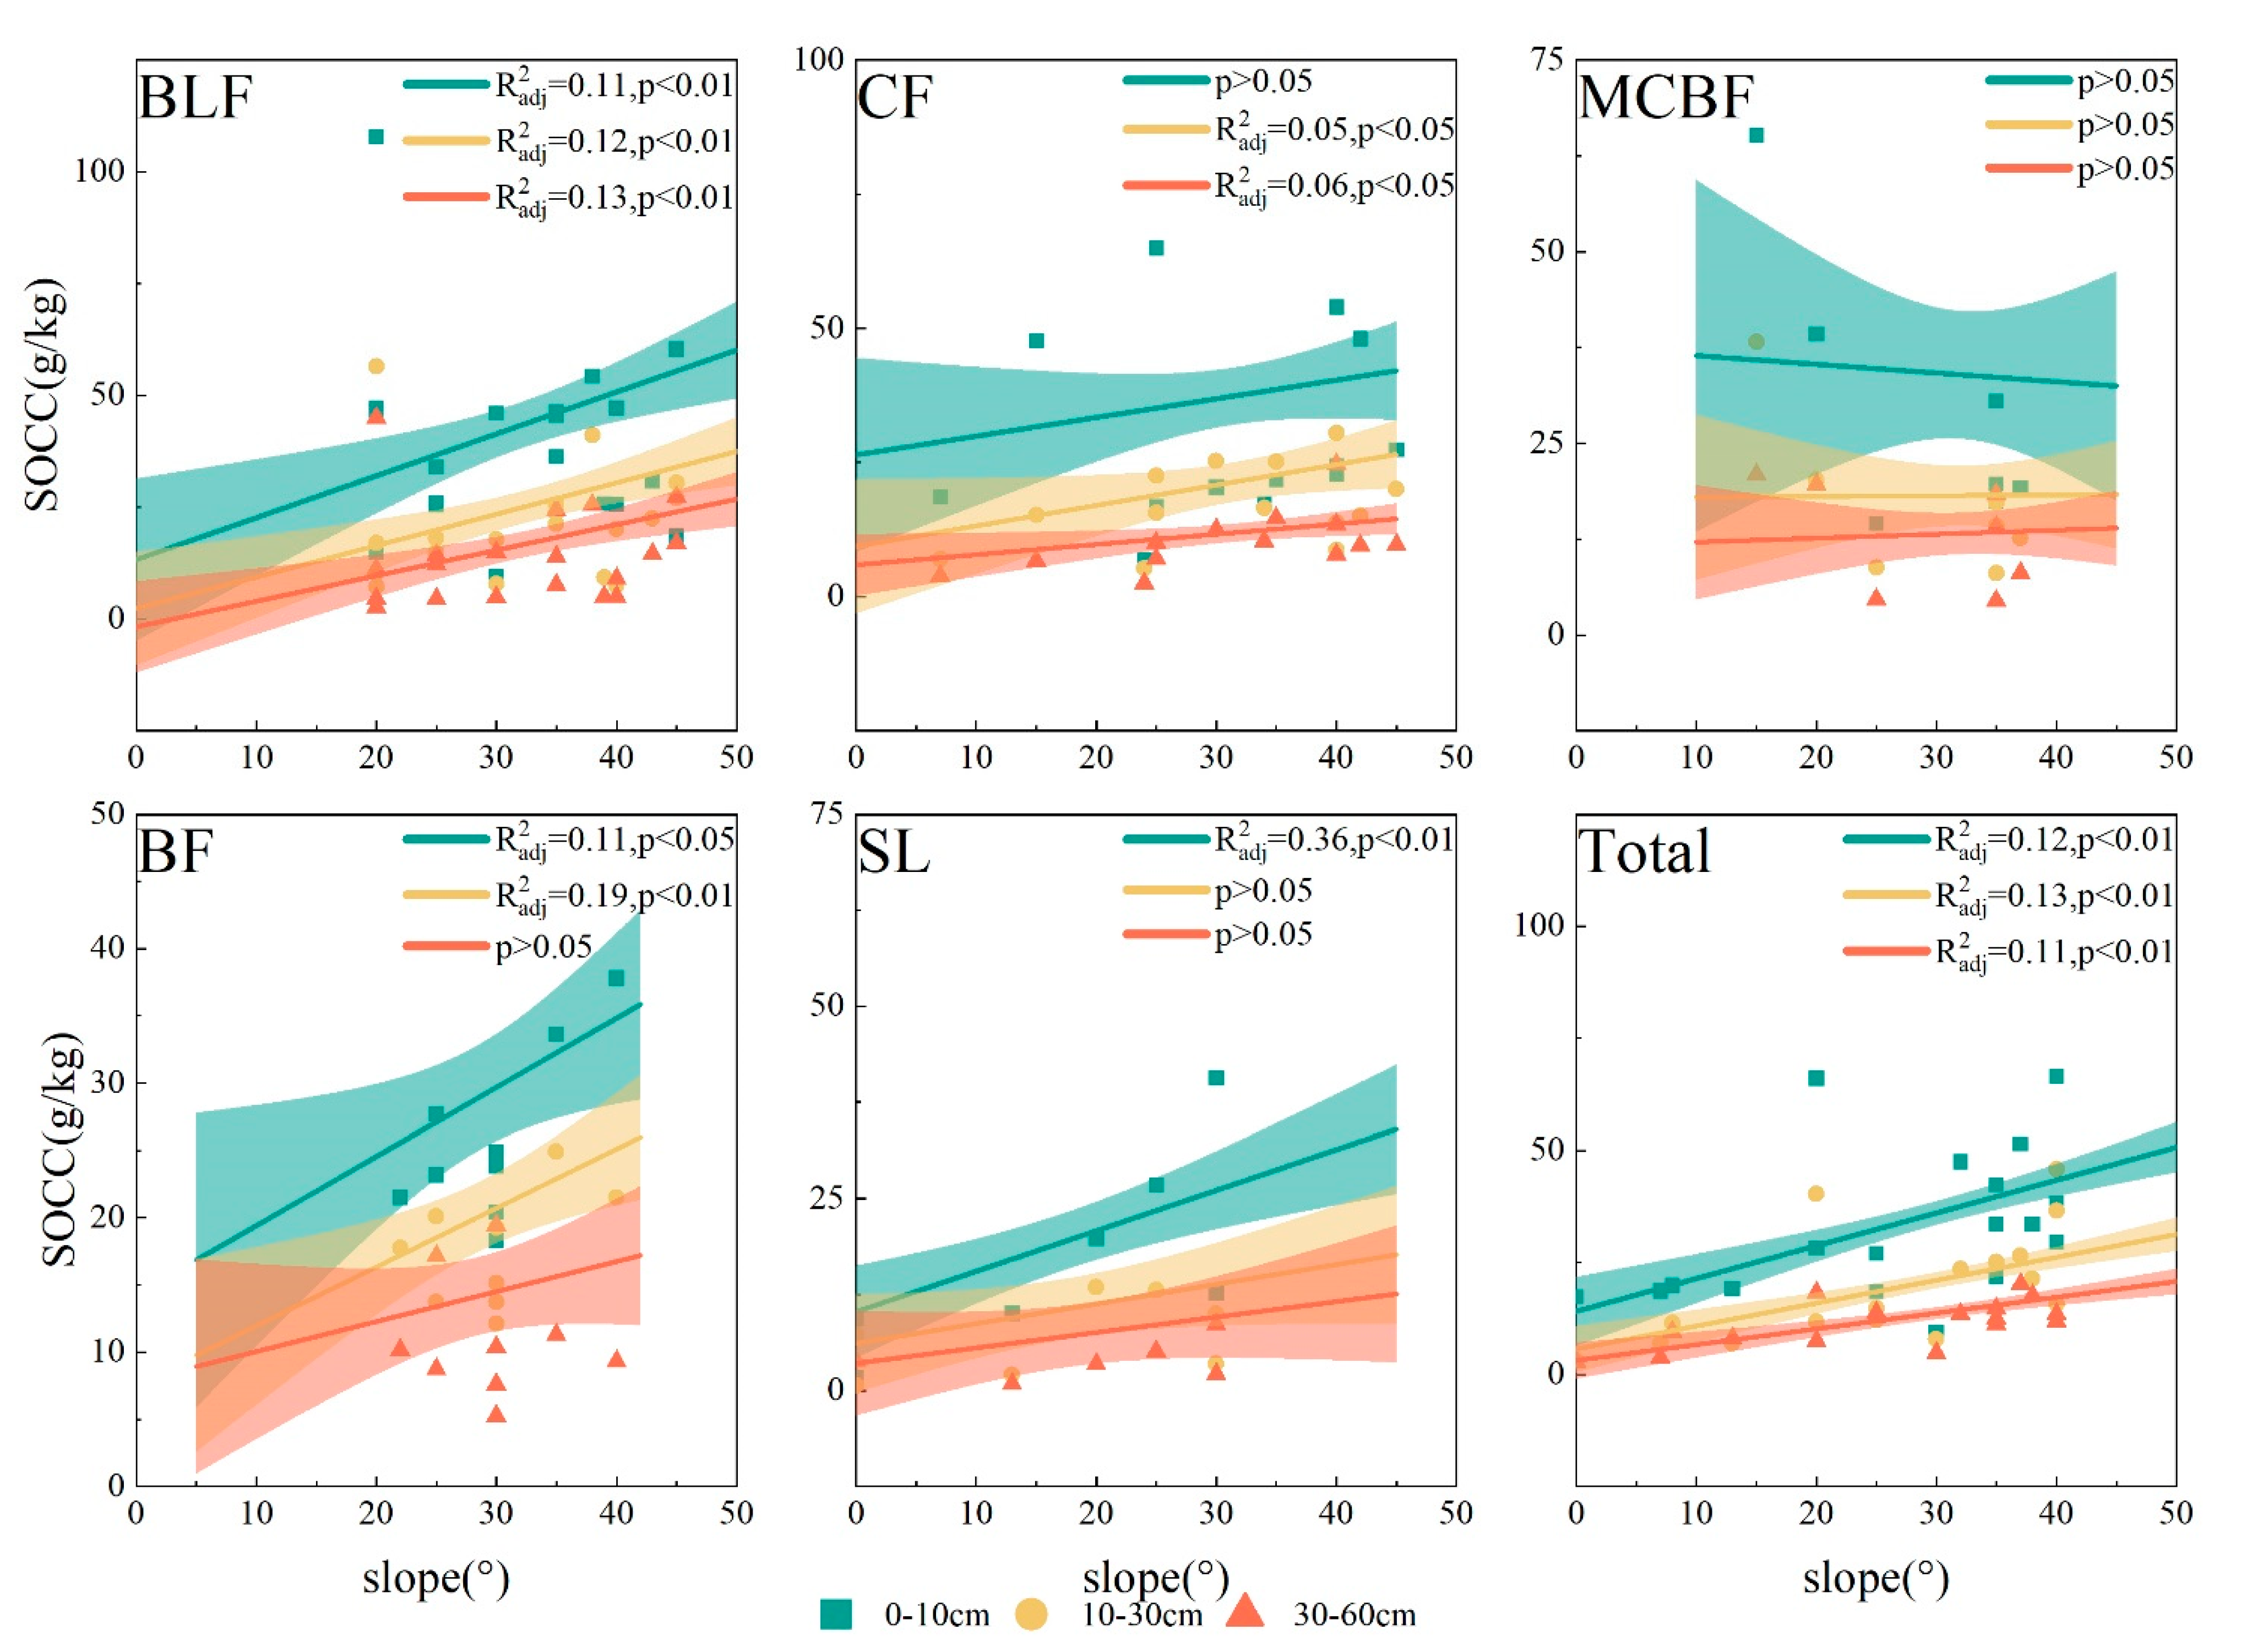
Figure 9.
Distributions of SOCC by slope position and forest type. Lowercase letters show a significant difference between different slope positions at the same soil depth (p < 0.05). Vertical bars refer to the standard deviation.
Figure 9.
Distributions of SOCC by slope position and forest type. Lowercase letters show a significant difference between different slope positions at the same soil depth (p < 0.05). Vertical bars refer to the standard deviation.
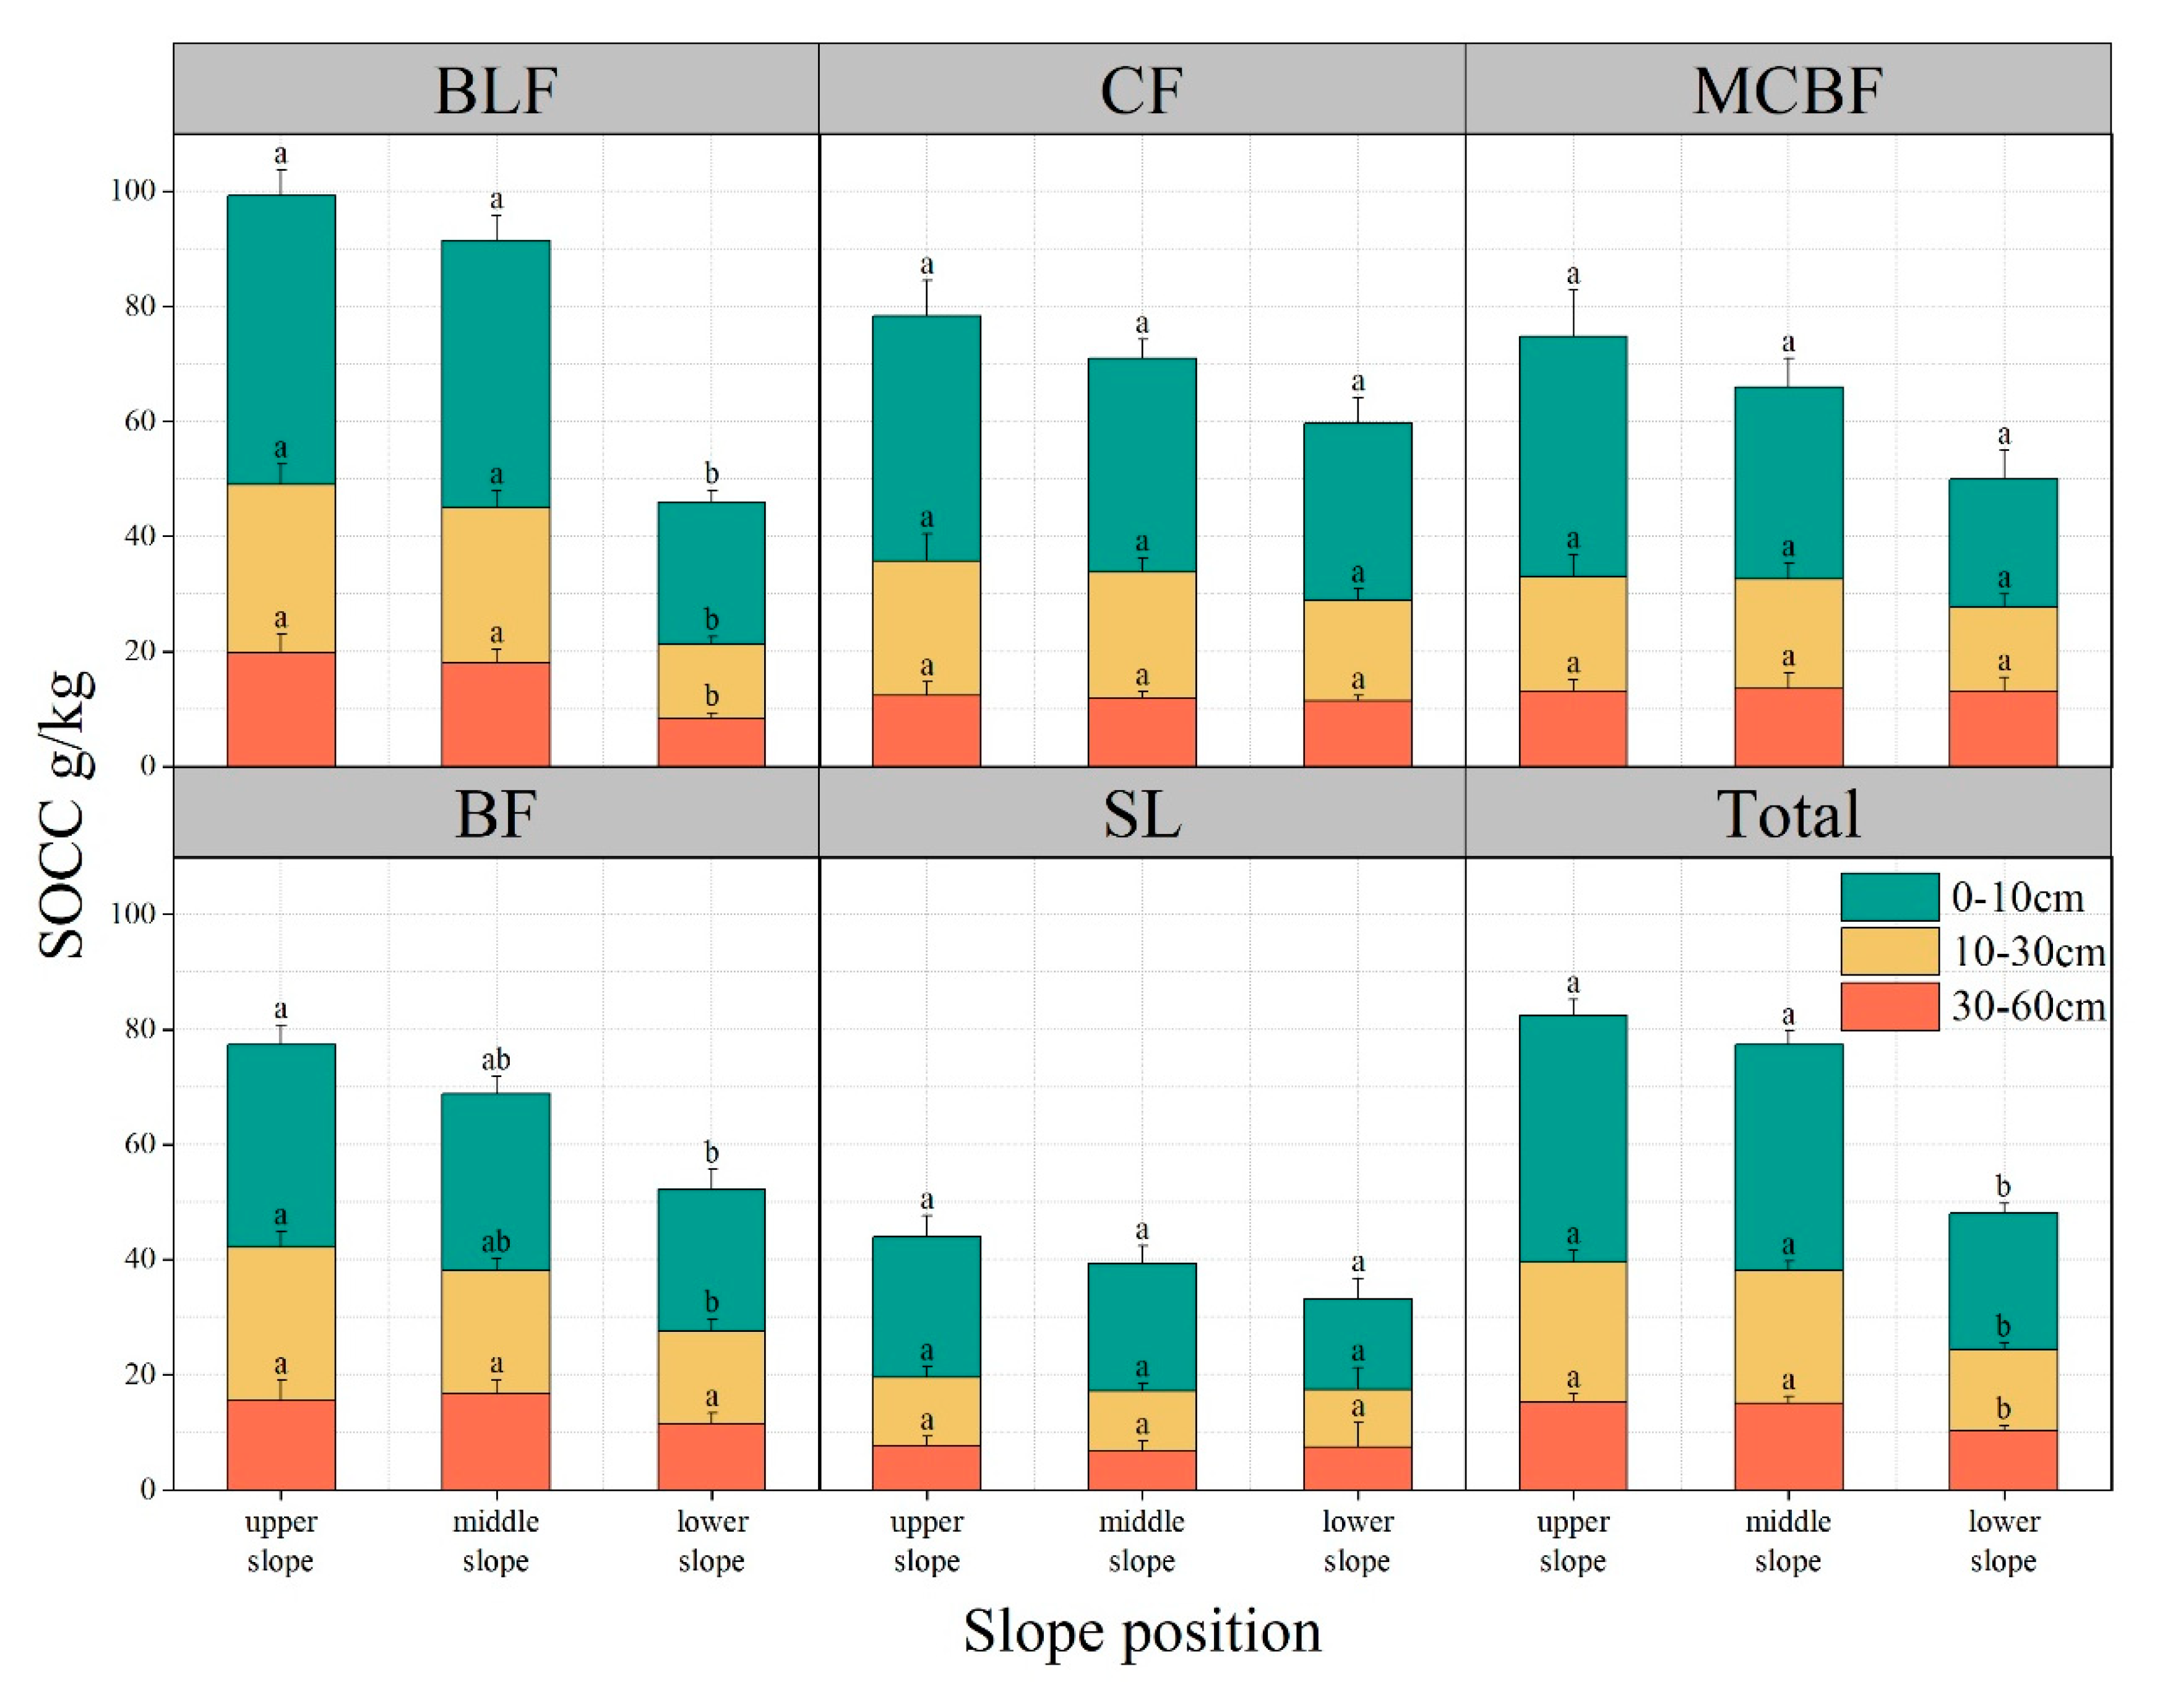
Figure 10.
Linear regression of SOCC and slope position.

Figure 11.
Distributions of SOCC by slope direction and forest type. Lowercase letters show a significant difference between different slope directions at the same soil depth (p < 0.05). Vertical bars refer to the standard deviation. Blank indicates no data.
Figure 11.
Distributions of SOCC by slope direction and forest type. Lowercase letters show a significant difference between different slope directions at the same soil depth (p < 0.05). Vertical bars refer to the standard deviation. Blank indicates no data.
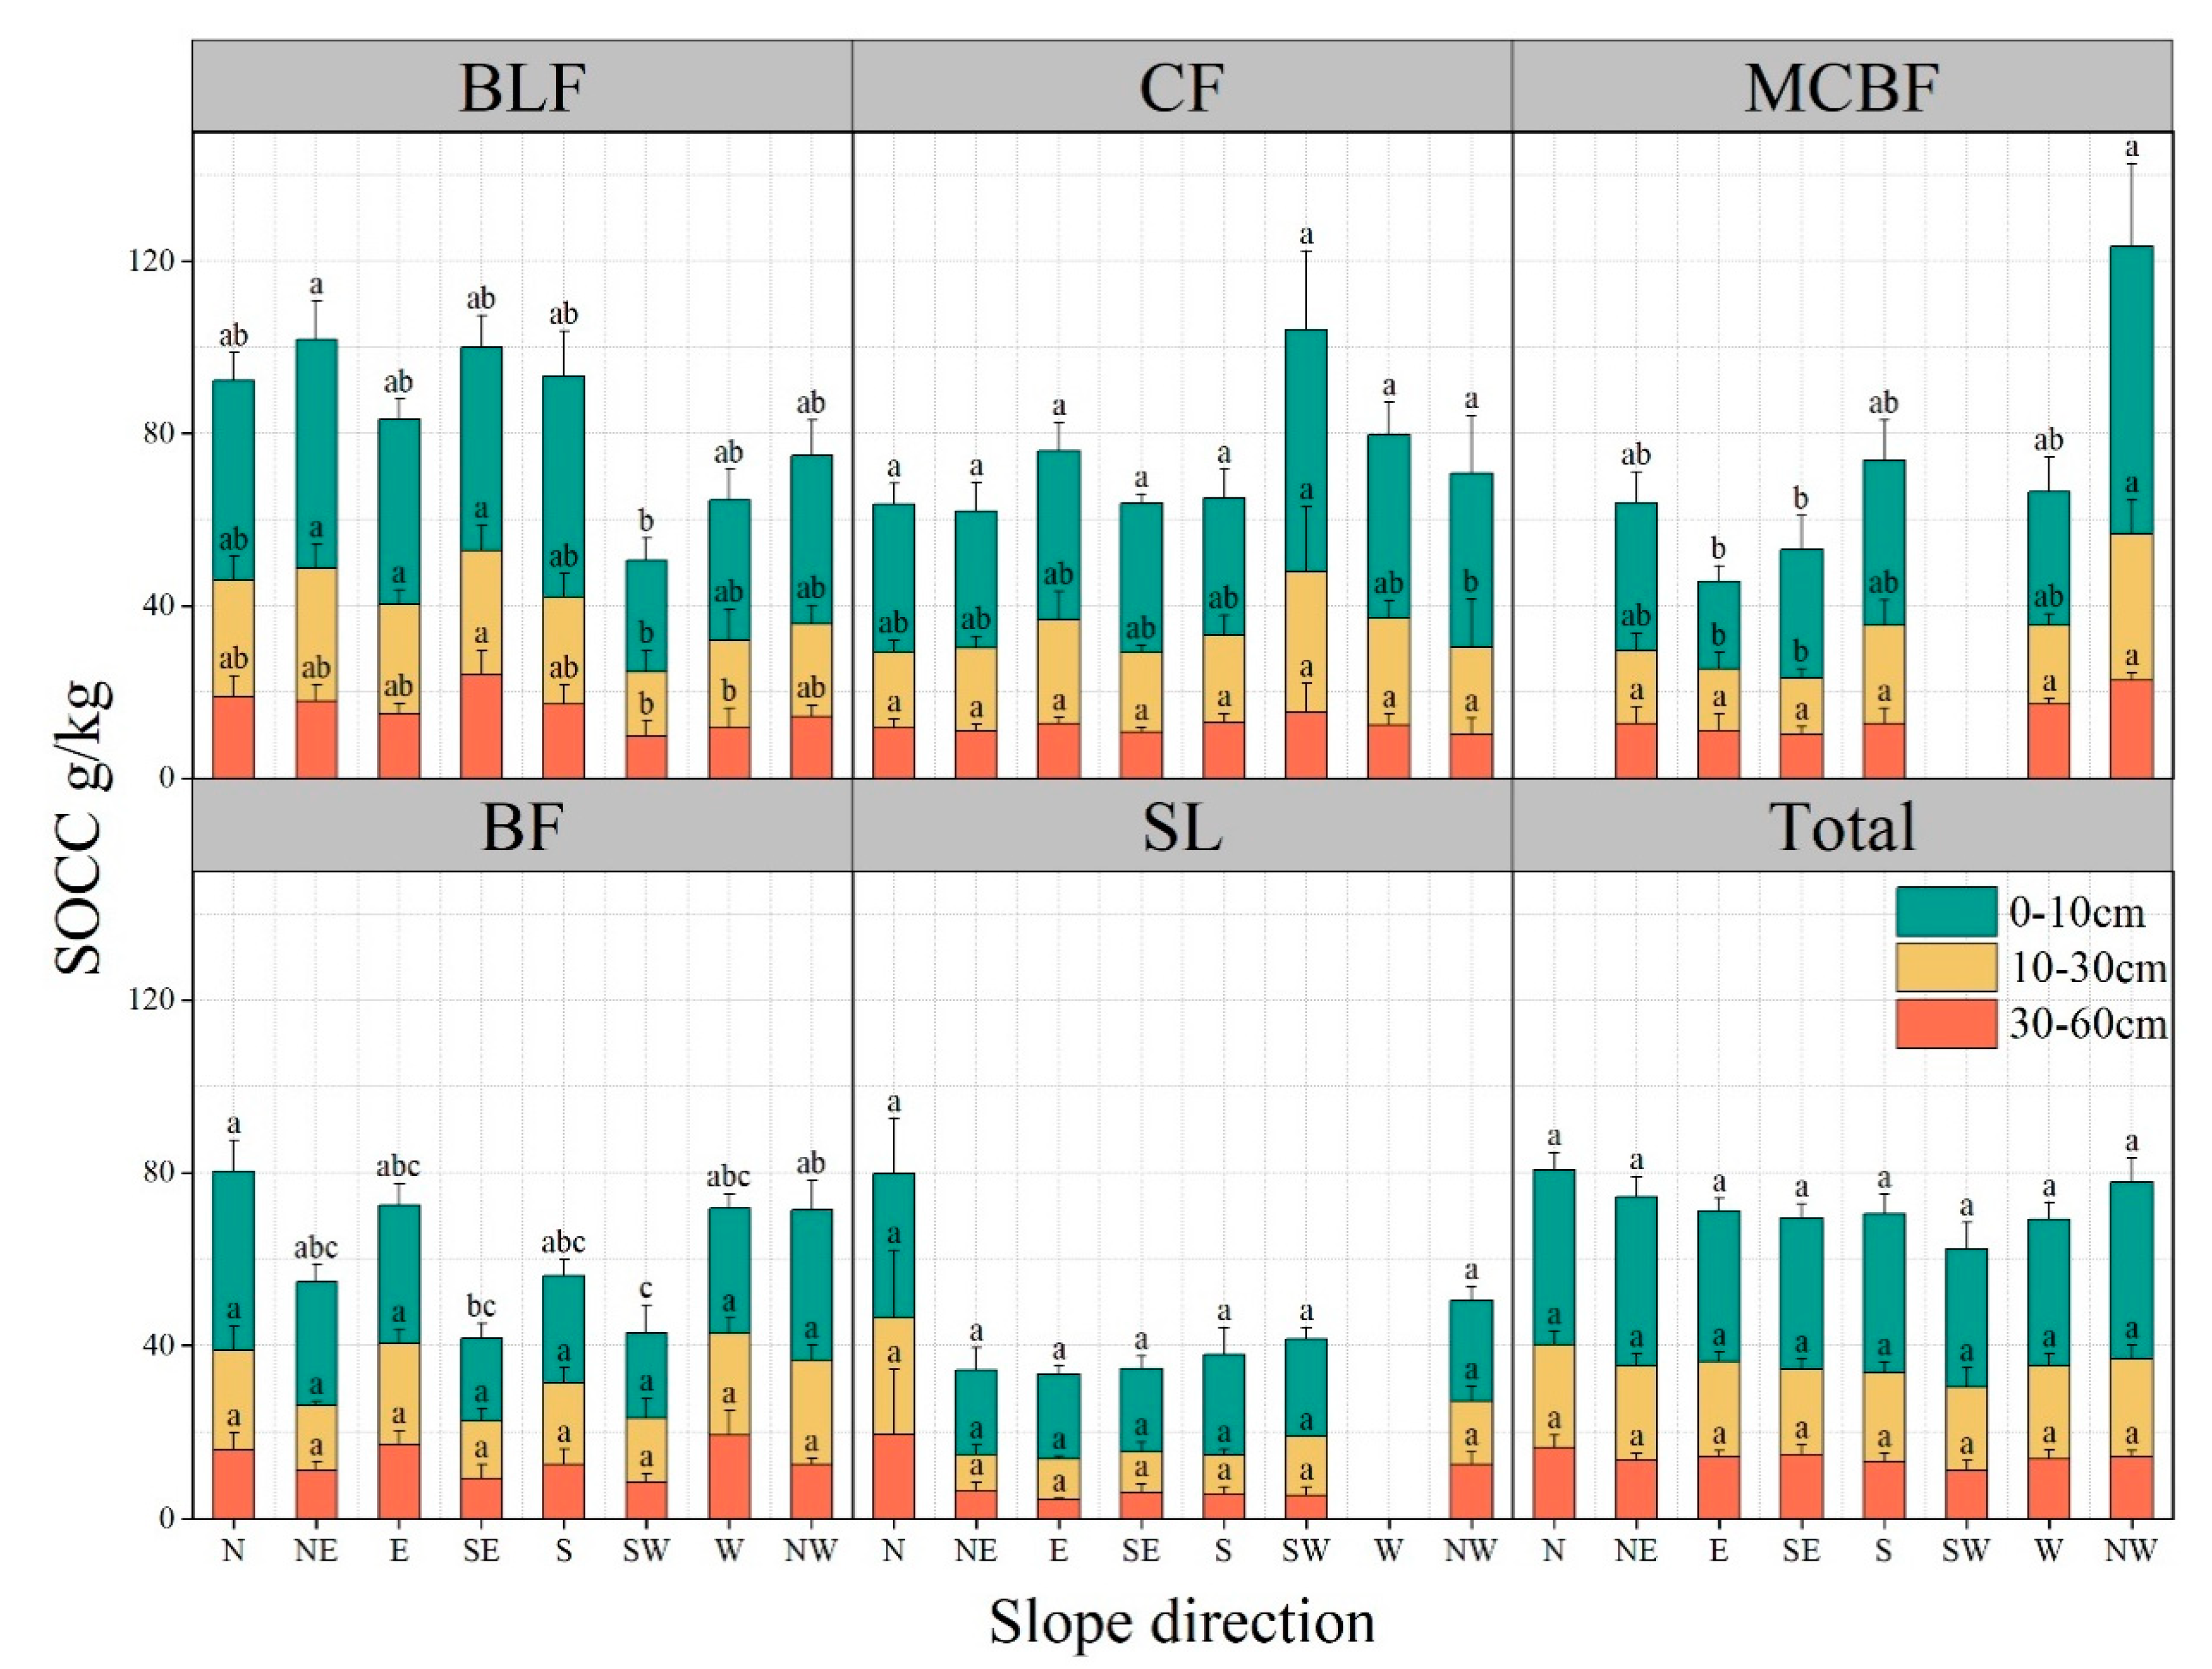
Figure 12.
Distributions of SOC by soil depth and forest type.
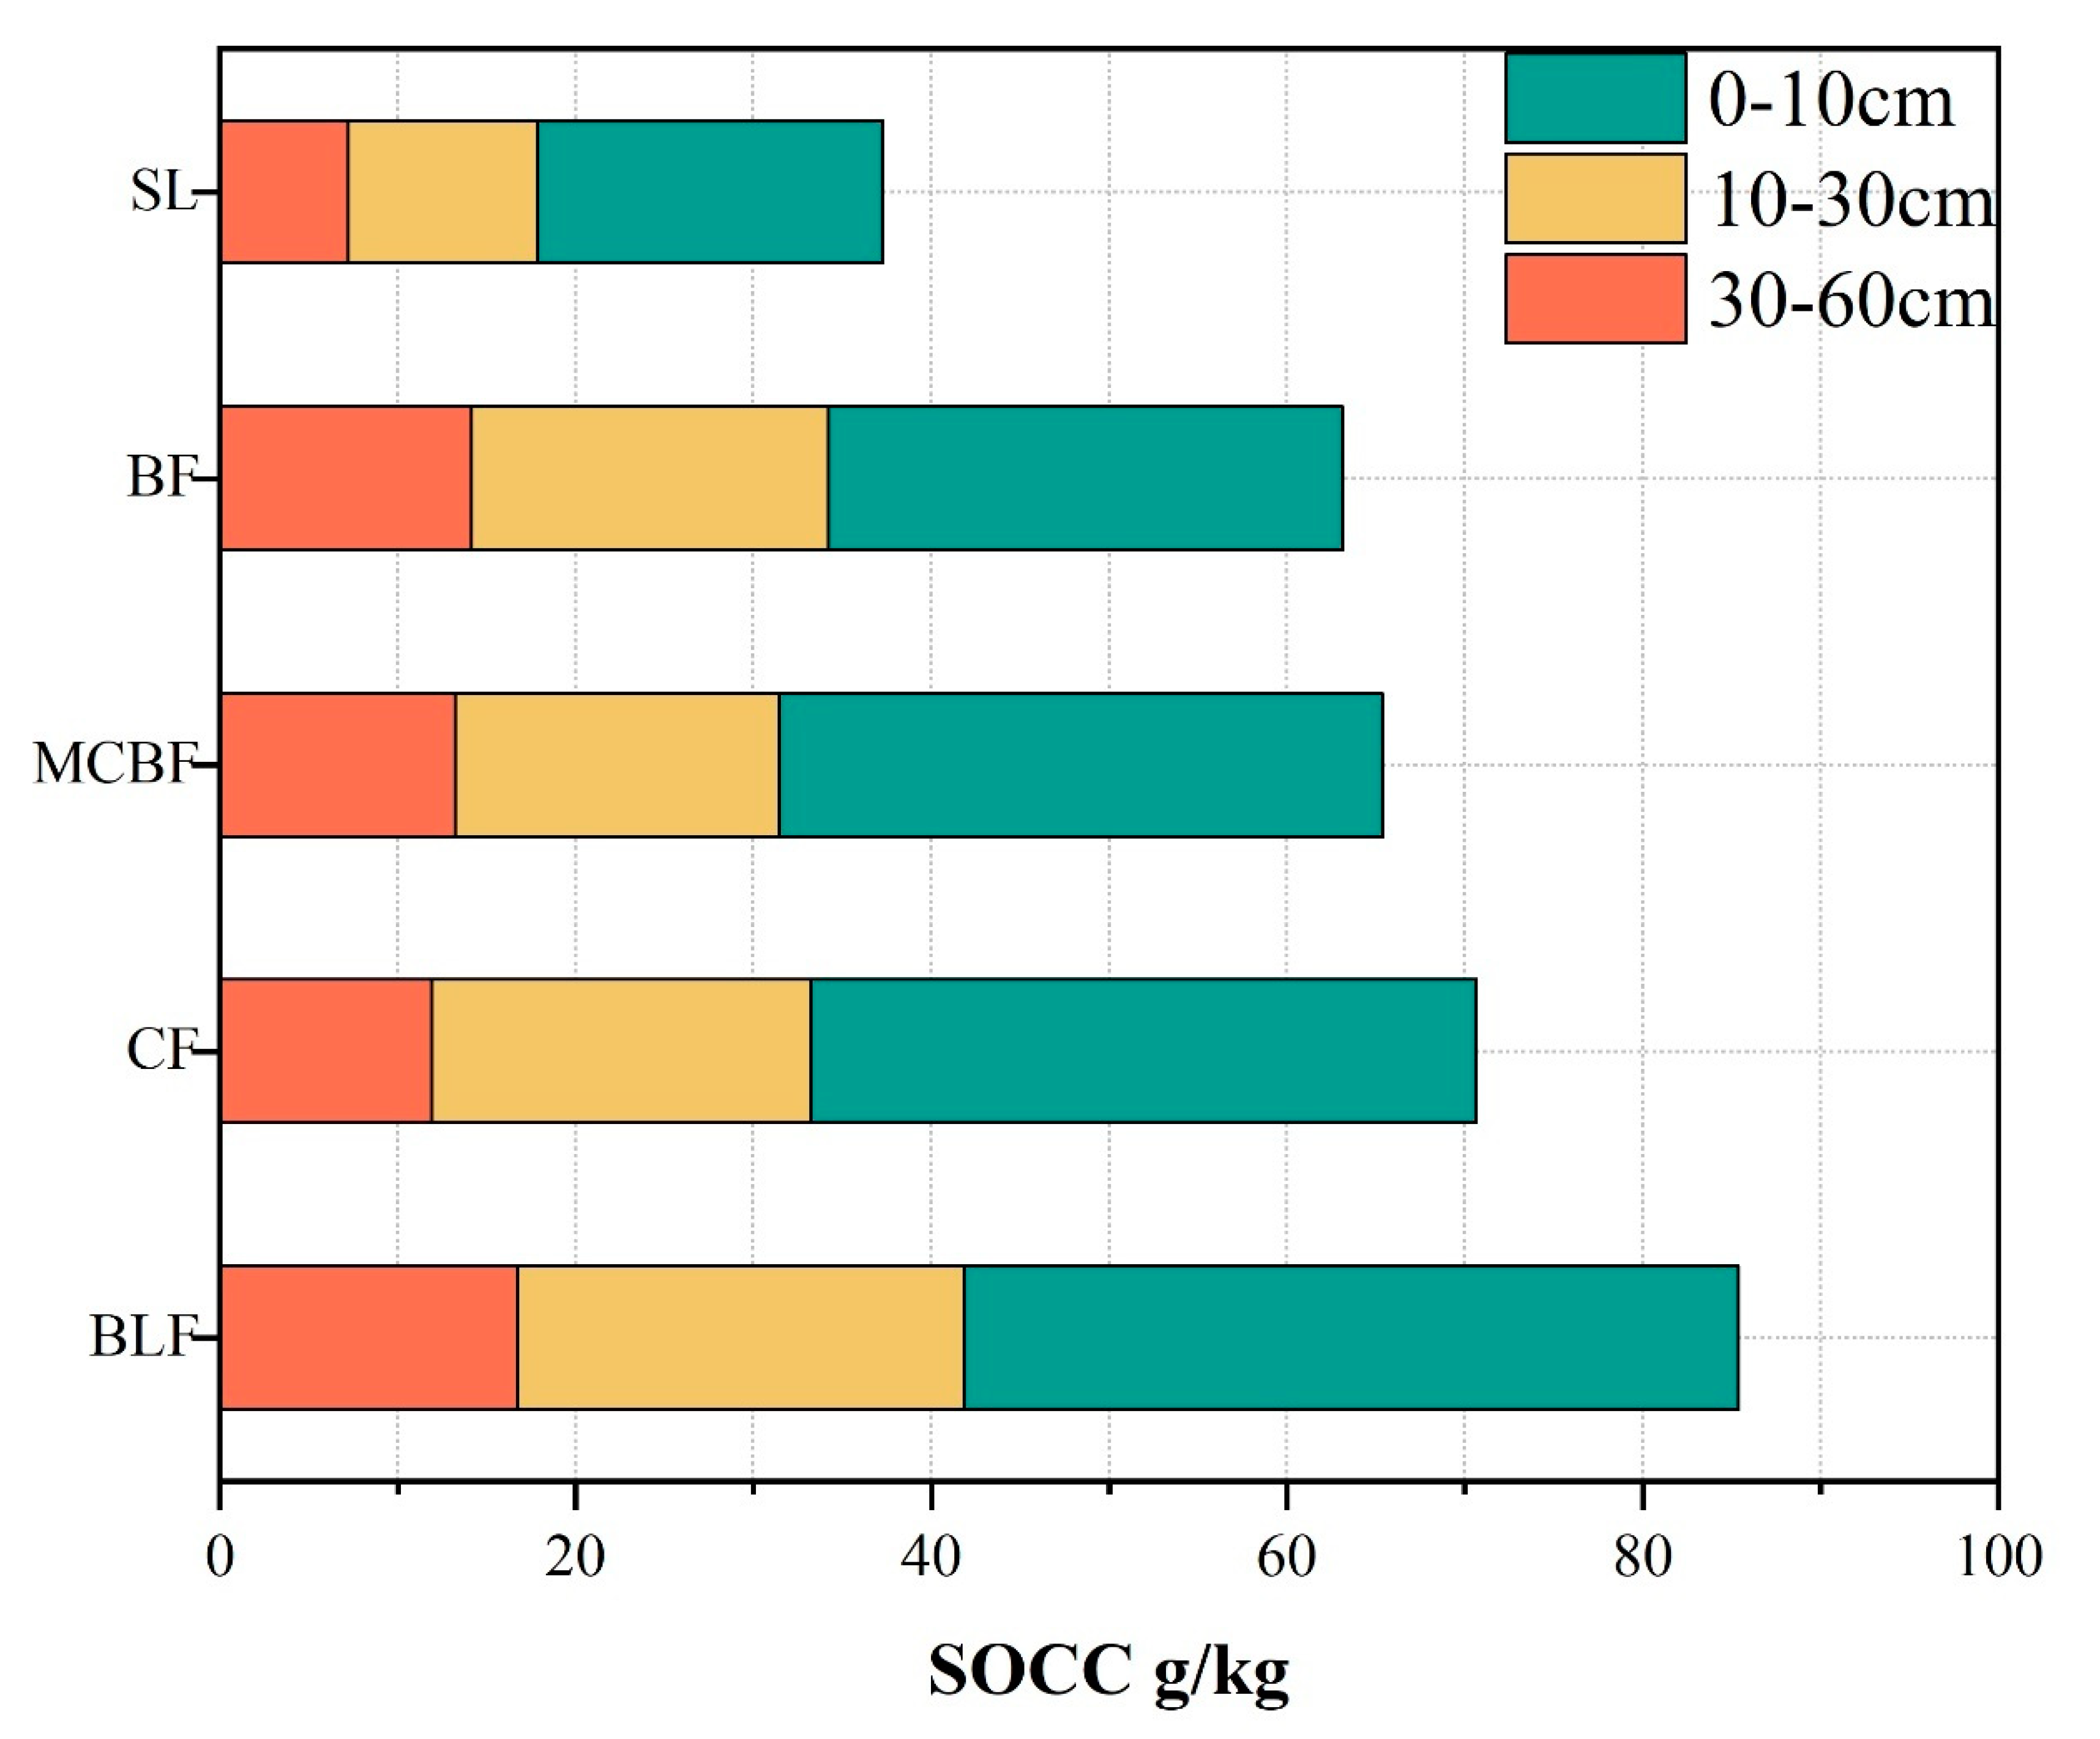
Figure 13.
Linear fit of topography factor to MAT (mean annual temperature) and MAP (mean annual precipitation). (a) Elevation; (b) Slope; (c) Slope position; (d) Slope direction.
Figure 13.
Linear fit of topography factor to MAT (mean annual temperature) and MAP (mean annual precipitation). (a) Elevation; (b) Slope; (c) Slope position; (d) Slope direction.


Table 1.
Elevation, dominant species, soil type and soil moisture of different forest types.
| Forest Type | Elevation (m) | Dominant Species | Soil Type | Soil Moisture (%) |
|---|---|---|---|---|
| BLF | 8–1270 | alder (Alnus cremastogyne Burkill), hackberry (Celtis sinesis Pers.), schima (Schima superba Gardner & Champ.), etc. | red soil, yellow soil, limestone and paddy soil | 7.65–44.10 |
| CF | 2–1550 | masson pine (Pinus massoniana Lamb.), china fir (Cunninghamia lanceolata (Lamb.) Hook.), cypress (Cupressus funebris Endl.), etc. | red soil, yellow soil, and limestone | 12.10–34.96 |
| MCBF | 170–1180 | pine–broadleaf mixed, cypress–broadleaf mixed | red soil and yellow soil | 6.08–36.05 |
| BF | 70–830 | moso bamboo (Phyllostachys edulis (Carrière) J. Houz.), etc. | red soil and yellow soil | 10.93–33.70 |
| SL | 2–980 | pear (Pyrus spp), hickory (Carya cathayensis Sarg.), tea-leaf (Camellia sinensis (L.) Kuntze), etc. | red soil, yellow soil and paddy soil | 15.08–29.68 |
Note: BLF = broad-leaved forest; CF = coniferous forest; MCBF = mixed coniferous and broad-leaved forest; BF = bamboo forest; SL = shrubland.
Table 2.
Descriptive statistics of soil organic carbon content and soil alkali-hydrolyzed nitrogen content in the subtropical forest ecosystem of the Zhejiang Province.
Table 2.
Descriptive statistics of soil organic carbon content and soil alkali-hydrolyzed nitrogen content in the subtropical forest ecosystem of the Zhejiang Province.
| Depth (cm) | Count | Mean | Median | Maximum | Minimum | SD | CV (%) | K-Sp (p > 0.05) | |
|---|---|---|---|---|---|---|---|---|---|
| SOCC | 0–10 | 244 | 35.95 | 30.40 | 132.99 | 1.76 | 22.58 | 62.81 | 0.200 |
| 10–30 | 244 | 20.98 | 17.44 | 92.67 | 0.67 | 15.26 | 72.74 | 0.099 | |
| 30–60 | 237 | 13.77 | 10.59 | 70.11 | 0.89 | 11.28 | 81.92 | 0.056 | |
| SANC | 0–10 | 244 | 145.42 | 118.86 | 606.23 | 17.39 | 91.32 | 62.79 | 0.201 |
| 10–30 | 244 | 101.61 | 82.17 | 554.20 | 13.94 | 75.16 | 73.97 | 0.086 | |
| 30–60 | 244 | 74.91 | 62.80 | 328.71 | 10.46 | 49.12 | 65.57 | 0.063 |
Note: SOCC = soil organic carbon content; SANC = soil alkali-hydrolyzed nitrogen content; the unit of SOC content is g/kg; the unit of SAN content is mg/kg; SD = standard deviation; CV = coefficient variance; K-Sp = p of the Kolmogorov–Smirnov test. All data were log-transformed and subjected to the Kolmogorov–Smirnov test.
Table 3.
Semi-variance function model and parameters of soil organic carbon content.
| Depth (cm) | Model | Nugget Coefficient C0/C0 + C | Range (km) | Radj2 | Residual SS | |
|---|---|---|---|---|---|---|
| SOCC | 0–10 | Exponential | 0.809 | 157.74 | 0.506 | 0.00509 |
| 10–30 | Gaussian | 0.846 | 286.15 | 0.560 | 0.00526 | |
| 30–60 | Gaussian | 0.977 | 11.313 | 0.572 | 0.01810 |
Note: Nugget coefficient is ratio of nugget to sill. Radj2 is adjusted R-squared. Residual SS is Residual Sum of Squares.
Table 4.
Results of analysis of variance of SOCC with different topographic factors.
| Topographic Factor | Depth (cm) | p | |
|---|---|---|---|
| SOCC | Elevation | 0–10 | <0.001 |
| 10–30 | <0.001 | ||
| 30–60 | <0.001 | ||
| Slope gradient | 0–10 | <0.001 | |
| 10–30 | <0.001 | ||
| 30–60 | <0.001 | ||
| Slope position | 0–10 | <0.001 | |
| 10–30 | <0.001 | ||
| 30–60 | <0.01 | ||
| Slope direction | 0–10 | >0.05 | |
| 10–30 | >0.05 | ||
| 30–60 | >0.05 |
Table 5.
Results of regression analysis of SOCC and its influencing factors.
| Depth (cm) | Topographic Factor | r | Radj2 | p |
|---|---|---|---|---|
| 0–10 | EL | 0.550 | 0.300 | <0.001 |
| SG | 0.462 | 0.210 | <0.001 | |
| SP | 0.372 | 0.134 | <0.001 | |
| SD | 0.070 | 0.001 | 0.282 | |
| FT | 0.372 | 0.135 | <0.001 | |
| EL/FT | 0.582 | 0.333 | <0.001 | |
| EL/FT/SG | 0.611 | 0.366 | <0.001 | |
| 10–30 | EL | 0.534 | 0.282 | <0.001 |
| SG | 0.502 | 0.248 | <0.001 | |
| SP | 0.276 | 0.072 | <0.001 | |
| SD | 0.069 | 0.001 | 0.289 | |
| FT | 0.288 | 0.079 | <0.001 | |
| EL/SG | 0.590 | 0.343 | <0.001 | |
| 30–60 | EL | 0.425 | 0.177 | <0.001 |
| SG | 0.468 | 0.216 | <0.001 | |
| SP | 0.172 | 0.026 | 0.008 | |
| SD | 0.058 | 0.001 | 0.379 | |
| FT | 0.216 | 0.042 | 0.001 | |
| EL/SG | 0.521 | 0.265 | <0.001 |
Note: EL = elevation; SG = slope gradient; SP = slope position; SD = slope direction; FT = forest type.
Disclaimer/Publisher’s Note: The statements, opinions and data contained in all publications are solely those of the individual author(s) and contributor(s) and not of MDPI and/or the editor(s). MDPI and/or the editor(s) disclaim responsibility for any injury to people or property resulting from any ideas, methods, instructions or products referred to in the content. |
© 2023 by the authors. Licensee MDPI, Basel, Switzerland. This article is an open access article distributed under the terms and conditions of the Creative Commons Attribution (CC BY) license (https://creativecommons.org/licenses/by/4.0/).
Share and Cite
MDPI and ACS Style
Zhou, T.; Lv, Y.; Xie, B.; Xu, L.; Zhou, Y.; Mei, T.; Li, Y.; Yuan, N.; Shi, Y. Topography and Soil Organic Carbon in Subtropical Forests of China. Forests 2023, 14, 1023. https://doi.org/10.3390/f14051023
AMA Style
Zhou T, Lv Y, Xie B, Xu L, Zhou Y, Mei T, Li Y, Yuan N, Shi Y. Topography and Soil Organic Carbon in Subtropical Forests of China. Forests. 2023; 14(5):1023. https://doi.org/10.3390/f14051023
Chicago/Turabian StyleZhou, Tao, Yulong Lv, Binglou Xie, Lin Xu, Yufeng Zhou, Tingting Mei, Yongfu Li, Ning Yuan, and Yongjun Shi. 2023. "Topography and Soil Organic Carbon in Subtropical Forests of China" Forests 14, no. 5: 1023. https://doi.org/10.3390/f14051023
Note that from the first issue of 2016, this journal uses article numbers instead of page numbers. See further details here.