
Legacy of Prior Management of Cropland after Afforestation with Populus x euroamericana (Dode) Guinier: Effects on Soil Respiration

1
Facultad de Ciencias Exactas, Universidad Nacional del Centro de la Provincia de Buenos Aires, Pinto 399, Tandil 7000, Argentina
2
Centro de Investigaciones en Física e Ingeniería del Centro de la Provincia de Buenos Aires (CIFICEN-UNCPBA-CONICET-CICPBA), Pinto 399, Tandil 7000, Argentina
3
Departamento de Suelos, Biosistemas y Ecología Agroforestal, MBG Sede Santiago-CSIC, Apartado 122, E-15780 Santiago de Compostela, Spain
4
Driscoll’s, 3391 E. Hueneme Rd, Oxnard, CA 93033, USA
*
Author to whom correspondence should be addressed.
Forests 2023, 14(5), 1048; https://doi.org/10.3390/f14051048
Submission received: 28 April 2023
/
Revised: 16 May 2023
/
Accepted: 17 May 2023
/
Published: 18 May 2023
Abstract
:Afforestation is a good strategy for climate change mitigation through increasing carbon stocks. This study determined changes in soil respiration (SR) brought about by the afforestation of high quality agricultural land in a temperate-humid region (Galicia, NW Spain), identified the variables that explain the observed changes and determined the main factors regulating SR temporal variation. Paired plots of fertile soils (cropped vs. afforested plots) were established in two similar areas (Pontevea and Laraño) where afforestation with Populus x euroamericana (Dode) Guinier was carried out in the same year. Different management practices and crop rotations were used (maize–pasture, Laraño and maize–fallow, Pontevea). The SR was measured in situ with a CO2 static chamber every 15 days (every month in winter) for 16 months; soil temperature (Ts) and soil moisture content (W) were also measured. In both areas, significant differences (p < 0.05) in SR between paired plots were related to soil organic C content and SR was mainly influenced by Ts, except during the summer period where SR fluctuations were accompanied by W fluctuations. These findings show that growing pasture crops on high quality land can prevent the loss of soil N and C and probably improve the greenhouse gas balance in the system.
1. Introduction
Within the context of climate change, a net reduction in the global emissions of greenhouse gases (GHGs) to the atmosphere must be achieved; this particularly applies to emissions of carbon dioxide (CO2), as the associated increase in the global mean temperature will have irreversible consequences for the planet [1,2]. The current high mean concentration of atmospheric CO2 is mainly due to the use of carbon© stocks. Thus, e.g., increased soil organic matter (SOM) mineralization, which involves the transformation of organic C compounds releasing nutrients and CO2, is largely a consequence of the conversion of forest land to agricultural land [3,4,5]. Since 2016, the signatories of the Paris Agreement have been working to reduce GHG emissions by 40% relative to 1990 levels. In this respect, it is considered that agroforestry systems are a good option for climate change mitigation, owing to their ability to increase C stock in the biosphere [6,7,8]. However, the effects of afforestation on carbon sequestration vary widely because they depend on many factors, including the physicochemical characteristics of the soil, the crop species planted and the modification of soil characteristics brought about by land use change [5,9], which leads to changes in the interactions between C and N in the soil [8,10], thus affecting its C sequestration capacity.
The soil stores two or three times more C than the atmosphere [11,12] and represents the main reservoir of terrestrial carbon; the role of the soil in the global C balance therefore depends on its potential to store C with a slow rate of change [11]. Only a small fraction of the C that enters the soil is finally stored as total soil organic carbon (SOC), and most is returned to the atmosphere via ecosystem respiration [11,13]. Ecosystem respiration mainly (60%) consists of soil respiration (SR) [14]. In turn, SR comprises root respiration, soil fauna and microbial respiration [15,16]. Root respiration contributes on average up to ~50% of the total SR, although the proportion may vary between 10 and 95% depending on the season and type of vegetation present [16,17].
Soil respiration, similar to any other process involving the emission of gas from the soil, depends on various parameters, which can be grouped into two classes: those affecting gas diffusion in the soil matrix and those related to the biological activity responsible for this process. However, in this case, the most common parameters, such as soil temperature (Ts) and water content (W), affect both types of processes and generally explain the seasonal variations in SR [15]. On the one hand, the W determines the microbial activity and related processes, and on the other, a high W reduces the effective porosity (available pore space) [17]. High W close to saturation also strongly affects the availability of O2 and therefore the SR rate. The percentage of water-filled pore space (WFPS) is another associated factor and is correlated with CO2 flux. In addition, increases in Ts cause increases in microbial metabolism and therefore in SR rates. In the field, the effects of Ts and W overlap, and clear linear correlations are not always observed [17]. This occurs because the water acts both as a solvent for C and essential nutrients and also as a substrate for microbial growth [15,17]. An increased water content therefore often leads to increased SR. Some other soil parameters, such as texture and the proportion of stable aggregates, may also affect SR; e.g., the C contained in soil aggregates is not available to microorganisms [17,18], and therefore the SR is lower within the aggregates.
It is generally known that certain activities (silviculture/agriculture) lead to structural and chemical changes in the soil; however, it is not yet clear how these changes affect SOC and SR [19]. In SOM depleted or degraded soils, SOC pools can be restored through appropriate land use conversion and by adopting measures such as conservation tillage, integrated nutrient management, use of crop rotations, including service crops, and improved water use efficiency, amongst others [20]. In this respect, diverse authors such as those of [21] have found that degraded pastures emit more CO2 and have lower concentrations of SOM than managed pastures. On the other hand, afforestation is also used as a mitigation mechanism because it leads to the storage of C in forest biomass and also because of its effects on SOC [22]. However, some studies have demonstrated that establishing forest plantations is not always the best method of increasing soil C stocks and that the time that the land remains under a certain type of use is a major determining factor. For example, in Eucalyptus plantations of 4 years, established in degraded pasture land in the Brazilian savanna, CO2 emissions were higher (70%) than in other types of land (savanna/pasture), and the loss of organic matter associated with the mineral fraction (the least labile) in the pasture soil was not recovered by the afforestation [13]. Reference [23] mentioned that in boreal and temperate forests, intensive timber harvesting with the removal of harvest residues and stumps reduced soil C stocks and increased CO2 emissions in light and moderate thinning treatments, while high stocking density and increased fertilization or dominance of coniferous species increase soil C stocks. Reference [24] reported some benefits of establishing a mosaic of vegetation in managing pasture on the sandy soils of the Kalahari Desert, which were associated with increased concentrations of C and N in the soils. The vegetation influences the SOC content and dynamics [17] through its influence on microbial activity, so that both increases and decreases in SR are commonly observed after afforestation [19].
In Europe, the massive afforestation promoted since 1990 by the Council of the European Union has mainly been applied to marginal land and using exotic species, selected for their rapid growth (amongst other factors), under the assumption that this would lead to a rapid sequestration of C in the forest biomass. However, during this period, the rural environment has been affected by various different factors, including changes in productive systems and the economic structure and the abandonment of rural areas in favour of large cities. As a result, in some areas, such as Galicia (NW Spain), afforestation has often involved high quality agricultural land rather than marginal land. Most of the transformed land has been afforested with different species of the genus Populus (exotic species in the region) selected for their high productivity and versatility. Moreover, a high proportion of the good quality land in Galicia is low-lying fertile land (subject to flooding), where poplar species grow well. In the region, the agricultural management of land close to rivers varies depending on the flood risk. Land at a high risk of flooding is often used to produce forage crops (pastures), which are rotated with maize every two or three years, and the land never lies fallow. On the other hand, in areas further away from water courses, the land is cropped with maize in spring–summer, and then either potatoes are planted or the land is allowed to lie fallow in winter. In both cases, the soils are heavily fertilized, mainly with organic material such as slurry or manure [25]. In light of these changes in forest plans, it is not clear whether the effect of afforestation on the C cycle was that which was expected.
Despite the time that has passed since the programmes promoting afforestation were implemented and the fact that high quality agricultural land was afforested for social and economic reasons, little is known about the ecosystem C balance in high quality forest soils [26]. Our research group has therefore initiated a wide-ranging project aimed at evaluating the modifications in soil properties that determine the edaphic metabolism (biochemical properties) as well as the modifications in the organic matter stocks and the emission of greenhouse gases (GHGs) in afforested soils. During the project, various sites were selected for establishing paired plots of high-quality land and afforested land in order to carry out a series of parallel studies. The present paper reports the results of one of these studies, carried out with the aims of identifying the changes in SR caused by afforestation and determining which variables explain the observed change, fundamentally regarding the prior land use. As the same sites have been used for various studies, the site and soil characteristics are common to the different studies. For the present study, pairs of plots (cropped vs. forest plots) were established on high quality land in similar areas where afforestation was carried out in the same year (vegetation of the same age). As previously indicated, the cropped plots are representative of different types of management and crop rotations, both of which are typical of the region (maize—pasture of grasses and legumes, and maize—fallow). The study hypotheses are as follows:
- As changes in land use (cropped vs. forest) affect SOC dynamics, SR will also be affected by change in the same direction.
- Differences in the prior management of soils and in crop rotations (maize–pasture legumes–fallow; maize–fallow) will affect differences in SR between pairs of plots.
- Soil temperature (Ts) and moisture (water) content (W) affect the biological activity and diffusion of gases in the soil, so that the variations in SR will mainly be associated with individual variations in these parameters or their interactions.
2. Materials and Methods
2.1. Description of the Study Site
The study was carried out in two sites: Laraño (L), A Coruña, Spain (8°30′50″ W, 42°48′50″ N) and A Barca, Pontevea (P), A Coruña, Spain (8°32′50″ W 42°45′17″ N). Both sites are located in alluvial plains where the land is considered high quality and suitable for agriculture [27] (Figure 1). The Laraño site consists of a current floodplain of the river Santa Lucía, located at a mean elevation of 78 m above sea level. The soil parent material consists of sediments derived from schists and amphibolites: the soil is classified as a humic fluvisol [28] and has a sandy loam texture, with 68% sand and 10% clay in the upper 0–10 cm layer. The Pontevea site is characterised as a Würmiense alluvial terrace and is located at 5 m above the current level of the river Ulla, with a mean elevation of 28 m above sea level. The soil parent material consists of sediments derived from granites and migmatites: the soil is classified as arenic fluvisol [28] and has a sandy loam texture, with 72% sand and 8% clay in the upper 0–10 cm layer. In both sites, pairs of adjoining plots representing contrasting land use (cropped forest) were used for the study. The agricultural plots in both sites have been cultivated continuously for more than 100 years, with a maize–pasture (grass–legume) rotation in Laraño (CT-L) and a maize–fallow rotation in Pontevea (CT-P). In both cases, the plots are mainly fertilized with cow slurry, although inorganic fertilizers (urea and NPK) and small amounts of liming agents (agricultural lime or slaked lime) are also applied. The maize was sown between May and September in both sites. In Laraño, the pasture legumes are harvested frequently, depending on the weather conditions. The adjoining plots were afforested in 2000 with Populus x euroamericana (Dode) Guinier (AF-L, Laraño and AF-P, Pontevea) and timber harvesting has not been carried out in either site. A more detailed description of the study plots and management systems is provided by [29].
2.2. Measurement of CO2 Flow
In each plot, the CO2 flux was measured in a closed soil respiration chamber fitted to a portable infrared gas analyser (EGM-4, PP Systems) every 15 days (every month in winter) during 21 months (October 2010–June 2012). The chamber used to measure soil respiration has internal ventilation to ensure homogeneous air flow and to prevent generation of pressure differences, which may cause changes in the CO2 flux. All leaves were removed from the soil surface before the chamber was placed on the soil, and air was then circulated between the chamber and the analyser. At each sampling time, the CO2 flux (g CO2 m−2 h−1) was measured every hour between 08:00 and 18:00 h, at six randomly selected replicate points each time, to enable calculation of the daily mean value. Simultaneously, at each measurement point, the temperature was measured at the soil surface (Ts), with a thermocouple probe (stem length 10 cm) (Hanna Instruments, Woonsocket, RI, USA) inserted in the soil to a depth of 5 cm, once every hour at the same random points in each plot where CO2 flux emission was measured.
2.3. Soil Parameters
At each sampling time, soil samples (0–10 cm) were obtained at each of the six random points in each plot where CO2 flux was measured: the samples were mixed together and homogenized to produce a single, composite sample for determination of the water content (W) by the gravimetric method (drying at 105 °C for 24 h or until constant weight). Bimonthly soil sampling (0–10 cm) was also carried out between July 2011 and July 2012. The bulk density was determined by the soil core method [30]. The total C content (wet oxidation with potassium dichromate in strongly acid medium) and the total N content (Kjeldahl digestion) and the pH in water and in 1 M KCl (soil/solution ratio, 1:2.5) were determined according to the methods described by [31]. The particle size distribution was determined after oxidation of the organic matter with hydrogen peroxide, with the aid of a Robinson pipette and with Calgon as dispersant [31]. The texture class was assigned according to the USDA soil textural classification [32]. The field capacity (FC) was measured as the water retained by the soil at a pressure of −33 kPa, measured with a Richards pressure membrane extraction apparatus and using undisturbed soil samples [31]. The labile C was determined after extraction with water (soil/water ratio 1:5) at room temperature (20 °C, 30 min [33]), and the total C in the aqueous extract was measured after oxidation with potassium dichromate in acid medium [31].
2.4. Climatological Data
Daily mean, maximum and minimum temperatures and precipitation were recorded at two weather stations belonging to the Galician network (MeteoGalicia, Spain) and located at sites close to the study plots (the Santiago de Compostela weather station for Pontevea and the Sergude weather station, in Boqueixón, for Laraño).
The mean temperature from Laraño site during the study period was 12.8 ± 4.0 °C, which is slightly lower than the annual mean value for the period 2000–2010 (Figure 2). The monthly minimum temperature recorded during winter was 2–3 °C (February 2012) and the monthly maximum temperature during summer, 25 °C (August 2011) (Figure 2). The precipitation amount during the study period was 1843 mm, which is 76.5% higher than the mean amount of precipitation for the ten-year period 2000–2010. At Pontevea site, the mean temperature during the study period was 12.9 ± 3.9 °C, which is slightly lower than the mean level for the period 2000–2010 (Figure 2). The monthly minimum temperature recorded in winter was 2–3 °C (February 2012) and the monthly maximum temperature recorded during summer was 25 °C (August 2011) (Figure 2). The precipitation amount during the study period was 2137.2 mm, which is 67.6% higher than the ten-year period 2000–2010 (Figure 2).
2.5. Statistical Analysis
The statistical analysis was conducted using Origin Pro software version 18.0, considering a significance level of α = 0.05. Descriptive analysis, tests of normality (Shapiro–Wilk) and homoscedasticity (Fisher’s F test or Levene’s test) were applied to all data. t tests, Wilcoxon signed-rank test or Kolmogorov–Smirnov test (non-parametric) were used to detect any differences between group means, and the Welch–Satterthwaite test was used in the absence of homoscedasticity. The dependence of SR on different factors (plots, sites) was explored by one-factor ANOVA or Kruskall–Wallis test (non-parametric). Pearson’s or Spearman’s correlations were used (as appropriate) to detect any significant linear correlations between SR and the variables considered. Afterwards, a multiple linear regression analysis was performed for SR and the independent variables (W/FC and Ts), considering the different types of cover for both sites.
3. Results
3.1. Effect of Afforestation on Soil Characteristics
The cropped soils were characterised by similar acidity but differed in total C (Ct) and N (Nt) contents, with lower values in Pontevea (Table 1), consistent with the fact that the land in this site lies fallow during a large part of the year. Regarding the effect of afforestation on the soil properties, there was a slight increase in soil pH (in H2O and KCl) due to the afforestation in Laraño, but not in Pontevea (Table 1). The total C and N contents were not greatly modified by afforestation in Laraño, and the C/N and labile C content only increased slightly; the latter increased by 32% in AF-L and was less variable (% CV) than in the soil in the respective cropped plot (Table 1). However, in Pontevea the afforestation led to a significant increase in the values of the soil parameters related to the organic matter: the increase was on average 63.3% for Ct, 47% for Nt, 14% for C/N and 141.5% for labile C. Finally, a statistically significant difference between the pairs of plots in apparent density was observed in both Laraño and Pontevea, with the lowest values in the afforested soils (Table 1).
3.2. Temporal and Spatial Variation in Soil Respiration
The mean variation in CO2 emissions in the four study plots is shown in Figure 3. The times when fertilizer was added or when the grass was cut in the cropped plots and the times when the understory was cleared in the afforested plots are indicated. Clear seasonal variations in the SR rates were observed in both sites and in each plot (Figure 3). In Pontevea, the SR decreased in both plots in the first few months of the study, particularly in the cropped plots; minimum values were recorded in December 2010 in AF-P, January 2011 in CT-P and in February 2012 in both plots. In addition, decreases in SR observed in April 2011 and May 2012 coincided with deep ploughing (to depths of between 30 and 50 cm). The same seasonal pattern of variation was observed in AF-P, where the intensity of CO2 flow increased during hot periods and decreased during cold periods. However, the SR also decreased during hot periods in 2011, one of which coincided with the cutting and clearing of the understory, but which may have also been related to drought events (Figure 2 and Figure 3). In the following year (2012), the understory was cut but not cleared (the cutting remains were left on the soil surface) and there was no immediate decrease in SR (the measurements were then interrupted, preventing any examination of the variations that may have occurred).
The SR rate was generally lower in CT-P than in AF-P, except at several specific times when it was the same or even higher (possibly related to the preparation of the soil for sowing and heat/drought events), and in November–December 2011, when it was the same in both plots. The mean annual rate was significantly higher in AF-P (0.576 ± 0.227 g CO2 m−2 h−1) than in CT-P (0.415 ± 0.243 g CO2 m−2 h−1 although the difference was not very large even if it was significant (p < 0.05, Kruskall–Wallis test). However, when the different soil cover types (fallow/maize) were considered, the differences (p < 0.05, Kruskall–Wallis test) were more pronounced, as can be observed in Figure 4, as the mean SR was lower in the fallow soil (0.324 ± 0.224 g CO2 m−2 h−1) although with large variations (CV 69%). The mean SR was similar in the soil under maize (0.557 ± 0.201 g CO2 m−2 h−1) to that in AF-P, although the coefficient of variation was slightly lower than that in AF-P (36% vs. 39% CV).
Similar findings were obtained in the Laraño plots. Thus, the SR decreased between the beginning of the study period and December in both plots, reaching the minimum values for the entire study period. However, unlike in Pontevea, in Laraño, the SR rates were similar in the cropped plot and the afforested plot throughout the winter. As occurred in Pontevea, the other minimum SR value in Laraño occurred in the winter of the second year of the study (2012). In CT-L, the SR increased after the grass cutting, after fertilizer application and within 12 days after the maize sowing; although similar increases also occurred at the same times in the afforested soil, they were less intense than in the cropped soil. Decreases in the SR rates again coincided with ploughing prior to sowing, as observed in Pontevea. In the afforested plot, the same seasonal pattern was observed and the mean monthly values were slightly lower than in CT-L, except at a few specific times (between November and February 2010 and between September and October 2011). The only time throughout the whole study period that the understory was cut (July 2011), the remains were left on the soil surface, and the SR values did not vary. In Laraño, the mean annual SR rate was statistically significantly lower in AF-L than in CT-L (0.525 ± 0.214 vs. 0.651 ± 0.302 g CO2 m−2 h−1) (p < 0.05; Kolmogorov–Smirnov test). When the different types of soil cover were considered (pasture/maize), the differences in SR were notable; the mean value was higher in the soil under maize (Figure 4) with a value of 0.807± 0.206 g CO2 m−2 h−1, whereas the mean value in the soil under pasture was 0.582 ± 0.312 g CO2 m−2 h−1, which is similar to that in the afforested soil. The SR values in the soil under pasture had the highest coefficient of variation (CV 54%), whereas the lowest variation was recorded in the soil under maize (CV 25%) and in the soil in the afforested plots (CV 41%), the value was intermediate and similar to that in the Pontevea afforested plot.
3.3. Effect of Afforestation on Soil Respiration
The differences in SR between pairs of plots, or net CO2 emissions in the afforested plots (Figure 5) were different in each site. In Pontevea, the values indicated a net emission of CO2 due to a change from agricultural land use to forest use (Figure 5); negative values were only recorded in April and at the end of July and some values close to zero were recorded during the growth of the maize and during the second fallow period. By contrast, during most of the study period in Laraño, the net CO2 emission from the forest soil was negative, indicating that the afforestation led to a reduction in the CO2 emitted. Positive values were only recorded between December 2010 and March 2011, and between September and November 2011 (winter and autumn, respectively) during periods when the soil was under pasture, after the maize was harvested in the latter period.
The effect of afforestation on SR was very different in both sites, reflecting the dependence of this variable on prior land use and management. The percentage increase or decrease in SR between paired plots (cropped vs. afforested) relative to the base value (cropped plot) is shown for each period in Figure 6. In both cases and during the whole study period when the soil was under fallow or pasture, the differences between the afforested and cropped plots were very similar. By contrast, during the growth of maize, the net emission from the afforested soil was very variable relative to that in the cropped plot and different from those in other periods. On average, in Pontevea, afforestation led to a 36% increase in CO2 emissions relative to the cropped plot, whereas in Laraño, the afforestation led to an average 19% decrease in CO2 emissions compared to the cropped plot. The final period of study in Pontevea was not taken into account in reaching this conclusion as it was very short (only two measurements, see Figure 3a). During the maize growing period in Pontevea, the CO2 emissions decreased by 20% due to the afforestation, whereas in Laraño, the emission increased by 7%.
3.4. Temporal Variation in Soil Temperature and Moisture Content
For each soil, the water content values measured throughout the study period (W) were expressed relative to the soil field capacity (W/FC), which enabled a comparison between the different soils. Temporal variation was observed in both variables (Ts and W/FC; Figure 7): in both sites and plots, the maximum temperatures were observed in spring–summer, coinciding with a lower water content (~40% of W/FC), whereas the minimum values occurred in winter, when the water content was the highest. In Pontevea, the mean temperatures were 16.6 ± 6.6 °C in CT-P and 15.6 ± 4.4 °C in AF-P. On the other hand, in Laraño, the mean soil temperatures were 18.4 ± 7.2 °C in CT-L and 15.6 ± 4.4 °C in AF-L. The soil temperature was quite similar in both plots (cropped and afforested) but slightly higher, on average, in the agricultural soil (p < 0.05, Welch two-sample test), and the difference was greater in the fallow periods in Pontevea. In addition, differences in Ts were observed between paired plots during the maize-growing season (spring–summer), when the values were the highest in the cropped soil, which, in turn was slightly drier (<40% W/FC) than the corresponding afforested soil (Figure 7). On the other hand, the minimum temperatures were lower in the cropped plots (1.4 °C and 2.8 °C for Pontevea and Laraño, respectively) than in the afforested plots (4.20 °C and 3.3 °C for Pontevea and Laraño, respectively) (Figure 7). In other words, in both sites, and as expected, the variation in Ts was greater in the agricultural than in the afforested plots.
As previously mentioned, a seasonal pattern was also observed in the soil water content, with minimum values in summer (between 31.6 and 42.9% of the FC) and maximum values during autumn–winter (between 118.56 and 164.45% of the FC). In Pontevea, the mean W/FC values were 92.3 ± 36% and 74.3 ± 25% for AF and CT, respectively. Similar values were observed in Laraño: 93.1 ± 28.6% and 78.5 ± 28.9% for AF and CT, respectively. There were no significant differences in the mean values between the plots in each site (ANOVA test, p > 0.05). In particular, a greater difference in the water content of the soils in both plots was observed during the fallow period. During this time, the water content was always higher than the field capacity in the afforested soil, but not in the cropped soil, in which it only exceeded 100% in some months (Nov–Feb). These differences decreased during the maize-growing period; i.e., although the plant cover was different, the water content was the same. By contrast, in Laraño, the variation in the water content in both plots was similar, with slightly higher values in the afforested plot. However, the values were scarcely lower than 100% in both plots during the pasture season and decreased to almost half during spring and summer, which coincided with the maize-growing season.
3.5. Relationships between Soil Respiration and Soil Temperature and Moisture Content
Similar patterns of seasonal variation in soil respiration and soil temperature (SR and Ts) were observed throughout the study period, which was confirmed by the significant correlation between these variables (Figure 8). In all cases, the correlation was positive and slightly lower in the agricultural soils, which may be associated with the alterations that the soils underwent in relation to the management practices in each site (Figure 3). The correlation between soil respiration and soil temperature was also highly significant in the cropped plots in both sites during the first fallow period in CT-P (SR vs. Ts: r = 0.736, p < 0.05) and during the two periods under pasture in Laraño (CT-L). The correlation during the first period when the soil was under pasture in CT-L was higher (Pasture 1: SR vs. Ts: r = 0.921, p < 0.01) than during the second period (Pasture 2: SR vs. Ts: r = 0.669, p < 0.05). There were no significant correlations between SR and soil temperature during the period when maize was sown in either of the sites.
In Laraño, SR and W/FC were negatively correlated, which confirms the inverse pattern of seasonal variation observed (Figure 3 and Figure 7), especially in the cropped plot. Considering the different types of cover in Laraño (Figure 9a) the correlations involving water content (W/FC) increased and were positive when the soil was under maize and negative during the first period under pasture, but they were not significant during the second period under pasture. The change in the slope of the relationship clearly occurred when the values were higher than 60% W/FC (Figure 9a). By contrast, in the afforested soil in the same site (Figure 9b), the correlation was stronger (relative to the values shown in Figure 8) upon excluding W/FC values which were lower than 60% (marked in green in Figure 9b). In Pontevea, soil respiration and W/FC were not correlated in CT-P, considering the whole study period (Figure 8). However, considering the different stages of the rotation (maize and fallow) separately (Figure 9c), a significant correlation between these variables was observed during the fallow period. As observed in Laraño, in AF-P, a stronger correlation was obtained when the W/FC values lower than 60% were excluded from the analysis (Figure 9d, excluded values marked in green). The results of the MLR analysis considering the different cover types at both sites (Table S1 Supplementary Materials) are consistent with these observations.
Consistent with the observations on soil water content, in the afforested plots in both sites, the SR and WFPS were significantly negatively correlated. As the WFPS indicates the percentage of pores filled with water, this result indicates that SR is higher when the soil is more aerated. In Laraño, the correlation was stronger in the cropped plot than in the afforested plot, while in Pontevea, these variables were only significantly correlated in AF-P. Considering the changes in land use in CT-L, the opposite results were obtained: in the soil under maize, the correlation between these two variables was positive (R = 0.770, p < 0.05), but in the soil under pasture (pasture-1), the correlation was negative (R = −0.926, p = 0.0001). By contrast, in CT-P, no significant correlation was detected upon considering changes in land use (maize, fallow).
4. Discussion
4.1. Effect of Afforestation on Soil Respiration
The SR rates measured in the present study are within the range of those reported in other studies involving temperate soils ([10], amongst many others), forest soils [11,34,35] riparian soils [36], soils cropped with maize [37,38] and soils under pasture [37]. In addition, the strong seasonal variation, with minimum values in autumn–winter and maximum values in spring–summer, is also consistent with previous reports [34,36,39,40] and is associated with variations in soil temperature and moisture content. The characteristics of both sites are similar and both have been planted with the same crop and tree species, with afforestation carried out in the same year. However, the CO2 emissions from the afforested soils to their respective cropped soils are very different, which can be attributed to different land management practices affecting soil characteristics and microclimate and, in turn, soil microbial activity [10,41]. Although this is not always the case [42,43], mean SR rates are generally low in fallow soils [17]. However, SR rates in fallow soils of this study are relatively high. This is probably due to the favourable climate of the region (mild temperatures and abundant rainfall) which means that the soil is never bare, as even during fallow periods when no crops are grown, the soils are covered with vegetation and are not bare fallow soils.
The study findings show that, although the SR in the cropped soils may be higher or lower than in the afforested soils at specific moments, the factors determining the annual variations in CO2 emissions from the agricultural soils are generally soil moisture content, temperature and organic matter content, especially the labile C content. Likewise, it ap-pears that the variations in SR in the afforested soils are determined by the same factors.
Regarding the influence of afforestation on soil respiration, important differences were observed between the two study sites. These differences can be attributed to the prior management of the agricultural soils, which determine the modifications in CO2 emissions after afforestation.
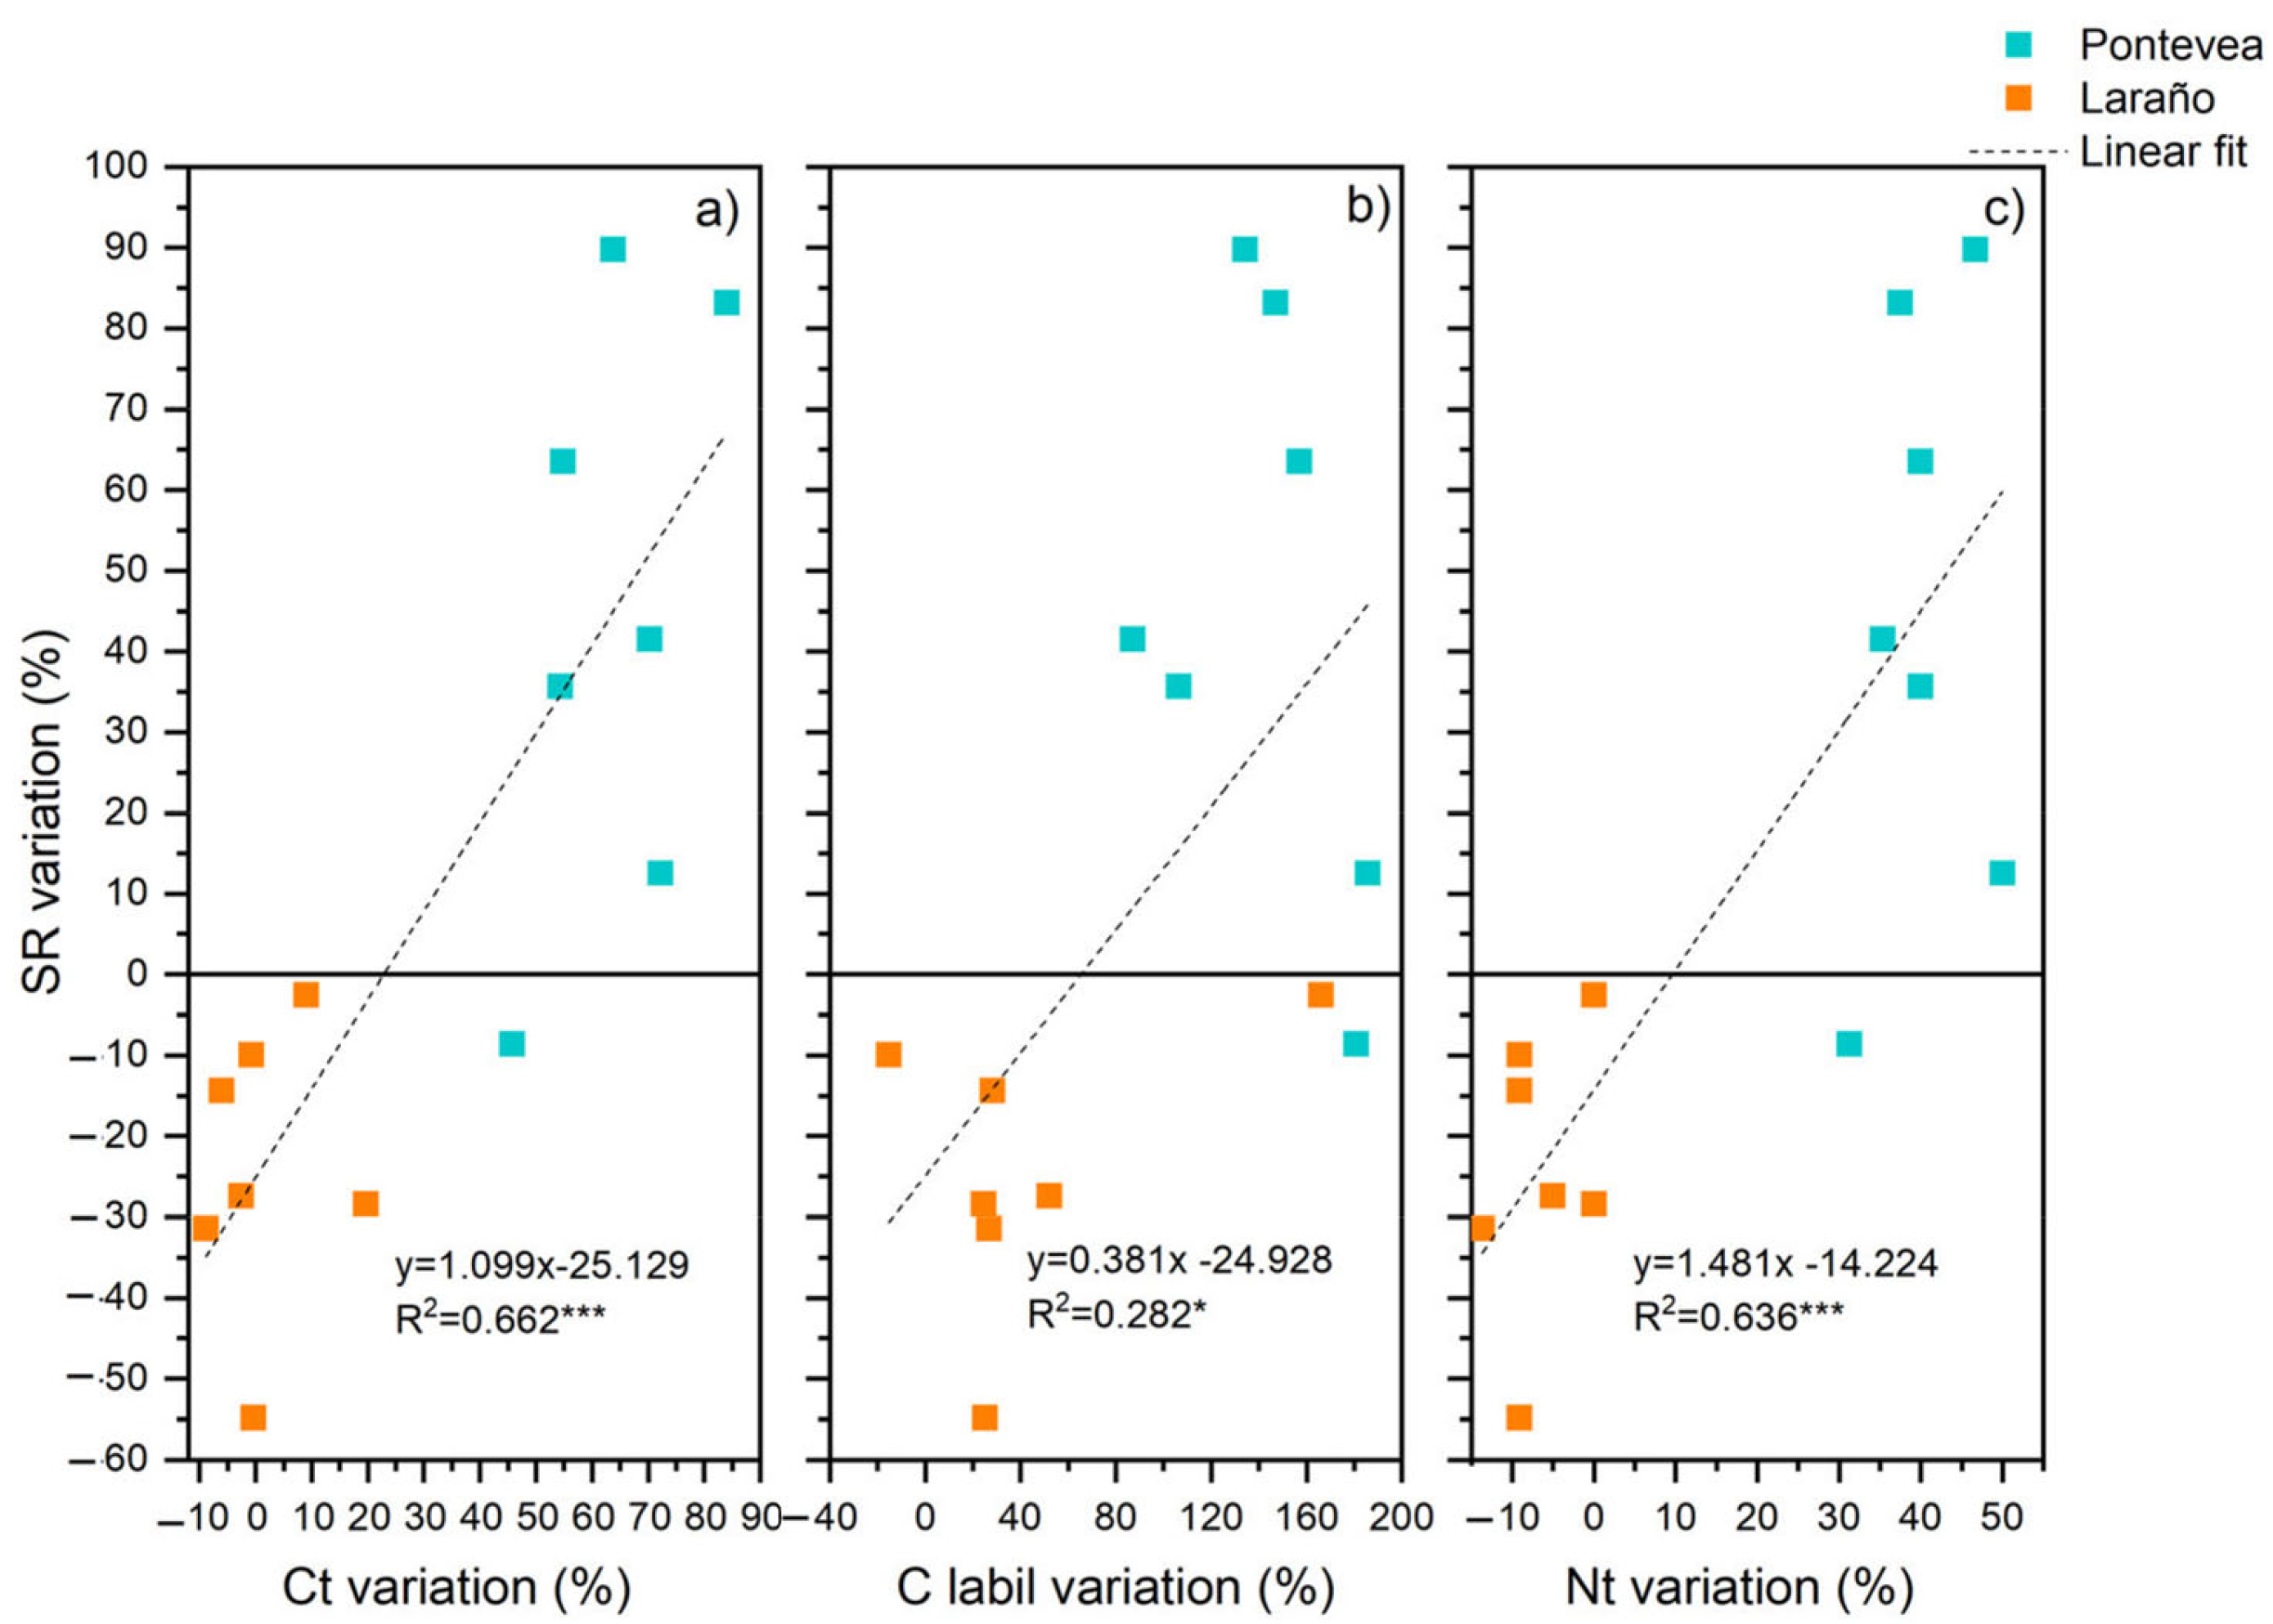
In Pontevea, the higher CO2 emissions from the afforested soil compared to the agricultural soil can be attributed to root respiration, which is much higher in afforested soils than in fallow soils and may represent up to 50% of the SR [44]. However, the higher emissions can also be attributed to the increased microbial activity produced by the continuous input of residues, which provide a source of available C [10,39]. In this respect, in Pontevea, it was observed that the increase in Ct of more than 50% (caused by afforestation) led to an increase in SR rates of at least 12.5% (Figure 10a). Likewise, when the difference in labile C was greater than 85% in the afforested soil, the SR rates increased by 30 and 90%, and no further increase in SR was observed when the labile C increased further, by more than 185% (Figure 10b). Finally, when the difference in Nt between the cropped and afforested soils was greater than 35%, the SR rates increased by 12 and 90% (Figure 10c). The C/N ratio also increased in AF-P, but no direct effect on the CO2 flux was observed. These results demonstrate that the higher emissions of CO2 from the afforested soil are not due to a loss of C; on the contrary, the accumulation of SOC occurred as a result of the long-term addition of leaf litter and root exudates, in addition to the reduction in soil disturbance when the trees became established, as was also reported in other studies [10,19] in which a strong correlation between SR and some soil properties, such as total C content, inorganic N content and C/N ratio, among others, was observed.
Unlike in Pontevea, no significant changes in the soil properties were observed in the plots in Laraño (Figure 10); the afforestation scarcely modified the Ct levels and no differences were observed throughout the study when different crops were planted and/or different cultivation management practices were carried out in the cropped plot. In this site, the average difference in the labile C content between the afforested and cropped plots was 25% and scarcely exceeded 50% during maize harvesting, when the differences in SR between plots were high. After harvesting, the difference in the labile C content reached 166%; however, there were no differences in SR between plots. Finally, the variations in Nt were almost non-existent, and the SR rates were lower in the afforested plots than in the cropped plots. It therefore appears that, in this case, the differences in the mean SR rates between the plots are due to the maize, which led to a significant increase in the CO2 flux (Figure 3).
The mean SR values obtained for each plot were used to estimate the mean annual emissions of CO2 per unit of Ct (Table 2). The values were similar in the afforested soils and lower than in the respective cropped soils. Moreover, we can also consider the annual emissions when the soils are under the different types of soil cover considered in the study. Thus, the highest annual emissions were from the soil under maize (assuming the presence of the crop throughout the whole year). On the other hand, the annual emission estimated for fallow soil was very low, being 18% lower than the emission from the afforested soil. By contrast, the annual emission estimated for a soil under pasture was similar to that from the respective afforested soil. These comparisons have led us to suggest that some type of vegetation cover, i.e., service or cover crops, should be included in the rotation to prevent the loss of N and C that generally occurs in bare or fallow soils. In recent years, there has been an increase in interest in using these types of crops, owing to their potential value as additional providers of ecosystem services in agricultural systems [45]; the results of the present study provide further relevant data in this respect. The results of this study contribute to increasing the knowledge of GHG emissions from soils in relation to different types of land management and land use. They also shed some light on the potential effectiveness of measures (such as afforestation) taken to mitigate the effect of GHGs on climate change. In temperate humid areas, such as the study area, afforestation and permanent pasture can both similarly increase or maintain the organic C content of high quality soils. Therefore, correct crop rotation management that includes long periods under pasture could reduce GHG emissions, as the soils would act as atmospheric C sinks during these periods.
4.2. Relationship between Soil Respiration and Soil Temperature and Moisture Content
As expected, in both sites, the variation in Ts was higher in the cropped plots than in the afforested soils, which can be attributed to the constant shade produced by the permanent vegetation in forest soils [46]. In addition, this variation may affect the changes in SR throughout the year in cropped soils, leading to a higher coefficient of variation. In all of the plots, the SR was positively correlated with Ts, probably due to the increase in microbial metabolism with temperature, especially when the moisture conditions were also optimal for microbial development, as shown in previous studies [10,11,39,41]. By contrast, the soil moisture content and water-filled pore space were generally negatively correlated with SR in a similar way to that reported in diverse studies of soils under different vegetation, such as paramo (treeless plateau), birch stands, pasture and pine stands [19], soils in shelterbelts [10] and in cropped soils [39]. This correlation is associated with the decrease in the diffusivity of gases in soil that is produced when the effective porosity decreases and, as a consequence, the oxygen content of the soil also decreases [18,47,48]. The soils under study here are floodplain fertile soils, and therefore, the moisture content should not limit biological activity (the W/FC was higher than 50% throughout most of the study period), whereas gas diffusivity may be a limiting factor. Thus, the seasonal variations in SR were mainly associated with variations in Ts, except during the summer period, when the soil water content fell below the mean value and therefore the importance of this variable increased. During summer, the variations in SR were associated with this factor in both the afforested and cropped soils, in which the moisture contents were similar, in terms of their W/FC values (Figure 7). Therefore, the inverse relationship between the variables Ts and W may be explained by the contrasting pattern observed, as mentioned for various ecosystems in previous studies [39,47]. The contribution of these environmental drivers to soil CO2 flux has been mathematically determined by several researchers using different sites and non-linear models (usually exponential models). However, [49] mentioned that the best-fitting models are dependent on the local environmental conditions, and the moisture content can be expected to have significant effects above one-third of the water-holding capacity. This may explain why the soil moisture content does not always improve the accuracy of the models obtained.
In agricultural soils, a positive linear relationship between SR and W is often observed during summer [44], as in the present study. During this period, when the maize is growing, the root biomass and, therefore, the rhizosphere microbial biomass increase, and these must consequently be the main factors involved in the change in the slope of the correlation line between variables, although some authors mention that the change in the slope occurs at 60% of the WFPS [11], whereas other authors report that it occurs at 45% [50]. In the present study, the change from a positive to a negative slope occurred when the moisture content was more than 60% of the FC or when the WFPS was greater than 35%. This is in good agreement with the authors of [18], who indicate that for soils containing 10% clay, such as those in the present study, the optimal moisture content when maximum SR rates are reached is around 28%, quite similar to the value found in our study (85%–88% of the W/FC in our study). The absence of correlations between the variables after the maize was harvested may be due to the disturbance of the soil in each agricultural plot, which generates strong variations in both the SR rates and in the soil parameters during the first few months after harvesting.
5. Conclusions
Afforestation of maize cropland reduces CO2 emissions, independently of the type of soil management used prior to planting the trees. The crop rotation including pasture emits more CO2 throughout the year than the rotation including a fallow period, as the in-crease in total and labile C generated by the roots and their exudates and by the litter from vegetation leads to an increase in microbial activity and thus in the soil respiration rate. However, the similarity in the CO2 emissions from the pasture and afforested plots suggests that the afforestation of pastures does not affect soil Ct (total and labile) and that the influence of roots and organic matter inputs on soil respiration rates are similar in both cases. These findings are important in relation to implementing measures aimed at reducing the impact of anthropogenic activities on soil carbon as the establishment of pastures, even in high quality land (as in the present case), as it prevents the loss of C (and N) from the soil and possibly improves the GHG balance in the system.
Supplementary Materials
The following supporting information can be downloaded at: https://www.mdpi.com/article/10.3390/f14051048/s1, Table S1: Multiple lineal regression analysis. CT-P: agricultural plot in Pontevea; AF-P: afforested plot in Pontevea; AF-L: afforested plot in Laraño; CT-L: agricultural plot in Laraño. N.A: Not applicable. Significance codes: ‘#’: 0.1; ‘*’: 0.05; ‘**’: 0.01.
Author Contributions
Conceptualization, M.E.P. and C.T.-C.; methodology, M.E.P., F.Z. and C.T.-C.; formal analysis, F.Z. and M.E.P.; investigation, M.E.P., F.Z. and C.T.-C.; resources, M.E.P. and C.T.-C.; data curation, M.E.P. and F.Z.; writing—original draft preparation, M.E.P. and C.T.-C.; writing—review and editing, M.E.P. and C.T.-C.; visualization, M.E.P., F.Z. and C.T.-C.; supervision, C.T.-C.; project administration, C.T.-C.; funding acquisition, C.T.-C. All authors have read and agreed to the published version of the manuscript.
Funding
This research was funded by the Spanish MICINN (Project No. CGL2008-01992/BTE) co-financed with ERDF funds from the EU and by the Xunta de Galicia through the GRC project IN607A 2021-06.
Data Availability Statement
Not applicable.
Acknowledgments
M.E. Priano is grateful for funding support from the Enhancing Mobility Between Latin-American and Caribbean Countries and Europe Program (Argentina-España, 2018), and F. Zorita thanks the Spanish MICINN for the award of a predoctoral FPI grant (BES-2009-025438). The authors thank A. Iglesias-Tojo and E. García-Campos, for assistance in carrying out the analyses, and the owners of the agricultural and afforested plots in Laraño and A Barca, Pontevea for their help in carrying out this study.
Conflicts of Interest
The authors declare no conflict of interest.
References
- Kirschbaum, M.U.F.; Guo, L.B.; Gifford, R.M. Why does rainfall affect the trend in soil carbon after converting pastures to forests? A possible explanation based on nitrogen dynamics. For. Ecol. Manag. 2008, 255, 2990–3000. [Google Scholar] [CrossRef]
- Aertsens, J.; De Nocker, L.; Gobin, A. Valuing the carbon sequestration potential for European agriculture. Land Use Pol. 2013, 31, 54–94. [Google Scholar] [CrossRef]
- Watson, R.T.; Noble, I.R.; Bolin, B.; Ravindranath, N.H.; Verardo, D.J.; Dokken, D.J. A Special Report of the IPCC. In Land Use, Land-Use Change and Forestry; IPCC: Cambridge, UK, 2000; pp. 1–20. [Google Scholar]
- Trenberth, K.E.; Jones, P.D.; Ambenje, P.; Bojariu, R.; Easterling, D.; Klein Tank, A.; Parker, D.; Rahimzadeh, F.; Renwick, J.A.; Rusticucci, M.; et al. Observations: Surface and Atmospheric climate change. In Climate Change 2007: The Physical Science Basis Contribution of Working Group I to the Fourth Assessment Report of the Intergovernmental Panel on Climate Change; Solomon, S., Qin, D., Manning, M., Chen, Z., Marquis, M., Averyt, K.B., Tignor, M., Miller, H.L., Eds.; Cambridge University Press: Cambridge, UK; New York, NY, USA, 2007; pp. 237–336. [Google Scholar]
- Ovando, P.; Caparrós, A. Land use and carbon mitigation in Europe: A survey of the potentials of different alternatives. Energy Policy 2009, 37, 992–1003. [Google Scholar] [CrossRef]
- Don, A.; Schumacher, J.; Freibauer, A. Impact of tropical land-use change on soil organic carbon stocks—A meta-analysis. Glob. Chang. Biol. 2011, 17, 1658–1670. [Google Scholar] [CrossRef]
- Nunes, L.J.R.; Meireles, C.I.R.; Gomes, C.J.P.; Ribeiro, N.M.C.A. Forest contribution to climate change mitigation: Management oriented to carbon capture and storage. Climate 2020, 8, 21. [Google Scholar] [CrossRef]
- Xu, X.; Li, D.; Cheng, X.; Ruan, H.; Luo, Y. Carbon: Nitrogen stoichiometry following afforestation: A global synthesis. Sci. Rep. 2016, 6, 19117. [Google Scholar] [CrossRef]
- Poeplau, C.; Don, A. Sensitivity of soil organic carbon stocks and fractions to different land-use changes across Europe. Geoderma 2013, 192, 189–201. [Google Scholar] [CrossRef]
- Amadi, C.C.; Van Rees, K.C.J.; Farrell, R.E. Soil-atmosphere exchange of carbon dioxide, methane and nitrous oxide in shelterbelts compared with adjacent cropped fields. Agric. Ecosyst. Environ. 2016, 223, 123–134. [Google Scholar] [CrossRef]
- Mazza, G.; Agnelli, A.E.; Cantiani, P.; Chiavetta, U.; Doukalianou, F.; Kitikidou, K.; Milios, E.; Orfanoudakis, M.; Radoglou, K.; Lagomarsino, A. Short-term effects of thinning on soil CO2, N2O and CH4 fluxes in Mediterranean forest ecosystems. Sci. Total Environ. 2019, 651, 713–724. [Google Scholar] [CrossRef]
- Prentice, I.C.; Farquhar, G.D.; Fasham, M.J.R.; Goulden, M.L.; Heimann, M.; Jaramillo, V.J.; Kheshgi, H.S.; Le Quéré, C.; Scholes, R.J.; Wallace, D.W.R. The carbon cycle and atmospheric carbon dioxide. In Climate Change 2001: The Scientific Basis; Pitelka, L., Ramirez Rojas, A., Eds.; Cambidge University Press: Cambridge, UK, 2001; pp. 183–237. [Google Scholar]
- Da Silva Teixeira, R.; Cardoso Fialho, R.; Costa, D.C.; Nogueira de Sousa, R.; Silva Santos, R.; Mendes Teixeira, A.P.; Guimarães Reis, T.; Ribeiro da Silva, I. Land-use change with pasture and short rotation eucalypts impacts the soil C emissions and organic C stocks in the Cerrado biome. Land Degrad. Dev. 2019, 31, 909–923. [Google Scholar] [CrossRef]
- Qubaja, R.; Tatarinov, F.; Rotenberg, E.; Yakir, D. Partitioning of canopy and soil CO2 fluxes in a pine forest at the dry timberline across a 13-year observation period. Biogeosciences 2020, 17, 699–714. [Google Scholar] [CrossRef]
- Dhadli, H.S.; Brar, B.S.; Black, T.A. Influence of crop growth and weather variables on soil CO2 emissions in a maize-wheat cropping system. Agric. Res. J. 2015, 52, 28. [Google Scholar] [CrossRef]
- Hanson, P.J.; Edwards, N.T.; Garten, C.T.; Andrews, J. Separating root and soil microbial contributions to soil respiration: A review of methods and observations. Biogeochemistry 2000, 48, 115–146. [Google Scholar] [CrossRef]
- Oertel, C.; Matschullat, J.; Zurba, K.; Zimmermann, F.; Erasmi, S. Greenhouse gas emissions from soils—A review. Geochemistry 2016, 76, 327–352. [Google Scholar] [CrossRef]
- Moyano, F.E.; Manzoni, S.; Chenu, C. Responses of soil heterotrophic respiration to moisture availability: An exploration of processes and models. Soil Biol. Biochem. 2013, 59, 72–85. [Google Scholar] [CrossRef]
- Nazaries, L.; Tottey, W.; Robinson, L.; Khachane, A.; Al-Soud, W.A.; Sørensen, S.; Singh, B.K. Shifts in the microbial community structure explain the response of soil respiration to land-use change but not to climate warming. Soil Biol. Biochem. 2015, 89, 123–134. [Google Scholar] [CrossRef]
- Lal, R. Offsetting global CO2 emissions by restoration of degraded soils and intensification of world agriculture and forestry. Land Degrad. Dev. 2003, 322, 309–322. [Google Scholar] [CrossRef]
- Barretto de Figueiredo, E.; Panosso, A.R.; de Oliveira Bordonal, R.; De Bortoli Teixeira, D.; Berchielli, T.T.; La Scala, N., Jr. Soil CO2–C emissions and correlations with soil properties in degraded and managed pastures in Southern Brasil. Land Degrad. Dev. 2016, 28, 1263–1273. [Google Scholar] [CrossRef]
- Berthrong, S.T.; Piñeiro, G.; Jobbágy, E.G.; Jackson, R.B. Soil C and N changes with afforestation of grasslands across gradients of precipitation and plantation age. Ecol. Appl. 2012, 22, 76–86. [Google Scholar] [CrossRef]
- Mäkipää, R.; Abramoff, R.; Adamczyk, B.; Baldy, V.; Biryol, C.; Bosela, M.; Casals, P.; Curiel Yuste, J.; Dondini, M.; Filipek, S.; et al. How does management affect soil C sequestration and greenhouse gas fluxes in boreal and temperate forests?—A review. For. Ecol. Manag. 2023, 529, 120637. [Google Scholar] [CrossRef]
- Thomas, A.D.; Stringer, L.C.; Dougill, A.J.; Elliott, D.R.; Robert, S.; Robin, H. The influence of trees, shrubs, and grasses on microclimate, soil carbon, nitrogen, and CO2 efflux: Potential implications of shrub encroachment for Kalahari rangelands. Land Degrad. Dev. 2018, 29, 1306–1316. [Google Scholar] [CrossRef]
- Paz-Ferreiro, J.; Trasar-Cepeda, C.; Leirós, M.C.; Seoane, S.; Gil-Sotres, F. Biochemical properties in managed grassland soils in a temperate humid zone: Modifications of soil quality as a consequence of intensive grassland use. Biol. Fertil. Soils 2009, 45, 711–722. [Google Scholar] [CrossRef]
- Peichl, M.; Leava, N.A.; Kiely, G. Above- and belowground ecosystem biomass, carbon and nitrogen allocation in recently afforested grassland and adjacent intensively managed grassland. Plant Soil 2012, 350, 281–296. [Google Scholar] [CrossRef]
- Díaz-Fierros, F.; Gil-Sotres, F. Capacidad Productiva de los Suelos de Galicia, Mapa 1.200.000; Editorial USC: Santiago de Compostela, Spain, 1984; 82p, +maps. [Google Scholar]
- ISSS Working Group WRB. World Reference Base for Soil Resources 2006; World Soil Resources Reports No. 103; FAO: Rome, Italy, 2006; 132p.
- García-Campos, E.; Zorita, F.; Leirós, M.C.; Gil-Sotres, F.; Trasar-Cepeda, C. Evaluation of C Stocks in Afforested High Quality Agricultural Land. Forests 2022, 13, 2055. [Google Scholar] [CrossRef]
- Soil Survey Laboratory Staff (SSLS). Soil Survey Field and Laboratory Methods Manual, Version 2.0; Soil; USDA-NRCS: Washington, DC, USA, 2014; 257p.
- Guitián-Ojea, F.; Carballas-Fernández, T. Técnicas de Análisis de Suelos, 2nd ed.; Editorial Pico Sacro: Santiago de Compostela, Spain, 1976; 288p. [Google Scholar]
- USDA. Soil Survey Manual. Agriculture Handbook No. 18; USDA: Washington, DC, USA, 1952; Volume 34, 145p.
- Huang, Z.; Xu, Z.; Chen, C. Effect of mulching on labile soil organic matter pools, microbial community functional diversity and nitrogen transformations in two hardwood plantations of subtropical Australia. Appl. Soil Ecol. 2008, 40, 229–239. [Google Scholar] [CrossRef]
- Krause, K.; Niklaus, P.A.; Schleppi, P. Soil-atmosphere fluxes of the greenhouse gases CO2, CH4 and N2O in a mountain spruce forest subjected to long-term N addition and to tree girdling. Agric. For. Meteorol. 2013, 181, 61–68. [Google Scholar] [CrossRef]
- Ota, M.; Yamazawa, H. Forest floor CO2 flux estimated from soil CO2 and radon concentrations. Atmos. Environ. 2010, 44, 4529–4535. [Google Scholar] [CrossRef]
- Jacinthe, P.A. Carbon dioxide and methane fluxes in variably-flooded riparian forests. Geoderma 2015, 241–242, 41–50. [Google Scholar] [CrossRef]
- Nkongolo, N.V.; Hatano, R.; Kakembo, V. Diffusivity Models and Greenhouse Gases Fluxes from a Forest, Pasture, Grassland and Corn Field in Northern Hokkaido, Japan. Pedosphere 2010, 20, 747–760. [Google Scholar] [CrossRef]
- Schwen, A.; Jeitler, E.; Böttcher, J. Spatial and temporal variability of soil gas diffusivity, its scaling and relevance for soil respiration under different tillage. Geoderma 2015, 259–260, 323–336. [Google Scholar] [CrossRef]
- Bosco, S.; Volpi, I.; Antichi, D.; Ragaglini, G.; Frasconi, C. Greenhouse gas emissions from soil cultivated with vegetables in crop rotation under integrated, organic and organic conservation management in a Mediterranean environment. Agronomy 2019, 9, 446. [Google Scholar] [CrossRef]
- Raich, J.W.; Potter, C.S.; Bhagawati, D. Interannual variability in global soil respiration 1980–94. Glob. Chang. Biol. 2002, 8, 800–812. [Google Scholar] [CrossRef]
- Guttières, R.; Nunan, N.; Raynaud, X.; Lacroix, G.; Barot, S.; Barré, P.; Girardin, C.; Guenet, B.; Lata, J.-C.; Abbadie, L. Temperature and soil management effects on carbon fluxes and priming effect intensity. Soil Biol. Biochem. 2021, 153, 108103. [Google Scholar] [CrossRef]
- Curtin, D.; Wang, H.; Selles, F.; McConkey, B.G.; Campbell, C.A. Tillage Effects on Carbon Fluxes in Continuous Wheat and Fallow-Wheat Rotations. Soil Sci. Soc. Am. J. 2000, 64, 2080–2086. [Google Scholar] [CrossRef]
- Yao, Z.; Wolf, B.; Chen, W.; Butterbach-Bahl, K.; Brüggemann, N.; Wiesmeier, M.; Dannenmann, M.; Blank, B.; Zheng, X. Spatial variability of N2O, CH4 and CO2 fluxes within the Xilin River catchment of Inner Mongolia, China: A soil core study. Plant Soil 2010, 331, 341–359. [Google Scholar] [CrossRef]
- Gonsiorkiewicz Rigon, J.P.; Calonego, J.C.; Rosolem, C.A.; La Scala, N., Jr. Cover crop rotations in no-till system: Short-term CO2 emissions and soybean yield. Sci. Agric. 2018, 75, 18–26. [Google Scholar] [CrossRef]
- Abdalla, M.; Hastings, A.; Cheng, K.; Yue, Q.; Chadwick, D.; Espenberg, M.; Truu, J.; Rees, R.M.; Smith, P. A critical review of the impacts of cover crops on nitrogen leaching, net greenhouse gas balance and crop productivity. Glob. Chang. Biol. 2019, 25, 2530–2543. [Google Scholar] [CrossRef]
- Rahman, M.A.; Moser, A.; Rötzer, T.; Pauleit, S. Microclimatic differences and their influence on transpirational cooling of Tilia cordata in two contrasting street canyons in Munich, Germany. Agric. For. Meteorol. 2017, 232, 443–456. [Google Scholar] [CrossRef]
- Davidson, E.A.; Janssen, I.A.; Luo, Y. On the variability of respiration in terrestrial ecosystems: Moving beyond Q10. Glob. Chang. Biol. 2006, 12, 154–164. [Google Scholar] [CrossRef]
- Martins, C.S.C.; Nazaries, L.; Delgado-Baquerizo, M.; Macdonald, C.A.; Anderson, I.C.; Hobbie, S.E.; Venterea, R.T.; Reich, P.B.; Singh, B.K. Identifying environmental drivers of greenhouse gas emissions under warming and reduced rainfall in boreal–temperate forests. Funct. Ecol. 2017, 31, 2356–2368. [Google Scholar] [CrossRef]
- Juhász, C.; Huzsvai, L.; Kovács, E.; Kovács, G.; Tuba, G.; Sinka, L.; Zsembeli, J. Carbon Dioxide Efflux of Bare Soil as a Function of Soil Temperature and Moisture Content under Weather Conditions of Warm, Temperate, Dry Climate Zone. Agronomy 2022, 12, 3050. [Google Scholar] [CrossRef]
- Mcknight, J.Y.; Harden, C.P.; Schaeffer, S.M. Soil CO2 flux trends with differences in soil moisture among four types of land use in an Ecuadorian páramo landscape. Phys. Geogr. 2016, 38, 51–61. [Google Scholar] [CrossRef]
Figure 1.
Location of the study sites.

Figure 2.
Maximum, mean and minimum monthly temperatures (°C) and monthly accumulated precipitation (mm) for both sites during the study period.
Figure 2.
Maximum, mean and minimum monthly temperatures (°C) and monthly accumulated precipitation (mm) for both sites during the study period.
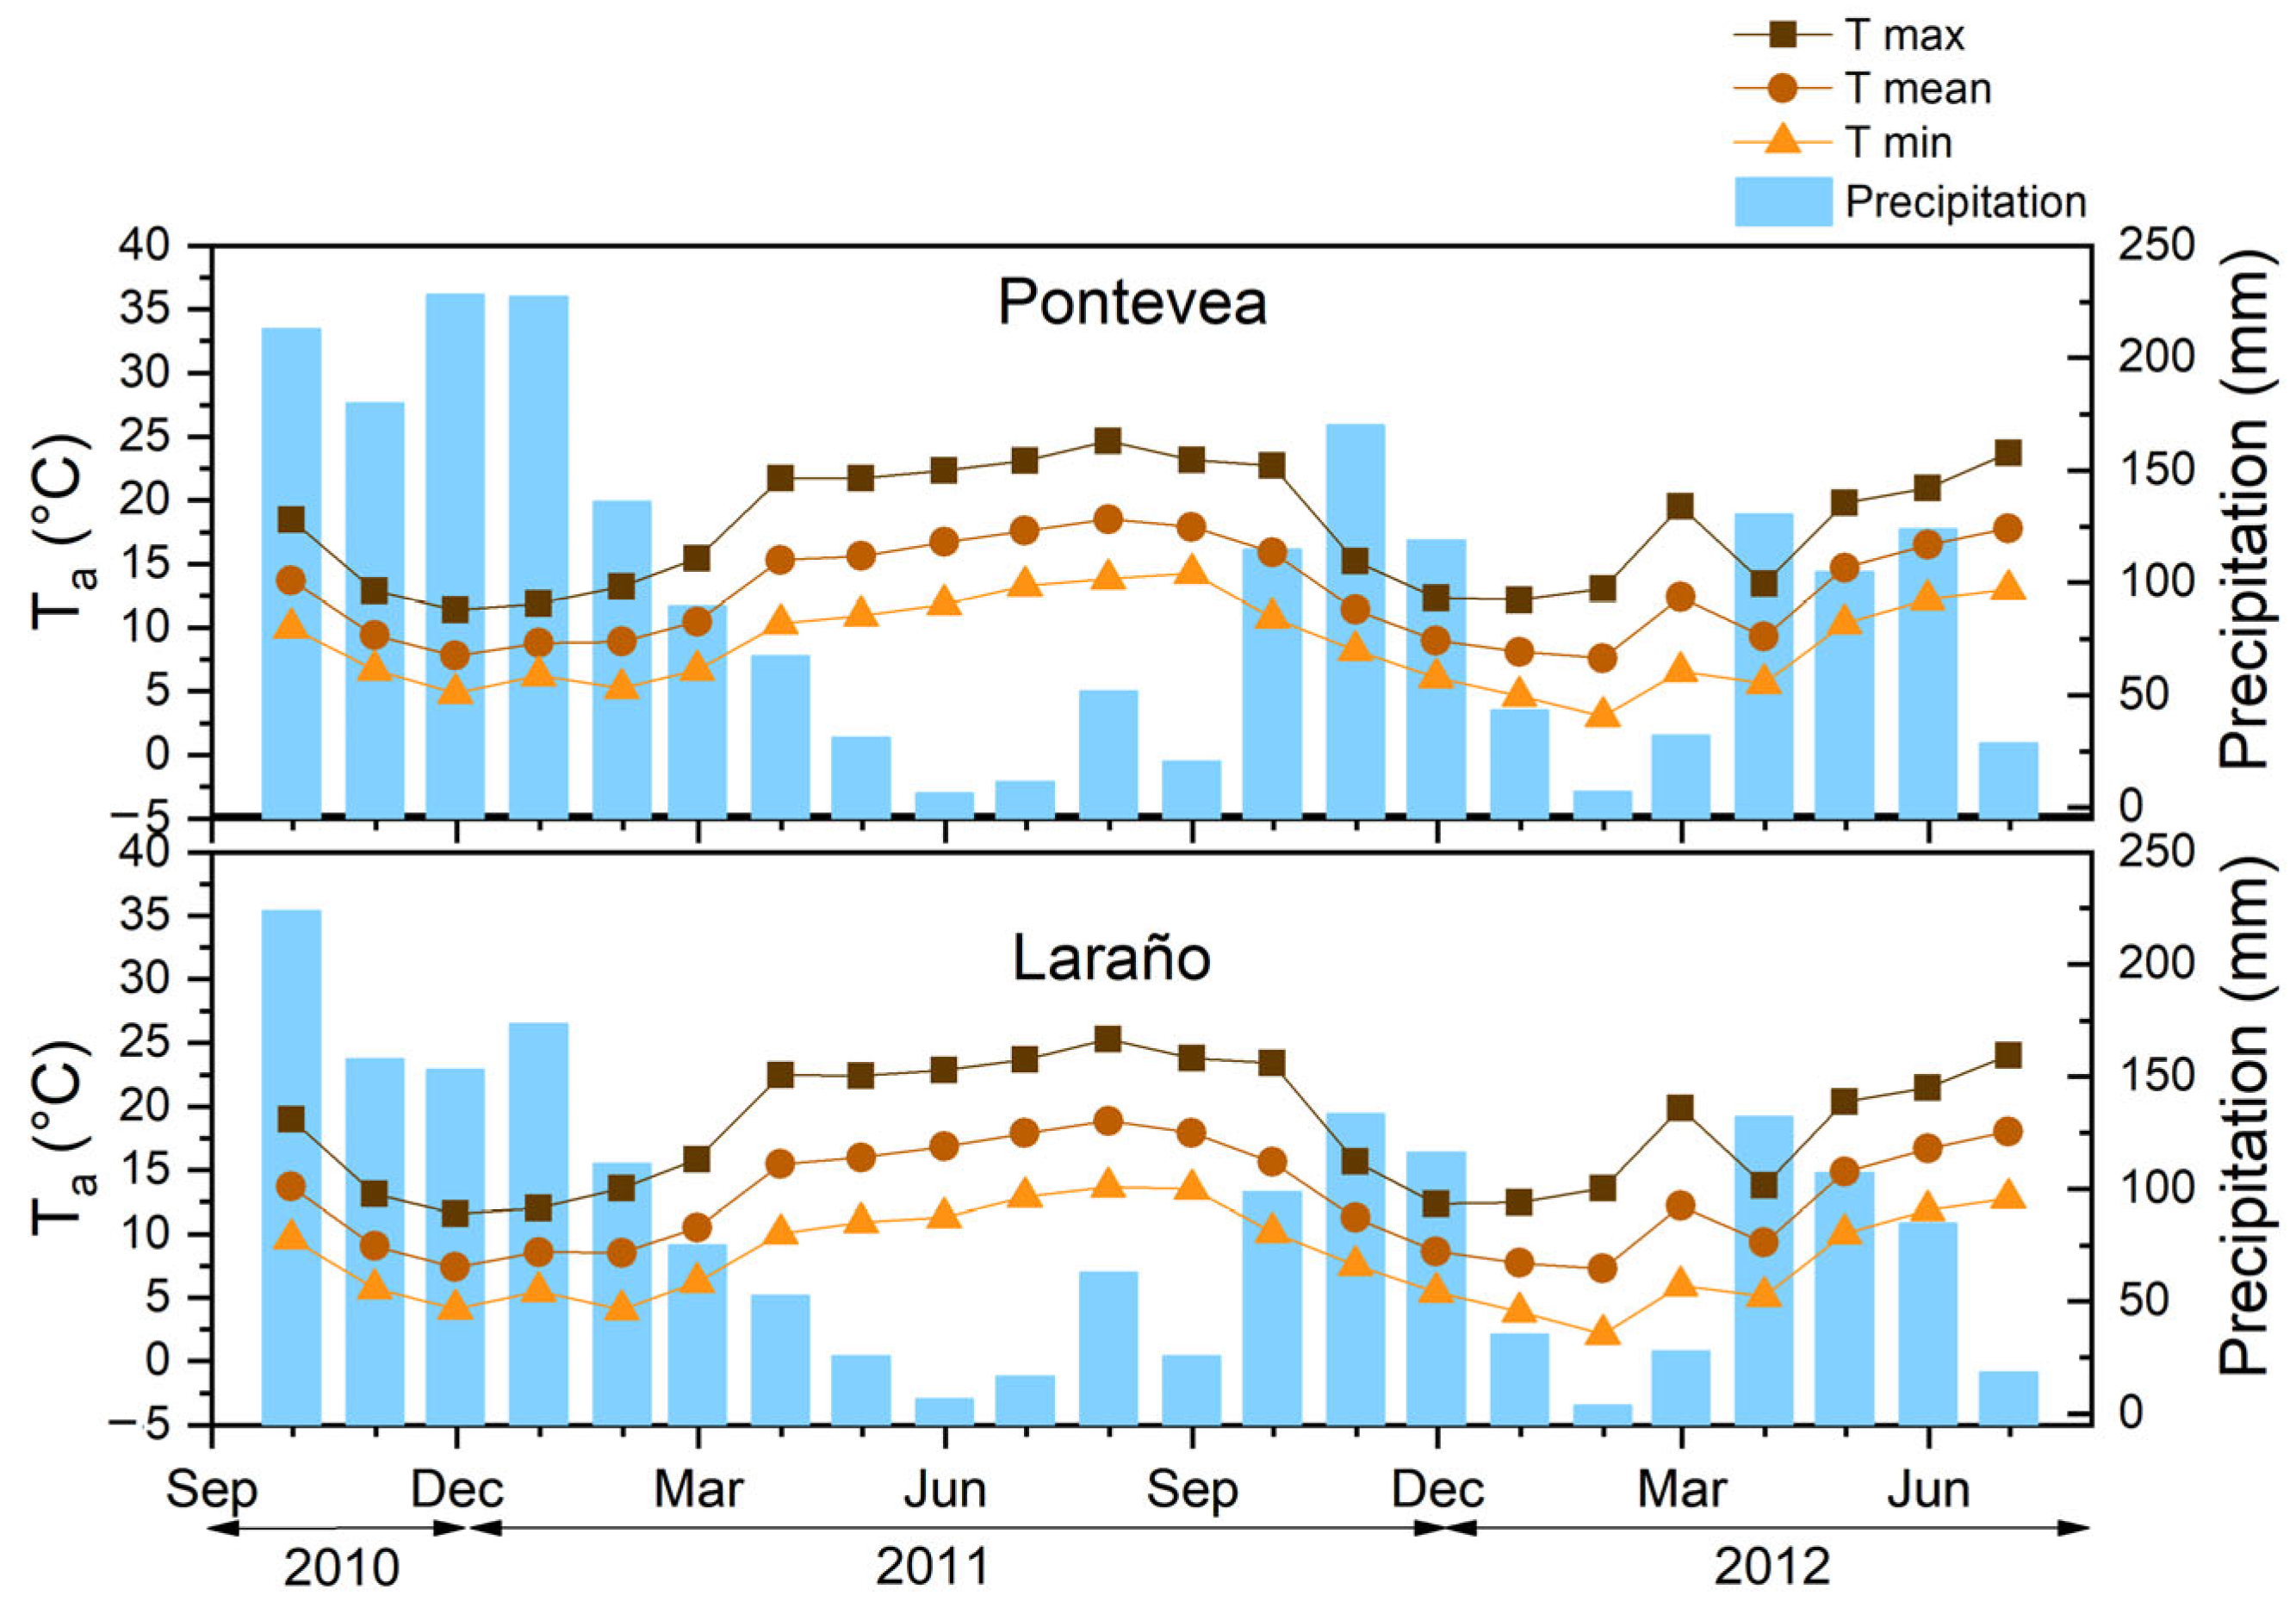
Figure 3.
Monthly average SR (g CO2 m−2 h−1) throughout the whole study period. Error bars indicate standard deviations: (a) Pontevea site, AF-P: afforested plot, CT-P: cropped plot. (b) Laraño site: AF-P: afforested plot, CT-P: cropped plot. Solid arrows indicate the date of fertilizer addition. Dashed arrows indicate the times when the undergrowth was cut. Black squares indicate the time at which the grass was cut in CT-L. * Indicates sowing times.

Figure 4.
Mean SR rates (g CO2 m−2 h−1) in each plot throughout the study period. For the cropped plots, the values are grouped according to the type of plant cover in each period (blue: Pontevea, orange: Laraño).
Figure 4.
Mean SR rates (g CO2 m−2 h−1) in each plot throughout the study period. For the cropped plots, the values are grouped according to the type of plant cover in each period (blue: Pontevea, orange: Laraño).

Figure 5.
Net CO2 emissions from afforested soils in both study sites. Error bars indicate the standard deviations (obtained from the standard deviation of the SR monthly average).
Figure 5.
Net CO2 emissions from afforested soils in both study sites. Error bars indicate the standard deviations (obtained from the standard deviation of the SR monthly average).
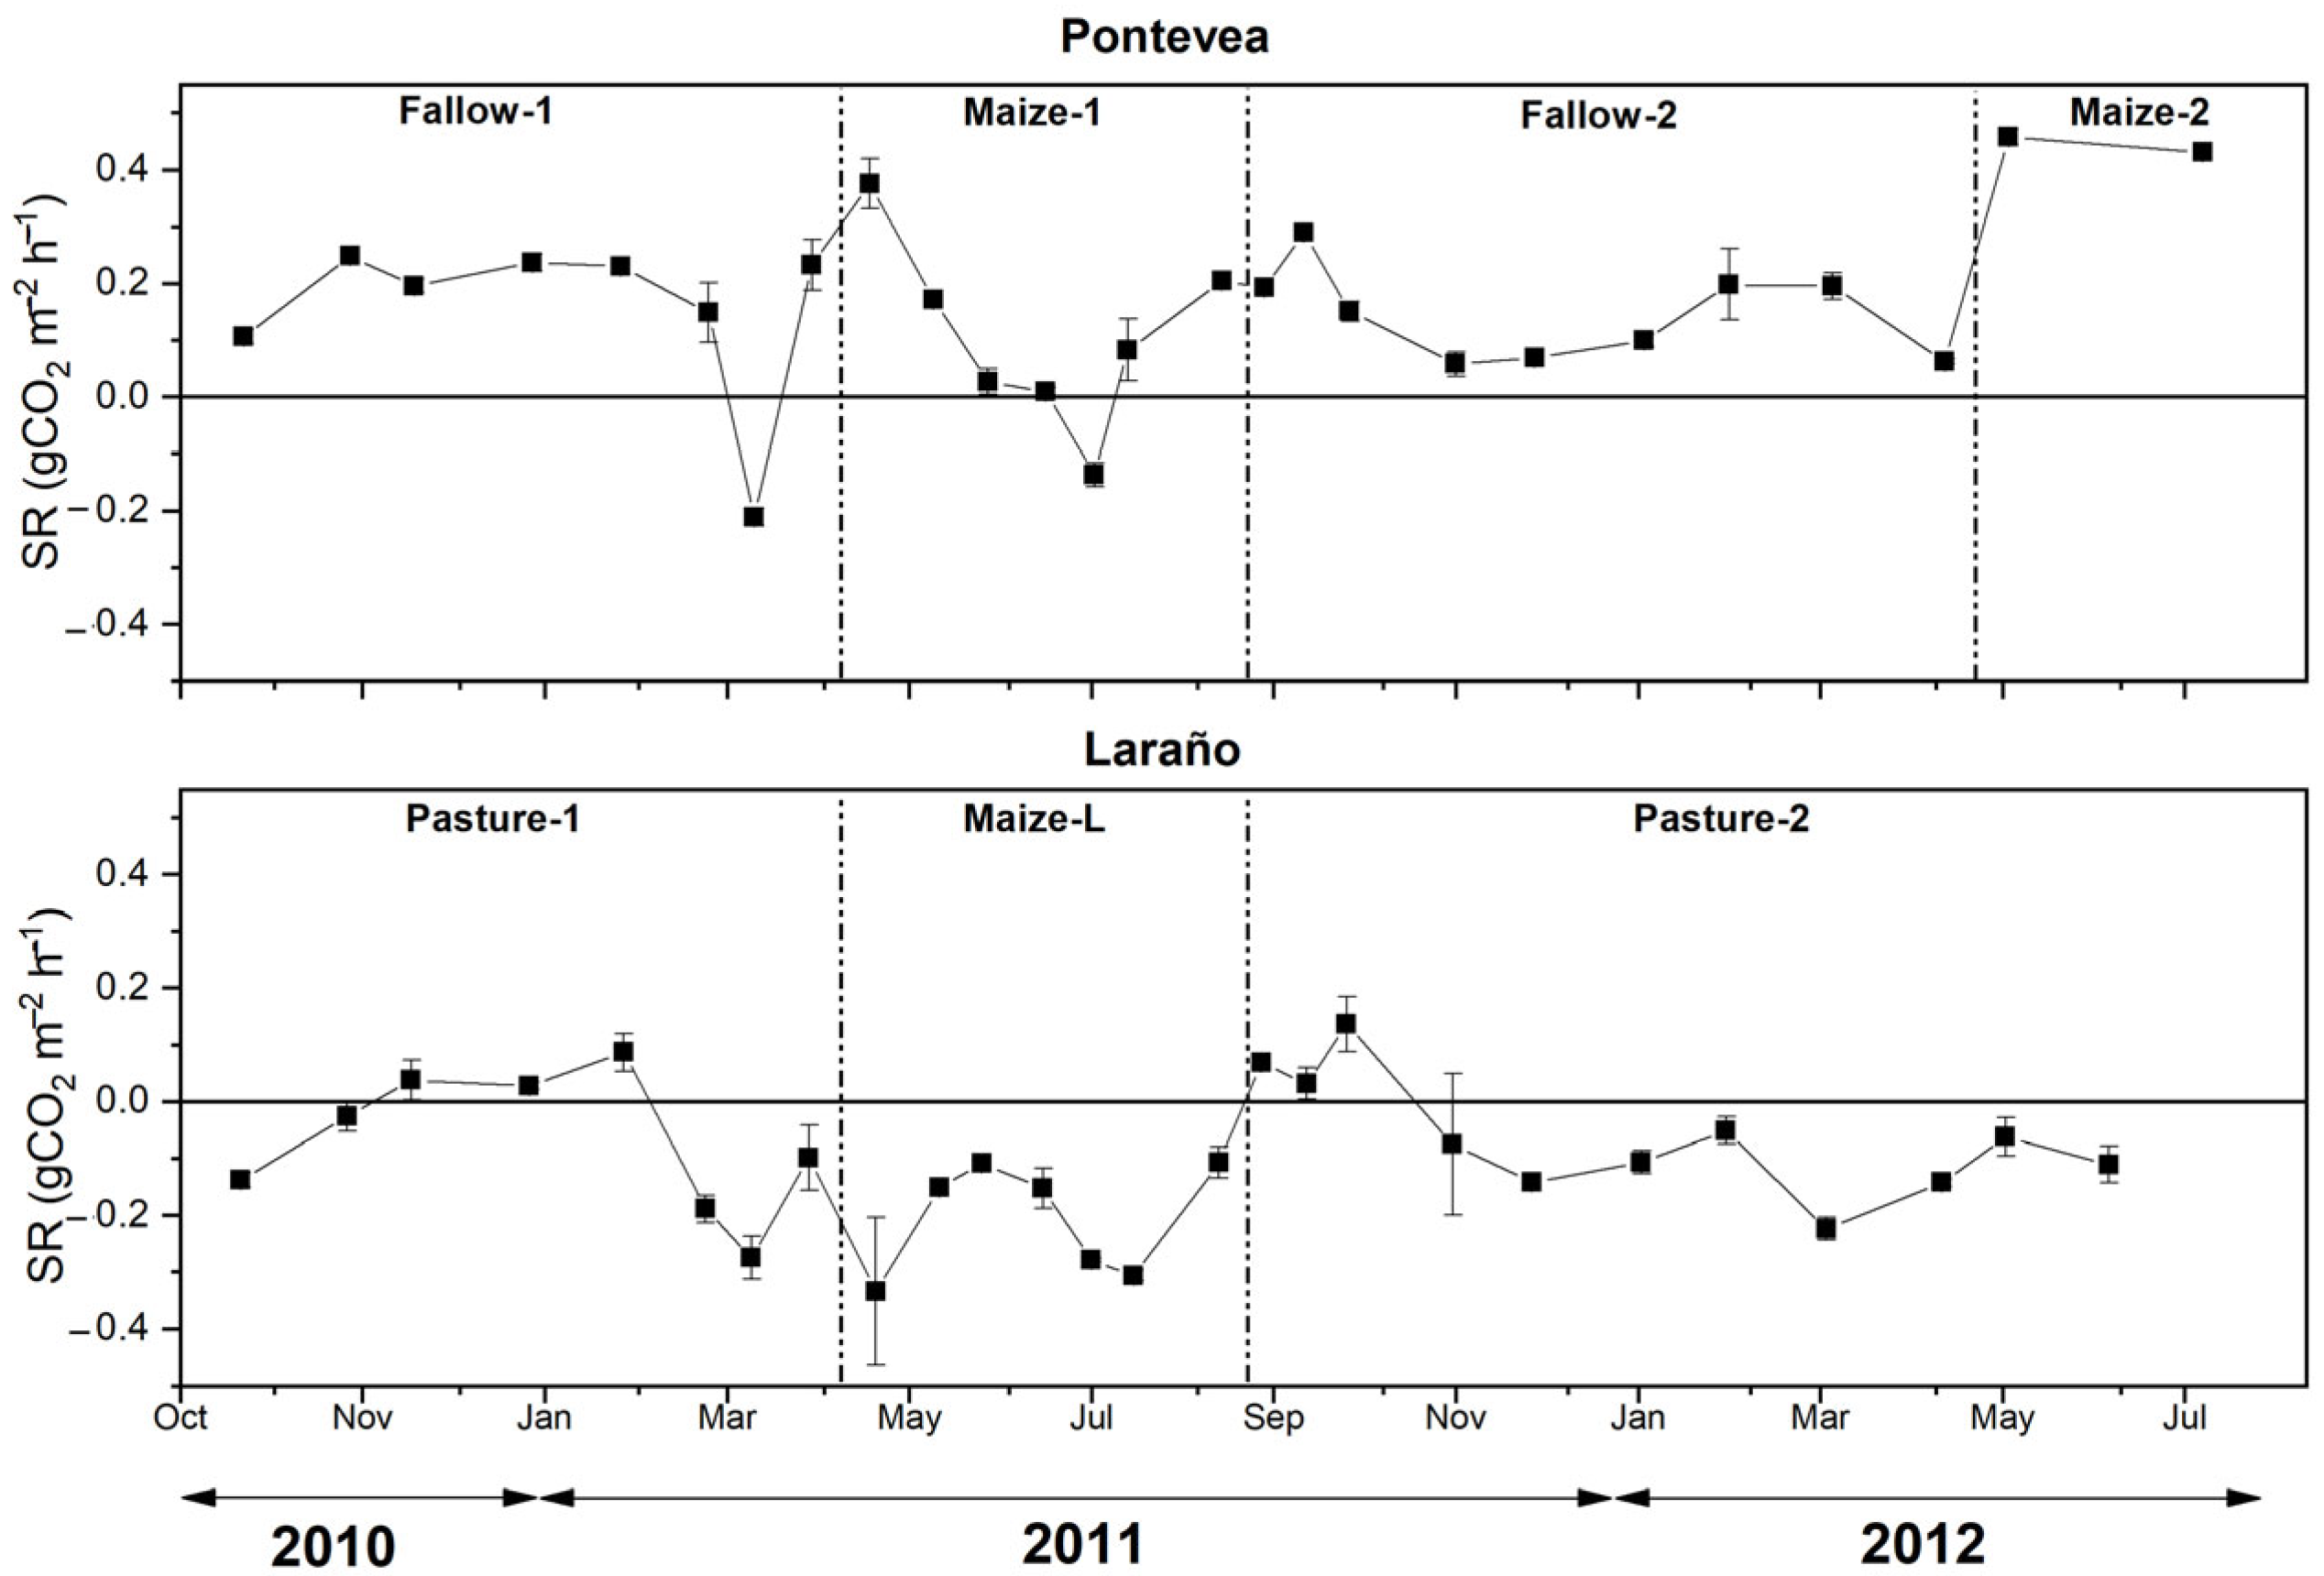
Figure 6.
Percentage variations in respiration in afforested soils relative to the respective cropped soils for each of the different periods of cultivation considered.
Figure 6.
Percentage variations in respiration in afforested soils relative to the respective cropped soils for each of the different periods of cultivation considered.

Figure 7.
Mean monthly soil temperature (°C) and soil water content as a percentage of the field capacity (W/FC, %) in both sites during the whole study period. Error bars indicate standard deviations: AF-P: afforested plot in Pontevea; CT-P: cropped plot in Pontevea; AF-L: afforested plot in Laraño; CT-L: cropped plot in Laraño.

Figure 8.
Pearson’s correlation coefficients between SR and soil variables: Ts—soil temperature, W/FC—soil water content as the proportion of the field capacity, WFPS—water-filled pore space (percentage).
Figure 8.
Pearson’s correlation coefficients between SR and soil variables: Ts—soil temperature, W/FC—soil water content as the proportion of the field capacity, WFPS—water-filled pore space (percentage).

Figure 9.
Linear correlations between SR and W/FC. (a) Linear relationships in CT-L when the soil was under pasture (Pasture 1) and when it was under maize. (b) Negative linear relationship established in AF-L. (c) Linear relationship in CT-P when the soil was under fallow (Fallow-1) and when it was under maize. (d) Negative linear relationship in AF-P. Data points (shown in green) within the circle were excluded from the analysis. (* p < 0.05; ** p < 0.01, *** p < 0.001).

Figure 10.
Relationship between the variation in SR (%) in the afforested soils relative to the value for their respective cropped soils and the variation (%) in the soil parameters (Ct, labile C and Nt) caused by the afforestation (* p < 0.05, *** p < 0.001).
Figure 10.
Relationship between the variation in SR (%) in the afforested soils relative to the value for their respective cropped soils and the variation (%) in the soil parameters (Ct, labile C and Nt) caused by the afforestation (* p < 0.05, *** p < 0.001).

Table 1.
Main soil physicochemical properties (0–10 cm) in the soils in afforested and agricultural plots in both study sites. Maximum, minimum and mean (±standard deviation, SD) values determined throughout the study period. Different letters indicate significant differences in mean values between pairs of plots (p < 0.05).
| Crop Soil | Afforested Soil | |||||||
|---|---|---|---|---|---|---|---|---|
| Min | Max | Mean ± SD | %CV | Min | Max | Mean ± SD | %CV | |
| PONTEVEA SOIL | ||||||||
| pH H2O | 5.08 | 5.62 | 5.33 ± 0.18 A | 3.3 | 5.26 | 5.46 | 5.40 ± 0.07 A | 1.32 |
| pH KCl | 4.32 | 4.46 | 4.38 ± 0.05 A | 1.1 | 4.27 | 4.45 | 4.33 ± 0.07 A | 1.6 |
| TOTAL C (%) | 1.44 | 1.99 | 1.69 ± 0.18 A | 10.6 | 2.4 | 3.26 | 2.75 ± 0.31 B | 11.1 |
| TOTAL N (%) | 0.14 | 0.16 | 0.15 ± 0.01 A | 5.1 | 0.21 | 0.24 | 0.22 ± 0.01 B | 5.2 |
| C/N | 9 | 14 | 11 ± 2 A | 14.4 | 11 | 15 | 13 ± 1 B | 8.7 |
| LABILE C (mg 100 g−1) | 49 | 70 | 59 ± 8 A | 13.3 | 116 | 177 | 142 ± 25 B | 17.3 |
| BULK DENSITY (g cm−3) | 1.04 ± 0.02 A | 0.95 ± 0.07 B | ||||||
| LARAñO SOIL | ||||||||
| pH H2O | 4.61 | 5.51 | 5.22 ± 0.34 A | 6.6 | 5.81 | 6.07 | 5.95 ± 0.10 B | 1.6 |
| pH KCl | 4.12 | 4.52 | 4.24 ± 0.13 A | 3.2 | 4.76 | 5.06 | 4.89 ± 0.10 B | 2.1 |
| TOTAL C (%) | 2.34 | 2.71 | 2.54 ± 0.12 A | 4.8 | 2.28 | 3.09 | 2.57 ± 0.28 A | 11.0 |
| TOTAL N (%) | 0.2 | 0.23 | 0.22 ± 0.01 A | 4.4 | 0.19 | 0.23 | 0.20 ± 0.02 A | 7.4 |
| C/N | 11 | 13 | 12 ± 1 A | 4.7 | 12 | 14 | 13 ± 1 B | 6.4 |
| LABILE C (mg 100 g−1) | 50 | 139 | 92 ± 27 A | 28.8 | 101 | 134 | 121 ± 12 B | 9.7 |
| BULK DENSITY (g cm−3) | 1.03 ± 0.02 A | 0.96 ± 0.05 B | ||||||
Table 2.
Annual CO2 emissions per unit of total carbon (Ct) (kg CO2 kg−1 Ct).
| Study Plot | Annual CO2 Emissions (kg CO2 kg−1 Ct) | |||
|---|---|---|---|---|
| Vegetation Cover | ||||
| Maize | Fallow | Pasture | ||
| AF-P | 1.95 | - | - | - |
| AF-L | 1.88 | - | - | - |
| CT-P | 2.09 | 2.79 | 1.59 | - |
| CT-L | 2.18 | 2.71 | - | 1.94 |
Disclaimer/Publisher’s Note: The statements, opinions and data contained in all publications are solely those of the individual author(s) and contributor(s) and not of MDPI and/or the editor(s). MDPI and/or the editor(s) disclaim responsibility for any injury to people or property resulting from any ideas, methods, instructions or products referred to in the content. |
© 2023 by the authors. Licensee MDPI, Basel, Switzerland. This article is an open access article distributed under the terms and conditions of the Creative Commons Attribution (CC BY) license (https://creativecommons.org/licenses/by/4.0/).
Share and Cite
MDPI and ACS Style
Priano, M.E.; Zorita, F.; Trasar-Cepeda, C. Legacy of Prior Management of Cropland after Afforestation with Populus x euroamericana (Dode) Guinier: Effects on Soil Respiration. Forests 2023, 14, 1048. https://doi.org/10.3390/f14051048
AMA Style
Priano ME, Zorita F, Trasar-Cepeda C. Legacy of Prior Management of Cropland after Afforestation with Populus x euroamericana (Dode) Guinier: Effects on Soil Respiration. Forests. 2023; 14(5):1048. https://doi.org/10.3390/f14051048
Chicago/Turabian StylePriano, María Eugenia, Félix Zorita, and Carmen Trasar-Cepeda. 2023. "Legacy of Prior Management of Cropland after Afforestation with Populus x euroamericana (Dode) Guinier: Effects on Soil Respiration" Forests 14, no. 5: 1048. https://doi.org/10.3390/f14051048
Note that from the first issue of 2016, this journal uses article numbers instead of page numbers. See further details here.