Article

A Re-Inventory after 12 Years—Increase in Red Wood Ant Nests and Woodpecker Cavities in Nests in the West Eifel Volcanic Field despite Climatic Changes

by
Gabriele M. Berberich
1,* and
Martin B. Berberich
2
1
Wissenschaftlich-Technisches Redaktionsbüro Dr. Berberich, Am Plexer 7, D-50374 Erftstadt, Germany
2
IT-Consulting Berberich, Am Plexer 7, D-50374 Erftstadt, Germany
*
Author to whom correspondence should be addressed.
Forests 2023, 14(5), 985; https://doi.org/10.3390/f14050985
Submission received: 2 March 2023 / Revised: 13 April 2023 / Accepted: 8 May 2023 / Published: 10 May 2023
(This article belongs to the Special Issue Forest Health: Forest Insect Population Dynamics)

Abstract

:
We re-inventoried red wood ant nests (RWA) in 12 study sites (≈1281 ha) in the tectonically active Westeifel Volcanic Field, Germany, in an area-wide and integrated ecosystem approach after 12 years. Combined with the re-identification of previously mapped nests using a photo database, this approach leads to more accurate nest counts in (re)inventories. A total increase in nests from 1144 (2009) to 1252 (2021), and a dramatic one for the Heidberg site by 52-fold (2009) and 85-fold (2021) compared to a 1984 inventory was observed, contrasting with earlier postulations of a decline in RWA. Early to medium mature (41–80 years) and mature (≥81–140 years) spruce forests were the preferred habitat. A large increase in small-sized nests suggests an increase in new nest settlements also in clearings, despite climate-induced forest dieback over the past decade. A decline in biodiversity in the herbaceous layer was observed; highly proliferating blackberries had no negative impact on RWA nests. Monitoring of woodpecker cavities in RWA nests is suggested as an indirect indicator tool for evaluating populations in forests. Positive ground movement rates caused by the Eifel plume are suggested as another factor favoring nest settlements, especially in NE-SW and WNW-ESE directions. This study contributes to the urgent need for updating the statistical data required to (a) effectively substantiate the status quo of RWA occurrences, (b) protect RWA as ecosystem engineers, (c) advance understanding of GeoBio-Interactions in the wake of climate change, and (d) contribute to the German government’s Insect Conservation Action Program.

1. Introduction

Recent studies suggest plate tectonics as a fundamental driver of global biodiversity in marine and terrestrial ecosystems (e.g., [1]). Understanding these processes is critical to ecology and biology. Insects are the world’s most diverse group of animals and are essential to the functioning of terrestrial ecosystems. This is especially true for red wood ants (Formica rufa-group; hereafter RWA), a key ecological group of species (e.g., [2]). Their interactions with the environment are most diverse, e.g., contributing to forest habitat biodiversity (e.g., [3]), controlling of undesirable insects (e.g., [4]), and indicating undetected tectonic activity and geogenic gases (“GeoBio-Interactions”) that play a critical role in their settlement (e.g., [5,6,7,8,9,10,11,12,13,14]).
Recent works report declines in insect diversity, species, and biomass in Europe due to habitat loss and fragmentation, pollution, climate change, or invasive species (e.g., [15,16]). For RWA, some researchers suggest declines (e.g., [17,18]), while others report population increases (e.g., [19,20]). A decline in RWA populations is also postulated for Germany [21]. Therefore, RWA are considered of conservation concern in Germany and are included in the German government’s Insect Conservation Action Program [22,23,24].
However, a reliable, statistically valid database for Germany on the distribution of RWA nests and species to substantiate the postulated threats and declines is completely lacking so far, as a standardized and systematic monitoring of RWA has been discontinued since the 1980s.
Therefore, no statements about a much-needed protection status can be made at present. In this re-inventory study, conducted after 12 years in the tectonically active Westeifel Volcanic Field (WEVF), we applied our standardized and integrated mapping approach for RWA which not only counts the number of RWA nests, but records the coordinates of their location and monitors the entire ecosystem around an RWA nest, e.g., tree species, tree age, and herb layer [6]. For a comparative analysis of RWA population dynamics [10], 12 study sites (total ≈1281 ha) were selected that had to meet the following criteria: (a) more than 20 nests in 2009 [14], (b) well-defined study site boundaries, and (c) location within and on the edges of the WEVF.
We investigated forest–tectonic interactions by asking five interrelated questions: (1) What are the requirements for reliable, science-based, standardized, and statistically valid re-inventories of RWA nests? (2) Are the number of RWA nests and their physical nest parameters decreasing or increasing in the study sites compared to the 2009 inventory? (3) What influence do variable factors (e.g., forest stand type and composition, tree age, clearings, and herbaceous layer) have on potential changes in nest numbers? (4) Are there other biological influences on RWA nests such as woodpeckers?, and (5) What influence do quasi-invariant factors, such as ground movement or Radon concentrations have on RWA nest distribution (GeoBio-Interactions)? We asked these questions specifically with respect to individual RWA nests. These results will further improve the understanding of the “GeoBio-Interactions”, contribute to better protection of RWA in forest management in the WEVF, and contribute to the German government’s Insect Conservation Action Program.

2. Materials and Methods

2.1. Location and Geologic Setting

The 12 forested study sites, Duppach (01-Dup); Dockweiler Wald (02-Doc), Oberehe (03-Obe), Samersbach (04-Sam), Neunkirchen/Oberstadtfeld (05-Neu), Marschbachtal (06-Mar), Salm (07-Sal), Berndorf (08-Ber), Lissendorf (09-Lis), Heidberg (10-Hei), Vierherrenstein (11-Vie), and Rockeskyll (12-Roc) were located around and within the volcanic center of the Quaternary WEVF (Figure 1), which is part of one of the youngest and most active volcanic regions in Europe [25]. The Paleozoic basement consists of Lower Devonian and Triassic sedimentary rocks and Neogene and Quaternary volcanic rocks. Ongoing geotectonic processes, such as uplift caused by the active magma reservoir (“Eifel plume”) in the lithospheric mantle and the present-day NW–SE-directed compressive stress field influence the regional tectonics and geochemistry of the NW-SE directed volcanic field [14]. The site locations are about ≈100 km away from Cologne, North-Rhine-Westphalia (NRW), and ≈60 km from Koblenz (Rhineland-Palatinate, RLP), West Germany and were part of the PhD thesis of the first author [14]. The hilly landscape (350–650 m a.s.l.) is characterized by individual ridges, cinder cones, and basalt domes as well as deep valleys, and cut by rivers such as river Kyll. The forest, with an area share of almost 50%, is the economically most important sector, followed by the agricultural sector (42%). The annual average temperatures range from −1.5 °C to 14 °C [26].

2.2. Forest Owners

The study sites are part of five forest districts (FD) in RLP and NRW: FD Prüm, FD Gerolstein, FA Daun, FD Hillesheim, and FD Gemeindeforstamt Dahlem. The State (SF), municipal communities in RLP and NRW (MF), and private persons (PF) hold portions of the forest. In accordance with the five forest districts, the medium tree age class was chosen for all analyses.

2.3. Standardized, Integrated Mapping Approach and Data Collection

Mapping of RWA nests followed the area-wide, systematic, reproducible, and integrated approach developed by Berberich et al. [6,14]. A total of ≈1281 ha were mapped in two inventory campaigns, in 2009 and 2021. The total number of RWA nests (ntot) was mapped in all 12 study sites using GPS receivers (Garmin 60CSx and 62S). Random sampling of RWA species in the field revealed that mainly F. polyctena and F. pratensis were identified, because F. rufa and F. polyctena are not easily distinguished without binoculars. Six nest height classes (NH; start-ups: 0.01–0.10 m, short: 0.11–0.50 m, medium: 0.51–1.00 m, tall: 1.01–1.50 m, very tall: 1.51–2.00 m, extra tall: >2.01 m), five diameter classes (ND; small: 0.01–0.50 m, medium: 0.51–1.00 m, large: 1.01–1.50 m, very large: 1.51–2.00 m, extra-large > 2.01 m), inactive (ninact; nest structures were still present but no ant activity was observed during the inventory; therefore, the nest was considered dead) and active nests (nact), and the nest location (e.g., within the forest, forest roads, forest edges, open areas), were classified in the field. In addition, qualitative information on tree species (e.g., spruce, pine) and herbaceous layer (e.g., nettles, grass, blackberry) on and around the RWA nest was recorded. Furthermore, cavities created by woodpeckers in each nest (WpC) were counted in the field. Finally, at least two photographs (landscape and normal format) were taken of each nest. These photographs were used to compare and (re)-identify (a) nests, (b) forest composition, and (c) herbaceous layer mapped in 2009 and 2021.

2.4. Definition of Variable Site Factors

In this study, we applied similar variable factors as in a previous study [6] that are influenced in a short time frame: (1) total number of nests (ntot), (2) number of active nests (nact), (3) number of inactive nests (ninact), (4) NH, (5) ND, (6) nest location, (7) primary tree species (TSprime), (8) secondary tree species (TSsec), (9) medium tree age classes, (10) herbaceous layer, (11) spatial distribution of RWA nests, (12) woodpecker cavities (WpC), and (13) clearing plots. Forest information on ownership type (SF; MF; PF) and medium tree age (mTA) was taken from the most recent forest inventories and management plans of the different forest offices, which contain five general tree age classes: newly planted (<20 years), young (21–40 years), early mature (41–60 years), medium mature (61–80 years), mature (≥81–140 years).

2.5. Data Analysis

MATLAB R2019b and the geographic information system ArcGIS 10.8.2 were used for analyses. To investigate whether RWA nests were evenly or randomly distributed or clustered, point distribution statistics (X2–test) was applied. Patterns of multiple dependent variable factors were investigated by applying one-way ANOVA, Kruskal–Wallis Test and Multivariate ANalysis Of VAriance (MANOVA). To identify differences in the qualitative text-based data set of the herbaceous layer and to visualize the results, word frequency analysis and font colors were applied. The bigger and more pronounced or bolder a word is, the more significant it is in the word cloud.

3. Results

In both inventories, RWA nests were spatially clustered, as indicated by a nearest neighbor ratio < 1 (2009: 0.4; 2021: 0.3) and Z-statistic −1.96 (2009: −11.03; 2021: −20.12) at the 95% significance level. The returned value of p indicates that Kruskal–Wallis and multiple comparison results for both inventories for physical nest parameters (NH, ND) of active nests, medium tree age (mTA) for TSprime, and woodpecker cavities (WpC) in nests confirmed the null hypothesis that the data for NH-ND, NH-mTA, ND-WpC, ND-mTA, and WpC-mTA come from the same distribution at the 1% significance level and that there is no significant difference between these groups in both inventories (Table 1a). A difference is indicated by a slightly elevated p-value for NH-WpC in the 2021 inventory, suggesting a change in continuous distribution (Table 1b). Results of the MANOVA differ from 2009 to 2021 (Figure 2a) and showed in combination with the grouped scatter plots of the first two canonical variables more separation between groups as well as (a) a shift to smaller NH and ND sizes, (b) a strong increase in WpC, and (c) a shift of mTA to more mature forests in 2021 (Figure 2b).

3.1. Physical Nest Parameters

In both inventories, nest counts differed between active nests (nact) and inactive nests (ninact). In 2009, a total of 1144 nests (ntot) were mapped (nact = 1099; ninact = 45; Figure 3a); in 2021, this number increased to 1252 nests (nact = 1164; ninact = 88; Figure 3b). This is an overall increase of 108 RWA nests (≈10%) in all sites and an increase in active nests of ≈6% in 2021. Eight of 12 study sites showed a significant increase in nest numbers compared to 2009, of which four sites, 05-Neu (98%), 01-Dup and 10-Hei (both 46%), and 12-Roc (45%) had the highest increase; four study sites (02-Doc, 03-Obe, 07-Sal, 09-Lis) showed a decrease (Figure 3; Table 2). The re-inventory in study site 07-Sal could only be carried out incompletely, because due to the hazard situation (snow breakage) in winter 2020/2021, entry to central areas was not allowed. Therefore, it cannot be excluded that the total number of nests was higher, so the decrease in nests in this area must be interpreted with caution.
In total, 342 RWA nests (ntotR) and their forest habitat were re-identified and re-mapped (nactR = 296 nests) using the GPS records and the 2009 photo data base. The number of re-mapped nests varied across the 12 study sites (Figure 3b; Table 2): The highest re-mapped nest numbers (≈40% on average) were found in study sites 11-Vie, 02-Doc, 03-Obe, and 10-Hei. Sites 08-Ber, 04-Sam, 07-Sal, and 05-Neu had the highest increase (≈83% on average) in new nests. On the other hand, the highest nest losses (≈80% on average) were recorded in 07-Sal, 08-Ber and 04-Sam, and 02-Doc. Only active nests (2009: 1099 nact; 2021: 1164 nact) are discussed below.
In 2021, a strong overall shift toward smaller nests was observed, e.g., start-ups and short nests, as ≈65% of nests were recorded in these two height classes (2009: ≈47%), suggesting a surge in new nest foundations. In particular, short nests nearly doubled from ≈34% (2009) to ≈55% (2021). A quarter of the nests were medium-sized in 2021 (2009: ≈30%). In 2021, ≈11% (2009: ≈23%) could be classified as tall and very tall nests (Table 2). The same trend was observed for nest diameters. In 2021, ≈61% could be classified as small and medium diameters (2009: ≈54%). One fifth of all nests showed large diameters in both inventories. In 2021, the largest diameters (≥1.51 m) were also declining (≈17%; 2009: ≈25%).

3.2. Type and Composition of Forest Stands, Tree Age, and Clearing Plots

In 2009, coniferous forest was strongly dominated by spruce (Picea abies; ≈79%) as the primary tree species (TSprime). Mixed conifer stands were characterized by spruce (TSprime) and larch (Lariyx decidua; ≈5%), Douglas-fir (Pseudotsuga menziesii; ≈4%), and pine (Pinus sylvestris; ≈1%). Deciduous trees such as sessile oak (Quercus petraea) and beech (Fagus silvatica) accounted for ≈2% as TSprime, whereas beech (Fagus silvatica) accounted for ≈15% as secondary tree species (TSsec). In 2021, forest compositions changed as the proportion of spruce (≈76% TSprime) and larch (≈3% TSprime) decreased. The proportion of sessile oak and beech as TSsec (≈2%) was also reduced.
In absolute numbers, early mature (41–60 years) spruce-dominated forests (TSprime) were the preferred location for RWA nests (41%) in all study areas. Here, ≈13% of short and ≈14% of medium-sized nests were mapped in 2009. A quarter of all nests were mapped in mature (≥81–140 years) spruce-dominated forests (TSprime), of which ≈9% were short and ≈7% medium nests. In 2021, ≈45% of the RWA nests (≈25% short nests) were mapped in early-to-medium mature spruce forests (41–80 years) and one third in mature forests (≈14% short nests). Deciduous trees, e.g., beech, were not relevant TSprimes as given by the low RWA nest counts. In 2009, percentages of ND classes in early mature forest were similar (≈11%) for small and large diameters. In mature forests, small and medium diameters accounted for ≈13% (2009) and ≈17% (2021), respectively. Forest composition observed in the field differed from forest records, showing a shift from conifer stands such as pure spruce stands (2009: ≈53%; 2021: ≈34%) and spruce–larch stands (2009: ≈3.2%; 2021: ≈1.5%) to naturally regenerated mixed stands consisting of, e.g., spruce–beech (2009: ≈21%; 2021: ≈30%), spruce–oak (2009: ≈2%; 2021: ≈5%).
Overall, clearing activities increased at each site between the two inventories, e.g., due to bark beetle infestation or snow breakage. The size of clearing plots with active RWA nests doubled from 5 ha (2009) to ≈11 ha (2021), but the total number of active nests on these clearing plots quadrupled in 2021 (nactC = 205; 2009: nactC = 51; Table 3), especially for start-ups (≈14%) and short (≈64%) nests, but also for medium nests (≈18%). The greatest clearing activity occurred at four study sites that showed large increases in nest numbers in the clearing plots: 03-Obe (2021: 61; 2009: 26), 04-Sam (2021: 58; 2009: 16), 08-Ber (2021: 29; 2009: 4), and 07-Sal (2021: 17; 2009: 0). Surprisingly, 41 active RWA nests from 2009 were re-identified on current clearing plots: 01-Dup (3), 03-Obe (18), 04-Sam (11); 05-Neu (1), 07-Sal (2), 08-Ber (2), and 09-Lis (4) in 2021. About one third of these nests (nact = 13) were previously mapped in 2009 (03-Obe: 9), 04-Sam (2), and 08-Ber (2) on clearing plots.
The percentages of nest numbers in SF, MF, and PF were almost the same for the three different forest owners in both inventories: SF (≈26%), MF (≈61%), and PF (≈13%; Table 3). In 2009, one third of tall and very tall nests (≥1.01 m) were observed in PF, one-fourth in SF, and one fifth in MF. In 2021, the numbers were lower (PF ≈21%, SF ≈12%, and MF ≈8%). In exchange, the number of nests doubled for short nests in SF, MF, and PF, with the highest increase in MF (≈57%), followed by PF (≈54%) and SF (≈52%; Table 3). At study sites 02-Doc and 09-Lis, losses were highest primarily for short, medium, and tall to very tall nests in MF.
In 2021, ≈71% (2009: ≈76%) of active nests were within forest stands (including forest roads and skid trails), approximately one fifth (2009: ≈8%) were in open space areas (e.g., clearing plots), and ≈11% (2009: ≈15%) were at forest edges.

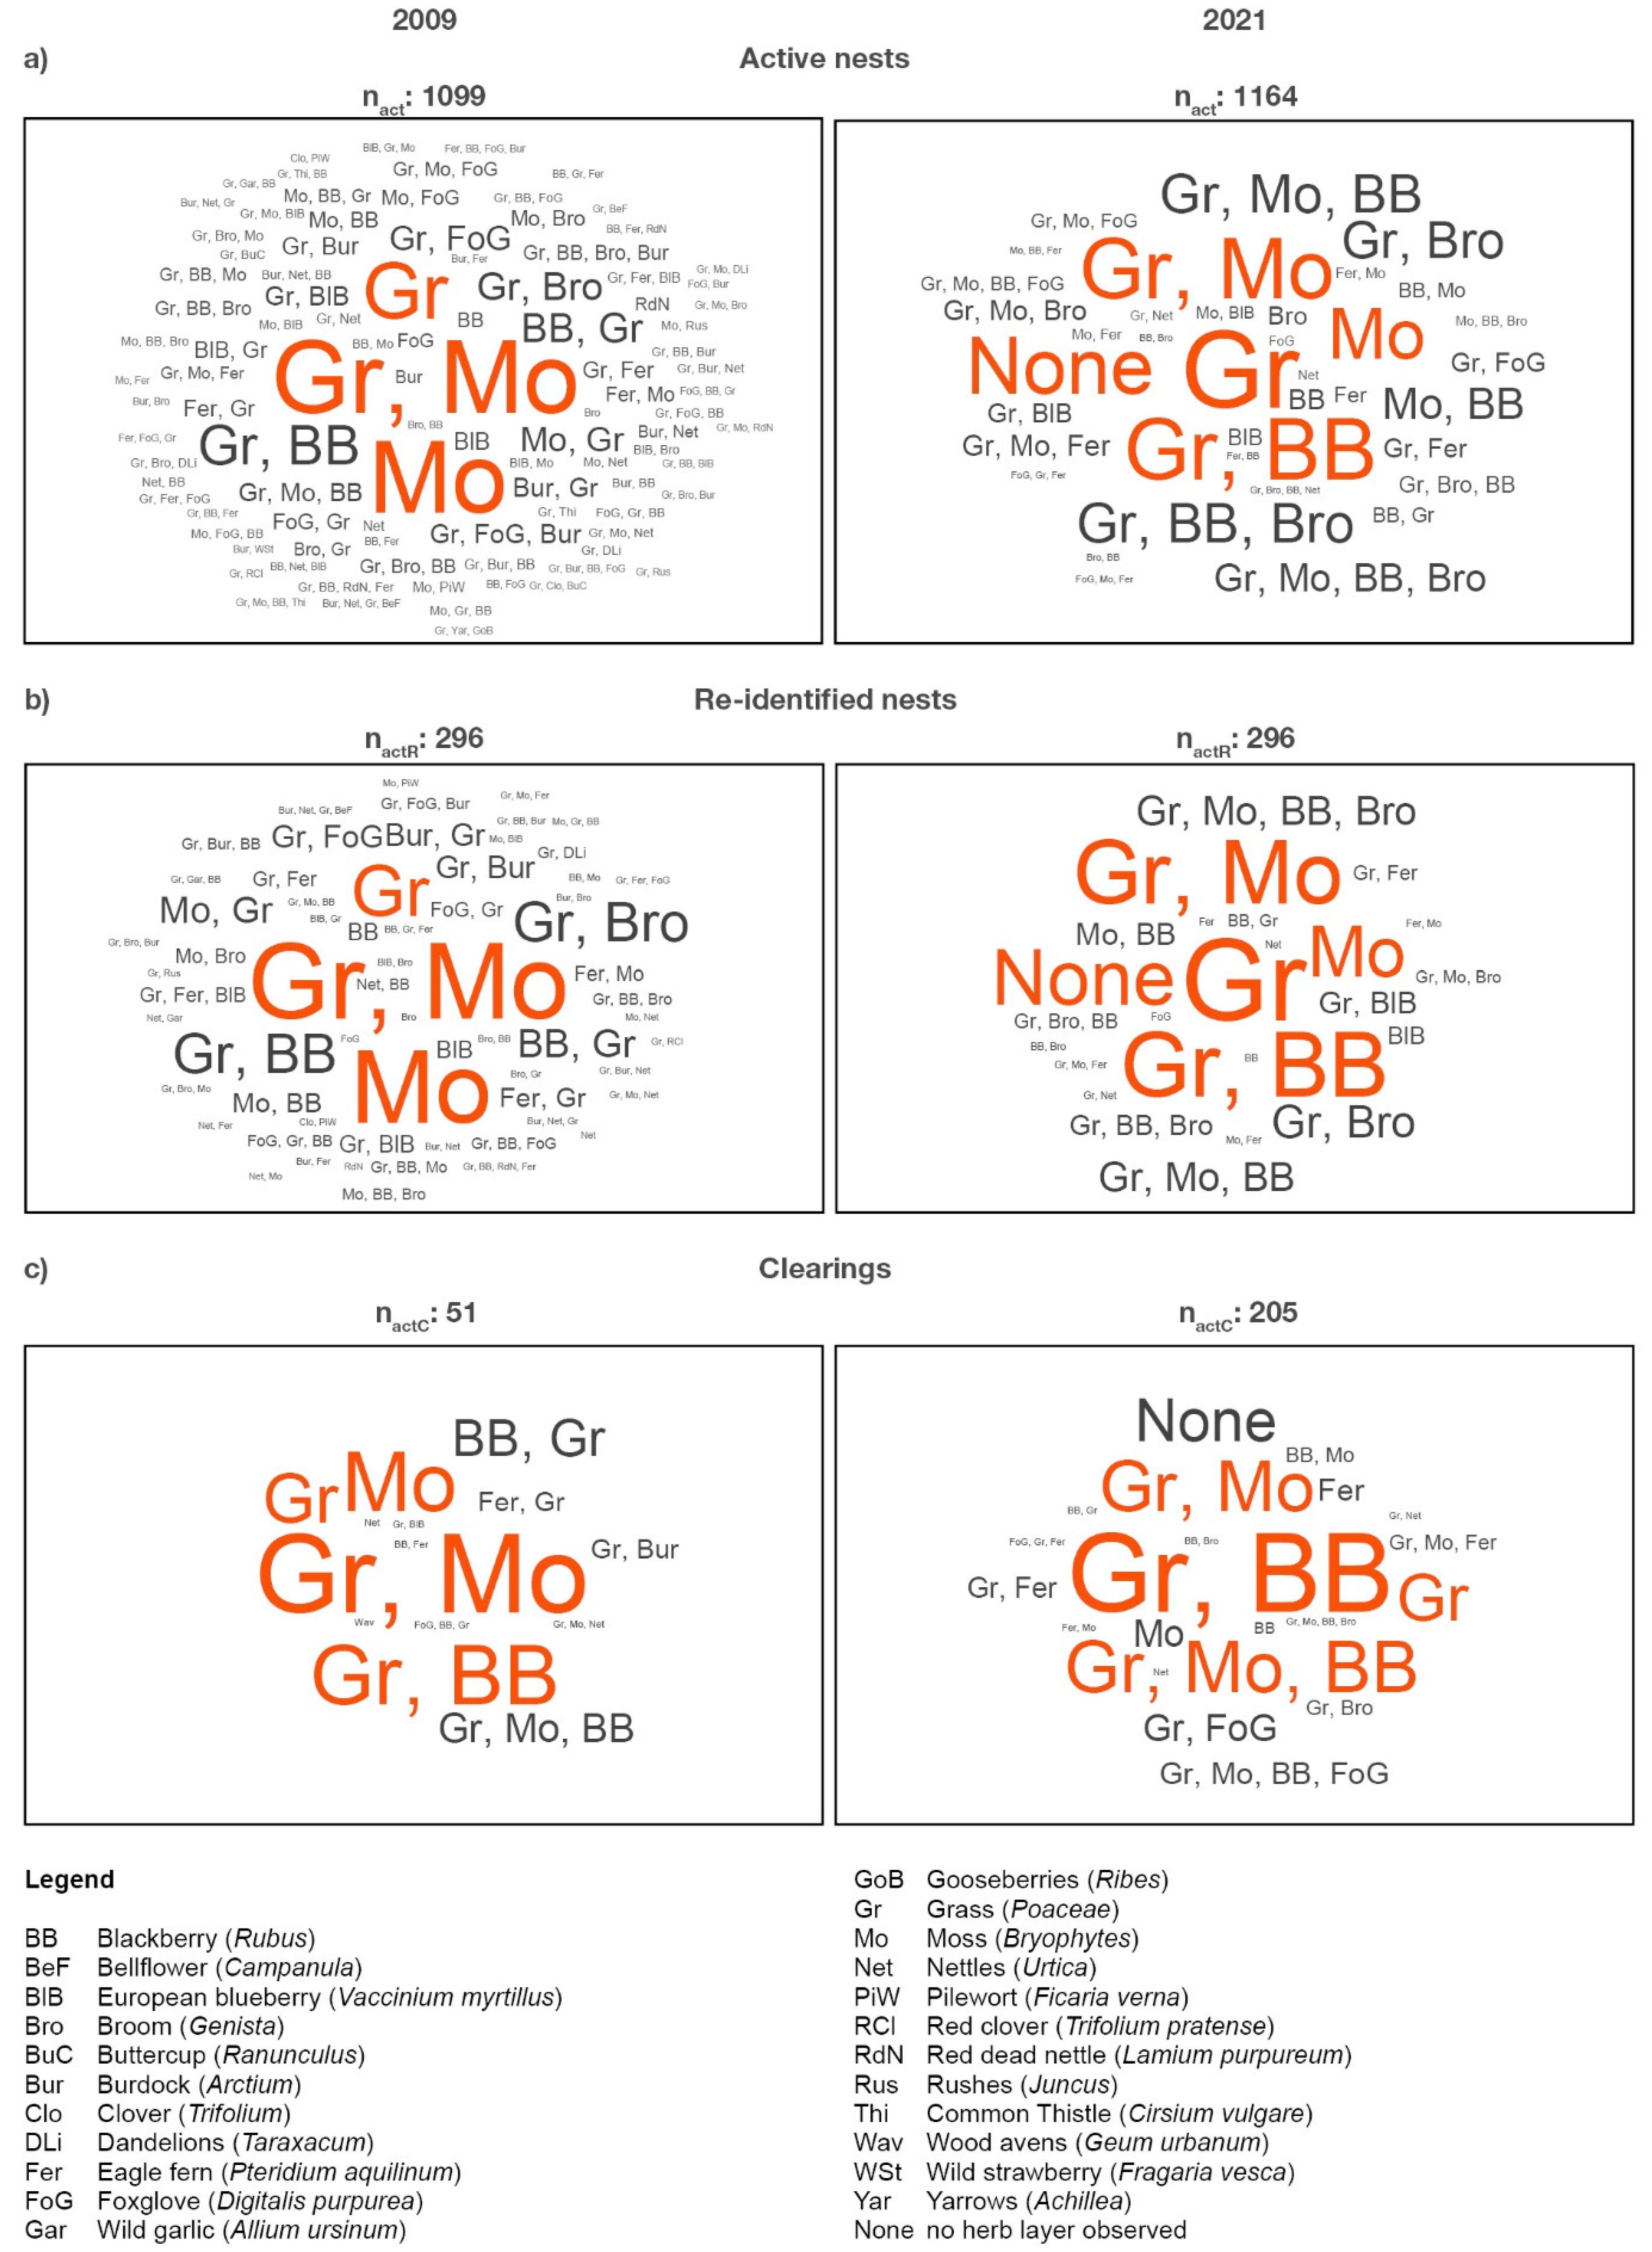
3.3. Herbaceous Layer

In both inventories, single occurrences of grasses (Poaceae) and mosses (Bryophta) or a combination of both herbs were highly abundant as visualized by word clouds in Figure 4a (2009: ≈54%; 2021: ≈45%). The combination of grasses (Poaceae) and blackberries (Rubus) increased from ≈9% (2009) to ≈14% (2021). In addition, the proportion of blackberries in combination with moss, broom (Genista), and other plants, e.g., common thistle (Cirsium vulgare), stinging nettle (Urtica) increased from ≈20% (2009) to ≈31% (2021), indicating a greater distribution of blackberries at and on RWA nests in 2021. In 2009, 196 nests of almost all nest heights (29 start-ups, 68 short, 70 medium sized, 18 tall, and 11 very tall nests) were affected by the proliferating blackberry or blackberry in combination with other herbs. In 2021, the number of these nests doubled (380 nests: 31 start-ups, 208 short, 108 medium-sized, 31 tall, and 2 very tall nests). Other typical plants of the herb layer, such as burdock (Arctium; 2009: ≈8%; 2021: 0%), European blueberry (Vaccinium myrtillus; 2009: ≈6%; 2021: ≈1%), eagle fern (Pteridium aquilinum; 2009: ≈7%; 2021: ≈3%); foxglove (Digitalis purpurea; 2009: ≈6%; 2021: ≈1%) mostly occurred in combination with grasses and mosses; other plants only played a minor role in 2021 due to seasonal influence at some sites (Figure 4a). In 2009, other herbs such as buttercup (Ranunculus), clover (Trifolium), dandelion (Taraxacum), bellflower (Campanula), red dead nettle (Lamium purpureum), wild garlic (Allium ursinum), gooseberries (Ribes), pilewort (Ficaria verna), rushes (Juncus), wood avens (Geum urbanum), wild strawberry (Fragaria vesca), or yarrows (Achillea) could be observed but played a minor role.
The herb layer around and on the 296 re-identified RWA nests showed a similar picture (Figure 4b). Single occurrences of grasses (Poaceae) and mosses (Bryophta) or a combination of both herbs were highly abundant (2009: ≈46%; 2021: ≈49%). The combination of grass, moss, and blackberry increased from ≈8% (2009) to ≈18% (2021), and the combination of grass, moss, and broom doubled from ≈6% (2009) to ≈11% (2021). In 2021, more than one third of the re-identified nests (84 nests) were affected by the proliferating blackberry as single plant or in combination with grass, moss, or broom (6 start-ups, 41 short, 25 medium sized, 11 tall, and 1 very tall nests). Half of the 84 nests were already infested by blackberry in 2009. Other typical plants of the herb layer still observed in 2009 played a minor to no role. The proportion of herb-free plots was ≈11% in 2021 (2009: 0%).
Even in cleared areas (Figure 4c), the proportion of the most dominant herbs (grass, moss, blackberry) increased from ≈60% (2009) to ≈79% (2021). Combinations of these dominant plants with fern and broom accounted for ≈12% in 2021.

3.4. Woodpecker Cavities

Woodpecker cavities (WpC) were observed throughout the nest surface in both inventories. Nest counts (2009: 224 nact; 2021: 634 nact) with WpC and counts of WpC in nest (2009: 699; 2021: 2362) tripled in 2021 compared to 2009 (Table 4). In 2021, less than half of active nests (≈46%) had no woodpecker cavities (2009: ≈80%), and ≈39% (2009: ≈17%) had cavity counts between 1–4. The WpC to nest ratio nearly tripled from 0.6 in 2009 to 2.0 in 2021. In 2021, one fifth (2009: ≈4%) of short nests and ≈12% (2009: ≈7%) of medium-sized nests had one–four cavities. In both inventories, larger nests (tall–extra tall) had fewer cavities than smaller nests (Table 5). In 2009, seven short–medium-sized nests had >10 woodpecker cavities (04-Sam = 3; 06-Mar = 2; 07-Sal = 2); in 2021, there were 21 short– extra tall nests (01-Dup = 1; 03-Obe = 4; 04-Sam = 5; 05-Neu = 6; 11-Vie = 5) with >10 woodpecker cavities.
An increase in woodpecker cavities was observed in SF (2021: ≈32%; 2009: ≈25%) and PF (2021: 13%; 2009: ≈8%). In MF, the cavities decreased from ≈67% (2009) to ≈56% (2021). In 2021, the cavity-to-NH class ratio was highest for short (0.4), medium (0.3), and tall (0.1) nests in SF; in PF, the highest ratio was observed for extra tall nests (0.1). In 2009, ratios were much lower for all NH classes and forest owners.

4. Discussion

Quantifying species distribution and abundance is essential for ecology and conservation [28]. A recent study showed the poor data situation for the different sessile RWA, a keystone species abundant in Northern Hemisphere forests and their occurrence in most European countries including Germany [29]. Our statistical analyses confirmed our hypothesis: It is absolutely necessary that approaches to RWA monitoring and conservation have to rely on timely, science-based, standardized, and integrated information and data providing scientific evidence of the status quo of RWA occurrences, and their increase or decrease.

4.1. Pre-Requisites for (Re-)inventories of RWA Nests

For effective protection of RWA, six factors are important: (1) A scientifically reliable data base of RWA occurrences based on a standardized and comparable mapping approach: The area-wide, standardized, systematic, and integrated mapping approach for (re)inventories that we have developed, which also includes a photo database in which each RWA nest and its habitat is documented with at least two photos (e.g., [6,14]), has shown that a general statement about an RWA decline in Germany, as suggested, e.g., by [21], is not tenable for the WEVF. The opposite is the case: The total number of RWA nests increased by 10% and at one site (05-Neu) by up to 98%. (2) Observers experience documenting all nest sizes from start-ups to very tall nests: Working with lay observers protecting RWA in Germany revealed that lay people overlooked not only small nests but even medium-sized nests in the field [10,30]. This might explain the large differences among studies on RWA population dynamics [10]. However, it is these small nests that are important for understanding population dynamics in a study area and for evaluating spatial distribution and tectonic patterns [5,6,7,10,12]. (3) Inappropriate selection of a mapping method: Our approach provides more accurate results in contrast to imperfect detection and under-detection of small NH classes by using random sampling, transects (at 20–50 m intervals), or using satellite imagery with a 30 m threshold spacing, without the ability to identify start-ups and short nests (e.g., [30,31,32,33]). (4) Incorrect documentation of mapping results: Our own field experience with lay observers revealed that they rarely record nests digitally with GPS and record data collected from memory only vaguely on analog maps rather than with geographic information systems (GIS). Published results based on such unusable data are not comparable and lead to misinterpretations. (5) Statistically inadequate sampling sizes: Re-inventories by, e.g., members of the “Ameisenschutzwarte” who postulate general declines in RWA occurrences, draw their conclusions sometimes of, e.g., no more than one nest [34] or 14 nests for the entire study [30]. Drawing conclusions from such an insignificant database lead to misinterpretations. The authors’ experience has shown that a minimum number of 1000+ nests per study to be mapped will provide a more complete and statistically adequate database [6,12,13]. (6) Short time intervals for re-inventories: This is the most critical aspect. Recent studies conducted after several decades show a mixed picture: stable RWA nest counts in England and Romania (two decades), a pressure situation in Belgium (three decades), and both decreases and increases in RWA nest counts in The Netherlands (six decades [32,35,36,37,38]. The results of re-inventories after several decades should be viewed critically because a time interval of more than 20 years seems much too long to document population dynamics [39]. Compared to previous inventories conducted 18, 16, and 7 years ago at the 12 sites studied (Figure 5; [14]), the 2009 and 2021 inventories already showed an increase in RWA nest counts at all sites, with a maximum increase, e.g., for 10-Hei by 52-fold (2009) and 85-fold (2021), as compared to the inventory in 1984. In addition, the photo database of RWA nests and habitats was found to be a very useful tool for re identifying ≈340 RWA nests and their forest habitat. Therefore, it is suggested that re-inventories should be conducted earlier than after 20 years because climate change leading to hot summers and a lack of precipitation is affecting forest vitality in Germany much faster than expected and could also have an impact on RWA population dynamics [40].

4.2. Interconnection of Forest Composition, Physical RWA Nest Parameters, and Clearings

4.2.1. Tree Species and Age

The age structure of the German forest is characterized by the large-scale reforestation after World War II, with trees now between 40 and 60 years old and an average forest age of 77 years [40]. In the WEVF, the preferred tree age classes by RWA nests correspond to the reforested and averaged tree age: early to medium mature (41-80 years) and mature (≥81–140 years) spruce forests, confirming our findings in the Oberpfalz region that F. polyctena are more abundant in mature forests (Figure 2; [6]). The distribution of nest heights was also consistent with the findings in the Oberpfalz region [6]: One-fifth (2009) and one third (2021) of start-ups to short nests and ≈10% (2009; 2021: ≈6%) of tall–very tall nests were observed in medium mature (61–80 years) and mature spruce-dominated stands. Young (21–40 years) spruce-dominated stands comprised only ≈9% (2009; 2021: ≈4%) of all NH classes in the WEVF. This finding contrasts with the results by Sondeij et al. [31], who found that very young open canopy forests (<20 years) promote preferred habitats for nest settlements, and Domisch et al. [41], who found no RWA occurrences in 20-year-old Scots pine stands. Positive effects on species and habitat diversity are also expected from further development toward deciduous and mixed forests. Natural beech regeneration is increasingly gaining dominance in RLP forests [42]. This could be confirmed by our findings. The forest composition observed shows a shift from coniferous to naturally regenerated mixed stands, consisting of, e.g., spruce–beech and spruce–oak at RWA nest sites (Section 3.2). This is a positive development for beech and oak, as their vitality was affected by drought stress, oak powdery mildew (Microsphaera alphitoides), and insect infestation from 2018 to 2020 [43].

4.2.2. Clearings

German forests are currently facing outbreaks of bark beetles, the most devastating tree-killers in coniferous forests, especially in spruce stands. European spruce bark beetle species (Ips typographus, Pitogenes chalcographus) benefit from climate change and higher temperatures by developing more generations per year, resulting in bark beetle-induced tree mortality [43,44]. Bark beetles introduce wood-decay fungi that lead to enzymatic degradation of lignin and significantly alter the physical and mechanical properties of wood [45]. Rapid salvage clearing of infested standing spruce trees is a preferred combat measure. RWA live in trophobiosis with many plant-sucking insects (Aphidae, Coccidae, Psyllidae), especially on spruce. They protect these insects from predators and parasites [46]. Degradation of lignin or holocellulose is hypothesized to have negative effects on plant-sucking insects that feed RWA. The overall large shift toward smaller nests in all tree age classes (Figure 2) suggests that (a) there is an increase in new nest settlements, which is contrary to the general statement of a nest decline [21,30], (b) there is increasing pressure on RWA food resources due to a change in nutrient cycling in spruce stands as a result of a substantial reduction in wood quality [45], and (c) smaller colonies in smaller RWA nests could be an advantage for the survival of the whole colony after clearing bark beetle-infested trees and creating clearing areas. This could be confirmed by our results: Although clearing plots doubled in size due to bark beetle infestations in 2021, the total number of active nests on these plots quadrupled in 2021. This result contrasts with those of [33], which suggest that bark beetle outbreaks reduce RWA nest survival, particularly in clearings. Clearings are thought to favor the spatial distribution of species that are more xerothermophilic, such as the black-backed meadow ant (F. pratensis) which is adapted to higher temperatures and prefers more xerothermic, dry habitats [47].

4.2.3. Herbaceous Layer

The herbaceous layer with its high species diversity has an important role in maintaining biodiversity in the forest. This is because the herbaceous layer community is sensitive to spatial and temporal disturbances. Changes and increasing loss of species diversity provide important information about forest site characteristics [48]. In general, the composition of the herbaceous layer around a nest site and on RWA nests changed dramatically from 2009 to 2021, even though both surveys were conducted in the same months. Compared to 2009, typical herb layer plants observed in 2009 played little to no role in 2021, indicating lower species diversity. The most important herbs were grass, moss, or a combination of both, and broom. However, it is noticeable that the highly proliferating blackberry as a single plant or in combination with, e.g., grasses or mosses is becoming more dominant on the study sites (Figure 4). Blackberries are considered pests and competitors for trees and are controlled by foresters to prevent re-emergence (oral comm. from forester managers). Extreme weather events such as extreme drought and prolonged heat waves from 2018 to 2020 have affected forest vitality in RLP and contributed to the emergence of blackberry [43,49]. However, this study does not confirm that RWA nests are affected by blackberries as claimed by Véle and Frouz [33]. In 2009, a quarter of the nests that were re-inventoried in 2021 were affected by blackberries. In 2021, the proportion increased to ≈26%. Although this plant is highly sprawling and sometimes covers the entire nest area, RWAs do not appear to be disturbed in their daily routine.

4.3. Interconnection of RWA Nests and Woodpeckers

Old forests with several development phases are an important factor for biodiversity. They provide a rich supply of deadwood and biotope trees, which offer special microhabitats such as coarse bark, crown deadwood, or woodpecker cavities [40]. Deadwood is part of the natural cycle in the forest and has reached a share of 6% of the living wood stock in Germany. Many species are specialized in this which serves, e.g., as a food source, shelter, breeding ground, and drumming ground for various species, such as woodpeckers, bats, insects, fungi, and lichens [40,50]. Woodpecker species are considered indicators of forest biodiversity because they have adapted to old-growth forest habitat structures, use large breeding territories, and are active year-round [50,51]. The observation of a tripling of woodpecker cavities in RWA nests in 2021, especially in short and medium-sized nests (Table 5), may indicate a substantial increase in the number of foraging woodpeckers. This is especially true for the Black (Dryocopus martius), Green (Picus viridis), and the Gray woodpecker (Picus canus) in the study areas, as these three species feed on ants and forage not only on tree trunks, but mostly on the ground in RWA nests. Foraging in smaller nests could be more effective and beneficial because prey is captured more quickly. Woodpeckers that forage in large nests must dig small tunnels into the nest and remain for up to 12 min, such as the Green woodpecker (Picus viridis; AntCam data by Berberich and Berberich, unpublished). Our findings of an increase in WpC in nests are consistent with up to fivefold population increases of various woodpecker species, e.g., the black (Dryocopus martius), middle (Dendrocopos medius), and lesser spotted woodpecker (Dryobates minor), in the largest contiguous riparian woodland area of Rhineland-Palatinate [52]. Furthermore, our results showed that woodpeckers were more abundant in SF and PF, suggesting a different forest managing than in MF. Although biotope trees and deadwood are actively preserved, especially in SF, for insect conservation reasons [49], these key structures are ephemeral and require permanent replenishment [50]. Therefore, it is also conceivable that at the time of the two inventories, the number of these habitats had decreased and woodpeckers were therefore focusing more on RWA nests. In this case, woodpecker populations in the study areas would not increase, but habitat trees would decrease. Integrated monitoring woodpecker cavities in RWA nests is therefore another valuable, albeit indirect, indicator tool for monitoring sustainable forest management and assessing woodpecker populations and their habitats in the forest. Our monitoring contributes to the findings by Wübbenhorst and Südbeck [51] that other indicator species besides woodpeckers are needed as part of a monitoring system for sustainability in forests.

4.4. GeoBio-Interactions

As already shown in recent studies, e.g., for the Black Forest, Lake of Constance, Oberpfalz, and Romania [6,7,12], tectonic-volcanic processes and geochemical composition of bedrock are additional factors promoting spatial distribution of RWA nests and their high nest numbers [6,53]. In the WEVF, the active magma reservoir (Eifel plume) leads to a maximum uplift of ≈1 mm/year combined with a significant horizontal exten [25,54]. Such positive ground movement rates [55], as observed at nearly all study sites, open pathways for geogenic gases (e.g., Radon (Rn)). Radon emanation has a significant influence on the spatial distribution of nests [5,8,9,11]. At all study sites, medium to high soil Radon concentrations, were measured during the 2009 inventory [14] and taken from the literature for the re-inventory [56]. Weathered rocks show good adsorption properties of clay minerals and accumulation of U-bearing minerals [57]. In the WEVF, RWA nests were in direct contact with the natural Rn potential of the bedrock (Lower Devonian Klerfer and Gladbach Schichten and Triassic Buntsandstein), their structural dispersal pathways (e.g., Rn degassing faults) and the high U-content in the small grain fractions (<0.125 mm) of the soils [57]. Study sites with maximum concentration of 114 kBq/m3 (11-Vie) and 101 kBq/m3 (12-Roc) showed an increase in RWA nests of ≈31% (11-Vie) and ≈45% (12-Roc). Here, especially start-up and short nests that were mostly located in NE-SW direction, indicated new settlements in the present-day stress-field direction [14], confirming recent findings in other tectonically active study areas [5,7,12,13]. This is thought to be caused by micro-fracturing due to a high stress induced by the uplift forces of the Eifel plume, leading to the formation of new emanation surfaces and significant increase in the radon signal, although the applied stress remains constant over time [57]. Since local negative displacement rates in 09-Lis are almost equal to the positive ascending rates, this could explain the only small loss of RWA nests in this area [55]. Local negative displacement rates are thought to slowly close pathways for geogenic gases, resulting in lower Radon concentration (90 kBq/m3) and a decrease in RWA nest numbers, as observed at, e.g., the 03-Obe site (Table 2; [8,55,56]). This hypothesis was already established in previous studies and has now been further confirmed [5,6,8,12].

5. Conclusions

Our standardized, area-wide, reproducible, and integrated (re-)inventory approach not only monitors the entire habitat at a RWA nest, but is also able to detect and identify particularly small nests. When combined with presence/absence data and by re-identifying previously mapped nests, the use of such a comprehensive approach results in more accurate and realistic RWA nest counts in (re-)inventories, providing scientific evidence of the status quo of RWA occurrence. In addition, the photo database of RWA nests and habitats proved to be a very useful tool for re identifying RWA nests and their habitats. Woodpecker cavities in nests are suggested as an indirect tool for assessing woodpecker populations. GeoBio-Interactions, e.g., positive ground movement rates, open pathways for geogenic gases are suggested as an additional positive factor for nest settlements. Two planned inventories in two other study sites, after 8 and 4 years, will show whether the trends observed here in terms of RWA nests and WpC are confirmed in these areas as well.

Author Contributions

G.M.B. conceived the idea, designed the study, performed the field work, carried out the statistical analysis, and wrote the manuscript. M.B.B. performed the field work, analyzed the data, and contributed to the manuscript. Both authors edited the manuscript and approved the final version. All authors have read and agreed to the published version of the manuscript.

Funding

This research received no external funding.

Data Availability Statement

Data will be provided on demand.

Acknowledgments

We greatly acknowledge the support of the district foresters of the forest districts FD Prüm, FD Gerolstein, FA Daun, FD Hillesheim (all RLP), and FD Gemeindeforstamt Dahlem (NRW) which provided data from the 10-year forest inventory and management plan of 2009 and their forest rangers for their support in the field. None of them had a role in the design of the study; in the collection, analyses, or interpretation of data; in the writing of the manuscript, and in the decision to publish the results.

Conflicts of Interest

G.M.B and M.B.B. declare no potential conflict of interest with respect to the research, authorship, and publication of this article.

References

  1. Descombes, P.; Leprieur, F.; Albouy, C.; Heine, C.; Pellissier, L. Spatial imprints of plate tectonics on extant richness of terrestrial vertebrates. J. Biogeogr. 2017, 44, 1185–1197. [Google Scholar] [CrossRef]
  2. Frouz, J.; Jilkova, V. The effect of ants on soil properties and processes (Hymenoptera: Formicidae). Myrm. News 2008, 11, 191–199. [Google Scholar]
  3. Frouz, J.; Rybnicek, M.; Cudlin, P.; Chmelikova, E. Influence of the wood ant Formica polyctena on soil nutrient and the spruce tree growth. J. Appl. Entom. 2008, 132, 281–284. [Google Scholar] [CrossRef]
  4. Robinson, E.J.H.; Stockan, J.A.; Iason, G.R. Wood Ants and Their Interaction with Other Organisms. In Wood Ant Ecology and Conservation; Stockan, J.A., Robinson, E.J.H., Eds.; Cambridge University Press: Cambridge, UK, 2016; pp. 177–206. [Google Scholar]
  5. Berberich, G.M.; Berberich, M.B. Comparison of Geogases in Two Cenozoic Sedimentary Basins. Geosciences 2022, 12, 388. [Google Scholar] [CrossRef]
  6. Berberich, G.M.; Berberich, M.B.; Gibhardt, M. Red wood Ants (Formica rufa-group) prefer mature pine forests in Variscan granite environments(Hymenoptera: Formicidae). Fragm. Entomo. 2022, 54, 1–18. [Google Scholar] [CrossRef]
  7. Berberich, G.M.; Klimetzek, D.; Paraschiv, M.; Stancioiu, P.T.; Grumpe, A. Biogeostatistics confirm: Even a low total number of red wood ant nests provide new information on tectonics in the East Carpathian Orogen (Romania). Ecol. Indic. 2019, 101, 486–500. [Google Scholar] [CrossRef]
  8. Berberich, G.M.; Berberich, M.B.; Ellison, A.M.; Wöhler, C. Degassing Rhythms and Fluctuations of Geogenic Gases in A Red Wood-Ant Nest and in Soil in The Neuwied Basin (East Eifel Volcanic Field, Germany. Insects 2018, 9, 135. [Google Scholar] [CrossRef]
  9. Berberich, G.M.; Ellison, A.M.; Berberich, M.B.; Grumpe, A.; Becker, A.; Wöhler, C. Can a red wood-ant nest be a trap for fault-related CH4 micro-seepage? A case study from continuous short-term in-situ sampling. Animals 2018, 8, 46. [Google Scholar] [CrossRef]
  10. Berberich, G.M.; Dormann, C.F.; Klimetzek, D.; Berberich, M.B.; Sanders, N.J.; Ellison, A.M. Detection probabilities for sessile organisms. Ecosphere 2016, 7, e01546. [Google Scholar] [CrossRef]
  11. Berberich, G.M.; Sattler, T.; Klimetzek, D.; Benk, S.A.; Berberich, M.B.; Polag, D.; Schöler, H.F.; Atlas, E. Halogenation processes linked to red wood ant nests (Formica spp.) and tectonics. J. Atm. Chem. 2016, 74, 261–281. [Google Scholar] [CrossRef]
  12. Berberich, G.M.; Grumpe, A.; Berberich, M.B.; Klimetzek, D.; Wöhler, C. Are red wood ants (Formica rufa-group) tectonic indicators? A statistical approach. Ecol. Indic. 2016, 6, 968–979. [Google Scholar] [CrossRef]
  13. Berberich, G.; Klimetzek, D.; Wöhler, C.; Grumpe, A. Statistical Correlation between Red Wood Ant Sites and Tectonically Active Fault Structures. Mitt. Dtsch. Ges. Allg. Angew. Ent. 2014, 19, 45–50. [Google Scholar]
  14. Berberich, G. Identifikation Junger gasführender Störungszonen in der West- und Hocheifel mit Hilfe von Bioindikatoren. Ph.D. Thesis, University of Duisburg-Essen, Essen, Germany, 2010. [Google Scholar]
  15. Hallmann, C.A.; Sorg, M.; Jongejans, E.; Siepel, H.; Hofland, N.; Schwan, H.; Stenmans, W.; Müller, A.; Sumser, H.; Hörren, T.; et al. More than 75 percent decline over 27 years in total fl ying insect biomass in protected areas. PLoS ONE 2017, 12, e0185809-21. [Google Scholar] [CrossRef]
  16. Wagner, D.L.; Grames, E.M.; Forister, M.R.; Berenbaum, M.R.; Stopakd, D. Insect decline in the Anthropocene: Death by a thousand cuts. Proc. Nat. Acad. Sci. USA 2021, 118, e2023989118. [Google Scholar] [CrossRef] [PubMed]
  17. Crist, T.O. Biodiversity, species interactions and functional role of ants (Hymenoptera: Formicidae) in fragmented landscapes: A review. Myrmec. News 2009, 12, 3–13. [Google Scholar]
  18. Çamlitepe, Y.; Aksoy, V. Distribution and conservation status of the European red wood ant species Formica pratensis. J. Entomol. Res. Soc. 2019, 21, 199–211. [Google Scholar]
  19. Stoschek, N.; Roch, T. Zentrale Erfassung von Waldameisen im Freistaat Sachsen. AFZ-Der Wald 2006, 61, 186–188. [Google Scholar]
  20. Wilson, P. Wood Ants of Wyre. Wyre For. Study Group Rev. 2011, 2011, 17–22. [Google Scholar]
  21. Sturm, P.; Distler, H. Rote Liste gefährdeter Ameisen (Hymenoptera: Formicoidea) Bayerns. BayLfU 2003, 166, 208–212. [Google Scholar]
  22. BNatSchG. Gesetz über Naturschutz und Landschaftspflege (Bundesnaturschutzgesetz-BNatSchG) vom 29. Juli 2009 (BGBl. I S.2542/FNA 791-9). Available online: https://www.gesetze-im-internet.de/bnatschg_2009/BJNR254210009.html (accessed on 6 February 2023).
  23. BArtSchV. Verordnung zum Schutz Wild Lebender Tier- und Pflanzenarten. Bundesartenschutzverordnung (BArtSchV) vom 16. Februar 2005 (BGBl. I S. 258, 896), Die Zuletzt Durch Artikel 10 des Gesetzes vom 21. Januar 2013 (BGBl. I S. 95) Geändert Worden Ist. Available online: https://www.gesetze-im-internet.de/bartschv_2005/BArtSchV.pdf (accessed on 6 February 2023).
  24. AP Insektenschutz, 2019. Aktionsprogramm Insektenschutz der Bundesregierung–Gemeinsam Wirksam Gegen das Insektensterben. Drucksache 19/13031. 09.09. 2019. Available online: https://dserver.bundestag.de/btd/19/130/1913031.pdf (accessed on 6 February 2023).
  25. Schmincke, H.U. The Quaternary Volcanic Fields of the East and West Eifel (Germany). In Mantle Plumes—A Multidisciplinary Approach; Ritter, R., Christensen, U., Eds.; Springer: Berlin/Heidelberg, Germany, 2007; pp. 241–322. [Google Scholar]
  26. KWIS-RLP. Klimawandelinformationssystem Rheinland-Pfalz. 2021. Available online: www.kwis-rlp.de/anpassungsportal/regionale-informationen/osteifel/ (accessed on 22 October 2021).
  27. Data Europe EU: Digital Elevation Model über Europa aus dem GMES RDA-Projekt (EU-DEM) ist ein Digital SurfaceModel (DSM), The Official Portal for European Data 2021. Available online: https://land.copernicus.eu/imagery-in-situ/eu-dem/eu-dem-v1-0-and-derived-products/slope (accessed on 20 June 2021).
  28. Keil, P.; Storch, D.; Jetz, W. On the decline of biodiversity due to area loss. Nat. Com. 2015, 6, 8837. [Google Scholar] [CrossRef]
  29. Balzani, P.; Dekoninck, W.; Feldhaar, H.; Freitag, A.; Frizzi, F.; Frouz, J.; Masoni, A.; Robinson, E.; Sorvari, J.; Santini, G. Challenges and a call to action for protecting European red wood ants. Conserv. Biol. 2022, 36, e13959. [Google Scholar] [CrossRef] [PubMed]
  30. Reimann, H. Zustand eines Waldameisenvorkommens 2010 und 2021. Ameisenschutz Aktuell 2021, 35, 74–78. [Google Scholar]
  31. Sondeij, I.; Domisch, T.; Finér, L.; Czechowski, W. Wood ants in the Białowieża Forest and factors affecting their distribution. Ann. Zool. Fen. 2018, 55, 103–114. [Google Scholar] [CrossRef]
  32. Klimetzek, D.; Stancioiu, P.T.; Paraschiv, M.; Nita, M.D. Ecological Monitoring with Spy Satellite Images—The Case of Red Wood Ants in Romania. Remote Sens. 2021, 13, 520. [Google Scholar] [CrossRef]
  33. Véle, A.; Frouz, J. Bark Beetle Attacks Reduce Survival of Wood Ant Nests. Forests 2023, 14, 199. [Google Scholar] [CrossRef]
  34. Bär, R.; (Ameisenschutzwarte NRW, Siegen, Germany). Personal communication, 2022.
  35. Robinson, N.A.; Robinson, E.J.H. The population of the red wood ant Formica rufa L. (Hymenoptera: Formicidae) at Gait Barrows National Nature Reserve, Lancashire, England over the 20 year period 1986–2006: Nest longevity, reproduction and the effect of management. Br. J. Entomol. Nat. Hist. 2008, 21, 225–241. [Google Scholar]
  36. Dekoninck, W.; Hendrickx, F.; Grootaert, P.; Maelfait, J.-P. Present conservation status of red wood ants in northwestern Belgium: Worse than previously, but not a lost cause. Eur. J. Entomol. 2010, 107, 209–218. [Google Scholar] [CrossRef]
  37. Mabelis, A.A.; Korczyńska, J. Long term impact of agriculture on the survival of wood ants of the Formica rufa group (Formicidae). J. Insect Conserv. 2016, 20, 621–628. [Google Scholar] [CrossRef]
  38. Van Buggenum, H.J.M. Presence after three decades of red wood ants (Formica rufa group; Hymenoptera: Formicidae) in forests in an agricultural landscape. Eur. J. Entomol 2022, 119, 85–91. [Google Scholar] [CrossRef]
  39. Bretz, D. Gewaltiger Waldameisenrückgang im Forstamt Weilburg: Dramatische Bilanz nach 25 Jahren Waldameisen-Kartierung. Ameisenschutz Aktuell 2020, 92–110. [Google Scholar]
  40. BMEL. Der Wald in Deutschland. Ausgewählte Ergebnisse der Dritten Bundeswaldinventur. Bundesministerium für Ernährung und Landwirtschaft (BMEL). 2023. Available online: www.bundeswaldinventur.de (accessed on 6 February 2023).
  41. Domisch, T.; Finér, L.; Jurgensen, M.F. Red wood ant mound densities in managed boreal forests. Ann. Zool. Fenn. 2005, 42, 277–282. [Google Scholar]
  42. MUFV. Waldzustandsbericht 2010. Ministerium für Umwelt, Forsten und Verbraucherschutz (MUFV). 2010. Available online: www.mufv.rlp.de (accessed on 6 February 2023).
  43. MKUEM Waldzustandsbericht 2021. (Ministerium für Klimaschutz, Umwelt, Energie und Mobilität). 2021, p. 82. Available online: www.mkuem.rlp.de (accessed on 6 February 2023).
  44. KHVO Eifel. Newsletter Nr. 2. Dezember 2019. Available online: www.holzvermarktung-eifel.de (accessed on 6 February 2023).
  45. Hýsek, Š.; Löwe, R.; Turcáni, M. What Happens to Wood after a Tree Is Attacked by a Bark Beetle? Forests 2021, 12, 1163. [Google Scholar] [CrossRef]
  46. Adlung, K.G. A Critical Evaluation of the European Research on Use of Red Wood Ants (Formica rufa Group) for the Protection of Forests against Harmful Insects. Z. Angew. Entom. 1966, 57, 167–189. [Google Scholar] [CrossRef]
  47. Seifert, B. Formica nigricans Emery 1909–An ecomorph of Formica pratensis Retzius, 1783 (Hymenoptera, Formicidae). Entomol. Fenn. 1992, 2, 217–226. [Google Scholar] [CrossRef]
  48. Gilliam, F.S. The Ecological Significance of the Herbaceous Layer in Temperate Forest Ecosystems. BioScience 2007, 57, 10. Available online: https://academic.oup.com/bioscience/article/57/10/845/232416 (accessed on 6 February 2023). [CrossRef]
  49. BMEL. Ergebnisse der Waldzustandserhebung 2020. Bundesministerium für Ernährung und Landwirtschaft (BMEL). 2021, p. 72. Available online: www.bmel.de (accessed on 6 February 2023).
  50. Zimmerer, V. Erfolgsmelder im Waldnaturschutz. Digitale Ausgabe Bayerisches Landwirtschaftliches Wochenblatt BLW 25-2021. Available online: www.digitalmagazin.de/marken/blw/hauptheft/2021-25/wald/026_erfolgsmelder-im-waldnaturschutz (accessed on 6 February 2023).
  51. Wübbenhorst, J.; Südbeck, P. Woodpeckers as Indicators for Sustainable Forestry? First Results of a Study in the EU/LIFE–Demonstration Areas Lüneburger Heide und Solling. Demonstration of Methods to Monitor Sustainable Forestry. 2001. EU/LIFE Project 1998–2001 (LIFE98ENV/S/000478). Available online: https://vdocument.in/woodpeckers-as-indicators-for-sustainable-forestryj-woodpeckers-as-indicators.html?page=1 (accessed on 9 June 2018).
  52. Froehlich-Schmitt, B. Spechte in der Hördter Rheinaue nach 40 Jahren. 28. Jahrestagung der Fachgruppe Spechte. Ornithol. Anz. 2018, 57, 67–70. [Google Scholar]
  53. Del Toro, I.; Berberich, G.M.; Ribbons, R.R.; Berberich, M.B.; Sanders, N.J.; Ellison, A.M. Nests of red wood ants (Formica rufa-group) are positively associated with tectonic faults: A double-blind test. PeerJ 2017, 5, e3903. [Google Scholar] [CrossRef]
  54. Kreemer, C.; Blewitt, G.; Davis, P.M. Geodetic evidence for a buoyant mantle plume beneath the Eifel volcanic area, NW Europe. Geophys. J. Int. 2020, 222, 1316–1332. [Google Scholar] [CrossRef]
  55. Wolf, C. Copernicus-Dienst Rhein-Mosel. Copernicus-Dienst zur Unterstützung von Gefährdungsanalysen und Regionalplanung im Rhein-Mosel-Gebiet; BGR-Nr. 05-3039-01; Bundesanstalt für Geowissenschaften und Rohstoffe (BGR): Hannover, Germany, 2016. [Google Scholar]
  56. BfS. GEOPORTAL. Bundesamt für Strahlenschutz (BfS), Salzgitter. 2020. Available online: www.imis.bfs.de/geoportal/ (accessed on 4 July 2021).
  57. Kemski, J.; Klingel, R.; Siehl, A.; Neznal, M.; Matolin, M. Erarbeitung Fachlicher Grundlagen zur Beurteilung der Vergleichbarkeit Unterschiedlicher Messmethoden zur Bestimmung der Radonbodenluftkonzentration. Vorhaben 3609S10003. Bd. 2 Sachstandsbericht “Radonmessungen in der Bodenluft. Einflussfaktoren, Messverfahren, Bewertung”. 2012. BfS-RESFOR-63/12-Bd.2. urn:nbn:de:0221-201203237830. Available online: https://doris.bfs.de/jspui/handle/urn:nbn:de:0221-201203237830 (accessed on 6 February 2023).
Figure 1. Schematic depiction of the position of the 12 study sites (orange areas) within the West Eifel Volcanic Field (WEVF; black border), main rivers (blue lines), Quaternary (gray dots), and Neogene volcanoes (green dots) underlaid by a digital surface model (DSM). Inlet shows location of the WEVF within Germany in Rhineland-Palatinate (RLP) and North-Rhine-Westphalia (NRW; [14,27]).
Forests 14 00985 g001
Figure 2. Results of MANOVA for NH, ND, medium tree age (TSprime), and woodpecker cavities (WpC) showing (a) a grouped plot matrix and (b) grouped scatter plots of the first two canonical variables and their centers for the 2009 and 2021 inventories. Tree age with a −100 signature represents no trees or clearings in the study sites.
Forests 14 00985 g002
Figure 3. Gain and loss of RWA nests (total) in 12 study sites for the (a) 2009 and (b) 2021 inventory.
Forests 14 00985 g003
Figure 4. Visual representation of the qualitative composition of main herbs around and on (a) active RWA nests (nact), (b) re-identified nests (nactR), and (c) nests on clearings (nactC) for the 2009 and 2021 inventory. The larger and bolder a term for a herb, the more frequently it appears and the more important are the herbs: Dominant herbs are shown in red, bold, and large letters. Herbs that hold the same share are listed in the order of occurrence and are separated by commas.
Forests 14 00985 g004
Figure 5. Comparison of total RWA nest numbers (ntot) in different mapping campaigns conducted by Wellenstein (1960 and 1968), Moelter (1984), Nielen (1991) with the 2009 and 2021 inventories. Data 1960–2009 taken from [14].
Forests 14 00985 g005
Table 1. Results of (a) Kruskal–Wallis ANOVA test and (b) multiple comparison results for the 2009 and 2021 inventory for physical nest parameters (NH, ND) of active nests and medium tree age (mTA) for TSprime and woodpecker cavities (WpC) at the 1% significance level.
(a) 2009(a) 2021
SourceSSdfMSChi-sqProb > Chi-sqSourceSSdfMSChi-sqProb > Chi-sq
Groups4503029613315010098712974.70.00Groups3916176557313053921862418.480.00
Error20030976944295466,379.0 Error32879613574446739,532.47
Total65061273074298 Total72041379144449
(b) 2009(b) 2021
Group AGroup BLower
Limit
A-BUpper
Limit
p-ValueGroup AGroup BLower
Limit
A-BUpper
Limit
p-Value
NHND−525.5−390.7−255.80.0000NHND−711.1−575.5−440.00.0000
NHWpC758.8893.61028.50.0000NHWpC−362.1−226.6−91.10.0001
NHmTA−2119.8−1981.8−1843.70.0000NHmTA−2634.6−2492.0−2349.40.0000
NDWpC1149.51284.31419.10.0000NDWpC213.4348.9484.50.0000
NDmTA−1729.2−1591.1−1453.10.0000NDmTA−2059.1−1916.5−1773.90.0000
WpCmTA−3013.5−2875.4−2737.40.0000WpCmTA−2408.0−2265.4−2122.80.0000
Table 2. Descriptive statistics of total nest numbers (ntot), active nest numbers (nact), nest height (NH), and diameter classes (ND) of RWA nests in the 12 study sites for the 2009 and 2021 inventories. Increases in active nest numbers (nact) and percentages are set in bold. – = not present.
200920212009–2021
Nest Height (NH) Classes of Active Nests (nact)
NoStudy SiteNumbersnNumbersnnact%
ntotnactStart-UpsShortMediumTallVery TallExtra TallntotnactStart-UpsShortMediumTallVery TallExtra Tall
0.01–0.100.11–0.500.51–1.001.01–1.501.51–2.00>2.010.01–0.100.11–0.500.51–1.001.01–1.501.51–2.00>2.01
01Dup1029712626182615314214444032124546
02Doc1471421040745138157102416511−85−60
03Obe2162104474373521701632377461421−47−22
04Sam96937314294109103259301111011
05Neu66641019277113512711743756398
06Mar767118171719949345622112231
07Sal117108175721138078253221−30−28
08Ber1031002256221501423196154242
09Lis928593424188578554118−7−8
10Hei525255281485763621012446
11Vie4848111423666321721121011531
12Roc29293101644421299211345
Total11441099143373328136119012521164108645279102273656
Nest Diameter (ND) Classes of Active Nests (nact)
NoStudy SiteNumbersnNumbersnnact%
ntotnactSmallMediumLargeVery LargeExtra-LargentotnactSmallMediumLargeVery LargeExtra-Large
0.01–0.500.51–1.001.01–1.501.51–2.00>2.010.01–0.500.51–1.001.01–1.501.51–2.00>2.01
01Dup10297281916161815314228292922344546
02Doc147142164449249815715161268−85−60
03Obe2162107658351922170163624532168−47−22
04Sam96938212814221091031732371341011
05Neu66641512131591351273844311316398
06Mar7671251310617949333312632231
07Sal117108502315713807828321233−30−28
08Ber10310036391942150142813317744242
09Lis92852920151011857822321563−7−8
10Hei5252141813348576163215852446
11Vie48483129111366637112310121531
12Roc292952125544425181181345
Total114410993052812341341451252116435235526011582656
Table 3. Descriptive statistics of mapped area (ha), forest owners (SF, MF, PF) that hold share of the mapped area, numbers of active nests (nact), size of clearing plots with active RWA nests for the 2009 and 2021 inventory; – = not present.
NoStudy SiteMapped AreaState Forest (SF)Municipal Forest (MF)Private Forest (PF)Number of Nests (nact) 2009Number of Nests (nact) 2021Clearing Plots with RWA Nests
20092021
haha%ha%ha%SFMFPFSFMFPFha *nactha *nact
01Dup72.438.252.84.96.829.340.56631104382.1320.3816
02Doc59.359.3100.0142570.28
03Obe408.535.9261.764.111892108551.38262.6961
04Sam46.733.972.612.827.48589850.87163.458
05Neu92.960.665.232.334.8343095320.031
06Mar124.70.80.682.866.441.133.063877160.381
07Sal56.550.789.75.810.3108781.3617
08Ber85.2100.01001420.2541.2429
09Lis176.6171.296.93.17787350.6410
10Hei21.43.717.317.782.7282437390.4312
11Vie14.16.344.77.855.3252333300.153
12Roc122.9105.185.517.814.52942
Total1281.2236.518.5874.768.3170.013.32926751322907091654.785110.83205
* ha sizes estimated from satellite imageries (Google Earth) for 2009 and 2020/2021.
Table 4. Descriptive statistics of total number (ntot) of woodpecker cavities (WpC) in active nests (nact), number of active nests and WpC/nest ratio per study site, numbers of nest with woodpecker classes and percentage numbers of nest with woodpecker classes for the 12 study sites for the (a) 2009 and (b) 2021 inventory.
NoStudy SiteMapped Nests (nact)Numbers of WpC (n) in nactRatio WpC/NestNests (n) with WPC ClassesNests (n) with WPC Classes (%)
01–45–10>1001–45–10>10
(a) 2009: 224 Nests with WpC
01Dup97330.384130086.613.40.00.0
02Doc1421591.1805210056.336.67.00.0
03Obe210340.2195132092.96.21.00.0
04Sam931281.462253366.726.93.23.2
05Neu64550.846153071.923.44.70.0
06Mar711161.647148266.219.711.32.8
07Sal1081130.979243272.222.23.71.9
08Ber10000.0100000100.00.00.00.0
09Lis85430.569142081.216.52.40.0
10Hei52140.34840092.37.70.00.0
11Vie48120.34251087.510.42.10.0
12Roc29120.42351079.317.23.40.0
Sum10996990.687518433779.616.73.00.6
(b) 2021: 624 nests with WpC
01Dup1423132.2605724142.340.116.90.7
02Doc57500.939153068.426.35.30.0
03Obe1633392.1736422444.839.313.52.5
04Sam1033433.3264923525.247.622.34.9
05Neu1274293.4434929633.938.622.84.7
06Mar931501.638487040.951.67.50.0
07Sal781211.638328048.741.010.30.0
08Ber142750.5114244080.316.92.80.0
09Lis781562.0323511041.044.914.10.0
10Hei76851.141332053.943.42.60.0
11Vie632033.2212710533.342.915.97.9
12Roc42982.315189035.742.921.40.0
Sum116423622.05404511522146.438.713.11.8
Table 5. Descriptive statistics of nest height (NH) classes versus woodpecker cavities (WpC) for the (a) 2009 and (b) 2021 inventory.
Nest Height (NH) Classes (m)Woodpecker Cavities (WpC) in Nests
n%
01–45–10>1001–45–10>10
(a) 2009
0.01–0.1014300013.00.00.00.0
0.11–0.50322452229.24.10.20.2
0.51–1.002467915222.47.21.40.2
1.01–1.5064311135.82.81.00.3
1.51–2.0010029509.12.60.50.0
>2.001430000.00.00.00.0
Sum87518433779.616.73.00.6
(b) 2021
0.01–0.10 1080009.30.00.00.0
0.11–0.5033325354528.621.74.60.4
0.51–1.00731376266.311.85.30.5
1.01–1.5021472961.84.02.50.5
1.51–2.00514740.41.20.60.3
>2.0000000.00.00.00.0
Sum5404511522146.438.713.11.8
Disclaimer/Publisher’s Note: The statements, opinions and data contained in all publications are solely those of the individual author(s) and contributor(s) and not of MDPI and/or the editor(s). MDPI and/or the editor(s) disclaim responsibility for any injury to people or property resulting from any ideas, methods, instructions or products referred to in the content.

