
Construction of Core Collection and Phenotypic Evaluation of Toona sinensis


1
Research Institute of Subtropical Forestry, Chinese Academy of Forestry, Hangzhou 311400, China
2
College of Landscape Architecture, Nanjing Forestry University, Nanjing 210037, China
*
Author to whom correspondence should be addressed.
Forests 2023, 14(6), 1269; https://doi.org/10.3390/f14061269
Submission received: 19 April 2023
/
Revised: 10 June 2023
/
Accepted: 16 June 2023
/
Published: 19 June 2023
(This article belongs to the Special Issue Molecular Markers in Forest Management and Tree Breeding)
Abstract
:Toona sinensis is an important “vegetable and timber” tree species that is widely distributed in eastern and southeastern Asia. An efficient mechanism for preserving and utilizing germplasm resources is crucial for speeding up the process of genetic improvement of T. sinensis. We collected a total of 1040 germplasm resources of T. sinensis from China, Britain, and New Zealand. Using a total of 27,040 markers, we analyzed the genetic diversity, genetic structure, and core collection of these resources. Additionally, a comprehensive evaluation method for phenotypes of T. sinensis was established by principal component analysis (PCA) and the technique for order preference by similarity to ideal solution (TOPSIS). Our analysis included three main results: Firstly, the breeding population, consisting of a total of 1040 individuals, contains a diverse genetic pool and can be divided into two genetic clusters. Secondly, the best core collection was obtained from the alternative population, consisting of a total of 208 individuals and comprising 20% of the breeding population. It was screened out based on Core Hunter 3 software with the average entry-to-nearest-entry (E-NE) algorithm. Finally, a comprehensive evaluation method was established based on eight selected agronomic traits of the core collection. This method allowed us to screen the best individual plants of the core collection, including N0237, N0972, and N0409. Overall, our research findings will enable better preservation and utilization of T. sinensis germplasm resources and result in faster improvement of T. sinensis varieties.
1. Introduction
Toona sinensis, also known as Chinese toon, is regarded as a valuable mahogany that belongs to the genus of Toona in the Meliaceae [1]. This species is highly valued for its diverse applications in medicine, timber, and food production [2,3]. The young leaves of T. sinensis, as a kind of popular woody vegetable, are deeply enjoyed by the masses. In addition, the old leaves are important raw materials for silage feed and medicinal ingredients, which have great economic value. Many valuable secondary metabolites can be extracted from T. sinensis. For instance, limonoids have radical scavenging, anti-inflammatory, and cytotoxic activities [4], while two novel polysaccharides (TSP-1 and TSP-2) exhibit significant hepatoprotective activities [5]. Gallic acid has anticancer activity in human prostate cancer cells [6]. The extract from T. sinensis tender leaf can inhibit SARS coronavirus replication [7]. At the same time, the old leaves of T. sinensis are known to be rich in amino acids [8] and antioxidant substances [9], such as polyphenols, flavonoids [10,11], and saponins [12]. As a result, T. sinensis leaves are also used for the production of silage feed [13], as well as for essential oil extraction. T. sinensis is native to eastern and southeastern Asia and is widely distributed from North Korea to western Indonesia, with rich geographic variation [3,14]. There are abundant germplasm resources of T. sinensis in China [15]. Previous studies on T. sinensis have mainly concentrated on several fields, such as fresh-keeping [16], pharmacological research [17], genomics [18,19], phenotypic measurement [20,21], and genetic diversity [22,23]. With the development of the market economy, people’s demand for diversified varieties of T. sinensis is gradually increasing. Gene editing is an effective method for breeding new varieties. Therefore, quickly and accurately identifying the excellent genes urgently needed has become a tricky problem to be solved [24,25]. The construction of a core collection of T. sinensis is an effective way to solve this problem, which can greatly reduce the number of research individuals and reduce the impact caused by individual redundancy.
Core collection is the key to the research and utilization of germplasm resources [26]. The construction of the core collection can remove redundant individuals from the population and represent the genetic diversity of the entire population to the greatest extent with the least genetic resources, which is of great significance for improving the management and utilization of the entire germplasm bank. There are two main methods for constructing core collections: using phenotypic data such as plant growth traits and physiological traits, or using molecular markers such as SSR, SNP, ISSR, etc. A reasonable sampling strategy is a key step in the construction of core collection. Different species have their own special characteristics. Different sampling strategies need to be fully combined with the actual situation when constructing the core collection. The core collection was first widely used in crops, such as Robinia pseudoacacia L. [27], Peruvian quinoa [28], Glycine max [29], and Vitis vinifera [30]. In recent years, core germplasm has been successfully applied to many tree species, greatly improving the utilization efficiency of forest germplasm resources. For example, Zhu et al. constructed a core collection of Camellia oleifera using eighteen fruit phenotypic traits and twelve pairs of SSR Loci, preserving important fruit traits of Camellia oleifera and improving genetic diversity [31]. Lv et al. used twelve pairs of molecular markers to determine 35% as the best core collection proportion of Eucalyptus cloeziana F. Muell. And retained the genetic diversity of the breeding population with the smallest sample population [32]. With the completion of the whole genome sequencing of T. sinensis, it is more urgent than ever to construct a core collection of T. sinensis with rich genetic diversity and breed urgently needed excellent varieties.
The construction of core collections Is an effective way to improve the efficiency of variety improvement, and the comprehensive evaluation of multiple traits is one approach to utilizing core collections. Traditional genetic improvement focuses on specific characteristics, such as plant yield, resistance, and ornamental value. The selected varieties may only fulfill a certain type of demand, without evaluating the overall adaptability and comprehensive performance of plants. With the market’s development, people no longer just evaluate a single characteristic of a plant, but also have higher requirements for the comprehensive performance of multiple traits. Therefore, comprehensive evaluation of plant phenotypes has become an important way to meet current needs. Common comprehensive evaluation methods of plant phenotypes include gray relational degree method, fuzzy comprehensive evaluation method, TOPSIS, and CRITIC weight method [33,34,35], which have been widely applied in multi-indicator comprehensive analysis. Li et al. established a comprehensive evaluation method for beet based on six quality indexes, including total amino acid, betaine, sugar, potassium, sodium, and α-N content [26]. T. sinensis is a tree species used for vegetables and timber. The characters of the main trunk, branches, and compound leaves determine the economic value of T. sinensis species to a large extent. However, there are few studies on the construction of a core collection of T. sinensis and the comprehensive evaluation of its main economic traits [20,21,22], which greatly limits the efficient preservation and utilization of germplasm resources of T. sinensis.
This study mainly achieves two goals: One is to construct the core collection of T. sinensis, and the other is to establish a comprehensive evaluation method of the multiple phenotypes of T. sinensis. To achieve the above goals, we have carried out the following research work. A total of 1040 resources of T. sinensis from Xinsha Island, Zhejiang Province were selected in this study. A total of 13 pairs of SSR Loci were used for genotyping. We used different genotypes of these individual plants for genetic diversity and genetic structure analysis. In addition, we revealed the genetic relationship of the breeding population and constructed the core collection of T. sinensis, which will make more effective use of T. sinensis germplasm resources. Based on eight agronomic traits of core collection, we established a comprehensive evaluation method of T. sinensis and screened the individual plants with excellent traits, which provided an effective reference for the industrialization development of T. sinensis resources.
2. Materials and Methods
2.1. Plant Materials
A total of 1040 seedlings of T. sinensis were planted at the nursery site of Xinsha Island, Hangzhou, Zhejiang Province. The seedlings were collected from China, Britain, and New Zealand, and together formed the breeding population. The provenances of T. sinensis from China were mainly distributed in eight geographical regions, namely, Guanzhong plain, southern Guangxi-Yunnan mountains, north China plain, Qinling mountains, Shandong hills, Wuling mountains, Yunnan-Guizhou plateau, and Wuyi mountains. T. sinensis has pinnately compound leaves with different lengths. The leaves are in an opposite arrangement. There are hairs on the back of leaves, and the density of hairs varies among different varieties. In August 2021, the leaves of each individual were collected and transported to the laboratory in low-temperature insulated boxes.
The T. sinensis individuals selected in this study were 3-year-old seedlings planted on the flat land of Xinsha Island, which is rich in water resources, fertile soil, and sufficient light. The area can meet the basic growth needs of T. sinensis. In addition, attention was paid to the prevention of diseases and control of insect pests, as well as weeding in the plantation. As a result, T. sinensis grows and adapts well to the environment of the area.
2.2. Experimental Methods
2.2.1. DNA Extraction
The total DNA of the collected samples of T. sinensis was extracted by using a DNA extraction kit (DP305) (Tiangen, Beijing, China). The concentration of T. sinensis DNA was detected by using NanoDrop2000 ultramicro spectrophotometer (Thermo Fisher Scientific, Shanghai, China). The quality of the DNA was detected by running a 1.5% (mass fraction) agarose gel electrophoresis. The DNA sample was then stored at a temperature of −20 °C until it was ready for use in subsequent experiments.
2.2.2. SSR Typing
In this study, SSR loci were developed based on data of transcriptome and genome data of T. sinensis. Multiple PCR technology was used to amplify the standard genome as a template. The efficient and specific amplification of each pair of primers in the multiple systems was judged through sequencing optimization (Table 1). The PCR products were then subjected to high-throughput sequencing using the Illumina HiSeq platform in a 2 × 150/2 × 250 bp dual-terminal sequencing mode to obtain FastQ data. Finally, SSR typing was carried out by comparing the FastQ data with the reference sequence, followed by data filtering, SSR statistics, and other processes.
2.2.3. Measurement of Phenotypic Traits
In this study, several traits of T. sinensis were measured and recorded. The height of the tree (H), the length of the longest compound leaf (ZCFY), and the number of basal compound leaf shedding (FYTL) events were measured using a tape measure. The number of compound leaves (FYSL), branching number (FZS), logarithm of compound leaves (FYDS), and the number of basal compound leaf discoloration (FYBS) were counted. Additionally, the number of leaf dorsal hairs (YBM) was assigned a value from 1–5.
2.3. Data Analysis
2.3.1. Analysis of the Genetic Diversity and Structure of the Breeding Population
Genetic diversity parameters of SSR loci and populations were calculated by GenAlex v6.5 software [36], including the average number of alleles (Na), effective number of alleles (Ne), Shannon diversity index (I), observed heterozygosity (Ho), and expected heterozygosity (He). The polymorphism information content (PIC) of each SSR locus was calculated by Powermarker v3.25 [37].
Based on the neighbor-joining (NJ) method, the phylogenetic tree of the breeding population with 1040 individuals was constructed by MEGA 11 [38]. Based on 13 pairs of SSR Loci, the genetic structure of the breeding population was explored by using STRUCTURE v2.3.4. The burn-in period was set at 5000, Markov Chain Monte Carlo (MCMC) was set at 50,000, and each K value was independently calculated 10 times. We used GenAlex for principal coordinate analysis (PCoA) and set default parameters to draw a scatter diagram composed of principal coordinates 1 and 2.
2.3.2. Construction of Core Collection
Core Hunter 3 [39] and Powermarker software were used to select different alternative populations according to different sampling ratios, and GenAlex and Powermarker software were used to calculate the average number of alleles, effective number of alleles, Shannon diversity index, and other parameters of genetic diversity. We selected the alternative core collection by comparing the differences among alternative populations.
2.3.3. Analysis of Phenotypic Data
The maximum value (Max), minimum value (Min), mean value (Mean), variance (SD), and coefficient of variation (CV) of each trait were calculated using the SPSSAU online website [40]. The corrplot package of R software [41] was used for the analysis of phenotypic correlation. The dimensionless processing of the original data of different traits of T. sinensis was performed, and the formula is as follows:
Dimensionless of positive indicators (H, FZS, ZCFY, FYDS, and FYSL):
Dimensionless of negative indicators (YBM, FYTL, and FYBS):
where Dni represents the dimensionless results of different traits corresponding to different individual plants, Oni represents the original values of different traits corresponding to different individual plants, and Oimax represents the maximum values of different traits.
The weight value (Wn) of each trait was calculated by PCA on the online website of SPSSAU, and the decision-making matrix R was calculated by weighting all dimensionless indices. The positive ideal solutions (X+) and negative ideal solutions (X−) for each character were obtained according to matrix R, and the Euclidean norm was used as the distance measure to obtain the positive ideal solution distance (Si+) and negative ideal solution distance (Si−) for each individual plant. Finally, the relative proximity of the ideal solution (Ci) for each individual plant was calculated [42].
3. Results
3.1. Analysis of Genetic Diversity of Breeding Population
The genetic diversity of breeding populations is characterized by different genetic diversity parameters. As shown in Table 2, the average number of alleles (Na) ranged from 9 to 41, with an average of 23.231. The number of effective alleles (Ne) ranged from 2.234 to 18.419, with an average of 8.114. There is a great difference between Na and Ne, indicating that the allele frequency is unevenly distributed at different loci. The Shannon diversity index (I) ranged from 1.292 to 3.084, with an average value of 2.263. This shows that this breeding population has high species diversity. The observed heterozygosity (Ho) was 0.448–0.942, and the mean value was 0.622. The expected heterozygosity (He) ranged from 0.552 to 0.946, with an average of 0.823. The mean of expected heterozygosity was slightly higher than the mean of observed heterozygosity. This indicates that some genetic variation in the population has not been detected. The polymorphism information (PIC) content ranged from 0.542 to 0.943, with an average of 0.806. The results show that the sites we selected are all above moderate polymorphisms, most of which are high polymorphisms. The level of genetic diversity of the breeding population is high.
3.2. Construction of Alternative Core Collection
The differences in the genetic diversity parameters of alternative populations with different sampling methods are shown in Appendix A. Compared with the genetic diversity parameters of the breeding population, the capture of genetic diversity of alternative populations with different sampling ratios is displayed in Figure 1. As seen from the figure, the captured Na, Ne, and Ho values screened by Core Hunter 3 showed obvious fluctuations, while the captured genetic diversity parameters, I, He, and PIC, showed no obvious differences. However, the captured genetic diversity parameters (except Na and Ho) of these six alternative populations were all greater than 100%, indicating that alternative populations screened by Core Hunter 3 could represent the genetic diversity of the whole population to a certain extent. Among the alternative populations screened by Powermarker, the captured two genetic diversity parameters, Ho and He, in some alternative populations reached 100%, but the rest failed to capture all the genetic diversity of the breeding population. In summary, the results of Core Hunter 3 screening are more representative of the genetic diversity of the breeding population. In addition, according to the screening results of Core Hunter 3 with different proportions, the alternative population, 20% of the breeding population, had Na values of more than 85%. The alternative population, 10% of the breeding population had Ho values of 85%, and the Ne, I, He, and PIC values could capture all the entire genetic diversity of the breeding population. Several alternative core collections were obtained with different sampling strategies, and the captured genetic diversity parameters were different. To preserve the genetic diversity of the breeding population and minimize the core collection as much as possible, we determined 20% as the sampling ratio and selected Core Hunter 3 software to construct the core collection.
3.3. Genetic Structure Analysis of the T. sinensis Breeding Population
The neighbor-joining (NJ) tree of all the T. sinensis individuals was constructed by MEGA 11 (Figure 2A). The genetic structure of the breeding population was detected according to the numbering order of the evolutionary tree, and the alternative population number was calculated by Structure Harvest. The graph of the relationship between Delta K and K values shows that the maximum value of Delta K occurs when K = 2 (Figure 2B). The genetic components of individual plants at multiple K values (K = 2 - 7) were compared, and the distribution was reasonable when K = 2 (Figure 2C). The result of grouping was basically consistent with the two types of individuals in the evolutionary tree. The genetic composition of some samples between two genetic clusters is not single, which may be the offspring of gene exchange between two genetic clusters. In conclusion, a breeding population of 1040 members could be divided into two genetic clusters.
Principal coordinate analysis (PCoA) was used to analyze the distribution of core collections in the breeding population (Figure 3). The results showed that the first and second coordinates of PCoA accounted for 11.45% and 8.44% of the total genetic variation, respectively. Regardless of the first coordinate or the second coordinate, the whole population is roughly divided into two groups, and the core collection is also divided into two groups (Table 3). The distribution of the core collection and the breeding population is basically the same.
3.4. Comprehensive Evaluation and Analysis of Core Collection
3.4.1. Descriptive Statistics
As shown in Table 4, the coefficient of variation (CV) of different traits had a large difference. FYTL had the largest coefficient of variation (92.16%) and ZCFY had the smallest coefficient of variation (only 18.69%). The results indicated that there was a large difference in the number of basal compound leaves shed among different individual plants, and the difference in the length of the longest compound leaves was small.
3.4.2. Correlation Analysis of Eight Agronomic Traits
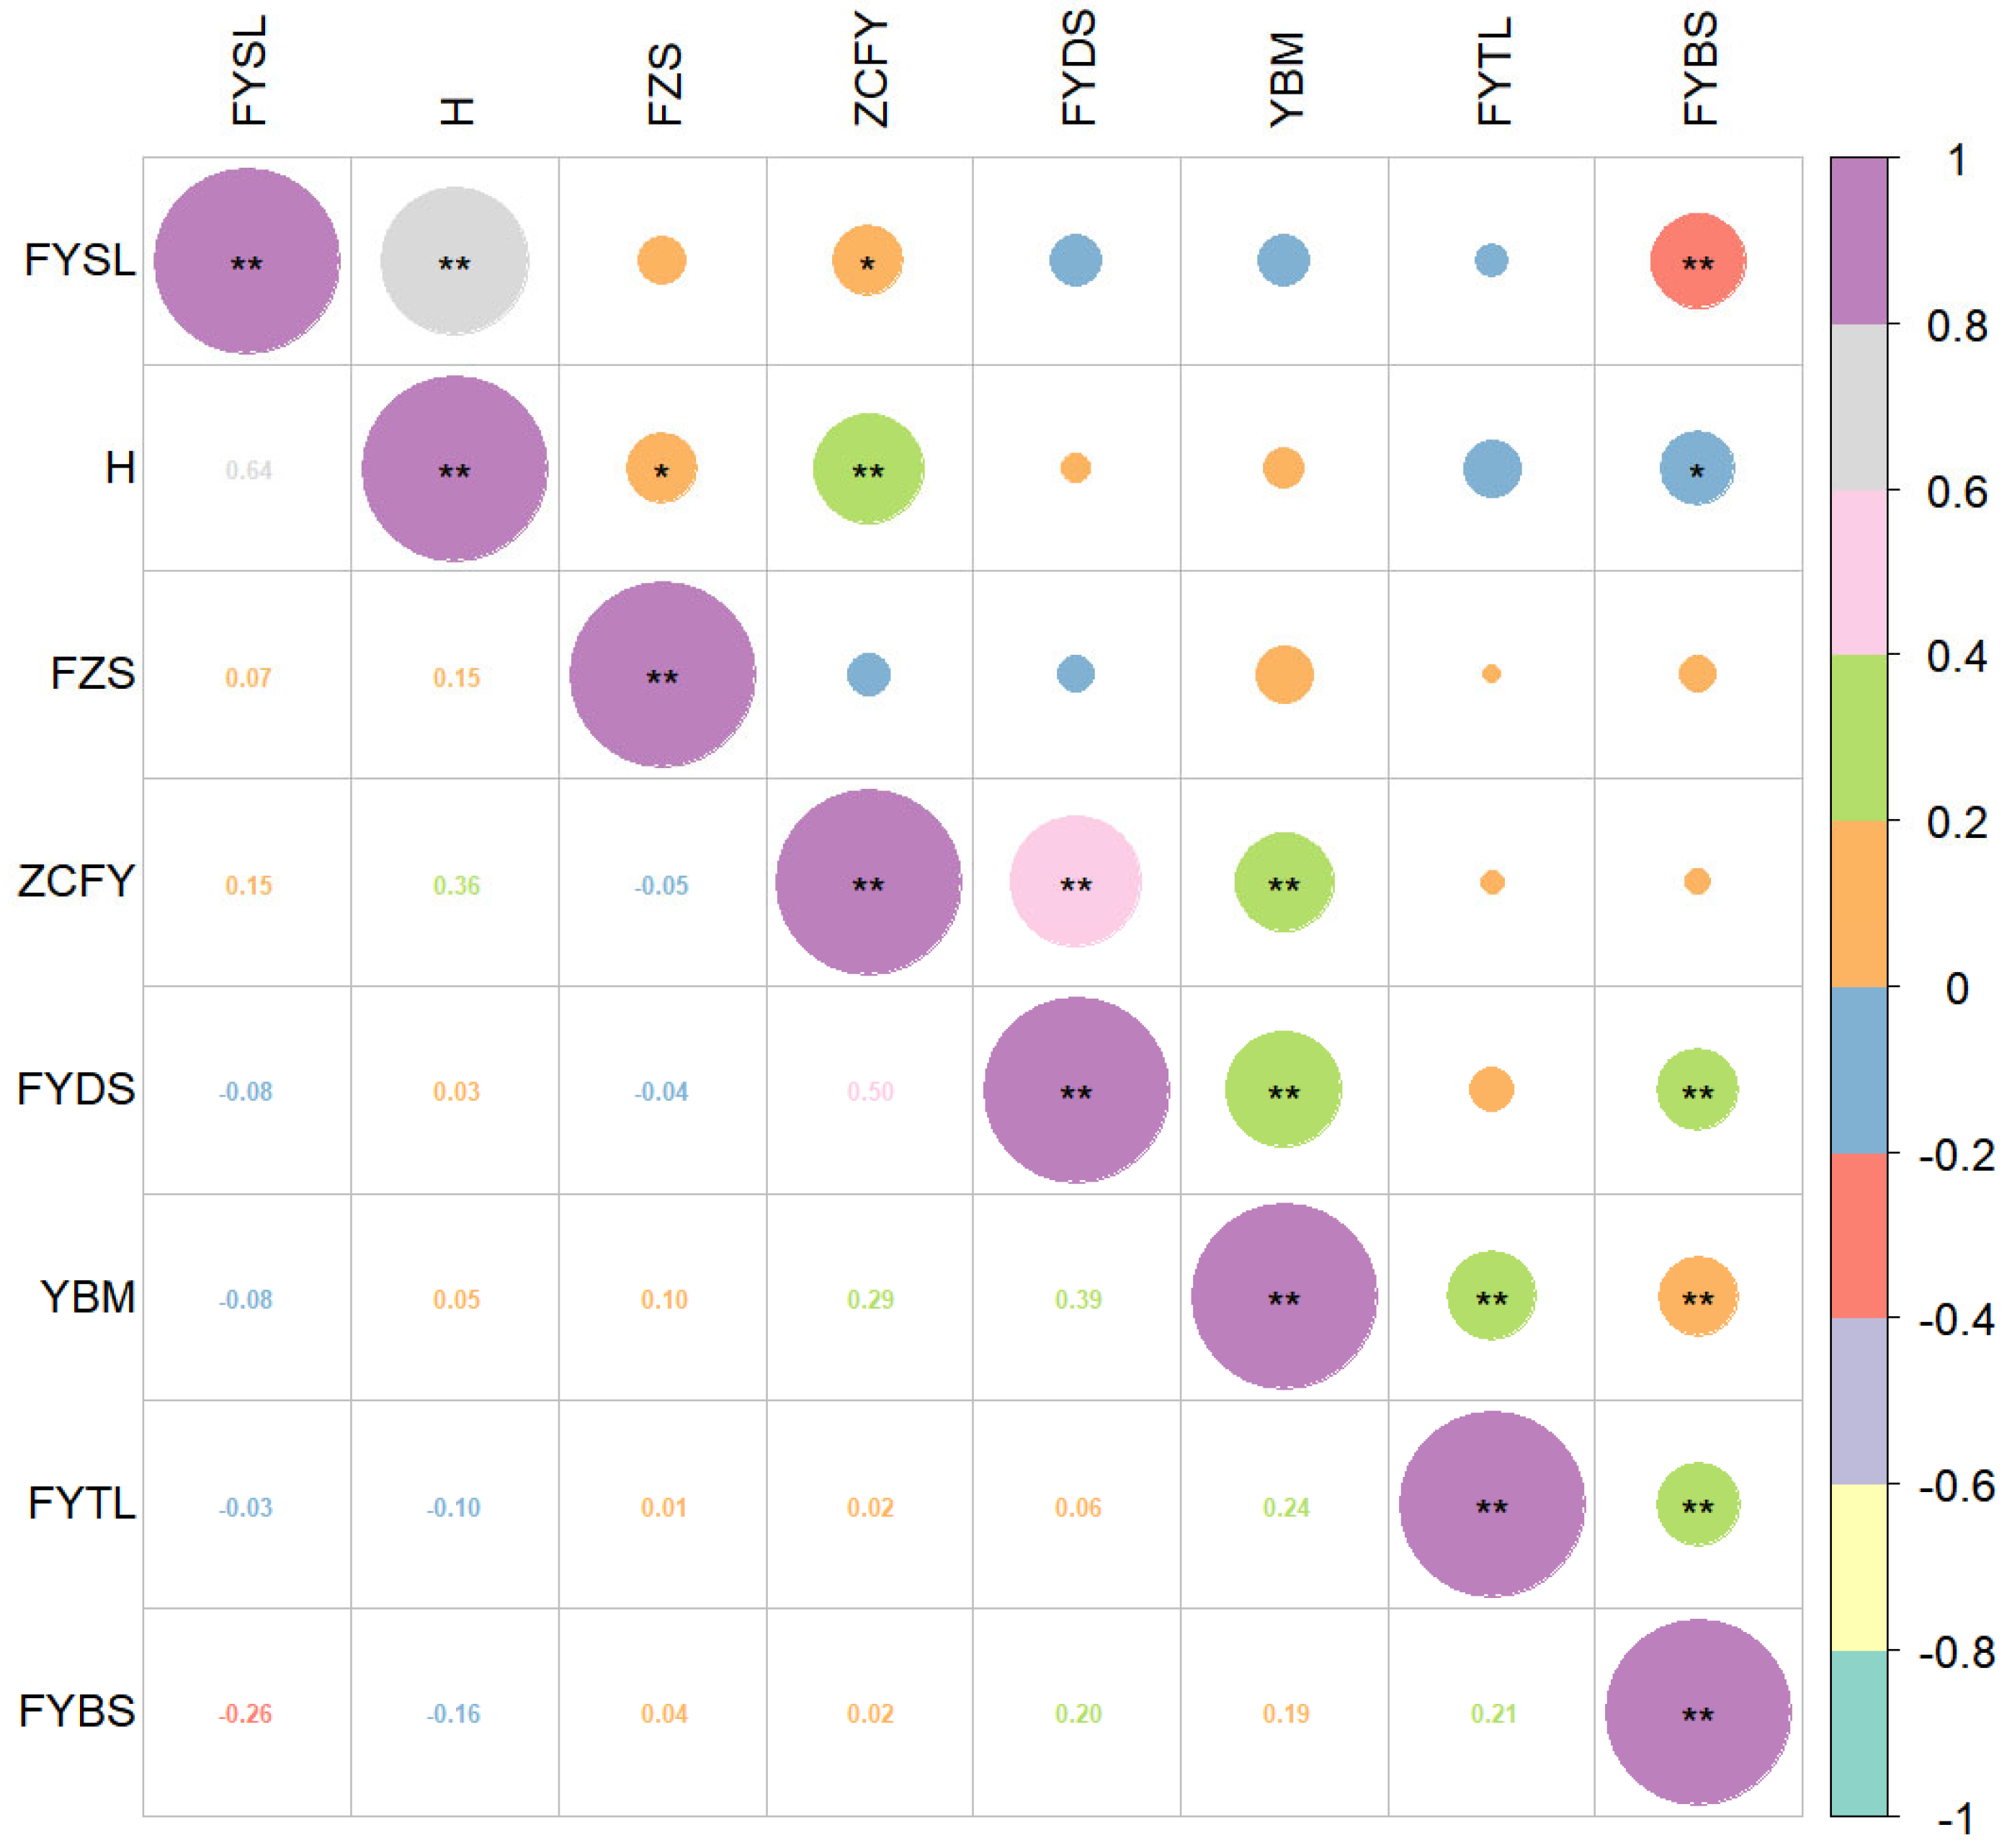
Figure 4 shows the correlation and significance of the eight traits in the core collection of T. sinensis. There is a positive correlation between FYDS, H, and ZCFY, while there is a negative correlation between FYDS and FYBS; the correlation coefficients are 0.64, 0.15, and −0.26, respectively. Among them, the correlation between FYDS, H, and FYBS reaches a very significant level, and the correlation between FYDs and ZCFY reaches a significant level. H was positively correlated with ZCFY, and the correlation coefficient reached 0.36. ZCFY was positively correlated with FYDS and YBM, and the correlation coefficients were 0.50 and 0.29, respectively. FYDS was positively correlated with YBM and FYBS, and the correlation coefficients were 0.39 and 0.2, respectively. YBM was positively correlated with FYTL and FYBS, and the correlation coefficients were 0.24 and 0.19, respectively. FYTL was positively correlated with FYBS, with a correlation coefficient of 0.21.
3.4.3. Weight Determination of Each Trait Based on PCA
Principal component analysis (PCA) is a very effective method to reduce the dimensionality of high-dimensional data while retaining most of the information in the set. Using KMO and Bartlett’s test, the results show that KMO is 0.568, which meets the basic requirements of KMO values greater than 0.5 in PCA. The corresponding p value of the Bartlett’s test is less than 0.05, indicating that it is suitable for PCA. In this study, three principal components were extracted after the standardization of the above eight agronomic traits by the PCA method (Table 5). Their variance interpretation rates are 24.47%, 23.73%, and 14.15%, respectively. The cumulative variance interpretation rates are 62.35%. The linear combination coefficient matrix was calculated by dividing the load coefficient by the square root of the corresponding characteristic root, and the linear combination coefficient was multiplied by the variance interpretation rate. Then, they were divided by the cumulative variance interpretation rate to obtain the comprehensive score coefficient, which was normalized to obtain the weight value of each trait. The weight values of each character were 15.42%, 8.97%, 12.01%, 15.00%, 14.20%, 13.37%, 10.49%, and 10.53%, respectively.
3.4.4. Comprehensive Evaluation of Core Collection Based on the TOPSIS Method
The TOPSIS analysis method calculates the distance between ideal solutions by using positive and negative ideal solutions of each trait to sort all individuals and comprehensively evaluate the performance of the selected traits of each individual plant. Based on the weight value of each trait calculated by PCA, all dimensionless indicators were weighted to calculate the decision-making matrix R. The comprehensive score of each individual plant is shown in the Appendix B, and the comprehensive phenotype of each individual plant is judged according to the relative proximity of the ideal solution (Ci). The greater the Ci is, the stronger the comprehensive performance of the plant is, and the stronger the plant’s adaptability to the environment is, and vice versa. As seen from the following table, the highest comprehensive score is N0237, with a score of 0.734, and the lowest comprehensive score is N0196, with a score of 0.379. The comprehensive rank of the top ten individual plants is N0237, N0972, N0409, N0783, N0048, N0802, N0845, N0981, N0125, and N0074. The scores of these ten individual plants are all greater than 0.48, which is the best selection and breeding target for the current eight trait evaluation indices.
4. Discussion
4.1. Construction of Core Collection
Different software programs use different methods to construct core collections [43,44]. Core Hunter 3 evaluates individual plant differences based on SSR marker data using the modified Roger’s distance [45,46]. In this study, average entry-to-nearest-entry (E-NE) [46] was selected as the calculation standard of genetic distance, which refers to the average genetic distance between each selected individual plant and other selected individual plants. In this way, the entire core collection, including extreme values, can be screened to maximize the construction of highly polymorphic core collections. In contrast, Powermarker uses the principle of the simulated annealing algorithm and linkage imbalance of markers to select a core collection with maximum genetic diversity from a larger germplasm resource [37,47]. The genetic diversity parameters captured by Core Hunter 3 and Powermarker are quite different under the same sampling ratio. Except for Ho, Core Hunter 3 has an advantage in capturing the amount of other genetic diversity parameters. Moreover, the Ne, I, He, and PIC of Core Hunter 3 were higher than those of the breeding population, indicating that the alternative core collections had higher genetic diversity. We compared the quality of the core collections constructed by the two software programs and found that a comparison is more convincing than a core collection constructed by a single method [48,49]. Therefore, in this study, we adopted alternative core collections constructed by Core Hunter 3, which includes more extreme individuals of the breeding population, resulting in more abundant genetic diversity and better representation of the breeding population’s genetic variation.
The sampling ratio is crucial to the construction of core collection. Brown proposed core collection in 1989 and used a sampling ratio of 10% [50]. However, with ongoing research, the sampling ratio of the core collection of different species is not exactly 10%, basically ranging from 5% to 40% [51,52]. For example, a core collection of just 5% of mulberry germplasm could represent the genetic diversity of 560 mulberry samples [52]. A sampling ratio of 11% was deemed suitable for constructing a core collection of Perilla frutescens L., which could include all alleles in the germplasm resource [53]. Similarly, 45 samples of Catalpa fargesii f. could represent the phenotypic and genetic variation of 252 breeding populations, with a sampling ratio of 17.9% [54]. Liu et al. constructed the core collection of yeast with a 30% sampling ratio. In this study, we compared the sampling proportions of 5%, 10%, 15%, 20%, 25%, and 30% to determine the best sampling proportion for constructing the T. sinensis core collection [55]. Finally, we determined that a sampling ratio of 20% was optimal in constructing a core collection with 208 samples, a size similar to core collections constructed for Zantedeschia hybrida, masson pine, and Eucalyptus cloeziana F. Muell [32,56,57]. The reason for this may be that the size of the breeding population and the level of genetic variation are similar. When constructing the core collection, we must fully consider the level of genetic diversity and population structure of the breeding population. Based on the genetic structure analysis and PCoA, the core collection was evenly distributed in the breeding population, with an appropriate distribution across the two genetic clusters of the breeding population. The T. sinensis core collection constructed in this study removed redundant individual plants of the breeding population, improving the preservation efficiency of germplasm resources of T. sinensis, and providing experimental materials with higher genetic diversity for the subsequent studies.
The distribution of a provenance Is closely linked to genetic variation [58]. Many studies have used provenance information to construct core collections. For instance, the researchers constructed the core collection of Arachis hypogaea L. using taxonomical, geographic, and morphological descriptors [59]. Similarly, studies of Zea mays L. in the Chinese National Genebank used geographical distribution and trait data to construct the core collection [60]. In this study, we constructed the T. sinensis core collection using representative SSR data. The provenance distribution of the core collection resembled that of the breeding population, where germplasm resources from the North China Plain accounted for the largest proportion, with 41.44% and 45.19% in the breeding population and core germplasm, respectively. Even though there were only a few individuals in the breeding population from the Guanzhong Plain, Shandong Hills, Yunnan-Guizhou Plateau, Wuyi Mountains, and Britain, some of them were included in the core collection. This finding suggests that the constructed core collection can be considered highly representative. However, the provenance from New Zealand was not included in the core collection, possibly due to a closer genetic distance between that individual and the other provenances.
4.2. Comprehensive Evaluation of Multiple Traits of Individual Plants in the Core Collection
Different traits have varying impacts on plant growth [61]. To evaluate the adaptability and value of plants in the same growth environment, relying on a single trait to score individual plants is insufficient [62,63]. It is necessary to comprehensively score various related economic traits and growth indicators [64]. With different index scores occupying different proportions in comprehensive evaluation scores, weight assignment is necessary [65]. Weight calculation methods include PCA [66,67,68], AHP [69], and the entropy method [70]. Additionally, we used the TOPSIS comprehensive evaluation method, which ranks the relative merits based on the distance between evaluation objects and positive and negative ideal solutions [71,72,73]. This method is widely used in the electric power industry, building science, agriculture, and forestry. For example, Liang et al. used the TOPSIS method and combination weighting to comprehensively evaluate the drought-resistance traits of maize and identified the best drought-resistance measures [74]. The study above uses the combination of analytic hierarchy process (AHP) and entropy weight (EW) to determine the weight. This method needs to consider the consistency of expert judgment and requires strong independence among the traits [75]. The correlation coefficient among many selected traits in this study was 0.01–0.64, indicating that the correlation of some traits was not strong. Thus, the entropy method might be more suitable for assessing certain traits. The principal component analysis used in this study helps to reduce the index’s dimensions and extract principal components that explain the highest variance of the data [76]. The weight of the index is determined based on the principal component’s contribution rate. The weights of different traits were calculated using principal component analysis. The weights obtained are mainly influenced by the data’s degree of variation, the number of principal components, and the data distribution. In this study, three principal components were selected, and the cumulative variance explanation rate was 62.35%, indicating that the selected principal components could adequately capture the data’s variation. However, there is still something that cannot be explained. In the results of the principal component analysis, tree height (H) occupied the largest weight value of 15.42%, indicating that H had a great influence on the plant’s comprehensive performance. In the comprehensive evaluation, the combination of multiple methods may be helpful in reducing the limitations of a single method and improving the evaluation’s accuracy. This study conducted a correlation analysis and comprehensive evaluation of eight agronomic traits of T. sinensis [77]. The results showed that the Ci values of many varieties, such as N0237, N0972, and N0409, were higher than those of other varieties, indicating that these individual plants play a dominant role in the current environment and are important candidates for the breeding of excellent varieties. Among the top ten individual plants, not all indicators are in the top ten, but most of the indicators are in the forefront. The excellent individual plants we selected are based on the current agronomic traits. As phenotypes change, different target individuals will be obtained. This study provides a preliminary exploration of the T. sinensis’s main growth indices’ comprehensive evaluation. However, adding more traits to gradually increase the comprehensive evaluation and analysis of different varieties is necessary to make a more reasonable judgment.
5. Conclusions
The preservation and utilization of genetic diversity are key to fully utilizing germplasm resources. Firstly, this study analyzed the genetic diversity of the T. sinensis breeding population and constructed a core collection consisting of 208 individual plants. The aim was to efficiently retain the genetic diversity at the lowest cost, providing an effective scheme for the collection of T. sinensis resources. Secondly, we comprehensively evaluated each plant’s advantages and disadvantages in selected traits using PCA weight assignment and the TOPSIS method. This evaluation aimed at utilizing the excellent individual plants in the core collection. We screened plants with strong adaptability, providing a reference for cultivating new T. sinensis varieties with excellent traits and strong resistance. In conclusion, this study gradually analyzed the preservation of genetic variation in the T. sinensis population and comprehensively evaluated each individual’s traits. Our findings provide new ideas for the subsequent genetic improvement and utilization of other populations.
Author Contributions
Conceptualization, J.L.; formal analysis, J.D.; investigation, J.D., J.L., H.Y., and X.H.; resources, J.L.; data curation, J.D.; writing—original draft preparation, J.D.; writing—review and editing, S.D., J.L., H.Y., and Y.F.; supervision, J.L.; project administration, J.L.; funding acquisition, J.L. All authors have read and agreed to the published version of the manuscript.
Funding
The research was supported by “National key R & D project” (2021YFD2200305) and “Zhejiang Science and Technology Major Program on Agricultural New Variety Breeding” (2021C02070-4).
Data Availability Statement
Conflicts of Interest
The authors declare no conflict of interest.
Appendix A
| Sampling Method | Na | Ne | I | Ho | He | PIC |
| CH52_5% | 15.923 | 8.668 | 2.317 | 0.487 | 0.856 | 0.841 |
| CH104_10% | 18.231 | 9.324 | 2.359 | 0.538 | 0.854 | 0.839 |
| CH156_15% | 19.385 | 9.437 | 2.361 | 0.555 | 0.849 | 0.834 |
| CH208_20% | 20.154 | 9.622 | 2.365 | 0.581 | 0.847 | 0.833 |
| CH260_25% | 20.692 | 9.649 | 2.370 | 0.589 | 0.847 | 0.832 |
| CH312_30% | 21.462 | 9.495 | 2.362 | 0.595 | 0.843 | 0.828 |
| PM52_5% | 15.308 | 7.031 | 2.145 | 0.614 | 0.811 | 0.794 |
| PM104_10% | 16.231 | 7.573 | 2.168 | 0.647 | 0.819 | 0.801 |
| PM156_15% | 17.923 | 7.391 | 2.163 | 0.630 | 0.806 | 0.786 |
| PM208_20% | 20.154 | 8.043 | 2.241 | 0.610 | 0.819 | 0.800 |
| PM260_25% | 19.538 | 8.046 | 2.241 | 0.627 | 0.824 | 0.807 |
| PM312_30% | 20.000 | 7.939 | 2.227 | 0.624 | 0.817 | 0.799 |
| 1040_100% | 23.231 | 8.114 | 2.263 | 0.622 | 0.823 | 0.806 |
Appendix B
| Number | Rank | Relative Proximity of the Ideal Solution (Ci) | >Positive Ideal Solutions (X+) | Negative Ideal Solutions (X−) |
| N0237 | 1 | 0.734 | 0.241 | 0.667 |
| N0972 | 2 | 0.725 | 0.252 | 0.663 |
| N0409 | 3 | 0.711 | 0.261 | 0.642 |
| N0783 | 4 | 0.707 | 0.279 | 0.673 |
| N0048 | 5 | 0.696 | 0.28 | 0.641 |
| N0802 | 6 | 0.683 | 0.3 | 0.646 |
| N0845 | 7 | 0.676 | 0.31 | 0.647 |
| N0981 | 8 | 0.675 | 0.317 | 0.659 |
| N0125 | 9 | 0.665 | 0.323 | 0.641 |
| N0074 | 10 | 0.664 | 0.325 | 0.642 |
| N0989 | 11 | 0.663 | 0.321 | 0.631 |
| N0064 | 12 | 0.663 | 0.35 | 0.688 |
| N0300 | 13 | 0.661 | 0.314 | 0.612 |
| N0165 | 14 | 0.66 | 0.317 | 0.616 |
| N0556 | 15 | 0.659 | 0.346 | 0.669 |
| N0397 | 16 | 0.657 | 0.334 | 0.642 |
| N1002 | 17 | 0.656 | 0.323 | 0.616 |
| N0569 | 18 | 0.656 | 0.335 | 0.638 |
| N0814 | 19 | 0.656 | 0.316 | 0.601 |
| N0750 | 20 | 0.653 | 0.328 | 0.619 |
| N0820 | 21 | 0.65 | 0.331 | 0.616 |
| N0842 | 22 | 0.646 | 0.336 | 0.612 |
| N0002 | 23 | 0.644 | 0.337 | 0.61 |
| N0986 | 24 | 0.641 | 0.323 | 0.577 |
| N0192 | 25 | 0.641 | 0.352 | 0.63 |
| N0844 | 26 | 0.641 | 0.351 | 0.626 |
| N0082 | 27 | 0.64 | 0.351 | 0.622 |
| N0424 | 28 | 0.638 | 0.329 | 0.581 |
| N0522 | 29 | 0.638 | 0.332 | 0.585 |
| N0068 | 30 | 0.636 | 0.342 | 0.599 |
| N0303 | 31 | 0.633 | 0.351 | 0.604 |
| N0525 | 32 | 0.632 | 0.345 | 0.591 |
| N0853 | 33 | 0.631 | 0.371 | 0.634 |
| N0326 | 34 | 0.63 | 0.342 | 0.583 |
| N0123 | 35 | 0.628 | 0.361 | 0.611 |
| N0324 | 36 | 0.625 | 0.36 | 0.6 |
| N0041 | 37 | 0.625 | 0.361 | 0.602 |
| N0053 | 38 | 0.624 | 0.368 | 0.611 |
| N0987 | 39 | 0.624 | 0.399 | 0.662 |
| N0831 | 40 | 0.624 | 0.365 | 0.605 |
| N0792 | 41 | 0.622 | 0.371 | 0.61 |
| N0065 | 42 | 0.621 | 0.371 | 0.608 |
| N0701 | 43 | 0.62 | 0.385 | 0.628 |
| N0352 | 44 | 0.616 | 0.333 | 0.536 |
| N0650 | 45 | 0.616 | 0.385 | 0.618 |
| N0157 | 46 | 0.615 | 0.394 | 0.63 |
| N0927 | 47 | 0.613 | 0.381 | 0.604 |
| N0866 | 48 | 0.613 | 0.362 | 0.573 |
| N0904 | 49 | 0.61 | 0.385 | 0.603 |
| N0992 | 50 | 0.61 | 0.357 | 0.559 |
| N0455 | 51 | 0.609 | 0.366 | 0.57 |
| N0765 | 52 | 0.608 | 0.376 | 0.583 |
| N0418 | 53 | 0.606 | 0.39 | 0.599 |
| N0240 | 54 | 0.606 | 0.363 | 0.558 |
| N0143 | 55 | 0.604 | 0.379 | 0.578 |
| N0136 | 56 | 0.604 | 0.392 | 0.597 |
| N0983 | 57 | 0.604 | 0.397 | 0.605 |
| N0079 | 58 | 0.603 | 0.378 | 0.575 |
| N0795 | 59 | 0.603 | 0.384 | 0.584 |
| N0381 | 60 | 0.603 | 0.407 | 0.619 |
| N0826 | 61 | 0.603 | 0.376 | 0.571 |
| N0139 | 62 | 0.602 | 0.372 | 0.563 |
| N0859 | 63 | 0.6 | 0.39 | 0.585 |
| N0641 | 64 | 0.599 | 0.382 | 0.571 |
| N0512 | 65 | 0.599 | 0.405 | 0.604 |
| N0439 | 66 | 0.598 | 0.381 | 0.568 |
| N0539 | 67 | 0.598 | 0.395 | 0.587 |
| N0340 | 68 | 0.597 | 0.396 | 0.587 |
| N0977 | 69 | 0.595 | 0.382 | 0.561 |
| N0863 | 70 | 0.594 | 0.409 | 0.6 |
| N0290 | 71 | 0.592 | 0.411 | 0.596 |
| N0793 | 72 | 0.592 | 0.375 | 0.543 |
| N0364 | 73 | 0.59 | 0.371 | 0.533 |
| N0189 | 74 | 0.589 | 0.403 | 0.577 |
| N0248 | 75 | 0.588 | 0.399 | 0.569 |
| N0103 | 76 | 0.588 | 0.375 | 0.534 |
| N0769 | 77 | 0.587 | 0.396 | 0.564 |
| N0150 | 78 | 0.587 | 0.378 | 0.537 |
| N0329 | 79 | 0.585 | 0.396 | 0.558 |
| N0865 | 80 | 0.583 | 0.389 | 0.544 |
| N0764 | 81 | 0.582 | 0.403 | 0.56 |
| N0119 | 82 | 0.581 | 0.421 | 0.585 |
| N0159 | 83 | 0.581 | 0.425 | 0.59 |
| N0587 | 84 | 0.58 | 0.405 | 0.561 |
| N0834 | 85 | 0.578 | 0.417 | 0.572 |
| N0114 | 86 | 0.577 | 0.403 | 0.549 |
| N0991 | 87 | 0.575 | 0.405 | 0.548 |
| N0272 | 88 | 0.573 | 0.404 | 0.542 |
| N0663 | 89 | 0.572 | 0.41 | 0.548 |
| N0912 | 90 | 0.571 | 0.432 | 0.576 |
| N0564 | 91 | 0.571 | 0.42 | 0.559 |
| N0388 | 92 | 0.57 | 0.412 | 0.546 |
| N0784 | 93 | 0.57 | 0.442 | 0.587 |
| N0604 | 94 | 0.565 | 0.429 | 0.558 |
| N0878 | 95 | 0.565 | 0.416 | 0.54 |
| N0787 | 96 | 0.564 | 0.426 | 0.551 |
| N0608 | 97 | 0.564 | 0.443 | 0.574 |
| N0152 | 98 | 0.564 | 0.451 | 0.584 |
| N0858 | 99 | 0.562 | 0.427 | 0.547 |
| N0317 | 100 | 0.562 | 0.433 | 0.555 |
| N0872 | 101 | 0.562 | 0.452 | 0.579 |
| N0244 | 102 | 0.561 | 0.419 | 0.535 |
| N0190 | 103 | 0.56 | 0.427 | 0.543 |
| N0861 | 104 | 0.559 | 0.411 | 0.521 |
| N0821 | 105 | 0.557 | 0.396 | 0.498 |
| N0530 | 106 | 0.556 | 0.448 | 0.56 |
| N1013 | 107 | 0.555 | 0.424 | 0.529 |
| N0613 | 108 | 0.555 | 0.419 | 0.522 |
| N0854 | 109 | 0.554 | 0.432 | 0.537 |
| N0030 | 110 | 0.554 | 0.437 | 0.543 |
| N0115 | 111 | 0.553 | 0.421 | 0.521 |
| N0689 | 112 | 0.552 | 0.434 | 0.534 |
| N0277 | 113 | 0.551 | 0.437 | 0.536 |
| N0603 | 114 | 0.55 | 0.429 | 0.524 |
| N0444 | 115 | 0.549 | 0.433 | 0.528 |
| N0448 | 116 | 0.548 | 0.406 | 0.491 |
| N0760 | 117 | 0.547 | 0.429 | 0.519 |
| N0018 | 118 | 0.541 | 0.478 | 0.564 |
| N1028 | 119 | 0.541 | 0.507 | 0.597 |
| N0615 | 120 | 0.54 | 0.447 | 0.525 |
| N0763 | 121 | 0.539 | 0.455 | 0.533 |
| N0505 | 122 | 0.538 | 0.499 | 0.582 |
| N0940 | 123 | 0.538 | 0.468 | 0.546 |
| N0901 | 124 | 0.536 | 0.46 | 0.532 |
| N1001 | 125 | 0.535 | 0.468 | 0.539 |
| N0009 | 126 | 0.534 | 0.456 | 0.523 |
| N0685 | 127 | 0.532 | 0.438 | 0.498 |
| N0906 | 128 | 0.531 | 0.488 | 0.553 |
| N0852 | 129 | 0.531 | 0.425 | 0.48 |
| N0026 | 130 | 0.53 | 0.459 | 0.517 |
| N0789 | 131 | 0.528 | 0.447 | 0.501 |
| N0681 | 132 | 0.528 | 0.443 | 0.495 |
| N0016 | 133 | 0.527 | 0.506 | 0.565 |
| N0748 | 134 | 0.527 | 0.433 | 0.482 |
| N0761 | 135 | 0.526 | 0.451 | 0.501 |
| N0242 | 136 | 0.526 | 0.476 | 0.527 |
| N0653 | 137 | 0.525 | 0.442 | 0.488 |
| N0855 | 138 | 0.522 | 0.456 | 0.499 |
| N0662 | 139 | 0.522 | 0.42 | 0.458 |
| N0047 | 140 | 0.521 | 0.456 | 0.496 |
| N0917 | 141 | 0.521 | 0.462 | 0.503 |
| N0598 | 142 | 0.519 | 0.455 | 0.491 |
| N0147 | 143 | 0.518 | 0.456 | 0.489 |
| N0728 | 144 | 0.517 | 0.535 | 0.573 |
| N0741 | 145 | 0.517 | 0.469 | 0.502 |
| N0879 | 146 | 0.515 | 0.458 | 0.487 |
| N0096 | 147 | 0.514 | 0.494 | 0.523 |
| N0172 | 148 | 0.514 | 0.531 | 0.56 |
| N0033 | 149 | 0.513 | 0.473 | 0.498 |
| N0450 | 150 | 0.512 | 0.43 | 0.452 |
| N0737 | 151 | 0.511 | 0.482 | 0.505 |
| N0085 | 152 | 0.51 | 0.447 | 0.465 |
| N0284 | 153 | 0.508 | 0.475 | 0.49 |
| N0066 | 154 | 0.505 | 0.47 | 0.479 |
| N0058 | 155 | 0.504 | 0.5 | 0.507 |
| N0116 | 156 | 0.503 | 0.452 | 0.457 |
| N0993 | 157 | 0.5 | 0.465 | 0.466 |
| N0267 | 158 | 0.499 | 0.458 | 0.456 |
| N0828 | 159 | 0.498 | 0.467 | 0.463 |
| N0377 | 160 | 0.497 | 0.485 | 0.48 |
| N0875 | 161 | 0.49 | 0.479 | 0.461 |
| N0611 | 162 | 0.49 | 0.464 | 0.446 |
| N0563 | 163 | 0.489 | 0.522 | 0.5 |
| N0057 | 164 | 0.487 | 0.467 | 0.444 |
| N0752 | 165 | 0.486 | 0.506 | 0.479 |
| N0683 | 166 | 0.484 | 0.479 | 0.449 |
| N0708 | 167 | 0.483 | 0.504 | 0.472 |
| N0677 | 168 | 0.483 | 0.492 | 0.46 |
| N0269 | 169 | 0.482 | 0.47 | 0.438 |
| N0289 | 170 | 0.479 | 0.532 | 0.489 |
| N0963 | 171 | 0.479 | 0.578 | 0.531 |
| N0211 | 172 | 0.478 | 0.467 | 0.429 |
| N0909 | 173 | 0.475 | 0.555 | 0.502 |
| N0433 | 174 | 0.475 | 0.524 | 0.473 |
| N0900 | 175 | 0.471 | 0.563 | 0.501 |
| N0876 | 176 | 0.469 | 0.502 | 0.443 |
| N0740 | 177 | 0.469 | 0.522 | 0.461 |
| N0210 | 178 | 0.464 | 0.52 | 0.45 |
| N0944 | 179 | 0.464 | 0.593 | 0.513 |
| N0908 | 180 | 0.464 | 0.487 | 0.421 |
| N0145 | 181 | 0.462 | 0.479 | 0.411 |
| N0922 | 182 | 0.461 | 0.551 | 0.472 |
| N0915 | 183 | 0.461 | 0.527 | 0.451 |
| N0935 | 184 | 0.461 | 0.527 | 0.45 |
| N1021 | 185 | 0.459 | 0.494 | 0.419 |
| N0883 | 186 | 0.451 | 0.557 | 0.458 |
| N0371 | 187 | 0.449 | 0.505 | 0.411 |
| N0268 | 188 | 0.447 | 0.517 | 0.418 |
| N0137 | 189 | 0.445 | 0.508 | 0.406 |
| N0445 | 190 | 0.444 | 0.499 | 0.399 |
| N0091 | 191 | 0.442 | 0.523 | 0.414 |
| N0707 | 192 | 0.439 | 0.508 | 0.397 |
| N0434 | 193 | 0.439 | 0.492 | 0.384 |
| N0958 | 194 | 0.438 | 0.621 | 0.485 |
| N0744 | 195 | 0.436 | 0.609 | 0.471 |
| N0118 | 196 | 0.434 | 0.513 | 0.394 |
| N0664 | 197 | 0.432 | 0.58 | 0.441 |
| N0494 | 198 | 0.431 | 0.532 | 0.403 |
| N0032 | 199 | 0.426 | 0.541 | 0.402 |
| N0247 | 200 | 0.421 | 0.546 | 0.398 |
| N0903 | 201 | 0.419 | 0.558 | 0.402 |
| N0937 | 202 | 0.413 | 0.574 | 0.403 |
| N0962 | 203 | 0.405 | 0.567 | 0.386 |
| N0824 | 204 | 0.402 | 0.571 | 0.384 |
| N0218 | 205 | 0.4 | 0.567 | 0.378 |
| N0051 | 206 | 0.4 | 0.57 | 0.38 |
| N0036 | 207 | 0.384 | 0.589 | 0.367 |
| N0196 | 208 | 0.379 | 0.58 | 0.355 |
References
- Edmonds, J.M.; Staniforth, M. Toona sinensis: Meliaceae. Curtis’s Bot. Mag. 1998, 15, 186–193. [Google Scholar] [CrossRef]
- Hu, J.W.; Ma, W.J.; Shen, Y.Q.; Xiao, Y. Study on Growth Traits of Different Toona sinensis Clones and Superior Clone Early Selection. For. Res. 2019, 32, 165–170. [Google Scholar]
- Wei, P.; Yujie, L.; Meibian, H.; Mengmeng, Z.; Jing, Y.; Fang, L.; Qinwan, H.; Chunjie, W. Toona sinensis: A comprehensive review on its traditional usages, phytochemisty, pharmacology and toxicology. Rev. Bras. De Farmacogn. 2019, 29, 111–124. [Google Scholar]
- Hu, J.; Song, Y.; Mao, X.; Wang, Z.; Zhao, Q. Limonoids isolated from Toona sinensis and their radical scavenging, anti-inflammatory and cytotoxic activities. J. Funct. Foods 2016, 20, 1–9. [Google Scholar] [CrossRef] [PubMed]
- Juan-Juan, C.; Qing-Qing, L.; Bao, Z.; Han-Qing, C. Structural characterization and hepatoprotective activities of polysaccharides from the leaves of Toona sinensis (A. Juss) Roem. Carbohydr. Polym. 2019, 212, 89–101. [Google Scholar]
- Chen, H.; Wu, Y.; Chia, Y.; Chang, F.; Hsu, H.; Hsieh, Y.; Chen, C.; Yuan, S. Gallic acid, a major component of Toona sinensis leaf extracts, contains a ROS-mediated anti-cancer activity in human prostate cancer cells. Cancer Lett. 2009, 286, 161–171. [Google Scholar] [CrossRef]
- Chen, H.; Wu, Y.; Chia, Y.; Chang, F.; Hsu, H.; Hsieh, Y.; Chen, C.; Yuan, S. Toona sinensis Roem tender leaf extract inhibits SARS coronavirus replication. J. Ethnopharmacol. 2008, 120, 108–111. [Google Scholar] [CrossRef]
- Li, Y.C.; Fan, Z.P.; Yang, J.; Liu, T.F. Research progress on functional components and biological activities of wild edible vegetables. J. Zhejiang AF Univ. 2022, 39, 913–922. [Google Scholar]
- Zhou, C.Y.; Ruan, J.Y.; Huang, J.; Tang, J. Advances in Research on Chemical Constituents and Biological Activities of Toona sinensis. Chin. Tradit. Pat. Med. 2020, 42, 1279–1291. [Google Scholar]
- Li, C.C. Study on Flavonoid Content and Antioxidant Properties of Toona sinensis Old Leaves. Food Res. Dev. 2021, 42, 34–39. [Google Scholar]
- Liu, Y.M.; Zhang, J.J.; Wu, L. Extraction of Total Flavonoids from Toona sinensis Old Leaves by Complex Enzymolysis Assisted with Ultrasound. Mod. Food Sci. Technol. 2019, 35, 223–230. [Google Scholar]
- Chen, W.; Li, C.C.; Ran, H.; Li, W.H. Isolation and Identification of Flavonoids and Saponins in Old Toona sinensis Leaves. Packag. Eng. 2019, 40, 36–42. [Google Scholar]
- Geng, Y.H.; Xu, X.; Ni, J.; Su, S. Effect of Harvest Time on Forage Quality of Toona sinensis. For. Res. 2019, 32, 145–151. [Google Scholar]
- Flora of China. Toona sinensis [Online Application Software]. Available online: http://www.efloras.org (accessed on 17 April 2023).
- Chen, Q.Q. Genetic Diversity Analysis of Toona sinensis Germplasm Resources in China; Shandong Agricultural University: Taian, China, 2018. [Google Scholar]
- Xu, X.; Guo, C.; Ma, C.; Li, M.; Chen, Y.; Liu, C.; Chu, J.; Yao, X. Brassinolide Soaking Reduced Nitrite Content and Extended Color Change and Storage Time of Toona sinensis Bud during Low Temperature and Near Freezing-Point Temperature Storage. Int. J. Mol. Sci. 2022, 23, 1311–1327. [Google Scholar] [CrossRef]
- Hseu, Y.; Chen, S.; Lin, W.; Hung, D.; Lin, M.; Kuo, Y.; Wang, M.; Cho, H.; Wang, L.; Yang, H. Toona sinensis (leaf extracts) inhibit vascular endothelial growth factor (VEGF)-induced angiogenesis in vascular endothelial cells. J. Ethnopharmacol. 2011, 134, 111–121. [Google Scholar] [CrossRef]
- Wang, X.; Xiao, Y.; He, Z.; Li, L.; Lv, Y.; Hu, X. Evolutionary Divergence between Toona ciliata and Toona sinensis Assayed with Their Whole Genome Sequences. Genes 2022, 13, 1799–1813. [Google Scholar] [CrossRef]
- Ji, Y.; Xiu, Z.; Chen, C.; Wang, Y.; Yang, J.; Sui, J.; Jiang, S.; Wang, P.; Yue, S.; Zhang, Q.; et al. Long read sequencing of Toona sinensis (A. Juss) Roem: A chromosome-level reference genome for the family Meliaceae. Mol. Ecol. Resour. 2021, 21, 1243–1255. [Google Scholar] [CrossRef]
- Liu, W.; Li, Y.; Liu, J.; Jiang, J. Estimation of Plant Height and Aboveground Biomass of Toona sinensis under Drought Stress Using RGB-D Imaging. Forests 2021, 12, 1747–1759. [Google Scholar] [CrossRef]
- Liu, W.; Li, Y.; Tomasetto, F.; Yan, W.; Tan, Z.; Liu, J.; Jiang, J. Non-destructive Measurements of Toona sinensis Chlorophyll and Nitrogen Content Under Drought Stress Using Near Infrared Spectroscopy. Front. Plant Sci. 2022, 12, 3274–3286. [Google Scholar] [CrossRef]
- Yao, C.C.; Wang, J.C.; Hu, J.W.; Xiao, Y. Genetic variation of growth and leaf phenotypic traits of Toona sinensis (A. Juss.) Roem. germplasms. Plant Sci. J. 2020, 38, 112–122. [Google Scholar]
- Wu, J.; Zhong, Z.Z.; Lou, J.; Yu, F. A Study on Phenotypic Diversity of Cone and Seed in Natural Populations of Toona sinensis. Acta Agric. Univ. Jiangxiensis 2018, 40, 248–256. [Google Scholar]
- Fu, D.; Zhong, K.; Zhong, Z.; Hu, G.; Zhang, P.; Tong, H. Genome-Wide Association Study of Sheath Blight Resistance within a Core Collection of Rice (Oryza sativa L.). Agronomy 2022, 12, 1493–1506. [Google Scholar] [CrossRef]
- Shi, A.; Gepts, P.; Song, Q.; Xiong, H.; Michaels, T.E.; Chen, S. Genome-Wide Association Study and Genomic Prediction for Soybean Cyst Nematode Resistance in USDA Common Bean (Phaseolus vulgaris) Core Collection. Front. Plant Sci. 2021, 12, 624–650. [Google Scholar] [CrossRef]
- Li, X.; Cui, L.; Zhang, L.; Huang, Y.; Zhang, S.; Chen, W.; Deng, X.; Jiao, Z.; Yang, W.; Qiu, Z. Genetic Diversity Analysis and Core Germplasm Collection Construction of Radish Cultivars Based on Structure Variation Markers. Int. J. Mol. Sci. 2023, 24, 2554–2566. [Google Scholar] [CrossRef] [PubMed]
- Guo, Q.; Liu, J.; Li, J.; Cao, S.; Zhang, Z.; Zhang, J.; Zhang, Y.; Deng, Y.; Niu, D.; Su, L.; et al. Genetic diversity and core collection extraction of Robinia pseudoacacia L. germplasm resources based on phenotype, physiology, and genotyping markers. Ind. Crops Prod. 2022, 178, 114–128. [Google Scholar] [CrossRef]
- Ortiz, R.; Ruiz TE, N.; Mujica, S.A. Sampling strategy for a core collection of Peruvian quinoa germplasm. TAG. Theoretical and applied genetics. Theor. Und Angew. Genet. 1998, 96, 75–83. [Google Scholar]
- Marcelo, F.O.; Randall, L.N.; Isaias, O.G.; Cosme, D.C.; José, F.F.D.T. Establishing a soybean germplasm core collection. Field Crops Res. 2010, 119, 277–289. [Google Scholar]
- Cretazzo, E.; Moreno, S.P.; Lorenzi, S.; Benítez, M.L.; Velasco, L.; Emanuelli, F. Genetic Characterization by SSR Markers of a Comprehensive Wine Grape Collection Conserved at Rancho de la Merced (Andalusia, Spain). Plants 2022, 11, 1088–1107. [Google Scholar] [CrossRef]
- Zhu, Y.Z.; Liang, D.Y.; Song, Z.J.; Tan, Y.; Guo, X.L.; Wang, D.L. Genetic Diversity Analysis and Core Germplasm Collection Construction of Camellia oleifera Based on Fruit Phenotype and SSR Data. Genes 2022, 13, 2351–2365. [Google Scholar] [CrossRef]
- Lv, J.; Li, C.; Zhou, C.; Chen, J.; Li, F.; Weng, Q.; Li, M.; Wang, Y.; Chen, S.; Chen, J. Genetic diversity analysis of a breeding population of Eucalyptus cloeziana F. Muell.(Myrtaceae) and extraction of a core germplasm collection using microsatellite markers. Ind. Crops Prod. 2020, 145, 112–157. [Google Scholar] [CrossRef]
- Zhang, N.; Wu, W.; Li, S.; Wang, Y.; Ma, Y.; Meng, X.; Zhang, Y. Comprehensive Evaluation of Paddy Quality by Different Drying Methods, Based on Gray Relational Analysis. Agriculture 2022, 12, 1857–1870. [Google Scholar] [CrossRef]
- Zheng, P.; Zhang, M.; Wang, Z.; Wang, T.; Tang, L.; Ma, E.; Liu, J.; Shi, F. Comprehensive evaluation of the fruit quality of the main cultivars of pear (Pyrus spp.) in north China. Erwerbs-Obstbau 2022, 64, 219–227. [Google Scholar] [CrossRef]
- Han, W.; Yang, Z.; Huang, L.; Sun, C.; Yu, X.; Zhao, M. Fuzzy comprehensive evaluation of the effects of relative air humidity on the morpho-physiological traits of Pakchoi (Brassica chinensis L.) under high temperature. Sci. Hortic. 2019, 246, 971–978. [Google Scholar] [CrossRef]
- Peakall, R.; Smouse, P.E. GENALEX 6: Genetic analysis in Excel. Population genetic software for teaching and research. Mol. Ecol. Notes 2006, 6, 288–295. [Google Scholar] [CrossRef]
- Liu, K.; Muse, S.V. PowerMarker: An integrated analysis environment for genetic marker analysis. Bioinformatics 2005, 21, 2128–2129. [Google Scholar] [CrossRef] [Green Version]
- Tamura, K.; Stecher, G.; Kumar, S. MEGA11: Molecular evolutionary genetics analysis version 11. Mol. Biol. Evol. 2021, 38, 3022–3027. [Google Scholar] [CrossRef]
- De Beukelaer, H.; Davenport, G.F.; Fack, V. Core Hunter 3: Flexible core subset selection. BMC Bioinform. 2018, 19, 203–215. [Google Scholar] [CrossRef]
- The SPSSAU Project. SPSSAU (Version 23.0) [Online Application Software]. Available online: https://www.spssau.com (accessed on 13 March 2023).
- Kozak, M.; Kang, M.S. R: Modern Tool for Scientific Computing. Nat. Sci. 2007, 5, 41–43. [Google Scholar]
- Chen, C. Extensions of the TOPSIS for group decision-making under fuzzy environment. Fuzzy Sets Syst. 2000, 114, 1–9. [Google Scholar] [CrossRef]
- Gong, F.; Geng, Y.; Zhang, P.; Zhang, F.; Fan, X.; Liu, Y. Genetic diversity and structure of a core collection of Huangqi (Astragalus ssp.) developed using genomic simple sequence repeat markers. Genet. Resour. Crop Evol. 2022, 70, 571–585. [Google Scholar] [CrossRef]
- Cuevas, H.E.; Prom, L.K. Evaluation of genetic diversity, agronomic traits, and anthracnose resistance in the NPGS Sudan Sorghum Core collection. Bmc Genom. 2020, 21, 88–103. [Google Scholar] [CrossRef] [PubMed] [Green Version]
- Soleimani, B.; Lehnert, H.; Keilwagen, J.; Plieske, J.; Ordon, F.; Naseri Rad, S.; Ganal, M.; Beier, S.; Perovic, D. Comparison between core set selection methods using different Illumina marker platforms: A case study of assessment of diversity in wheat. Front. Plant Sci. 2020, 11, 1040–1051. [Google Scholar] [CrossRef] [PubMed]
- Kelblerová, R.; Dvořák, J.; Korecký, J. Genetic Diversity Maximization as a Strategy for Resilient Forest Ecosystems: A Case Study on Norway Spruce. Forests 2022, 13, 489–502. [Google Scholar] [CrossRef]
- Nie, X.; Wang, Z.; Liu, N.; Li, S.; Yan, B.; Yu, X.; Zhang, Q.; Fang, K.; Zhao, Y.; Xin, C. Fingerprinting 146 Chinese chestnut (Castanea mollissima Blume) accessions and selecting a core collection using SSR markers. J. Integr. Agric. 2021, 20, 1277–1286. [Google Scholar] [CrossRef]
- Razieh, M.; Mohammad, R.D.; Darab, H.; Mehrshad, Z.; Elisa, V.; Sabrina, M.; Fariborz, Z.N. Development of a core collection in Iranian walnut (Juglans regia L.) germplasm using the phenotypic diversity. Sci. Hortic. 2019, 249, 439–448. [Google Scholar]
- Dong, W.; Tian, H.; Wang, D.; Yu, L.; Duan, X.; Liu, S.; Chen, D. Development of 28 EST-SSR markers based on transcriptome sequences of Gobiobotia filifer and cross-species amplification. J. Appl. Ichthyol. 2019, 35, 1295–1299. [Google Scholar] [CrossRef]
- Brown, A.H.D. Core collections: A practical approach to genetic resources management. Genome 1989, 31, 818–824. [Google Scholar] [CrossRef]
- Duan, H.; Cao, S.; Zheng, H.; Hu, D.; Lin, J.; Cui, B.; Lin, H.; Hu, R.; Wu, B.; Sun, Y.; et al. Genetic Characterization of Chinese fir from Six Provinces in Southern China and Construction of a Core Collection. Sci. Rep. 2017, 7, 138–148. [Google Scholar] [CrossRef] [Green Version]
- Yanfang, Z.; Dechang, H.; Jincheng, Z.; Ping, Z.; Zhaohong, W.; Chuanjie, C. Development of a mulberry core collection originated in China to enhance germplasm conservation. Crop Breed. Appl. Biotechnol. 2019, 19, 55–61. [Google Scholar] [CrossRef]
- Sa, K.J.; Kim, D.M.; Oh, J.S.; Park, H.; Hyun, D.Y.; Lee, S.; Rhee, J.H.; Lee, J.K. Construction of a core collection of native Perilla germplasm collected from South Korea based on SSR markers and morphological characteristics. Sci. Rep. 2021, 11, 238–251. [Google Scholar] [CrossRef]
- Xue, H.; Yu, X.; Fu, P.; Liu, B.; Zhang, S.; Li, J.; Zhai, W.; Lu, N.; Zhao, X.; Wang, J.; et al. Construction of the Core Collection of Catalpa fargesii f. duclouxii (Huangxinzimu) Based on Molecular Markers and Phenotypic Traits. Forests 2021, 12, 1518–1529. [Google Scholar] [CrossRef]
- Liu, J.; Xiaomin, L.; Yueqin, L.; Chengyu, X.; Ying, X.; Guolin, C.; Jian, L. Evaluation of genetic diversity and development of core collections of industrial brewing yeast using ISSR markers. Arch. Microbiol. 2020, 203, 1–8. [Google Scholar] [CrossRef]
- Wang, Y.; Yang, T.; Xue, W.; Sun, X.; Liu, H.; Wang, D.; Wang, H.; Wang, X.; Zhang, G.; Wei, Z. Develop a preliminary core germplasm with the novel polymorphism EST-SSRs derived from three transcriptomes of colored calla lily (Zantedeschia hybrida). Front. Plant Sci. 2023, 14, 73–85. [Google Scholar] [CrossRef]
- Yang, H.; Liu, Q.; Zhang, R.; Zhou, Z. Genetic diversity of second generation-parental germplasm of masson pine revealed by SSR markers and establishment of a core germplasm collection. Scand. J. For. Res. 2021, 36, 524–531. [Google Scholar] [CrossRef]
- Bhattacharjee, R.; Khairwal, I.S.; Bramel, P.J.; Reddy, K.N. Establishment of a pearl millet [Pennisetum glaucum (L.) R. Br.] core collection based on geographical distribution and quantitative traits. Euphytica 2007, 155, 35–45. [Google Scholar] [CrossRef] [Green Version]
- Upadhyaya, H.D.; Ortiz, R.; Bramel, P.J.; Singh, S. Development of a groundnut core collection using taxonomical, geographical and morphological descriptors. Genet. Resour. Crop Evol. 2003, 50, 139–148. [Google Scholar] [CrossRef]
- Li, Y.; Shi, Y.; Cao, Y.; Wang, T. Establishment of a core collection for maize germplasm preserved in Chinese National Genebank using geographic distribution and characterization data. Genet. Resour. Crop Evol. 2005, 51, 845–852. [Google Scholar] [CrossRef]
- Giauque, H.; Connor, E.W.; Hawkes, C.V. Endophyte traits relevant to stress tolerance, resource use and habitat of origin predict effects on host plants. New Phytol. 2019, 221, 2239–2249. [Google Scholar] [CrossRef]
- Jin, N.; Jin, L.; Luo, S.; Tang, Z.; Liu, Z.; Wei, S.; Liu, F.; Zhao, X.; Yu, J.; Zhong, Y. Comprehensive evaluation of amino acids and polyphenols in 69 varieties of green cabbage (Brassica oleracea L. var. capitata L.) based on multivariate statistical analysis. Molecules 2021, 26, 5355–5370. [Google Scholar] [CrossRef]
- Laughlin, D.C.; Gremer, J.R.; Adler, P.B.; Mitchell, R.M.; Moore, M.M. The net effect of functional traits on fitness. Trends Ecol. Evol. 2020, 35, 1037–1047. [Google Scholar] [CrossRef]
- Dargan, S.; Kumar, M. A comprehensive survey on the biometric recognition systems based on physiological and behavioral modalities. Expert Syst. Appl. 2020, 143, 113–140. [Google Scholar] [CrossRef]
- Cao, X.; Jiang, F.; Wang, X.; Zang, Y.; Wu, Z. Comprehensive evaluation and screening for chilling-tolerance in tomato lines at the seedling stage. Euphytica 2015, 205, 569–584. [Google Scholar] [CrossRef]
- Liu, X.; Wang, S.; Deng, X.; Zhang, Z.; Yin, L. Comprehensive evaluation of physiological traits under nitrogen stress and participation of linolenic acid in nitrogen-deficiency response in wheat seedlings. BMC Plant Biol. 2020, 20, 501–517. [Google Scholar] [CrossRef] [PubMed]
- Şahin, C.B.; İşler, N. Foliar applied zinc and iron effects on yield and yield components of soybean: Determination by PCA analysis. Commun. Soil Sci. Plant Anal. 2021, 52, 212–221. [Google Scholar] [CrossRef]
- Verma, M.K.; Lal, S.; Sharma, V.K.; Choudhary, H.; Ahmed, N. PCA and genetic divergence analysis in pomegranate (Punica granatum L.) cultivars. Int. J. Innov. Hortic. 2019, 8, 45–50. [Google Scholar]
- Wang, B.; Xie, H.; Ren, H.; Li, X.; Chen, L.; Wu, B. Application of AHP, TOPSIS, and TFNs to plant selection for phytoremediation of petroleum-contaminated soils in shale gas and oil fields. J. Clean. Prod. 2019, 233, 13–22. [Google Scholar] [CrossRef]
- Wang, Z.; Yang, P.; Peng, H.; Li, C.; Yue, C.; Li, W.; Jiang, X. Comprehensive evaluation of 47 tea [Camellia sinensis (L.) O. Kuntze] germplasm based on entropy weight method and grey relational degree. Genet. Resour. Crop Evol. 2021, 68, 3257–3270. [Google Scholar] [CrossRef]
- Çelikbilek, Y.; Tüysüz, F. An in-depth review of theory of the TOPSIS method: An experimental analysis. J. Manag. Anal. 2020, 7, 281–300. [Google Scholar] [CrossRef]
- De Lima Silva, D.F.; De Almeida Filho, A.T. Sorting with TOPSIS through boundary and characteristic profiles. Comput. Ind. Eng. 2020, 141, 1063–1078. [Google Scholar] [CrossRef]
- Li, Z.; Luo, Z.; Wang, Y.; Fan, G.; Zhang, J. Suitability evaluation system for the shallow geothermal energy implementation in region by Entropy Weight Method and TOPSIS method. Renew. Energy 2022, 184, 564–576. [Google Scholar] [CrossRef]
- Liang, C.; Yu, S.; Zhang, H.; Wang, Z.; Li, F. Economic Evaluation of Drought Resistance Measures for Maize Seed Production Based on TOPSIS Model and Combination Weighting Optimization. Water 2022, 14, 3262–3280. [Google Scholar] [CrossRef]
- Chen, P. Effects of the entropy weight on TOPSIS. Expert Syst. Appl. 2020, 168, 114–186. [Google Scholar] [CrossRef]
- Abdi, H.; Williams, L.J. Principal component analysis. Wiley Interdiscip. Rev. Comput. Stat. 2010, 2, 433–459. [Google Scholar] [CrossRef]
- Makowski, D.; Ben-Shachar, M.S.; Patil, I.; Lüdecke, D. Methods and algorithms for correlation analysis in R. J. Open Source Softw. 2020, 5, 2306–2310. [Google Scholar] [CrossRef]
Figure 1.
Comparison of capture rates of genetic diversity parameters in alternative populations. Abscissa: These represent alternative core collections, accounting for 5%, 10%, 15%, 20%, 25%, and 30% of breeding populations using Core Hunter 3 and Powermark, respectively. Ordinate: The numerical value represents the proportion of the genetic diversity parameters of alternative core populations compared to the breeding population.
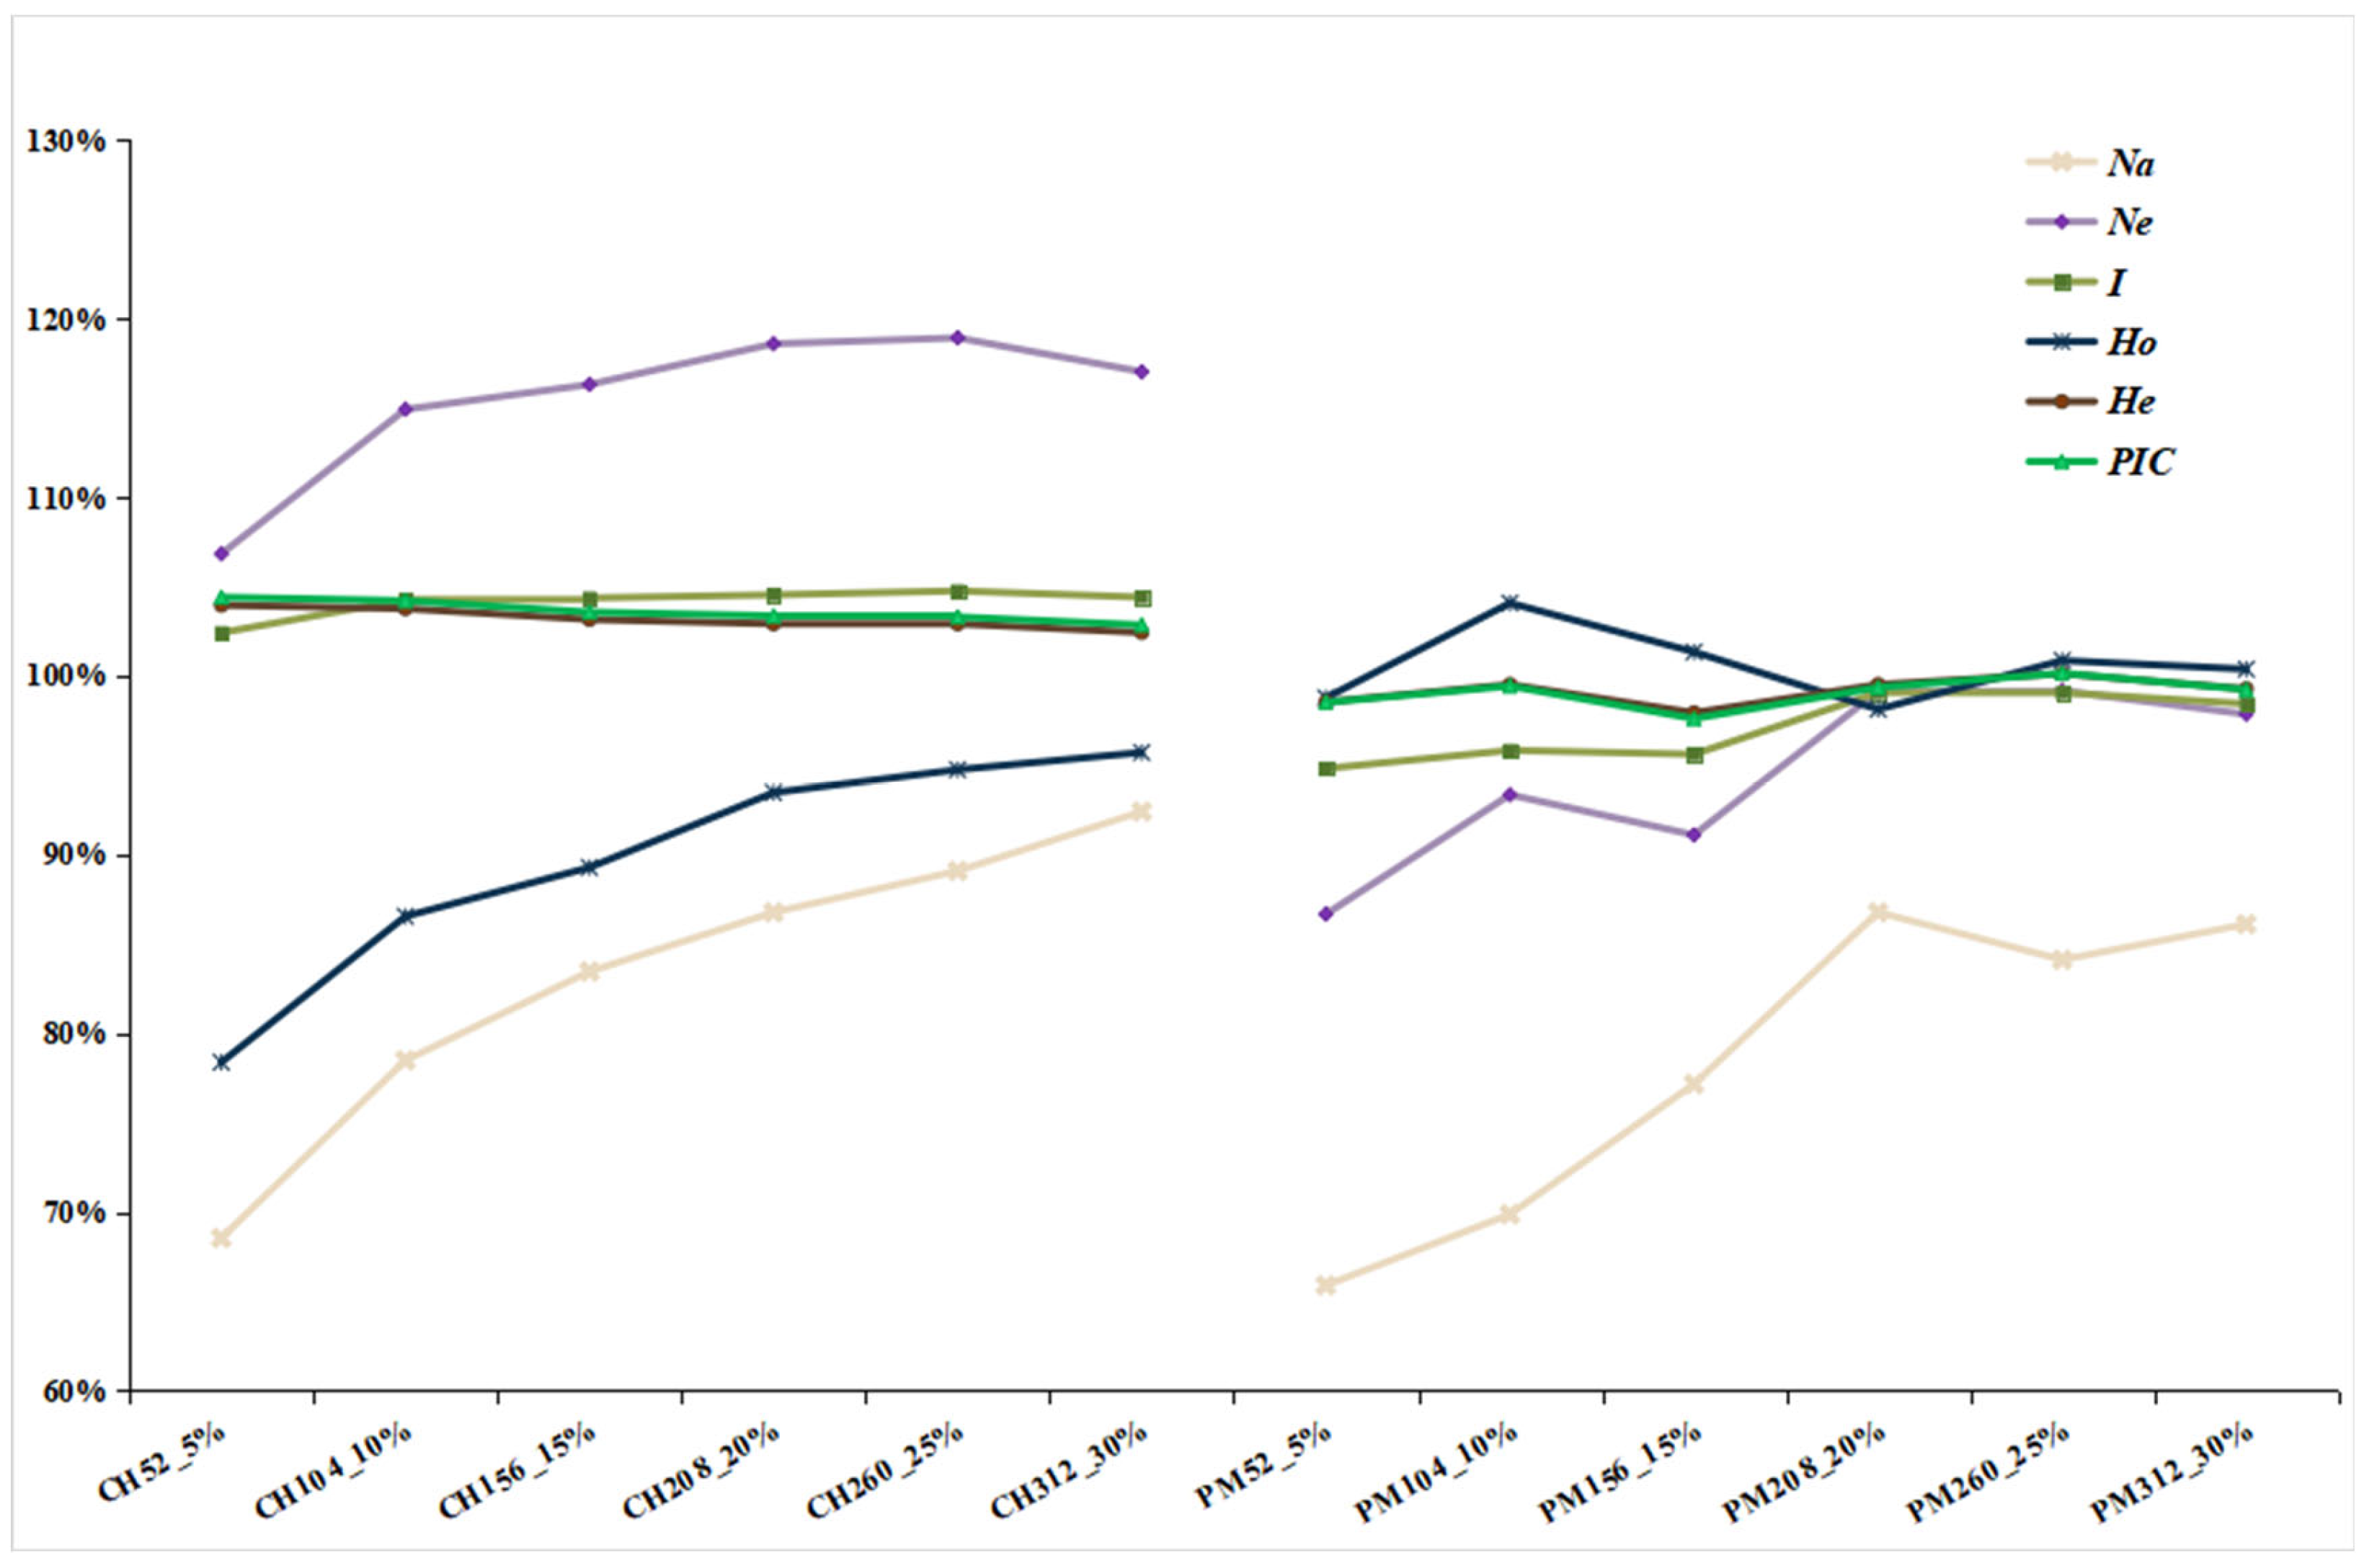
Figure 2.
Analysis results of the genetic structure of the breeding population. (A) Clusters 1 and 2 represent two genetic clusters in the phylogenetic tree of the breeding population. (B) A graph showing the relationship between Delta K and K values. (C) Estimation of the genetic structure of the T. sinensis breeding population with different K values (K = 2–7).

Figure 3.
PCoA of core collection and retained population. Core: core collection; Retain: some individuals excluding core collection in breeding population.
Figure 3.
PCoA of core collection and retained population. Core: core collection; Retain: some individuals excluding core collection in breeding population.

Figure 4.
Correlation and significance analysis of eight agronomic traits. **: extremely significant correlation (p < 0.01), *: significant correlation (p < 0.05).
Figure 4.
Correlation and significance analysis of eight agronomic traits. **: extremely significant correlation (p < 0.01), *: significant correlation (p < 0.05).

Table 1.
SSR information.
| Loci | Motifs | Target _Length (bp) | Primer_Sequence |
|---|---|---|---|
| TC10 | TC (7) | 182 | F: TAGAGACAAGTTTGAGTGGAGCG R: GCATGTGATGTAGGAGTCTGAACA |
| TC11 | GA (8) | 232 | F: ACCATGTCAAGAAACCTTTTGTAACA R: TGAGGCTAAATGTGCATCTCTTGA |
| TcB27 | AG (8) | 191 | F: GGCAGAGAAGAGCGGTTTTA R: CGGATCTTTCGCAACGTAGT |
| XC107 | CA (19) | 238 | F: GGAATTAATCAAGGTTACGCATGCA R: ACTCTTTCCCTAACTTATGGTGATTTCA |
| XC193 | TG (16) | 237 | F: TGAATGTGGCTAGTCTGGAAAATTT R: TCTCTTAAGCCTCGATGATGTGT |
| XC227 | TC (17) | 263 | F: AGATGCCTTCTTGAGCTTGAAAGA R: GGTTATTCCCAAGGTCAACAGAAA |
| XC239 | CA (14) | 277 | F: ACATAACAACCGTCACACACTCG R: CAGTCCACACCCCAAACTTAGAT |
| XC301 | TG (25) | 242 | F: CCCACCGACCTCACTTTAAATCT R: TCCAACACAATCACGTCATTCTCA |
| XC316 | AG (23) | 248 | F: TCCAAGAGAAATCCACCACTTGA R: TGACCATTCTACCCTTATGTTCAGA |
| XC320 | AG (15) | 256 | F: GGCCACTCCTGCATACACAA R: AGACATGGTGGCCCTCCTAC |
| XC35 | CT (10) | 259 | F: TGACATGATGGCGATTTACAGGT R: TGTTAAACCTTCTCCTGACTAATCCA |
| XC41 | AC (12) | 186 | F: GCTTTACTGGGATTGCTGGGAAT R: TTTACACTGAACTCTGCAATCACTT |
| XC66 | CAT (9) | 190 | F: TATGGCCCATGATCATCGTCAAC R: AGTGTGATGTAGAGGAGGTGGAG |
Table 2.
Genetic diversity of different EST-SSR loci.
| Loci | Na | Ne | I | Ho | He | PIC |
|---|---|---|---|---|---|---|
| TC10 | 27 | 9.922 | 2.7 | 0.639 | 0.899 | 0.893 |
| TC11 | 20 | 3.869 | 1.572 | 0.481 | 0.742 | 0.697 |
| TcB27 | 15 | 4.138 | 1.63 | 0.643 | 0.758 | 0.721 |
| XC107 | 35 | 13.137 | 2.906 | 0.506 | 0.924 | 0.919 |
| XC193 | 26 | 11.259 | 2.756 | 0.513 | 0.911 | 0.906 |
| XC227 | 22 | 11.281 | 2.608 | 0.811 | 0.911 | 0.905 |
| XC239 | 19 | 2.234 | 1.482 | 0.524 | 0.552 | 0.542 |
| XC301 | 41 | 9.807 | 2.807 | 0.448 | 0.898 | 0.892 |
| XC316 | 30 | 18.419 | 3.084 | 0.603 | 0.946 | 0.943 |
| XC320 | 23 | 5.995 | 2.282 | 0.942 | 0.833 | 0.822 |
| XC35 | 15 | 5.284 | 1.976 | 0.696 | 0.811 | 0.792 |
| XC41 | 20 | 7.263 | 2.319 | 0.779 | 0.862 | 0.851 |
| XC66 | 9 | 2.879 | 1.292 | 0.498 | 0.653 | 0.59 |
| Mean | 23.231 | 8.114 | 2.263 | 0.622 | 0.823 | 0.806 |
Na: number of alleles; Ne: number of effective alleles; I: Shannon diversity index; Ho: observed heterozygosity; He: expected heterozygosity; PIC: polymorphic information content.
Table 3.
Statistics of selected individuals of the core collection of different genetic clusters.
| Cluster | Number | Proportion | |
|---|---|---|---|
| Cluster1 | 263 | 25.29% | |
| Core | 23 | 2.21% | |
| Retain | 240 | 23.08% | |
| Cluster2 | 777 | 74.71% | |
| Core | 185 | 17.79% | |
| Retain | 592 | 56.92% | |
| Total | 1040 | 100.00% |
Cluster: two genetic clusters of the genetic structure of the breeding population; Number: number of individuals; Proportion: the proportion in each cluster and breeding population.
Table 4.
Statistics of eight agronomic traits in the core collection.
| Traits | Min | Max | Mean ± SD | CV |
|---|---|---|---|---|
| H/cm | 40.00 | 280.00 | 160.09 ± 45.058 | 28.15% |
| FZS/unit | 1.00 | 9.00 | 3.04 ± 1.584 | 52.15% |
| ZCFY/cm | 25.00 | 102.67 | 63.50 ± 11.866 | 18.69% |
| FYDS/pair | 8.00 | 24.50 | 15.25 ± 3.260 | 21.38% |
| FYSL/unit | 10.00 | 70.00 | 33.03 ± 10.879 | 32.93% |
| YBM/grade | 1.00 | 5.00 | 2.04 ± 1.309 | 64.06% |
| FYTL/unit | 0.00 | 9.00 | 2.31 ± 2.127 | 92.16% |
| FYBS/unit | 0.00 | 34.00 | 4.82 ± 3.713 | 77.07% |
FYSL: number of compound leaves, H: height of tree, FZS: number of branches, ZCFY: length of longest compound leaves, FYDS: logarithm of compound leaves, YBM: number of leaf dorsal hairs, FYTL: number of basal compound leaf shedding, FYBS: number of basal compound leaf discoloration, CV: coefficient of variation.
Table 5.
Weight value of each trait based on PCA.
| Traits | PCA1 | PCA2 | PCA3 | Comprehensive Score | Weight |
|---|---|---|---|---|---|
| H | 0.412 | 0.482 | 0.138 | 0.377 | 15.42% |
| FZS | 0.078 | 0.080 | 0.696 | 0.219 | 8.97% |
| ZCFY | 0.574 | 0.006 | 0.290 | 0.293 | 12.01% |
| FYDS | 0.479 | 0.299 | 0.284 | 0.366 | 15.00% |
| FYSL | 0.265 | 0.543 | 0.160 | 0.347 | 14.20% |
| YBM | 0.420 | 0.317 | 0.182 | 0.327 | 13.37% |
| FYTL | 0.112 | 0.282 | 0.462 | 0.256 | 10.49% |
| FYBS | 0.084 | 0.445 | 0.243 | 0.257 | 10.53% |
| Eigenvalue | 1.958 | 1.899 | 1.132 | ||
| Variance interpretation rate | 24.47% | 23.73% | 14.15% |
Disclaimer/Publisher’s Note: The statements, opinions and data contained in all publications are solely those of the individual author(s) and contributor(s) and not of MDPI and/or the editor(s). MDPI and/or the editor(s) disclaim responsibility for any injury to people or property resulting from any ideas, methods, instructions or products referred to in the content. |
© 2023 by the authors. Licensee MDPI, Basel, Switzerland. This article is an open access article distributed under the terms and conditions of the Creative Commons Attribution (CC BY) license (https://creativecommons.org/licenses/by/4.0/).
Share and Cite
MDPI and ACS Style
Dai, J.; Fan, Y.; Diao, S.; Yin, H.; Han, X.; Liu, J. Construction of Core Collection and Phenotypic Evaluation of Toona sinensis. Forests 2023, 14, 1269. https://doi.org/10.3390/f14061269
AMA Style
Dai J, Fan Y, Diao S, Yin H, Han X, Liu J. Construction of Core Collection and Phenotypic Evaluation of Toona sinensis. Forests. 2023; 14(6):1269. https://doi.org/10.3390/f14061269
Chicago/Turabian StyleDai, Jianhua, Yanru Fan, Shu Diao, Hengfu Yin, Xiaojiao Han, and Jun Liu. 2023. "Construction of Core Collection and Phenotypic Evaluation of Toona sinensis" Forests 14, no. 6: 1269. https://doi.org/10.3390/f14061269
Note that from the first issue of 2016, this journal uses article numbers instead of page numbers. See further details here.