Article

Improving Forest Canopy Height Estimation Using a Semi-Empirical Approach to Overcome TomoSAR Phase Errors

1
College of Forestry, Southwest Forestry University, Kunming 650224, China
2
Forestry 3S Engineering Technology Research Center, Southwest Forestry University, Kunming 650224, China
*
Author to whom correspondence should be addressed.
Forests 2023, 14(7), 1479; https://doi.org/10.3390/f14071479
Submission received: 8 May 2023 / Revised: 10 July 2023 / Accepted: 17 July 2023 / Published: 19 July 2023

Abstract

:
Forest canopy height is an important forest indicator parameter. Synthetic aperture radar tomography (TomoSAR) is an effective method to characterize forest canopy height and describe forest 3D structure; however, the residual phase error of TomoSAR affects the focus of the relative reflectance and can lead to errors in forest canopy height estimation. Therefore, this paper proposes a semi-empirical method to overcome the residual phase effects on forest canopy height estimation. In this study, we used airborne multi-baseline UAVSAR data to estimate forest canopy height via TomoSAR techniques and applied a semi-empirical method to improve forest canopy height estimation without phase calibration to mitigate the effects of phase error. The process is divided into three stages: the first step uses a semi-empirical method to initially determine the optimal relative reflectance loss threshold (K) by excluding the inverse extremes; in the second and third steps, the percentile height was used to gradually reduce the height interval between the upper and lower envelopes to minimize overestimation of extreme values and the lower vegetation. When the root mean square error (RMSE) was minimized, the percentile combinations were determined between the inversion results and a LiDAR dataset of the area. The results show that the canopy height estimation results are not satisfactory when relying solely on the K value to estimate the height difference between the envelope at the top of the forest and the ground; the best result was obtained when K = 0.4, but the corresponding R2 value was only 0.13, and the RMSE was 15.23 m. In our proposed method, the K value is determined as 0.3 by excluding the extreme values of the inversion result in the initial step—the corresponding R2 and RMSE values were 0.59 and 10.73 m, respectively, representing an RMSE decrease of 29.54% relative to the initial K value. After two steps of correction overestimation, the inversion accuracy was significantly improved with an R2 value of 0.65 and an RMSE of 9.69 m, corresponding to an RMSE decrease of 36.38%. Overall, the findings of the study represent an important reference for optimizing future spaceborne TomoSAR forest canopy height estimates.

1. Introduction

Forests play a crucial role in the Earth’s carbon cycle, and canopy height is an important parameter indicating forest biomass and carbon stock. Accurate forest canopy height estimation is particularly challenging in tropical forests due to difficulties in identifying the canopy and ground surface [1]. Synthetic aperture radar (SAR) has penetrating capabilities that can be used to obtain forest vertical structure information and provide reliable forest parameter estimates on a global scale [2]. The combination of polarized SAR interferometry (PolInSAR) with coherent scattering models such as the random volume over ground (RVoG) model [3,4,5] has proven to be an effective tool for forest height estimation in the last two decades; however, the PolInSAR method relies on reasonable model assumptions of the forest, and the associated parameters are difficult to calculate. In contrast, the SAR tomography (TomoSAR) technique achieves high vertical resolution through multibaseline observations, allowing scatterers at different heights within the same resolution cell to be identified and differentiated [6]. This approach has been widely used to reconstruct 3D forest structures and estimate forest parameters [6,7,8,9,10,11,12,13,14].
When applying the TomoSAR technique, there are strict requirements for the baseline and data; thus, the UAV platform remains the primary data acquisition approach. In 2009, the TropiSAR project conducted the first trial of testing TomoSAR in tropical forest areas in French Guiana; however, these data have limitations in terms of their suitability for multifrequency TomoSAR analysis for forest structure monitoring and forest structure parameter estimation. The limitations of L-band TomoSAR in tropical forests were also demonstrated by Ho Tong Minh et al. [15] using TropiSAR project airborne data and also noted in the study of El Moussawi et al. [16]. To overcome this limitation and obtain the best tomographic and interferometric data, NASA, the European Space Agency (ESA), and the Gabon Space Agency successfully conducted the AfriSAR campaigns over the dense forest of Gabon in 2015 and 2016 [17]. However, interpreting forest structure parameters based on 3D radar reflectivity information remains a challenging problem due to the complexity of forest structure and the uncertainty of SAR information [16,18,19]; therefore, optimized beamforming algorithms to improve height estimation accuracy have been proposed in subsequent studies [20,21,22].
Theoretically, TomoSAR cannot directly estimate forest height; however, this parameter can be obtained by analyzing the shape of the vertical profile because microwave scattering from forested areas necessarily occurs between the ground surface and the top of the forest canopy. The canopy height can be inverted by tracing the upper and lower envelopes of the tomographic profile in areas with known topography. The canopy height can also be estimated from TomoSAR data based on the relative reflectance (or power) loss threshold, which can be used to determine the height difference between the envelopes near the canopy and the ground surface. If a real reference height (e.g., CHM) is given and different power loss thresholds are set, the root mean square error (RMSE) between the LiDAR-CHM and TomoSAR-CHM can be calculated. The optimal power loss threshold is determined when the RMSE is minimized, and the corresponding forest canopy height at each location can be calculated [8,15,23]. This assumption is valid under optimal conditions; however, in practice, TomoSAR data are affected by phase errors, decorrelation of SAR data, complex vegetation conditions, microwave penetration of the ground surface, and uncertainties in the beam formation algorithm [24]. These issues can affect the focusing of SAR data, leading to the formation of a sidelobe in the vertical direction and thus increasing the distance between the upper and lower envelopes [10]. If the power loss threshold is relied upon exclusively for canopy height estimation, the resulting canopy height estimate will be outside a reasonable range, especially in tropical forests. This phenomenon is more pronounced if deeper microwave ground surface penetration occurs in the presence of low forest cover, which will increase the canopy height overestimation.
Given these issues, in this study, we propose a semi-empirical three-step approach to estimate forest canopy height from TomoSAR 3D reflectance information without relying on topographic phase information compensation. A semi-empirical approach is used to determine the relative reflectance loss threshold based on the a priori forest height range; this is then divided into two steps to minimize overestimation in the TomoSAR canopy height estimation process. Based on the maximum height of the study area and the inversion error range, the canopy height of each cell is initially estimated based on the reflectance loss threshold; once the estimated canopy height of a cell exceeds a reasonable range, the percentile height values corresponding to the canopy height at this location are counted, and a new estimated height value is obtained by subtracting the percentile height values near the ground surface and top of the canopy in different steps (Hth(high) − Hth(low)) to determine the correct height value. This process can be interpreted as improving the low-value overestimation by gradually decreasing the interval between the upper and lower envelopes and identifying the best constraint interval when the RMSE value between the LiDAR-CHM and TomoSAR-CHM heights is minimized. The purpose of this study is to explore a more effective and easily applicable method for TomoSAR forest canopy height inversion. Currently, the application of satellite-borne TomoSAR remains in the exploratory, experimental stage because the data conditions are not yet mature; however, the experimental findings based on the UAV platform presented in this work can provide a reference for future satellite-borne TomoSAR instruments, such as the Biomass and Tandem-L satellites [16,25,26], so that the performance of global-scale forest parameter estimation can be improved.

2. Materials and Methods

2.1. Study Area and Data

The test area is located in Lope National Park, Gabon, on the west coast of Africa (Figure 1 and Table 1), which is mainly characterized by inland tropical forests. In 2016, NASA, the ESA, and the Gabonese Space Agency collaborated on the AfriSAR project, in which NASA’s unmanned aerial vehicle synthetic aperture radar (UAVSAR) and airborne LiDAR sensors acquired L-band multibaseline, fully polarized PolInSAR data and full-waveform LVIS LiDAR datasets, respectively. From this survey, eight stacks of UAVSAR data processed by polarization calibration, baseline fine coregistration, and spectral filtering were made publicly available free of charge as single-look complexes [27]; these data were used in combination with the relative height variable RH100 of LVIS LiDAR data to validate the forest canopy height derived from TomoSAR [28]. In this study, we only tested the TomoSAR performance of the HH channel.

2.2. Methods

2.2.1. 3D Forest Structure Reconstruction

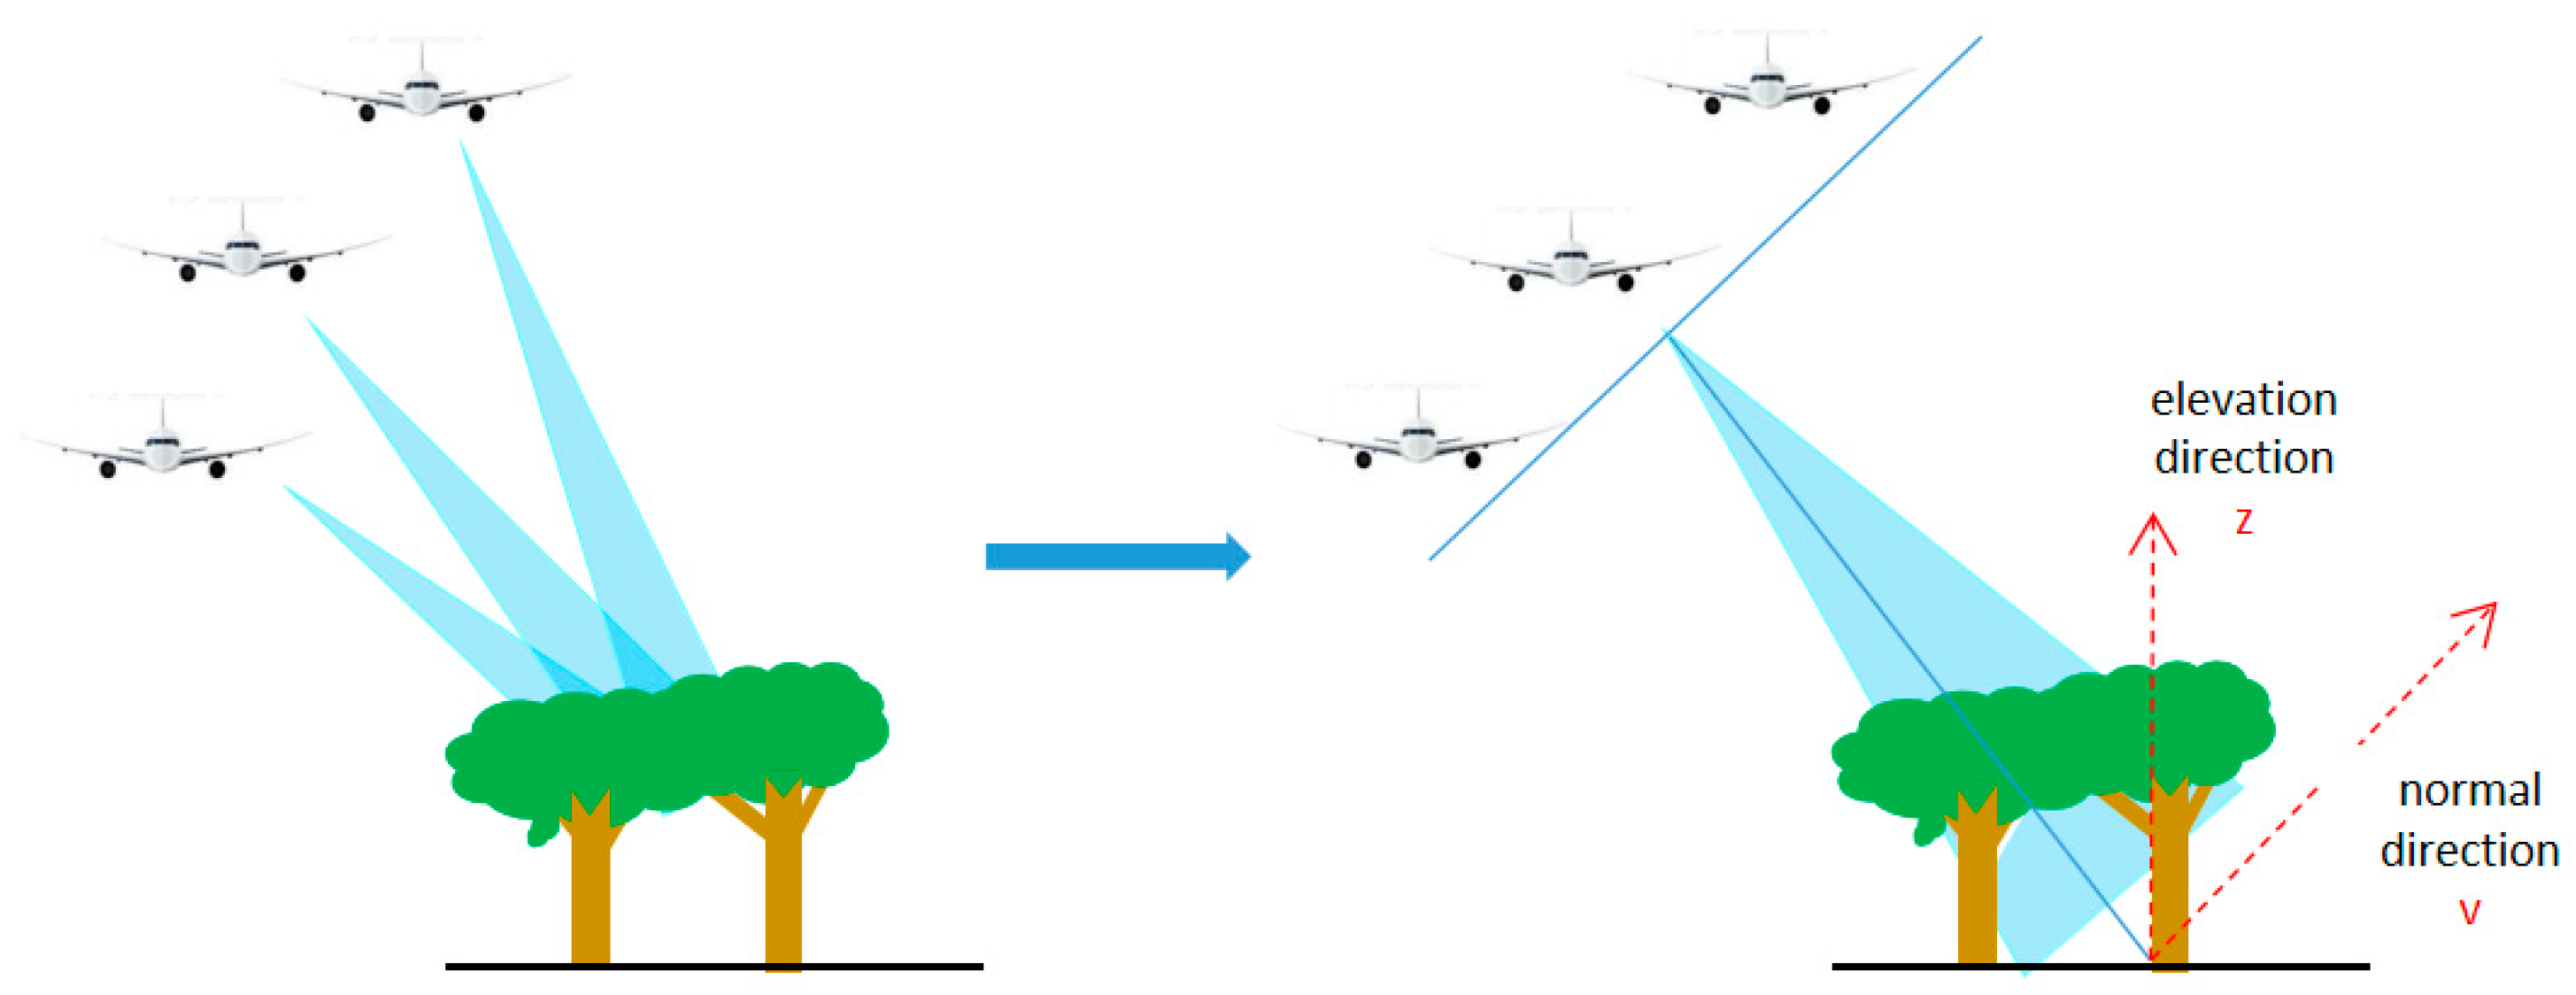
Multibaseline TomoSAR provides multiple observations of the same object acquired during multiple flights by airborne or satellite platforms. Multiple antennas of different heights form a synthetic aperture in the normal direction, thus providing elevation information [16,23,29,30,31] (Figure 2).
If the radar wavelength is sufficiently long to penetrate the canopy layer [32], multiple SAR acquisitions in the same area with slightly different views allow the forest reflectance to be quantified in three dimensions. The principle of TomoSAR involves the use of multiple near-parallel flight tracks to form a 3D image. Assuming that M antennas form M scenes of single-look complex images, the complex value yi(r,x) of a pixel (slant directional coordinate r, azimuthal coordinate x) in the i-th scene SAR image can be considered as the integral of the target scattering function in the normal direction within that resolution cell. This function can be expressed as:
y i ( r , x ) P ( r , x , v ) exp   j 4 π λ B i R v d v ,
where P(r,x,v) denotes the target reflectivity in the normal direction, v is the sampling coordinate of the signal in the normal direction, λ is the SAR wavelength, R is the slant range, and Bi is the vertical baseline of the i-th scene SAR image relative to the master image. Assuming that the sampling coordinates of the signal along the elevation direction are z and the incidence angle of the radar wave is θ, the projection of the elevation in the normal direction and the elevation direction has the following relationship:
z = v s i n θ
The problem to be solved by TomoSAR is to recover the target scattering function P(r,x,v) for each SAR resolution cell distributed along the elevation direction based on the complex observation yi(r,x). In this paper, the Capon beamforming power estimator is used to reconstruct the vertical profile of the vegetated area, which can recover the 3D backscattering profile from the multilayer SLC data.
The Capon spectral estimator is a conventional nonparametric method in TomoSAR analysis that can be used to obtain an infinite vertical profile of the vegetation without any a priori knowledge of the data’s statistical properties [16,21,30,33,34]. The method is an improved algorithm version of the conventional beamforming method based on the minimum variance criterion, which filters the signal of each array element through the optimal weighting vector to suppress noise interference and enhance the signal. Its spectral estimation equation is as follows:
P c p ( z ) = 1 a ( z ) R 1 a ( z )
where Pcp(z) is the vertical distribution function of the backscattered power estimated using the Capon algorithm, a(z) denotes the guiding vector of height z, and R denotes the covariance matrix of the multibaseline InSAR data.

2.2.2. TomoSAR-Based Forest Canopy Height Estimation

In the absence of the effect of phase errors, the forest canopy height can be obtained by tracing the relative reflectance envelope obtained from TomoSAR [35] (Figure 3):
H ( r , x ) = argmin   ( P ( H n , r , x ) P ( H c , r , x ) K )   ( K = 0.1 ,   0.2 ,   0.3 ,   0.4 , , i )
where P(Hn, r, x) is the relative reflectance at a location, Hn is the height corresponding to the relative reflectance, Hc is the height value from the LiDAR, and K is the reflectance loss value. The K value is a critical value for determining the change in TomoSAR relative reflectance in the vertical direction from forest to nonforest. The recovery of forest top height depends on the chosen K value because the canopy height is estimated from TomoSAR data by changing the distance between the upper and lower envelopes of the Capon profile based on the value of K. At each location, the RMSE between heights Hn and Hc was calculated for a given value of K (Hn(r, x) − Hc(r, x)); once the lowest RMSE value was determined, the forest canopy height was obtained for each (r, x) location.

2.2.3. Forest Canopy Height Estimation Error Correction

Based on the principles of TomoSAR, microwave scattering from the forest must occur between the ground surface and the top of the forest canopy, and the canopy height can be inverted by tracing the upper envelope of the tomographic profile. However, in practice, issues such as phase errors, SAR data decoherence, complex vegetation conditions, microwave penetration, and uncertainties in the beam formation algorithm can lead to sidelobe formation in the vertical direction above the ground surface, indirectly resulting in envelope estimation errors. Therefore, topographic phase calibration of TomoSAR data should be considered to compensate for phase residuals that affect the focus of SAR data. The accurate topographic phase is reliant on high-accuracy digital elevation models (DEMs), such as LiDAR-DEM; however, such data are not necessarily available for practical applications due to the limited coverage of LiDAR in many areas. In this study, we did not use external DEM information to remove topographic phase errors.
Since errors affect the SAR data focus and the appearance of sidelobes, this can increase the interval between the upper and lower envelopes, leading to canopy height overestimation. Therefore, we propose a semi-empirical, three-step approach to estimate forest canopy height using 3D reflectance information from TomoSAR. The general concept involves the use of a semi-empirical iterative approach to optimize the K value threshold and identify a threshold to compress the interval between the upper and lower envelopes and minimize the overestimation based on the percentile height in two steps. We use the following Equation to estimate the height of the forest canopy, which differs from Equation (8) in that we determine the K value based on the overall RMSE rather than values for each pixel individually:
H = argmin   ( P ( H n ) P ( H c ) K ) ( K = 0.1 ,   0.2 ,   0.3 ,   0.4 , , i )
where Hn is the TomoSAR estimated value and Hc is the LiDAR-RH100 value.
In the first step, the K values were determined. First, the maximum forest height (hmax) of the study area was determined; the upper and lower envelopes of TomoSAR were then estimated by setting different step K values to calculate the canopy height, and samples with inversion heights greater than hmax were excluded. The optimal K value was determined when the RMSE between the inversion result and LiDAR-RH100 was minimized.
H = argmin   ( Hn Hc ) K ) ( K = 0.1 ,   0.2 ,   0.3 ,   0.4 ; Hn < h max )
where Hn is the TomoSAR estimated value, Hc is the LiDAR-RH100 value, and  h max  is the extreme-value threshold.
In the second step, error correction is performed for the predicted height extremes, i.e., heights greater than hmax. When the estimated canopy height of a pixel exceeds hmax, the percentile height values corresponding to this canopy height range are counted; the percentile height values near the top and canopy in this bracket are then subtracted in different steps (Hth(high) − Hth(low)), as shown in Equation (7). This process effectively improves the underestimation by gradually decreasing the distance between the upper and lower envelopes and determining the constraint interval that minimizes the RMSE between the LiDAR-RH100 and TomoSAR height values.
H n 1 = h i h t h ( p ) h t h ( 100 p ) h i < h m a x   h i h max ( p = 90 , 80 , 70 , 60 )
where Hn1 is the result of extreme value correction, hi is the forest canopy height as estimated by TomoSAR at a pixel location, hth(p) denotes the percentile height of hi, and  h m a x  is the extreme value threshold.
In the third step, overestimation correction is performed within a reasonable range. As described above, the coverage of lower vegetation areas is small, and the presence of SAR data focus and penetration also cause overestimation; accordingly, low canopy overestimation correction is performed using the same method as the second step. First, a reasonable threshold value hmin is set based on the interval in which the overestimation occurs. When the estimated canopy height of a pixel is less than hmin, the percentile height value corresponding to the canopy height at this location is counted. The same method described in the second step is used to determine the constraint interval.
H n = h n 1 h n 1 t h ( p ) h n 1 t h ( 100 p ) h i > h m i n   h i h min ( p = 90 , 80 , 70 , 60 )
where Hn is the result of overestimation correction for low vegetation, hi is the forest canopy height as estimated by TomoSAR at a pixel location, hth(p) denotes the percentile height of hi, and  h m i n  is the minimum value threshold.

2.2.4. Evaluation Indicators

The correction results were evaluated using the determination coefficient (R2), RMSE, and bias (BIAS) metrics.
R 2 = 1 i = 1 n ( H i H ^ i ) 2 i = 1 n ( H i H - ) 2 R M S E = i = 1 n ( H i H ^ i ) 2 n B I A S = i = 1 n ( H i H ^ i ) n
where Hi is the LiDAR canopy height;  H ¯  is the mean TomoSAR canopy height, and  H ^ i  is the TomoSAR canopy height.

3. Results

3.1. Initial Determination of the Reflectivity Loss Threshold K

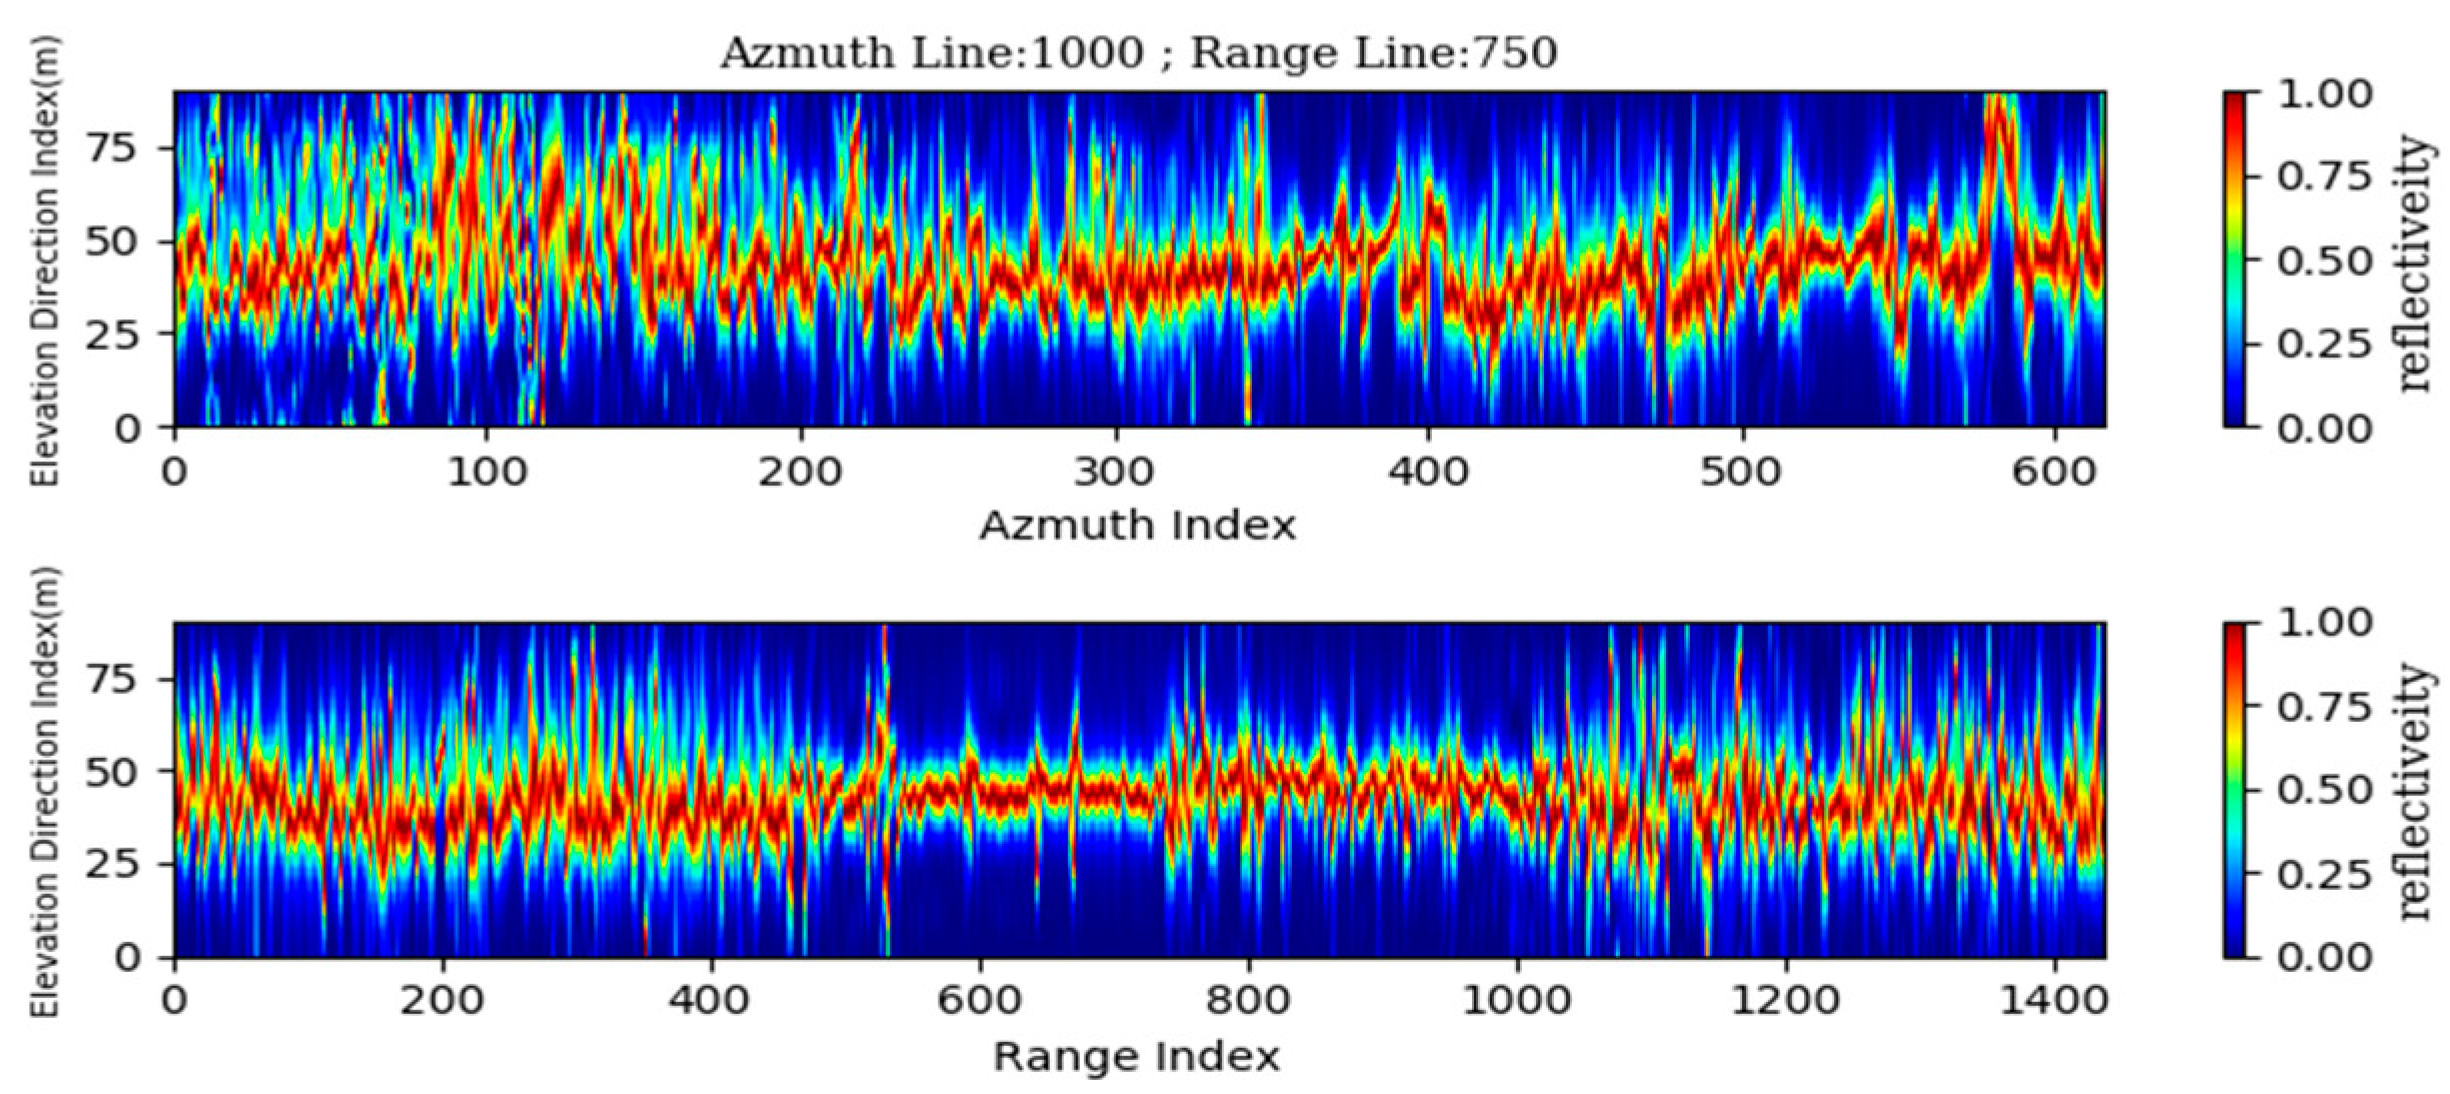
Based on the principles of TomoSAR, we set the height input range as −45 m to 45 m to obtain the relative reflectance at different heights, as shown in Figure 4. For ease of understanding of the forest canopy height calculation, we denote the height value input range as the index value in the elevation direction because the forest canopy height is equal to the difference between the upper and lower envelope index pair.
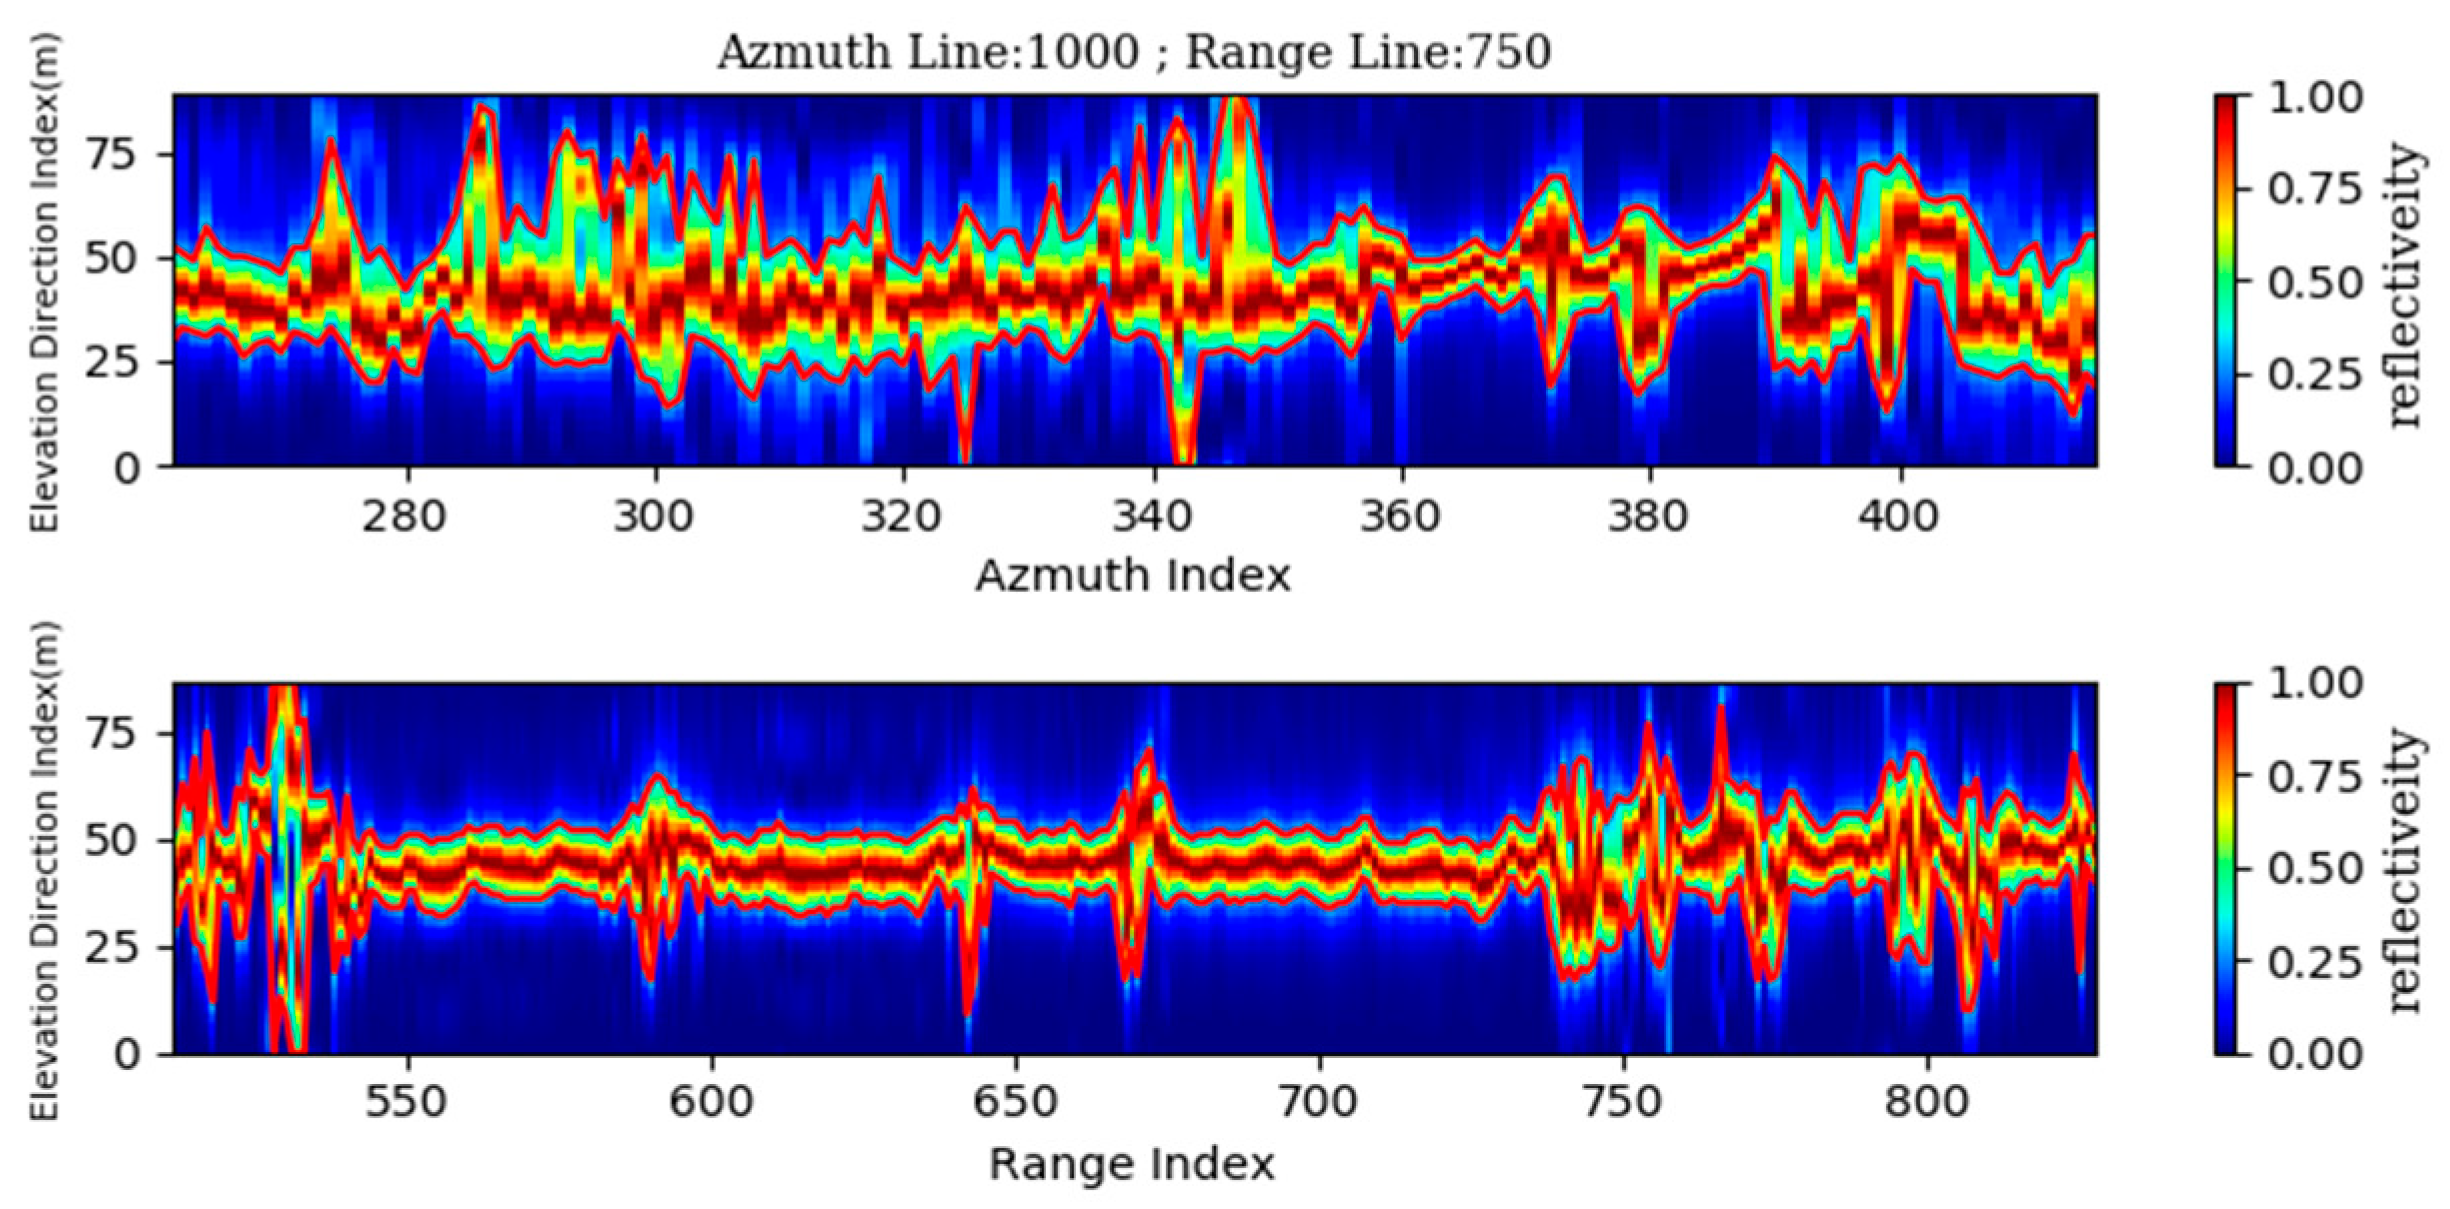
Based on the relative reflectance variation curves of different pixel points (Figure 5), the value of K on the vertical profile can be determined as approximately between 0.1 and 0.4. Accordingly, a suitable loss threshold can be set to estimate the envelope of the top of the canopy and the ground surface, as shown in Figure 6. The canopy height is then obtained by subtracting the index values of the upper and lower envelopes.
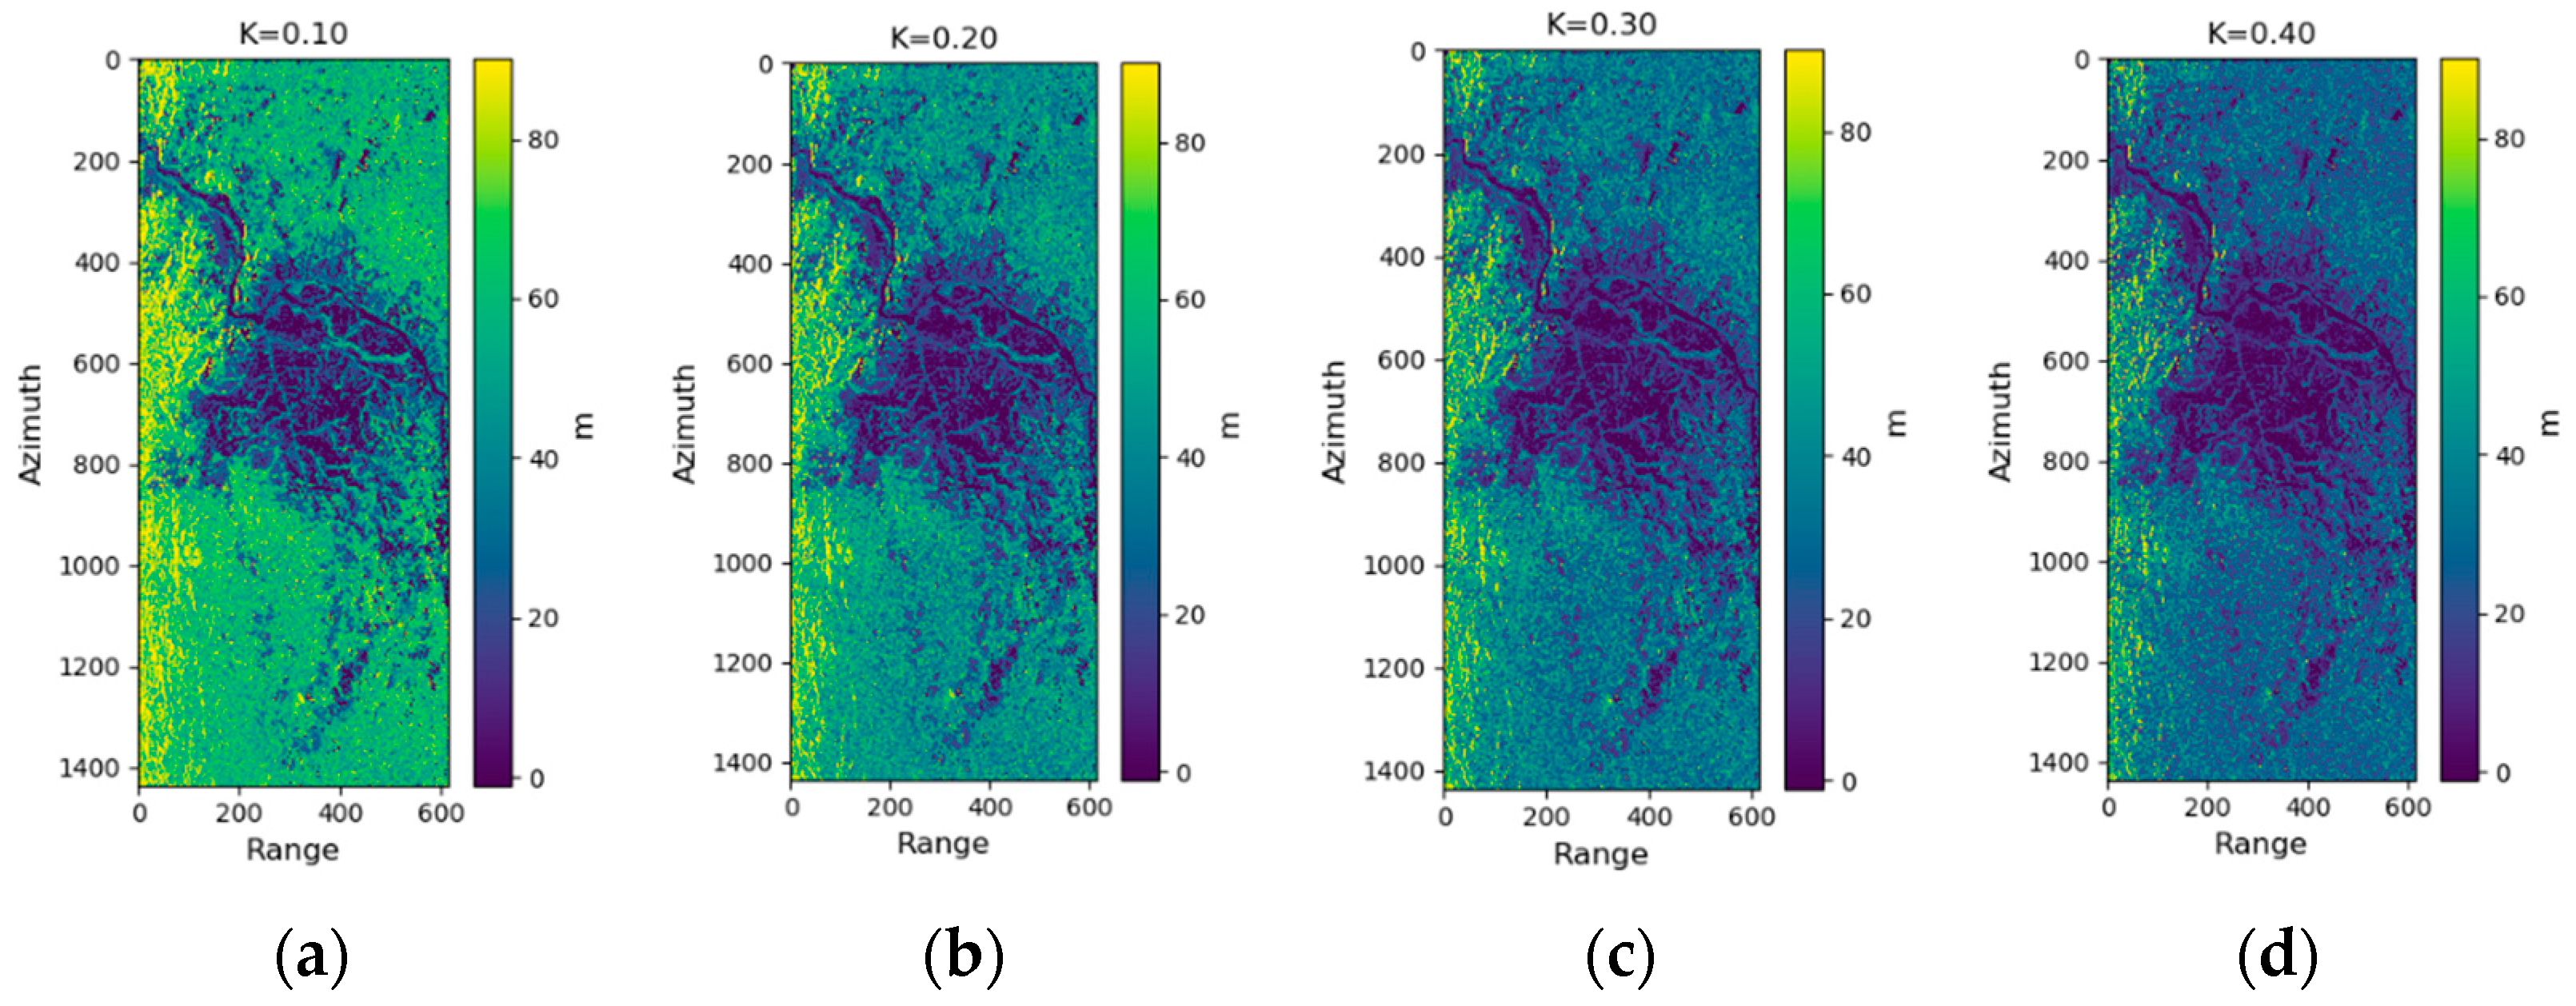
In this study, we chose different values of K and selected 6357 LiDAR-RH100 height values to validate the inversion results and determine the most suitable loss threshold K based on the RMSE calculated between the TomoSAR-derived canopy height results and the LiDAR-RH100 values. We set the K values (K = 0.1, 0.2, 0.3, and 0.4) to estimate the envelope at the top of the canopy and the ground surface. Although only four intervals were chosen to determine the loss threshold K in this study, this does not affect our conclusions. If a globally optimal K value is sought, smaller intervals can be set or determined iteratively, which can be investigated in future studies. As shown in Figure 7 and Figure 8, when K = 0.1, the RMSE of the validation results is 29.55 m, and the results show an overall overestimation with overestimated samples predominantly clustered in the inversion height range above 75 m (Figure 8a). When K = 0.2, the RMSE value is 21.41 m; in this scenario, the overestimation issue is reduced, but overestimated values are still clustered at inversion heights above 65 m (Figure 8b). When K = 0.3, the RMSE is 17.00 m, and the overall overestimation is further improved; however, overestimation is still observed at inversion heights greater than 62 m (Figure 8c). Finally, when K = 0.4, the RMSE is 15.23 m, which represents the smallest value among the tested configurations; in this case, the scatter plot shows that some value overestimation remains, and the issue of underestimation becomes more serious (Figure 8d).

3.2. Optimization of K Value Determination

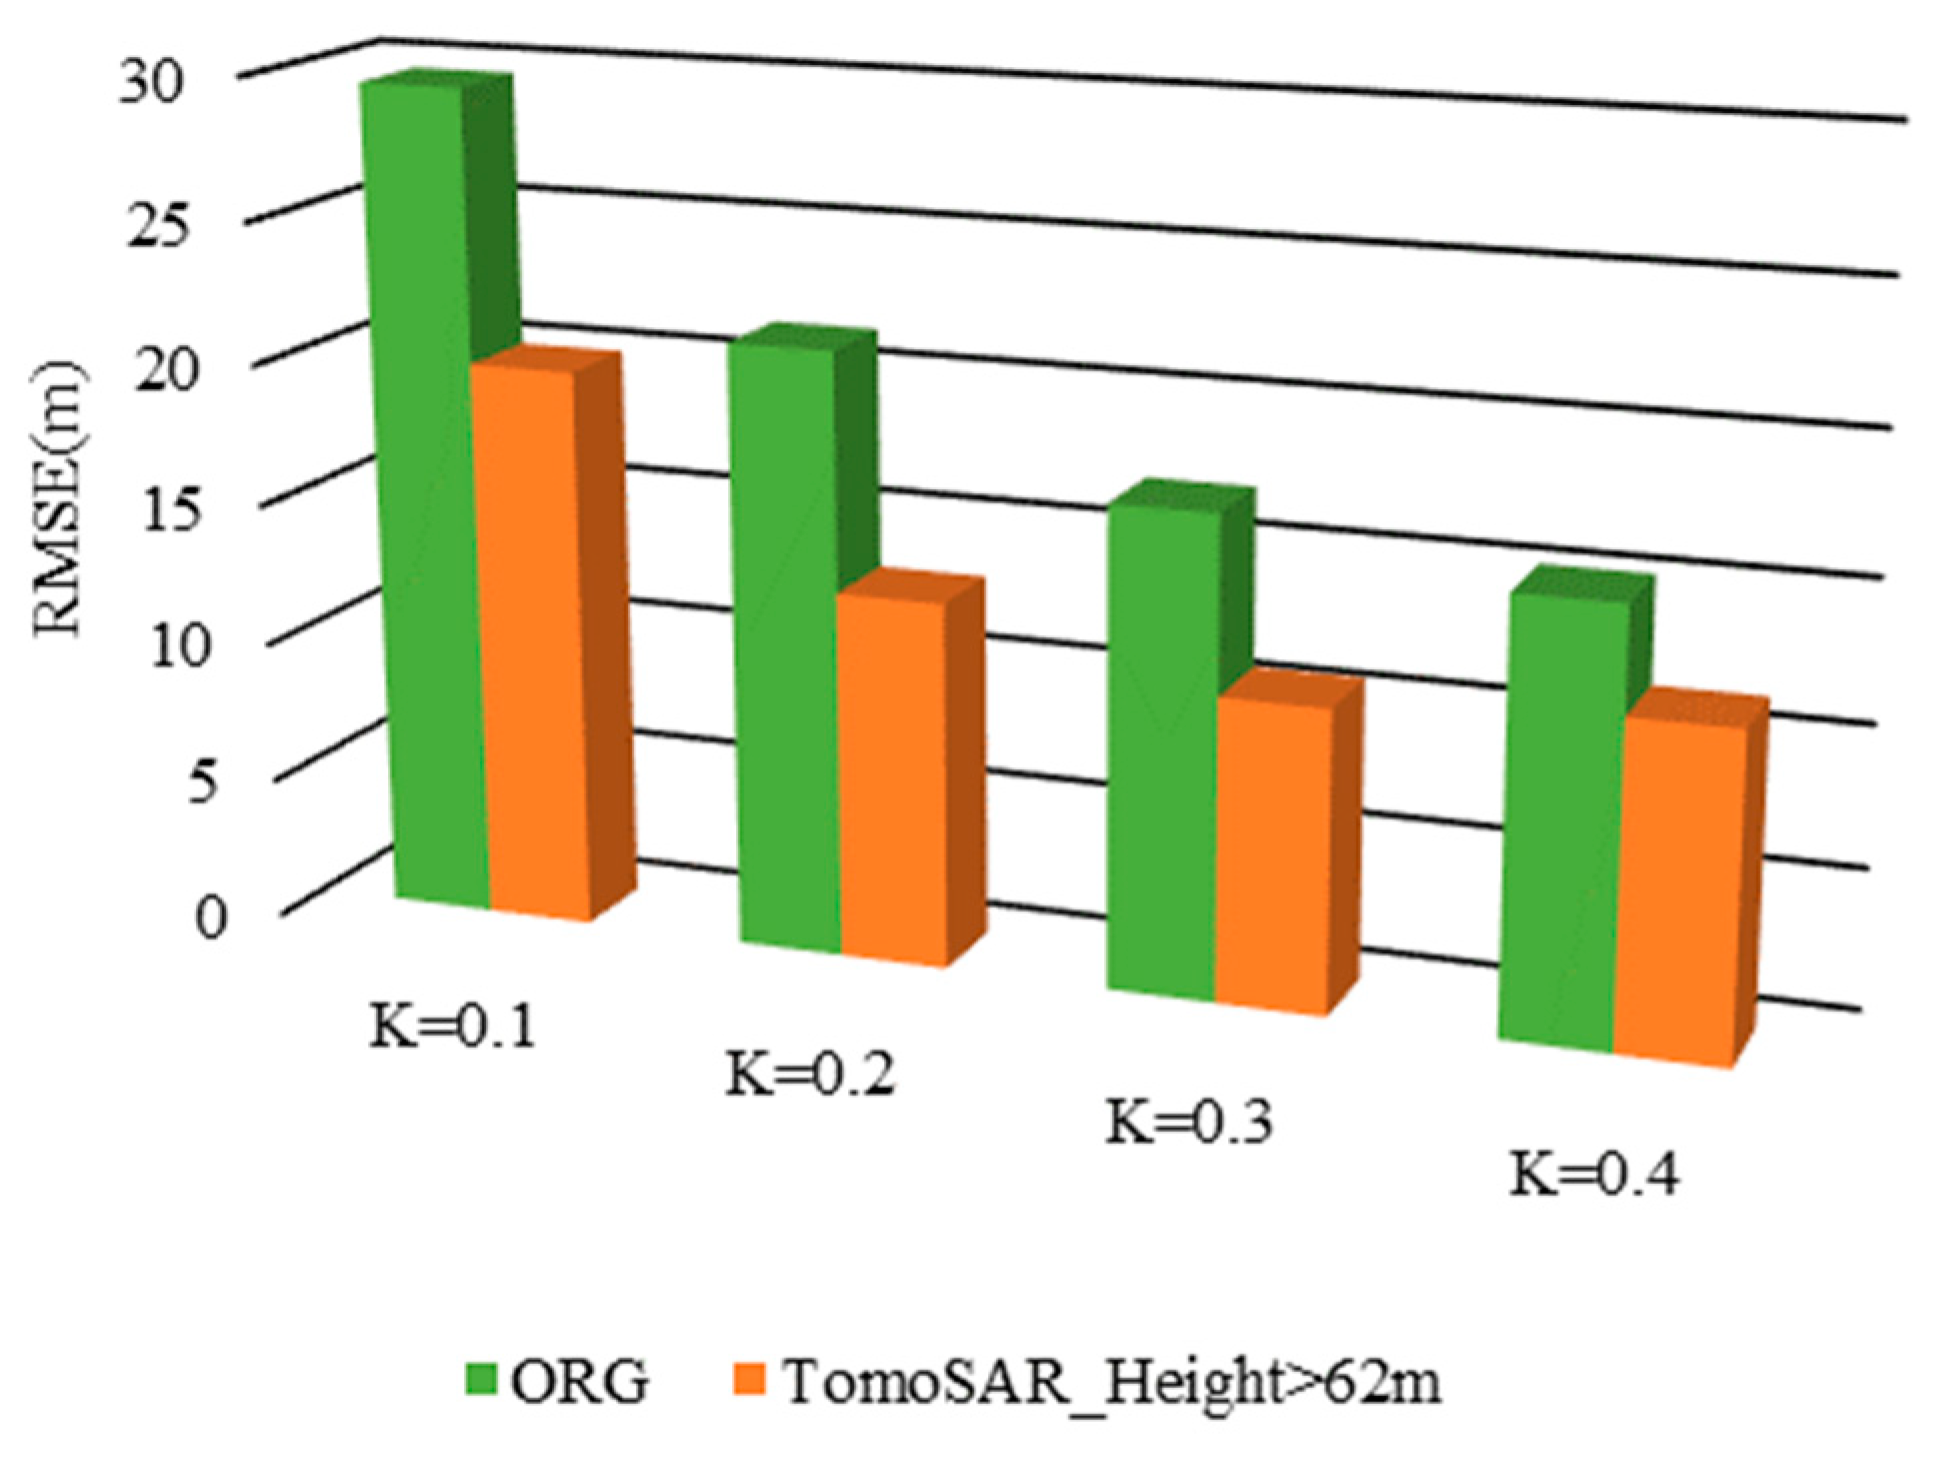
The inversion results described in the previous section clearly demonstrate that relying solely on the difference of envelopes to calculate canopy height does not necessarily lead to correct results, with some of the inversion results still outside the range of the true forest canopy height. Therefore, it is necessary to further optimize the correction process to account for these errors. In this scheme, we set an approximate low-value overestimation threshold based on the LiDAR-RH100 maximum height to eliminate the overestimated sample points and further compare the estimation results achieved using different K values. Based on the values in the scatter plots (Figure 8), we set the maximum value of canopy height in the study area to 62 m. The inversion results were then masked using a threshold of 62 m, with the results for different K values shown in Figure 9 and Figure 10. Here, the masking threshold (62 m) is only an approximate reference value. Although there are a few measured canopy heights exceeding 62 m in the LiDAR data, this will not impact the overall conclusions of the study, and a more precise value could alternatively be determined using an iterative method if required.
The results show that after masking inversion height values greater than 62 m, the inversion accuracy improves at all K values. For K = 0.1, n = 3399, and the RMSE is 19.94 m with the fewest samples within a reasonable range (Figure 9a). For K = 0.2, n = 4917, and the RMSE is 13.00 m (Figure 9b); for K = 0.3, n = 5468, and the RMSE is 10.73 m (Figure 9c); and at K = 0.4, n = 5764, and the RMSE is 11.47 m (Figure 9d). The RMSE value at K = 0.3 is the lowest among the four schemes, and the trend line (shown in red in Figure 8) is closest to the 1:1 line indicating correctly inverted heights. Although the RMSE value achieved at K = 0.4 is similar to that at K = 0.3 and the sample size is larger, the overestimation and underestimation at K = 0.4 are more pronounced. On this basis, we determined that the results obtained for K = 0.3 are more reasonable, and we accordingly set the value of K as 0.3 in the following section.

3.3. Overestimation Improvement of the Predicted Extreme Values

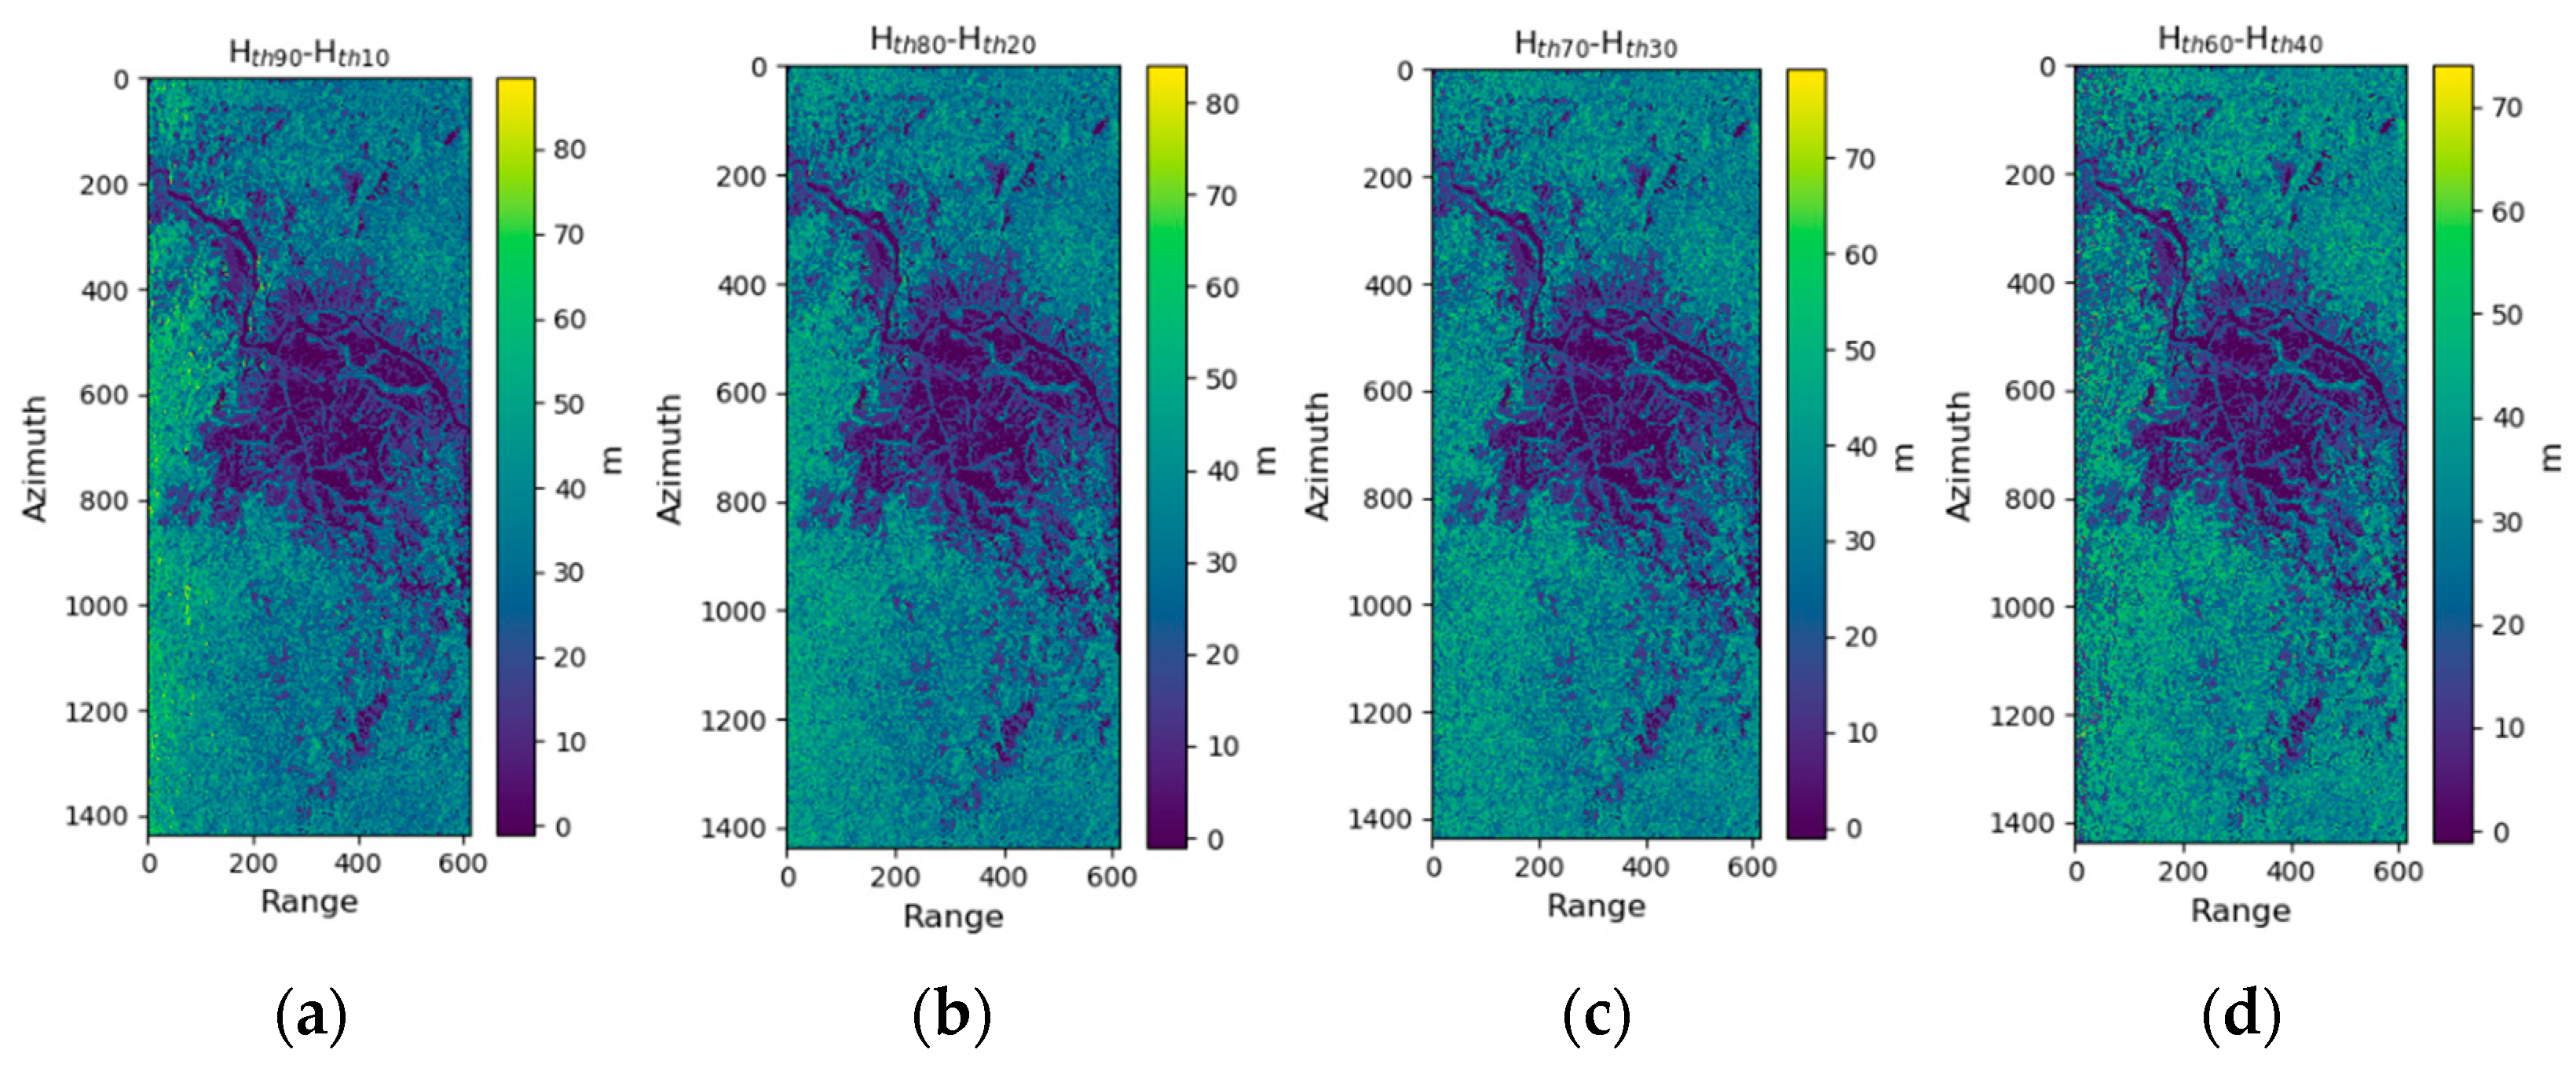
In the previous step, the best inversion results were obtained at K = 0.3 when errors outside the reasonable canopy height range were not considered. Accordingly, we fixed K = 0.3 in this scheme and used the percentile height as the adjustment threshold to improve the overestimation of inversion values above 62 m. When the inverted canopy height within a pixel cell is below 62 m, the height value is considered reasonable. When the inverted height is greater than 62 m, the percentile height corresponding to the canopy height within this pixel is counted. The percentile height values near the top of the canopy and the ground surface were differenced to obtain a new estimated height value (Hth(high) − Hth(low)), which is used as the correct result. We set four percentile thresholds at 10% intervals to improve the overestimation, namely Hth90 − Hth10, Hth80 − Hth20, Hth70 − Hth30, and Hth60 − Hth40, and the best overestimation correction scheme was determined by calculating the RMSE between the inverse values and LiDAR-RH100 heights. Note that the threshold intervals used here are selected only to validate the rationality of the method, and smaller intervals and different value combinations could be used to optimize our proposed scheme.
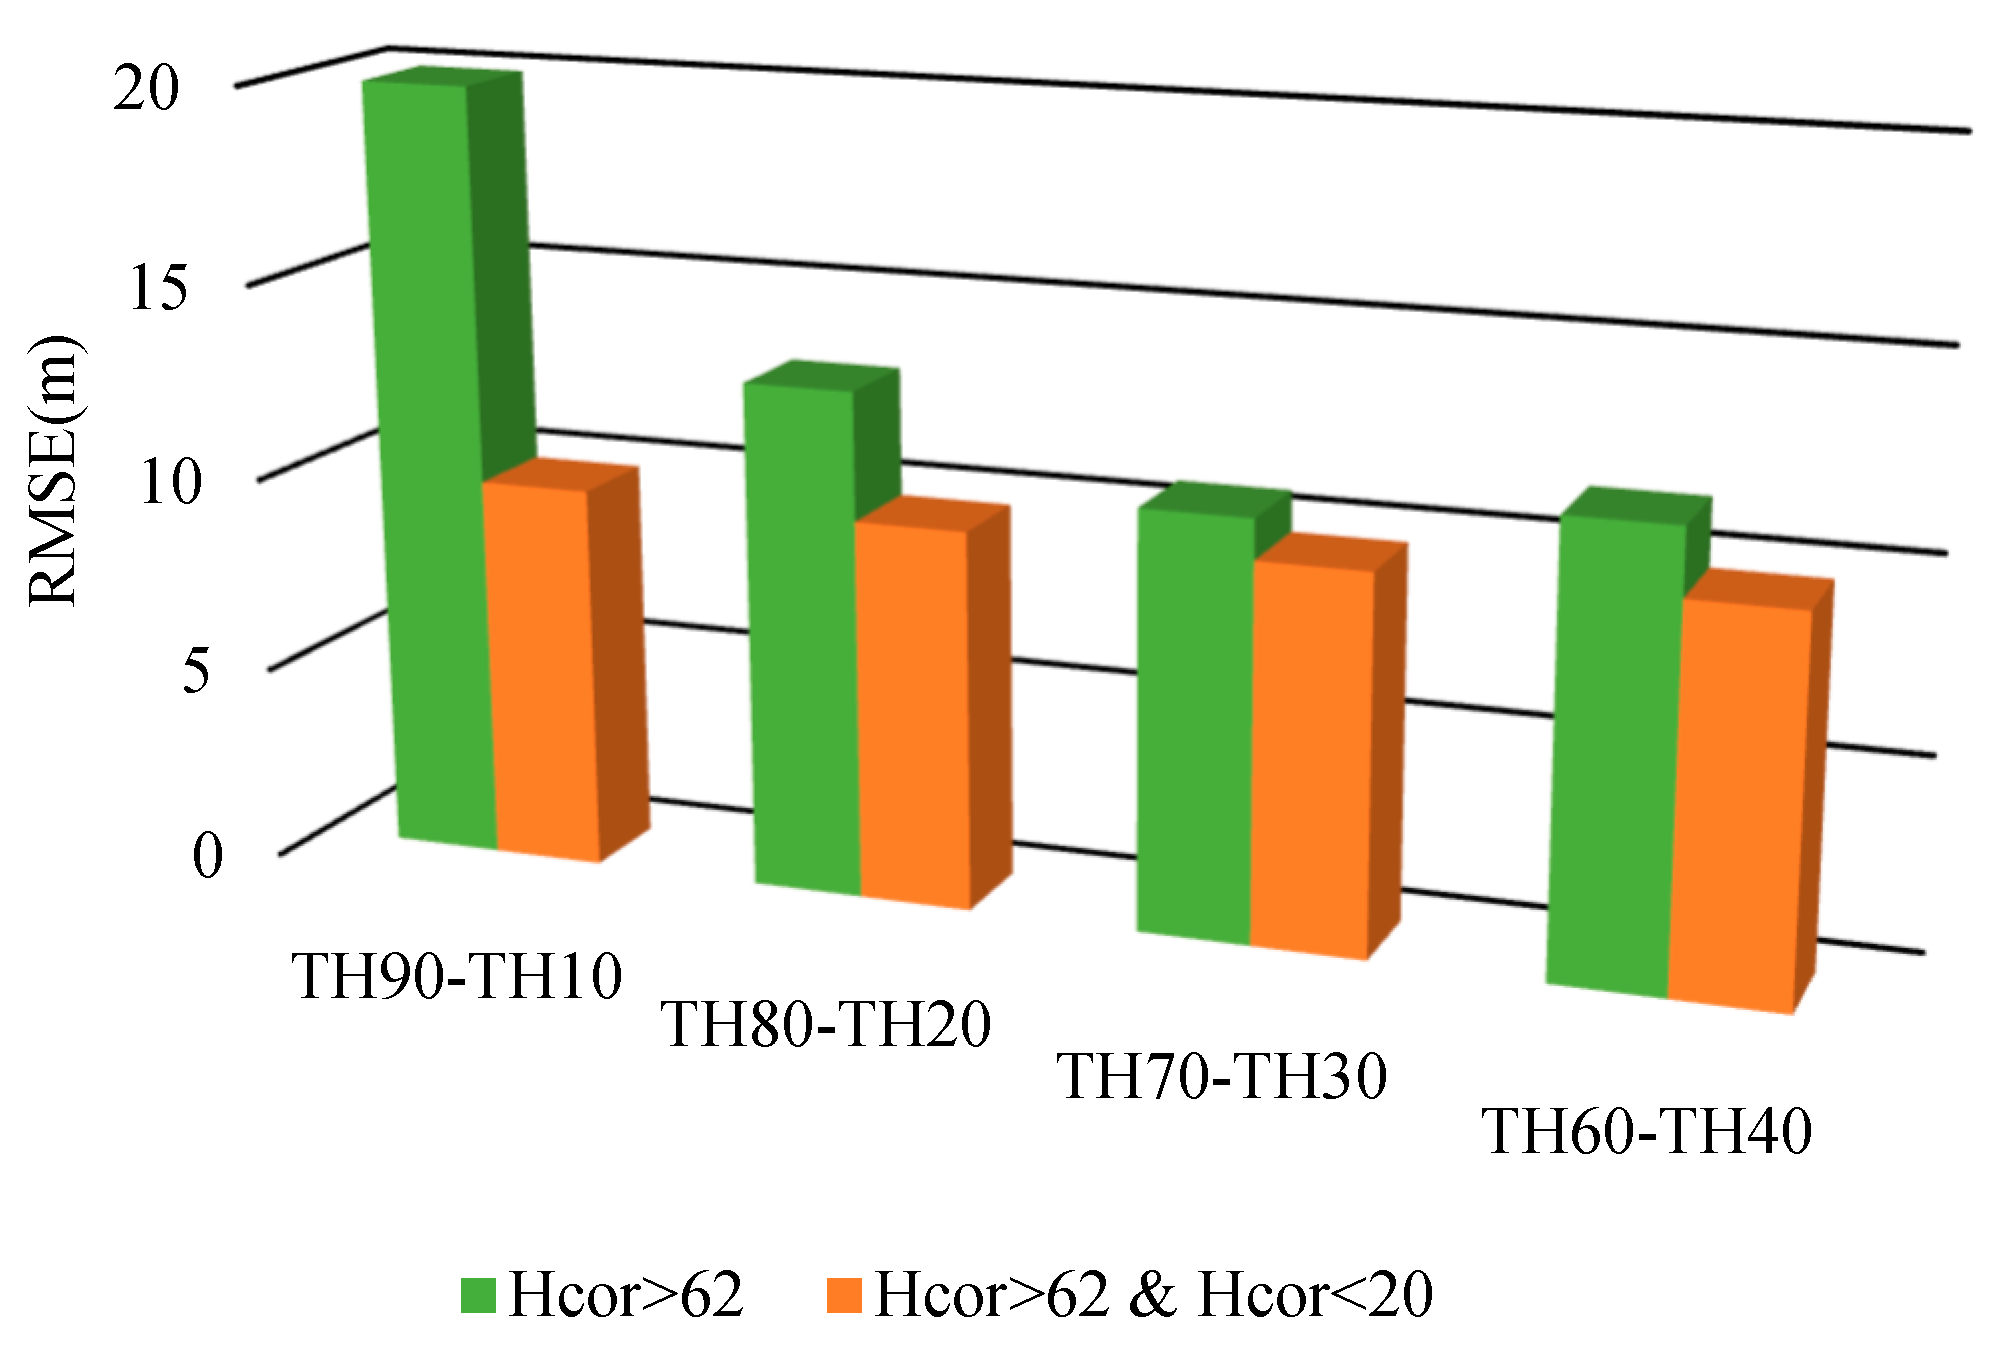
The scatter plots in Figure 9 indicate that the inversion accuracy is further improved after the correction of the extreme value overestimation. The Hth90 − Hth10 scheme has an RMSE value of 12.62 m and an R2 of 0.40 (Figure 11a); the Hth80 − Hth20 scheme has an RMSE value of 10.06 m and R2 of 0.62 (Figure 11b); the Hth70 − Hth30 scheme has an RMSE value of 10.28 m and R2 of 0.60 (Figure 11c); and the Hth60 − Hth40 scheme has an RMSE value of 12.79 m and an R2 of 0.39 (Figure 9d). The highest accuracy was achieved for the Hth80 − Hth20 combination; compared to the unoptimized results in Section 4.1, the RMSE is reduced by 40.82% from 17.00 m to 10.06 m. Therefore, we set the correction threshold for the overestimation of the extreme values to Hth80 − Hth20. The overestimation improvement effect is also shown in Figure 12.

3.4. Overestimation Improvement of Low Vegetation Areas

When the maximum canopy height of the study area is known, the extreme value overestimation can be corrected directly. However, the corrected results also show that overestimation also occurs when the inverse canopy height is approximately less than 20 m, which is similar to the systematic overestimation observed in the scatter plot Figure 9. Therefore, the same approach can be used to improve the overestimation of areas of low vegetation. In this scheme, we applied the same correction approach described in Section 3.2. We chose K = 0.3 and set a correction threshold of 20 m. When the canopy height within a pixel cell is less than 20 m, the percentile height value corresponding to the canopy height within this pixel is counted, and the percentile height value near the top of the canopy and ground surface were subtracted to calculate the correct value. As mentioned above, the optimal correction interval was determined based on minimizing the RMSE between the inversion values and LiDAR-RH100 height.
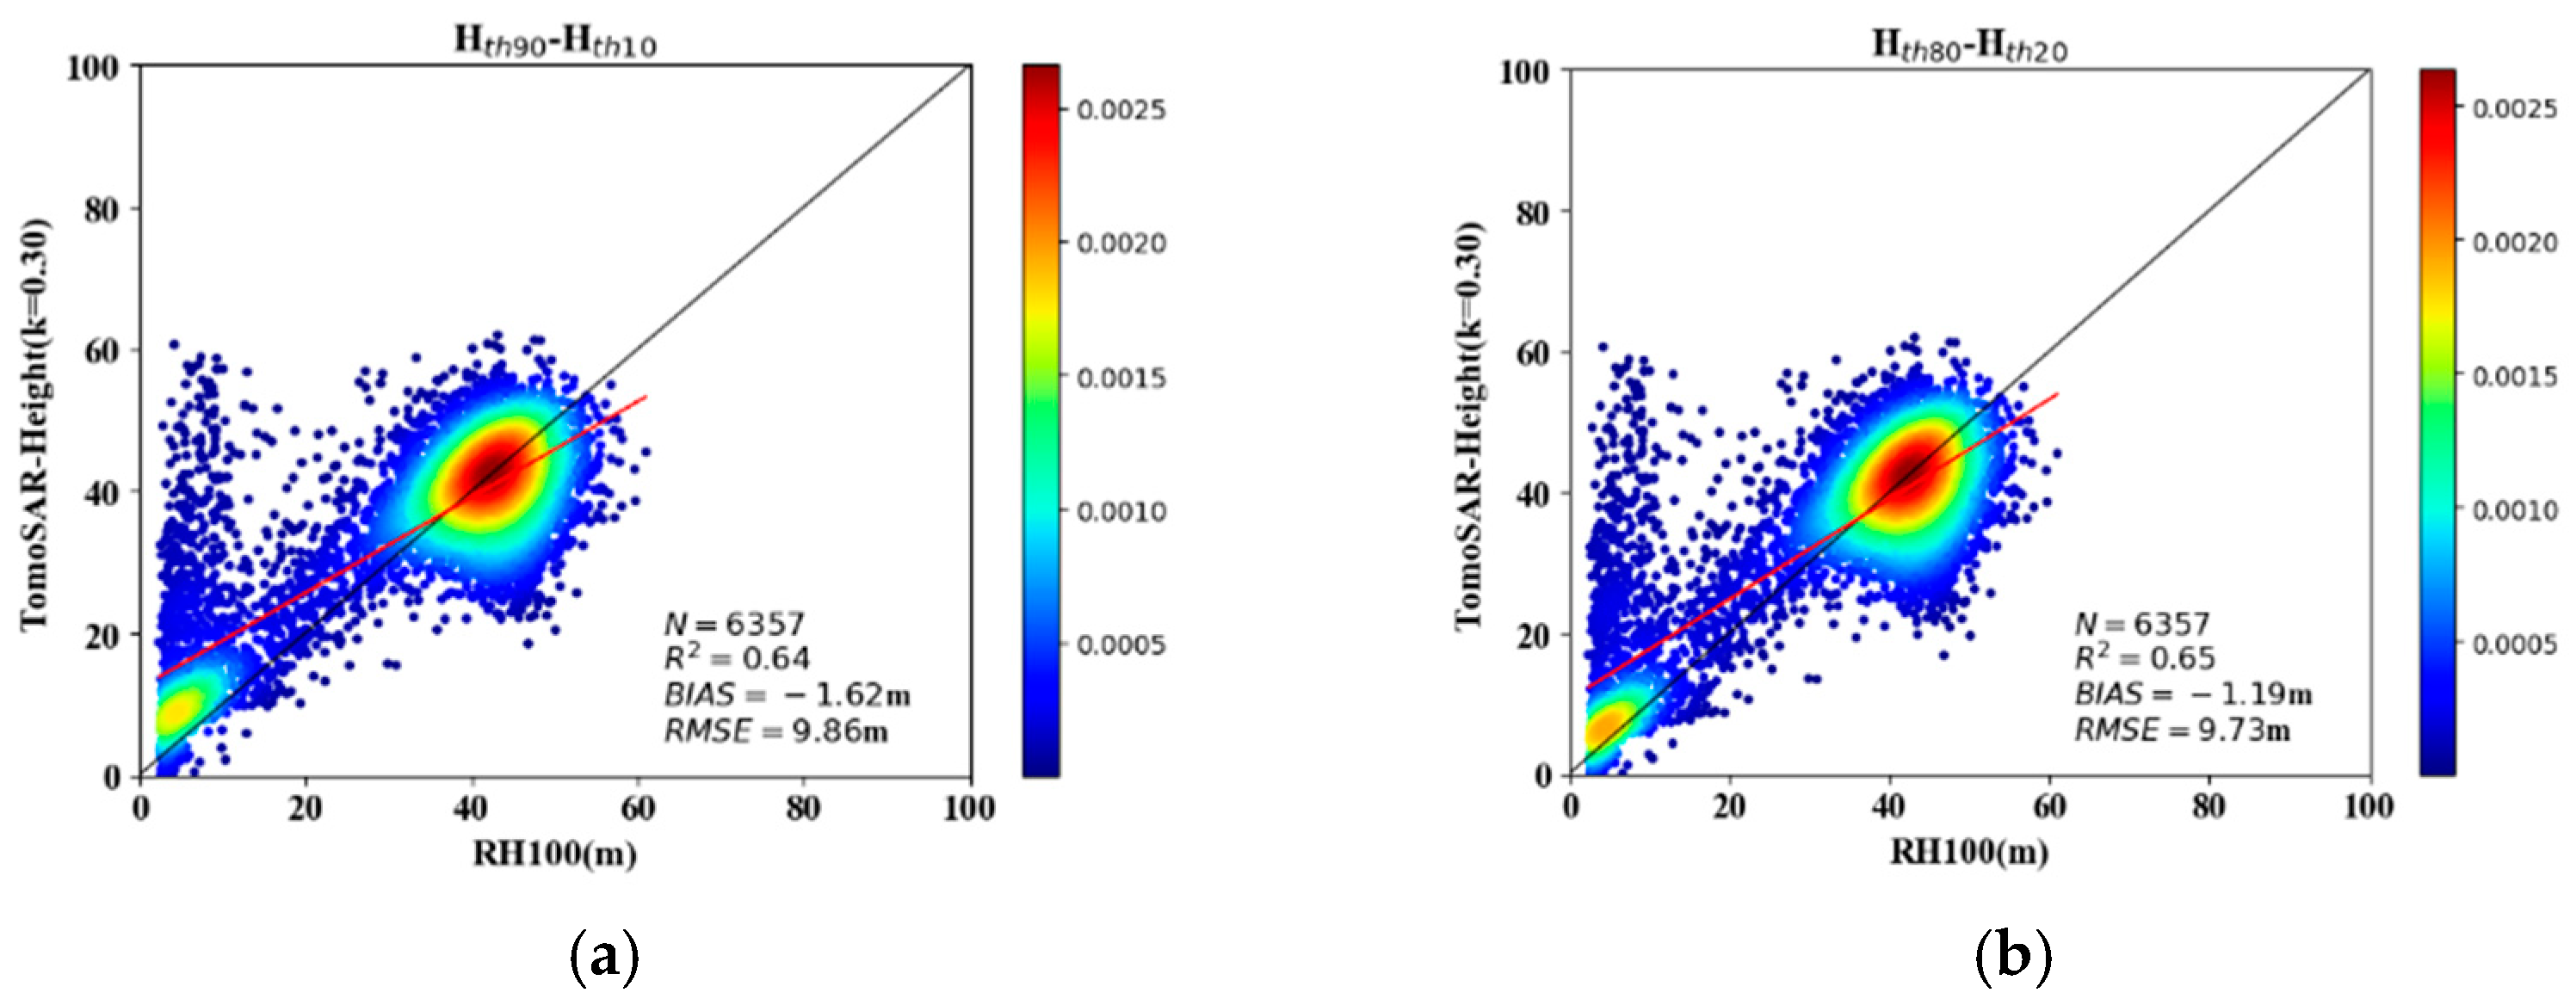
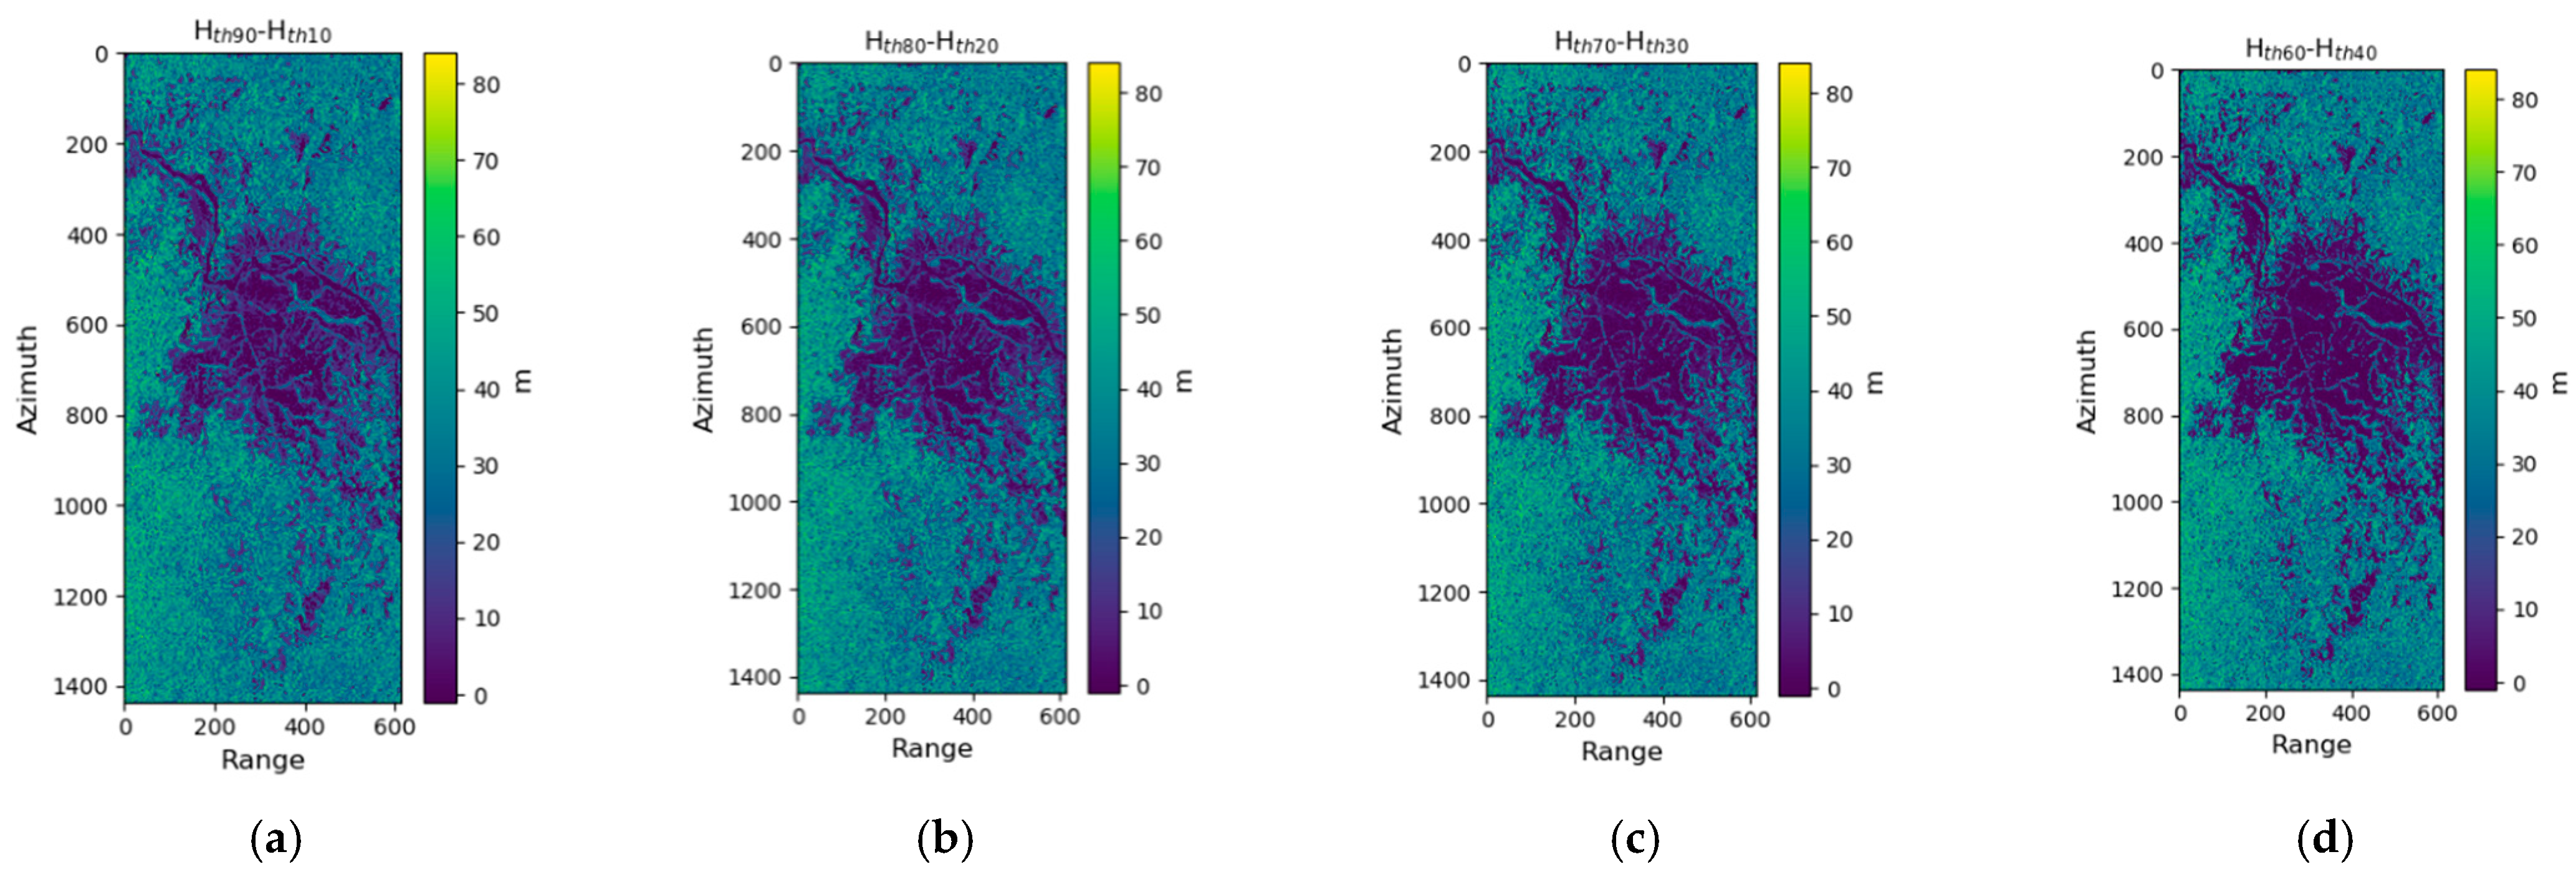
After overestimation correction of low vegetation, the inversion accuracy was further improved, as follows: for the Hth90 − Hth10 scheme, RMSE = 9.86 m and R2 = 0.64 (Figure 13a); for the Hth80 − Hth20 scheme, RMSE = 9.73 m and R2 = 0.65 (Figure 13b); for the Hth70 − Hth30 scheme, RMSE = 9.69 m and R2 = 0.65 (Figure 13c); and for the Hth60 − Hth40 scheme, RMSE = 9.74 m and R2 of 0.64 (Figure 13d). The highest accuracy was achieved for Hth70 − Hth30, and compared to the unoptimized results in Section 3.1, the RMSE decreased from 17.00 m to 9.69 m, representing a 43% reduction. Therefore, we set the overestimation correction threshold for low vegetation areas to Hth70 − Hth30, which yields further improvements, as shown in Figure 14, Figure 15 and Figure 16. The envelope after the error improvement is shown in Figure 17.

4. Discussion

4.1. Extensibility of Methods

Compared with the results of El Moussawi et al. [16], our tomographic imaging results show more significant sidelobe noise. As shown in Figure 4, there are also strong reflections below the surface layer. This is mainly because, in the study by El Moussawi et al., an iterative phase calibration method was used to compensate for the residual phase, and better focusability results were obtained. In this paper, we do not compensate for the topographic phase and other residual phases, so the sidelobe effect is obvious. However, after three steps of error correction, we also achieved accurate forest canopy height estimates. In general, the method proposed in this paper is more compatible with the data and can achieve satisfactory forest canopy height estimates without relying on other more complex error compensation methods.

4.2. Discrete Sample Point Error Analysis

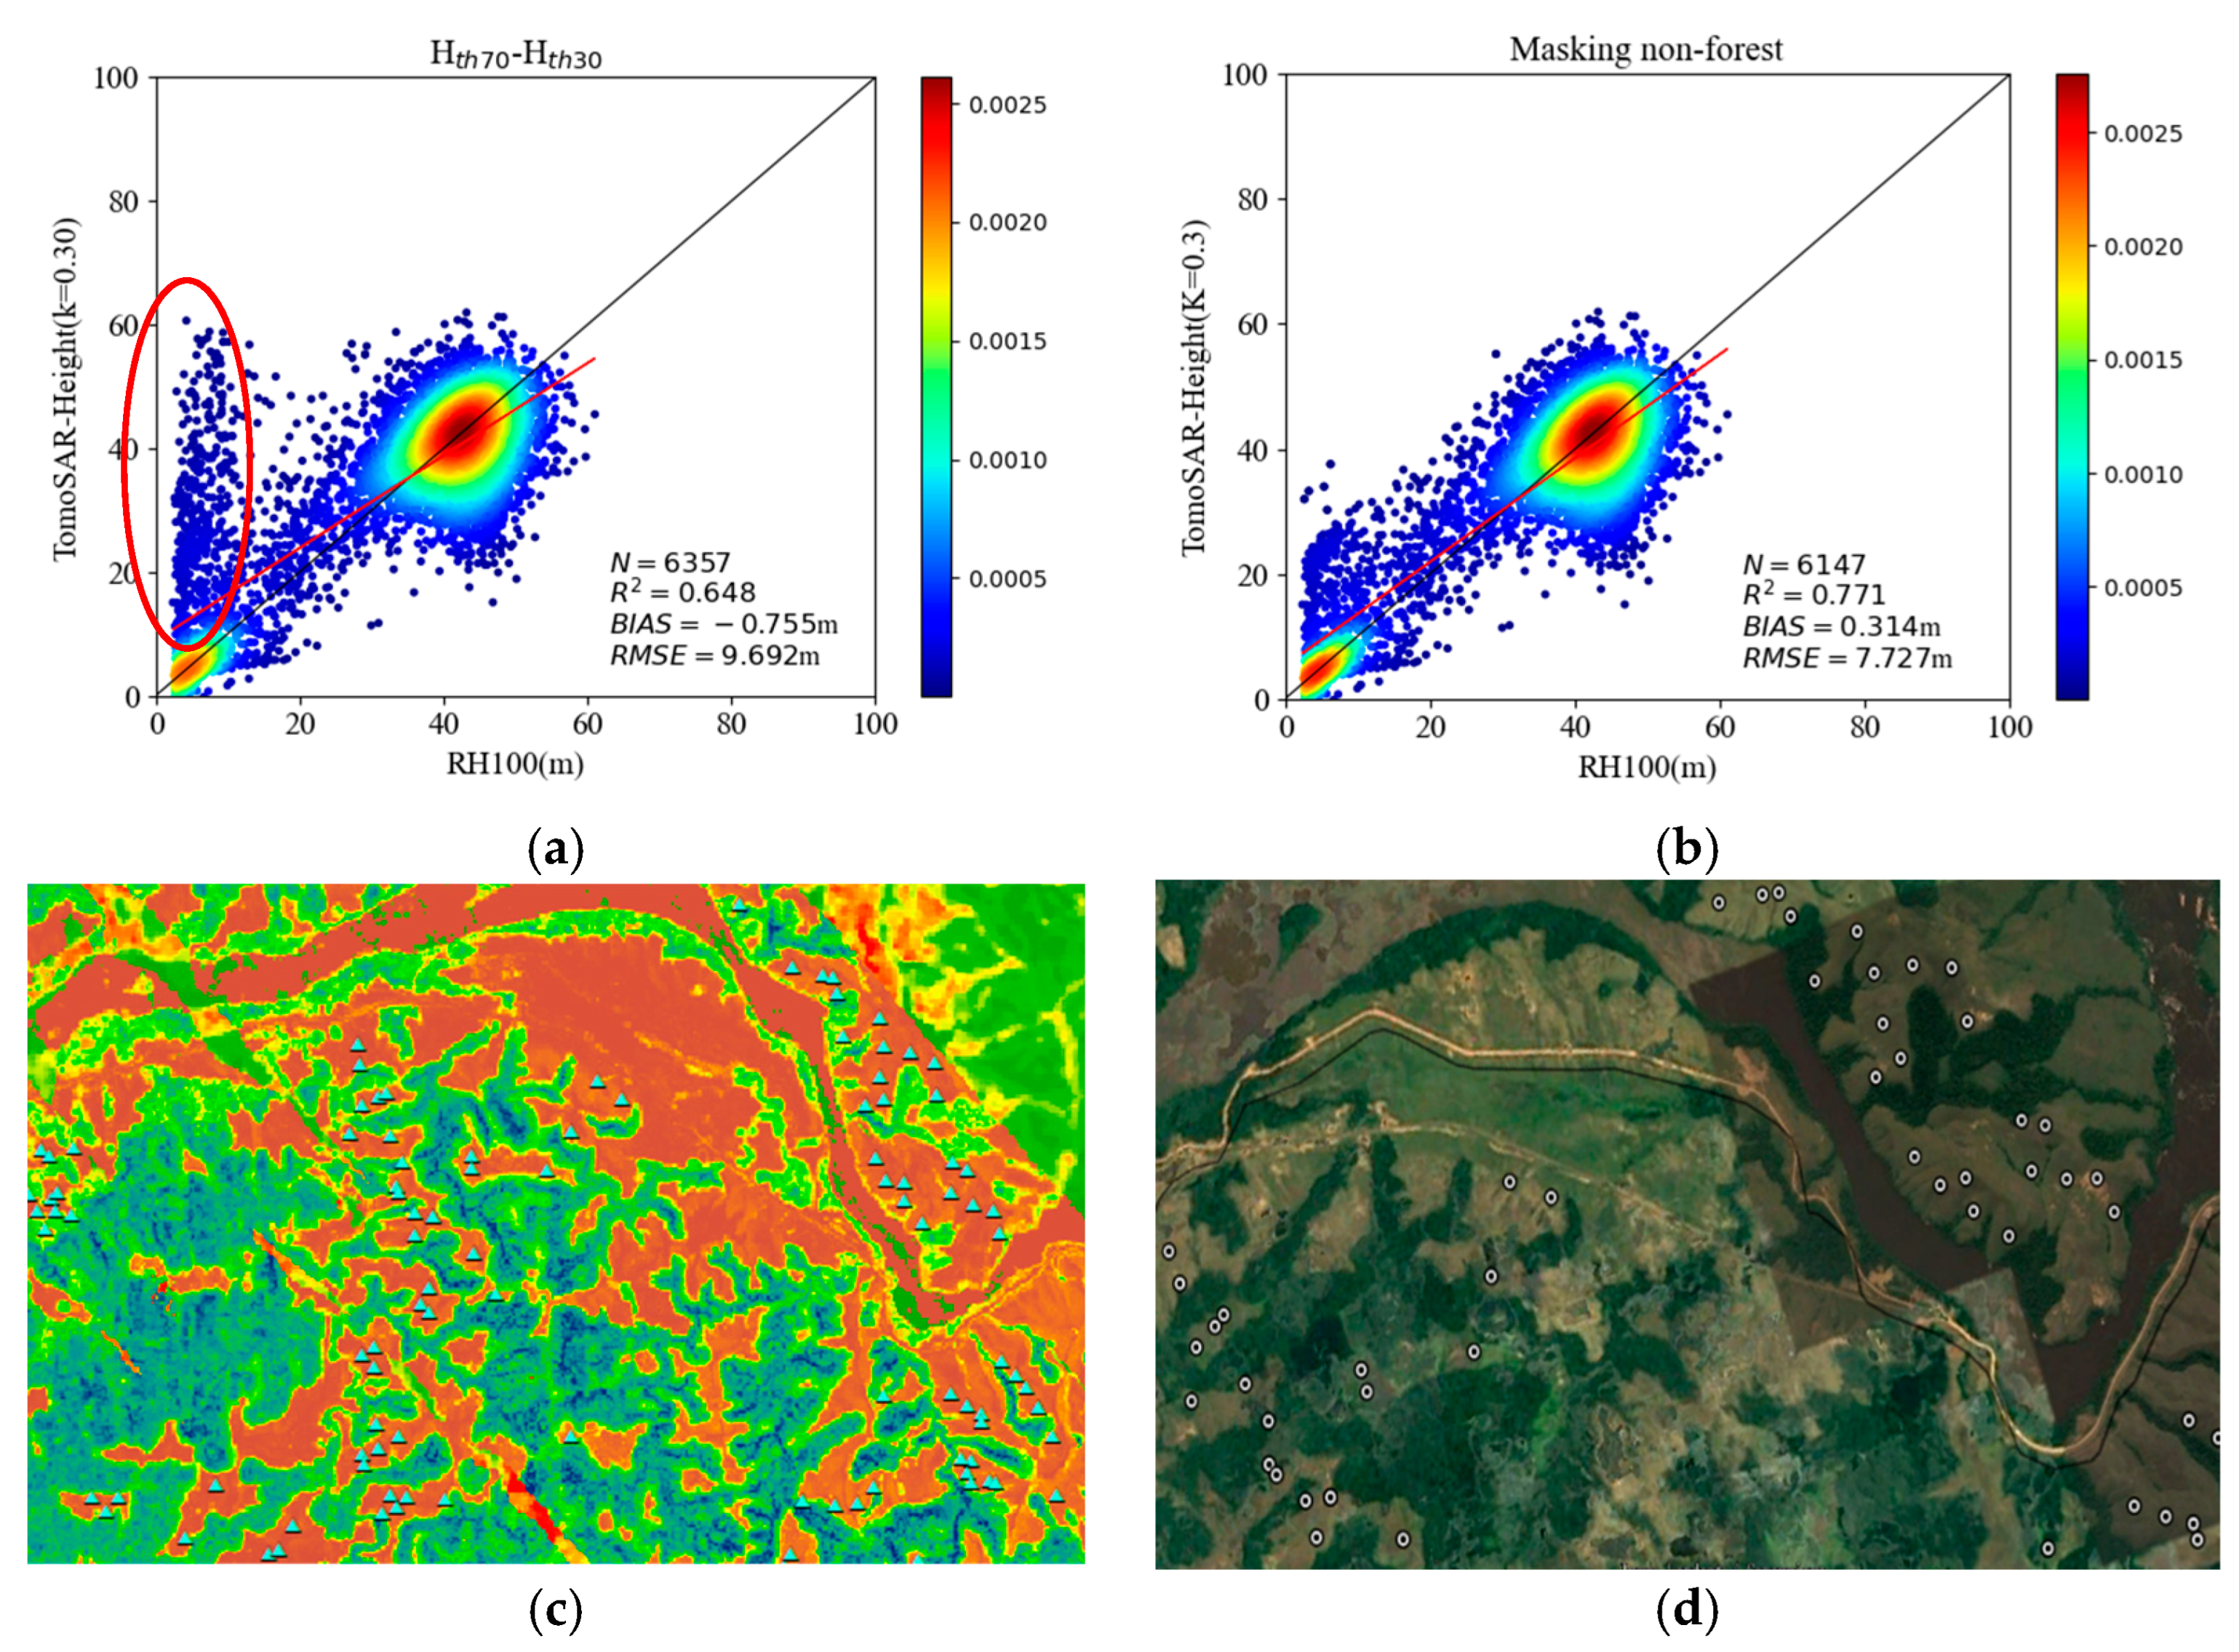
Despite the three steps of error improvement detailed above, we did not fully overcome the underestimation and overestimation observed in the TomoSAR canopy height estimates. There is also slight underestimation at RH100 heights greater than 40 m, which may relate to the forest conditions, data conditions, and beamforming algorithms described previously; this effect may even relate to microwave penetration of the canopy, which we intend to further analyze in the next step of our study. In addition, there is also significant overestimation for a few sample points where RH100 is less than 20 m. We superimposed these sample points on Google Earth and found that almost all of these sample points are located in areas with less forest cover in which the microwave penetration is deeper and other conditions cause larger errors [36,37,38,39]. As shown by the results after masking these areas (Figure 18b), our proposed method is effective and can improve the forest canopy height estimation by overcoming the phase error. However, since our proposed method does not fundamentally explain the TomoSAR imaging mechanism, there are still some sample points that are underestimated and overestimated. In the study’s next step, these errors can be improved by creating masks to distinguish between forest and nonforest areas.
In this study, we used LiDAR-RH100 data to validate the TomoSAR inversion results. The use of LiDAR-RH100 data is a common approach used to validate SAR canopy height, and all the data used in the study are internally consistent results from the AfriSAR project. The accuracy and reliability of the LiDAR data used here have been confirmed in the report of the NANS study [17] and do not fundamentally affect our experimental conclusions.

4.3. Uncertainty of the Method

For forest canopy height estimation by interferometric tomography SAR, K is an empirical value that is determined in different ways in different studies. The optimal K value is usually determined based on minimizing the error between the inversion results and the true forest canopy height, similar to a simple iterative process. In this study, we set a larger iteration step and did not reach the global optimum, which will affect the final forest canopy height estimation. In future studies, we intend to set a smaller step and use an iterative method to determine the global optimum K value. Second, real forest canopy height information is required for each step of this study, and ICEsat-2 and GEDI data could be potentially used for this purpose in future studies.

5. Conclusions

TomoSAR is an important tool for forest canopy height estimation; however, in tropical forests, the results obtained from this technique are affected by various factors, and direct usage of the upper and lower TomoSAR-derived envelopes for canopy height estimation without compensating for the topographic phase does not yield ideal results. In this study, a semi-empirical, three-step method is proposed to optimize TomoSAR envelope estimation to overcome the effects of residual phase error and improve forest canopy height estimation. Using a small number of real forest heights as a reference, an iterative approach is used to identify the interval in which the forest canopy height error occurs and optimize the envelope estimation to reduce the canopy height estimation error. Moreover, the method is easy to perform and can effectively estimate forest canopy height without relying on a complex phase calibration process; this technique is more generalizable and does not require a specific application context. The conditions for TomoSAR canopy height estimation from spaceborne platforms are not yet mature, and multibaseline SAR data from airborne platforms represent an important data source for exploring new methods. With the operation of the TanDEM-L and BIOMASS satellites in the future, our proposed method can provide an important reference for spaceborne TomoSAR forest canopy height estimation.

Author Contributions

H.L. designed the experiments, completed the data analysis, and wrote the paper; C.Y. provided important guidance for experimental design, data analysis, and writing of the paper; H.Y. assisted with data processing; and S.C. assisted with the development of graphs. All authors have read and agreed to the published version of the manuscript.

Funding

This research was funded by the National Natural Science Foundation of China “Multi-frequency SAR polarized interferometric data for forest tree height inversion” (Grant No. 42061072); the Major Science and Technology Special Project of Yunnan Provincial Science and Technology Department “Forest Resources Digital Development and Application in Yunnan” (Grant No. 202002AA100007-015); and the Scientific Research Fund Project of Yunnan Provincial Education Department “Forest height inversion from spaceborne microwave data TanDEM-X combined with topographic data” (Grant No. 2022Y579).

Data Availability Statement

UAVSAR data and LiDAR-RH100 were obtained from NASA’s Oak Ridge National Laboratory Biogeochemical Dynamics Distributed Active Archive Center (https://daac.ornl.gov/cgi-bin/dataset_lister.pl?p=38 (accessed on 19 October 2021)) and Jet Propulsion Laboratory (https://uavsar.jpl.nasa.gov (accessed on 24 December 2021)).

Acknowledgments

Thanks to NASA for providing all the publicly available free datasets to support this work.

Conflicts of Interest

No conflict of interest exist in association with the submission of this manuscript, and the manuscript has been approved for publication by all authors.

References

  1. Tello, M.; Cazcarra-Bes, V.; Pardini, M.; Papathanassiou, K. Forest structure characterization from SAR tomography at L-band. IEEE J. Sel. Top. Appl. Earth Obs. Remote Sens. 2018, 11, 3402–3414. [Google Scholar] [CrossRef] [Green Version]
  2. Frolking, S.; Palace, M.W.; Clark, D.B.; Chambers, J.Q.; Shugart, H.H.; Hurtt, G.C. Forest disturbance and recovery: A general review in the context of space-borne remote sensing of impacts on aboveground biomass and canopy structure. J. Geophys. Res. Biogeosci. 2009, 114, G00E02. [Google Scholar] [CrossRef]
  3. Treuhaft, R.; Siqueira, P. Vertical structure of vegetated land surfaces from interferometric and polarimetric radar. Radio Sci. 2000, 35, 141–178. [Google Scholar] [CrossRef] [Green Version]
  4. Papathanassiou, K.P.; Cloude, S.R. Single baseline polarimetric SAR interferometry. IEEE Trans. Geosci. Remote Sens. 2001, 39, 2352–2363. [Google Scholar] [CrossRef] [Green Version]
  5. Cloude, S.R.; Papathanassiou, K.P. Three-stage inversion process for polarimetric SAR interferometry. IEE Proc. Radar Sonar Navig. 2003, 150, 125–134. [Google Scholar] [CrossRef] [Green Version]
  6. Reigber, A.; Moreira, A. First Demonstration of Airborne Sar Tomography Using Multibaseline L-Band Data. IEEE Trans. Geosci. Remote Sens. 2000, 38, 2142–2152. [Google Scholar] [CrossRef]
  7. Cazcarra-Bes, V.; Tello-Alonso, M.; Fischer, R.; Heym, M.; Papathanassiou, K. Monitoring of Forest Structure Dynamics by Meansof L-Band Sar Tomography. Remote Sens. 2017, 9, 1229. [Google Scholar] [CrossRef] [Green Version]
  8. Minh, D.H.T.; Le Toan, T.; Rocca, F.; Tebaldini, S.; Villard, L.; Rejou-Mechain, M.; Phillips, O.L.; Feldpausch, T.R.; Dubois-Fernandez, P.; Scipal, K.; et al. Sar Tomography for the Retrieval of Forest Biomass and Height: Cross-Validation at Two Tropical Forest Sites in French Guiana. Remote Sens. Environ. 2016, 175, 138–147. [Google Scholar] [CrossRef] [Green Version]
  9. Minh, D.H.T.; Tebaldini, S.; Rocca, F.; Le Toan, T.; Villard, L.; Dubois-Fernandez, P.C. Capabilities of Biomass Tomography for Investigating Tropical Forests. IEEE Trans. Geosci. Remote Sens. 2015, 53, 965–975. [Google Scholar] [CrossRef]
  10. Minh, D.H.T.; Le Toan, T.; Rocca, F.; Tebaldini, S.; d’Alessandro, M.M.; Villard, L. Relating P-Band Synthetic Aperture Radar Tomography to Tropical Forest Biomass. IEEE Trans. Geosci. Remote Sens. 2013, 52, 967–979. [Google Scholar] [CrossRef]
  11. Peng, X.; Li, X.; Wang, C.; Fu, H.; Du, Y. A Maximum Likelihood Based Nonparametric Iterative Adaptive Method of Synthetic Aperture Radar Tomography and Its Application for Estimating Underlying Topography and Forest Height. Sensors 2018, 18, 2459. [Google Scholar] [CrossRef] [Green Version]
  12. Ngo, Y.N.; Huang, Y.; Minh, D.H.T.; Ferro-Famil, L.; Fayad, I.; Baghdadi, N. Tropical forest vertical structure characterization: From GEDI to P-band SAR tomography. IEEE Geosci. Remote Sens. Lett. 2022, 19, 1–5. [Google Scholar] [CrossRef]
  13. Tebaldini, S. Single and Multipolarimetric Sar Tomography of Forested Areas: A Parametric Approach. IEEE Trans. Geosci. Remote Sens. 2010, 48, 2375–2387. [Google Scholar] [CrossRef]
  14. Minh, H.T.; Ngo, Y.-N.; Lê, T.T. Potential of P-Band SAR tomography in forest type classification. Remote Sens. 2021, 13, 696. [Google Scholar] [CrossRef]
  15. Minh, D.H.T.; Le Toan, T.; Tebaldini, S.; Rocca, F.; Iannini, L. Assessment of the P-and L-band SAR tomography for the characterization of tropical forests. In Proceedings of the 2015 IEEE International Geoscience and Remote Sensing Symposium (IGARSS), Milan, Italy, 26–31 July 2015; pp. 2931–2934. [Google Scholar]
  16. El Moussawi, I.; Ho Tong Minh, D.; Baghdadi, N.; Abdallah, C.; Jomaah, J.; Strauss, O.; Lavalle, M.; Ngo, Y.-N. Monitoring Tropical Forest Structure Using SAR Tomography at L- and P-Band. Remote Sens. 2019, 11, 1934. [Google Scholar] [CrossRef] [Green Version]
  17. Fatoyinbo, T.; Armston, J.; Simard, M.; Saatchi, S.; Denbina, M.; Lavalle, M.; Hofton, M.; Tang, H.; Marselis, S.; Pinto, N.; et al. The NASA AfriSAR Campaign: Airborne SAR and Lidar Measurements of Tropical Forest Structure and Biomass in Support of Current and Future Space Missions. Remote Sens. Environ. 2021, 264, 112533. [Google Scholar] [CrossRef]
  18. Peng, X.; Li, X.; Wang, C.; Zhu, J.; Liang, L.; Fu, H.; Du, Y.; Yang, Z.; Xie, Q. Spice-Based Sar Tomography over Forest Areas Using a Small Number of P-Band Airborne F-Sar Images Characterized by Non-Uniformly Distributed Baselines. Remote Sens. 2019, 11, 975. [Google Scholar] [CrossRef] [Green Version]
  19. Liu, X.; Zhang, L.; Yang, X.; Liao, M.; Li, W. Retrieval of Tropical Forest Height and Above-Ground Biomass Using Airborne P-and L-Band SAR Tomography. IEEE Geosci. Remote Sens. Lett. 2021, 19, 1–5. [Google Scholar]
  20. Huang, Y.; Levy-Vehel, J.; Ferro-Famil, L.; Reigber, A. Three-dimensional imaging of objects concealed below a forest canopy using SAR tomography at L-band and wavelet-based sparse estimation. IEEE Geosci. Remote Sens. Lett. 2017, 14, 1454–1458. [Google Scholar] [CrossRef]
  21. Lu, H.; Fan, H.; Zhang, H.; Liu, D.; Zhao, L. A Modified Capon Method for SAR Tomography Over Forest. IEEE Geosci. Remote Sens. Lett. 2021, 19, 1–5. [Google Scholar]
  22. D’Alessandro, M.M.; Tebaldini, S. Digital terrain model retrieval in tropical forests through P-band SAR tomography. IEEE Trans. Geosci. Remote Sens. 2019, 57, 6774–6781. [Google Scholar] [CrossRef]
  23. Huang, Y.; Zhang, Q.; Ferro-Famil, L. Forest Height Estimation Using a Single-Pass Airborne L-Band Polarimetric and Interferometric SAR System and Tomographic Techniques. Remote Sens. 2021, 13, 487. [Google Scholar] [CrossRef]
  24. Minh, D.H.T.; Tebaldini, S.; Rocca, F.; Le Toan, T. The impact of temporal decorrelation on biomass tomography of tropical forests. IEEE Geosci. Remote Sens. Lett. 2015, 12, 1297–1301. [Google Scholar] [CrossRef]
  25. Le Toan, T.; Quegan, S.; Davidson, M.; Balzter, H.; Paillou, P.; Papathanassiou, K.; Plummer, S.; Rocca, F.; Saatchi, S.; Shugart, H.; et al. The BIOMASS mission: Mapping global forest biomass to better understandthe terrestrial carbon cycle. Remote Sens. Environ. 2011, 115, 2850–2860. [Google Scholar] [CrossRef] [Green Version]
  26. Krieger, G.; Moreira, A.; Zink, M.; Hajnsek, I.; Huber, S.; Villano, M.; Papathanassiou, K.; Younis, M.; Dekker, P.L.; Pardini, M.; et al. Tandem-L: Main results of the phase a feasibility study. In Proceedings of the 2016 IEEE International Geoscience and Remote Sensing Symposium (IGARSS), Beijing, China, 10–15 July 2016; pp. 2116–2119. [Google Scholar]
  27. Fore, A.G.; Chapman, B.D.; Hawkins, B.P.; Hensley, S.; Jones, C.E.; Michel, T.R.; Muellerschoen, R.J. UAVSAR polarimetric calibration. IEEE Trans. Geosci. Remote Sens. 2015, 53, 3481–3491. [Google Scholar] [CrossRef]
  28. Armston, J.; Tang, H.; Hancock, S.; Marselis, S.; Duncanson, L.; Kellner, J.; Hofton, M.; Blair, J.B.; Fatoyinbo, T.; Dubayah, R.O. AfriSAR: Gridded Forest Biomass and Canopy Metrics Derived from LVIS, Gabon, 2016; ORNL DAAC: Oak Ridge, TN, USA, 2020. [Google Scholar] [CrossRef]
  29. Yang, X.W.; Tebaldini, S.; Mariotti d’Alessandro, M.; Liao, M. Tropical Forest Height Retrieval Based on P-Band Multibaseline SAR Data. IEEE Geosci. Remote Sens. Lett. 2019, 17, 451–455. [Google Scholar] [CrossRef]
  30. Ramachandran, N.; Saatchi, S.; Tebaldini, S.; d’Alessandro, M.M.; Dikshit, O. Evaluation of P-Band SAR Tomography for Mapping Tropical Forest Vertical Backscatter and Tree Height. Remote Sens. 2021, 13, 1485. [Google Scholar] [CrossRef]
  31. Li, L.; Chen, E.X.; Li, Z.Y.; Ren, C.; Zhao, L.; Gu, X.Z. Forest Above-Ground Biomass Estimation Based on Multi-Baseline InSAR Tomography. Sci. Silvae Sin. 2017, 53, 85–93. [Google Scholar]
  32. Smith-Jonforsen, G.; Ulander, L.; Luo, X. Low VHF-band backscatter from coniferous forests on sloping terrain. IEEE Trans. Geosci. Remote Sens. 2005, 43, 2246–2260. [Google Scholar] [CrossRef]
  33. Stoica, P.; Moses, R.L. Spectral Analysis of Signals; Prentice Hall, Inc.: Upper Saddle River, NJ, USA, 2005. [Google Scholar]
  34. Tebaldini, S.; Rocca, F. Multibaseline polarimetric SAR tomography of a boreal forest at P-and L-bands. IEEE Trans. Geosci. Remote Sens. 2011, 50, 232–246. [Google Scholar] [CrossRef]
  35. El Moussawi, I.; Ho Tong Minh, D.; Baghdadi, N.; Abdallah, C.; Jomaah, J.; Strauss, O.; Lavalle, M. L-Band UAVSAR Tomographic Imaging in Dense Forests: Gabon Forests. Remote Sens. 2019, 11, 475. [Google Scholar] [CrossRef] [Green Version]
  36. Luo, H.; Yue, C.; Xie, F.; Zhu, B.; Chen, S. A Method for Forest Canopy Height Inversion Based on Machine Learning and Feature Mining Using UAVSAR. Remote Sens. 2022, 14, 5849. [Google Scholar] [CrossRef]
  37. Luo, H.; Yue, C.; Wang, N.; Luo, G.; Chen, S. Correcting Underestimation and Overestimation in PolInSAR Forest Canopy Height Estimation Using Microwave Penetration Depth. Remote Sens. 2022, 14, 6145. [Google Scholar] [CrossRef]
  38. Dall, J. InSAR elevation bias caused by penetration into uniform volumes. IEEE Trans. Geosci. Remote Sens. 2007, 45, 2319–2324. [Google Scholar] [CrossRef] [Green Version]
  39. Schlund, M.; Baron, D.; Magdon, P.; Erasmi, S. Canopy penetration depth estimation with TanDEM-X and its compensation in temperate forests. ISPRS J. Photogramm. Remote Sens. 2019, 147, 232–241. [Google Scholar] [CrossRef]
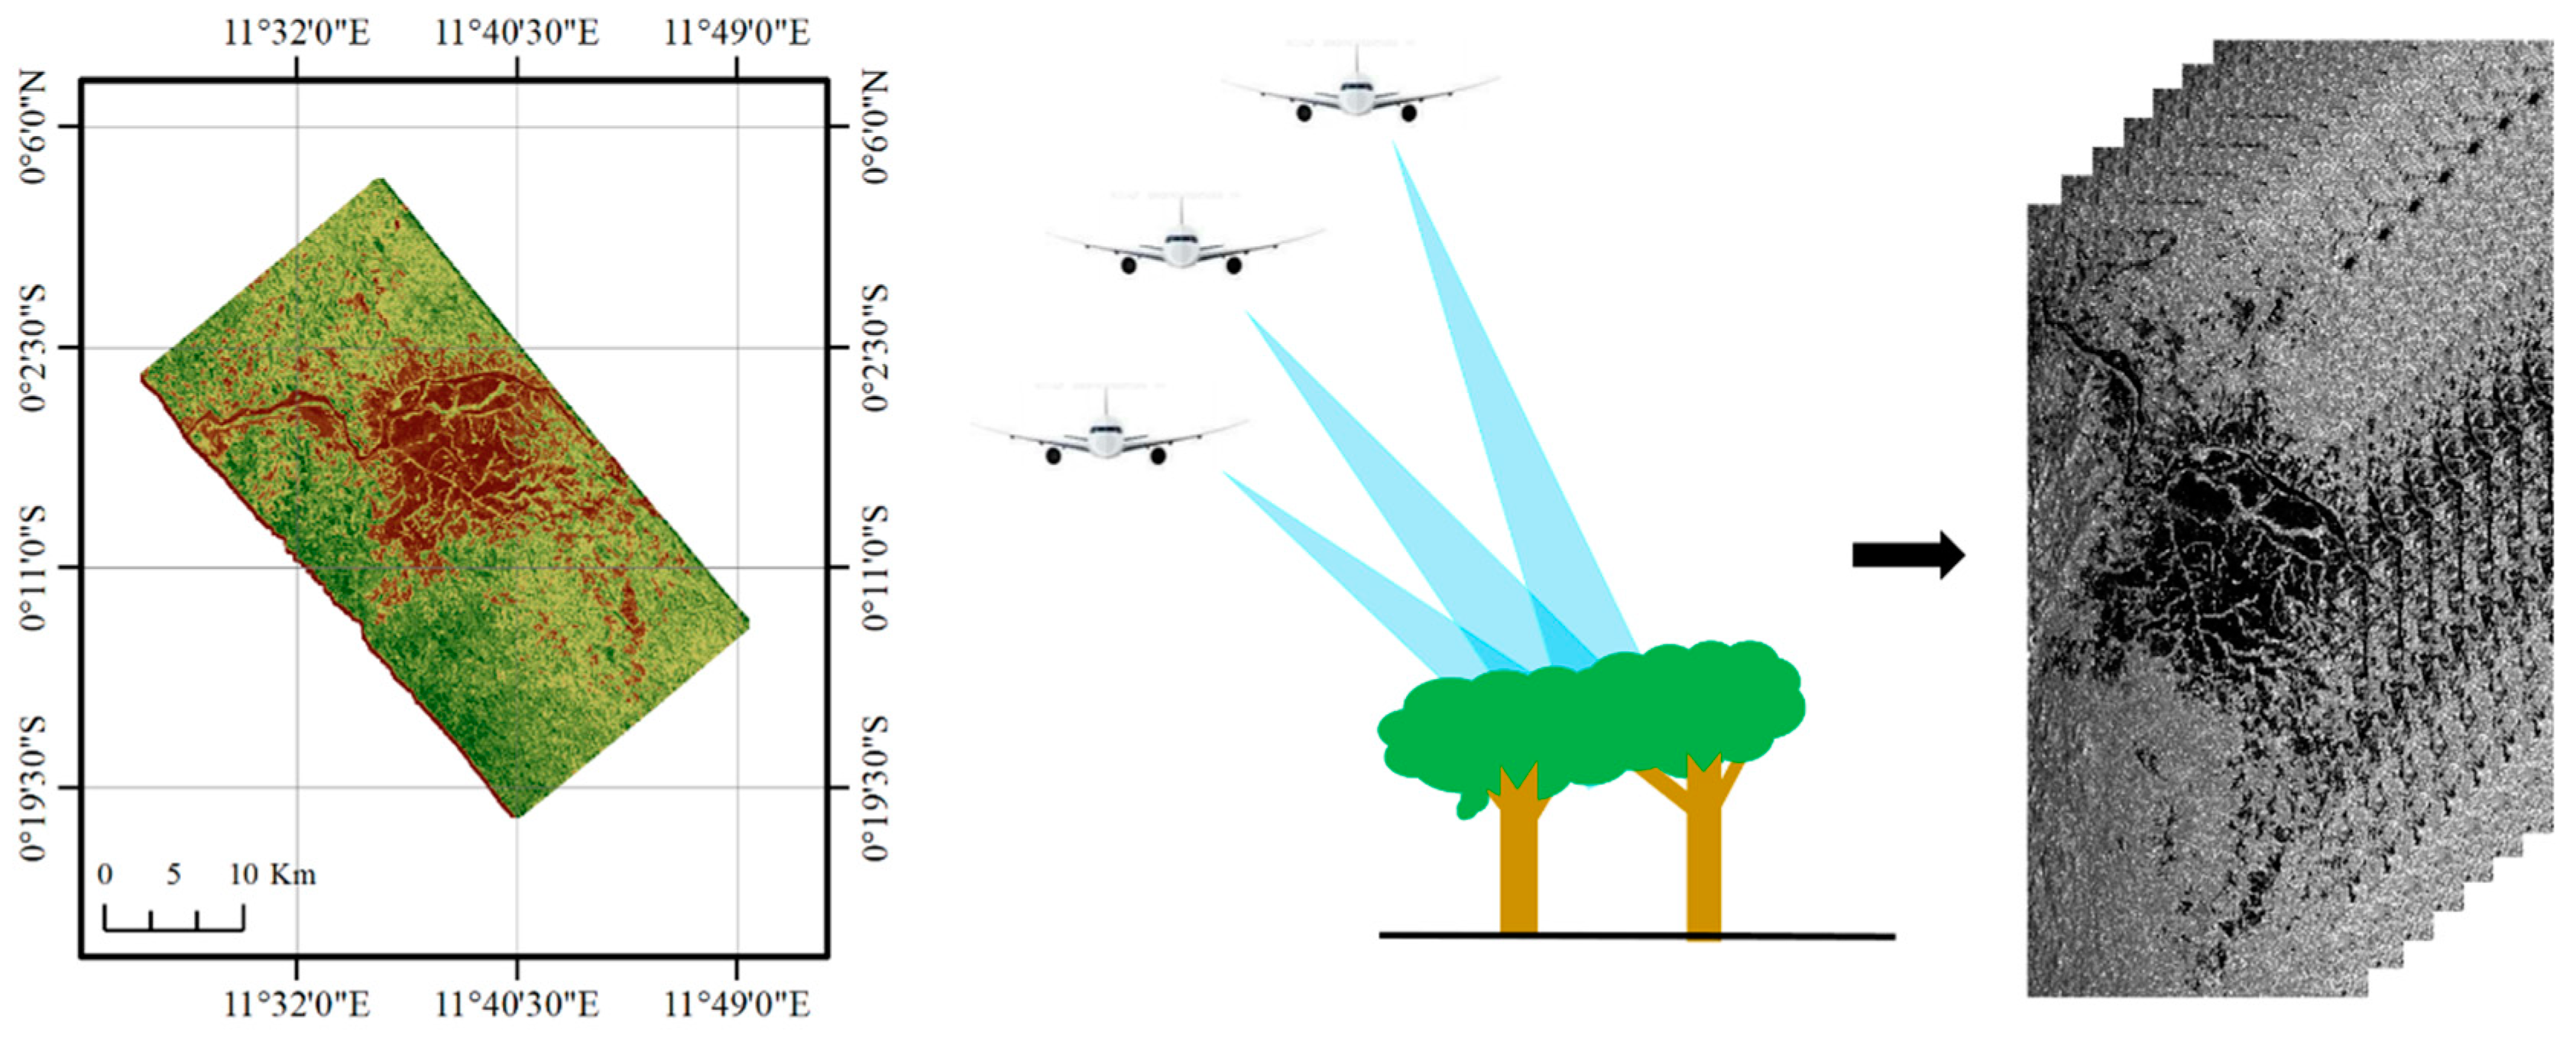
Figure 1. Location of the study area.
Forests 14 01479 g001
Figure 2. Illustration of TomoSAR.
Forests 14 01479 g002
Figure 3. Illustration of canopy height estimation by envelope.
Forests 14 01479 g003
Figure 4. Relative reflectance profile of TomoSAR.
Forests 14 01479 g004
Figure 5. Relative reflectance change curve.
Forests 14 01479 g005
Figure 6. 3D reflectivity envelope of TomoSAR.
Forests 14 01479 g006
Figure 7. Plots (ad) show the canopy height inversion results for different K values from 0.1 to 0.4.
Forests 14 01479 g007
Figure 8. (ad) Scatter plots showing a comparison between the corrected TomoSAR- and LiDAR-derived canopy heights at different K values from 0.1 to 0.4.
Forests 14 01479 g008
Figure 9. (ad) Scatter plots showing a comparison between the corrected TomoSAR- and LiDAR-derived canopy heights at different K values from 0.1 to 0.4 after applying an inversion height mask >62 m.
Forests 14 01479 g009
Figure 10. RMSE values correspond to different K values after applying an inversion height mask >62 m.
Forests 14 01479 g010
Figure 11. (ad) Scatter plots showing a comparison between the corrected TomoSAR- and LiDAR-derived canopy heights for four different extreme-value correction schemes.
Forests 14 01479 g011
Figure 12. (ad) Inversion results of the canopy height after extreme value correction using the four different schemes.
Forests 14 01479 g012
Figure 13. (ad) Scatter plots showing a comparison between the corrected TomoSAR- and LiDAR-derived canopy heights for four different low vegetation correction schemes.
Forests 14 01479 g013aForests 14 01479 g013b
Figure 14. (ad) Inversion results after overestimation correction for extreme values and low vegetation areas.
Forests 14 01479 g014
Figure 15. RMSE changes after overestimation correction for extreme values and low vegetation areas.
Forests 14 01479 g015
Figure 16. (ac) Error histograms after optimization using different schemes.
Forests 14 01479 g016
Figure 17. Error-corrected envelope, where the black lines indicate the final optimized envelope.
Forests 14 01479 g017
Figure 18. Sample point distribution of overestimation when RH100 is less than 20 m (a) is the initial scatter plot, and (b) is the scatter plot after masking nonforest areas; (c) shows the overall distribution of the error sample points (red circled), and (d) is a zoomed-in display of some sample points on Google Maps.
Forests 14 01479 g018
Table 1. Data Introduction.
DatasetDescription
SAR Data InformationRange Resolution3.33 (m)
Azimuth Resolution4.80 (m)
Polarization TypeFull polarization
Look Angle21.48–65.43 (deg)
Number of Tracks8
Vertical Baseline0, 20, 40, 60, 80, 100, 120 (m)
Forest canopy height informationMin1.95 m
Max82.49 m
Average36.94 m
Disclaimer/Publisher’s Note: The statements, opinions and data contained in all publications are solely those of the individual author(s) and contributor(s) and not of MDPI and/or the editor(s). MDPI and/or the editor(s) disclaim responsibility for any injury to people or property resulting from any ideas, methods, instructions or products referred to in the content.