Article

Phenotypic Differences of Leaves and Transcriptome Analysis of Fraxinus mandshurica × Fraxinus sogdiana F1 Variety

1
State Key Laboratory of Tree Genetics and Breeding, Northeast Forestry University, Harbin 150040, China
2
College of Life Science, Northeast Forestry University, Harbin 150040, China
3
Lushuihe Forestry Co., Ltd., Baishan 134506, China
*
Authors to whom correspondence should be addressed.
These authors contributed equally to this work.
Forests 2023, 14(8), 1554; https://doi.org/10.3390/f14081554
Submission received: 30 June 2023 / Revised: 25 July 2023 / Accepted: 26 July 2023 / Published: 29 July 2023
(This article belongs to the Special Issue Advances in Tree Germplasm Innovation and High-Efficiency Propagation)

Abstract

:
Plant leaves, as one of the main organs of plants, have a crucial impact on plant development. In the hybrid F1 variety, one clone “1601” from the hybridization of Fraxinus mandshurica Rupr. × Fraxinus sogdiana Bunge was showed significant differences in leaf development with its female control “M8”. The leaf phenotypic differences of leaflets and fronds, photosynthesis parameters, rate of leaf water loss and leaf cell size were investigated between 1601 and M8. The leaf phenotypic details showed that the leaflets of 1601 were significantly smaller (leaflet size was 53.78% that of M8) and rounder (leaflet aspect ratio was 66.97% that of M8). Its leaflet margins were more serrated (the serrate number was 33.74% that of M8). The fronds of 1601 had more leaflets (1.17-fold that of M8) and shorter leaflet distance (73.44% that of M8). The photosynthetic heterosis was also significant (the net photosynthetic rate in 1601 was 1.43 times that of M8) and the rate of leaf water loss in 1601 was lower than M8. Meanwhile, the results of the leaf microstructure showed that the mesophyll cell area of M8 was smaller than 1601, indicating that the difference in leaf size was caused by the number of cells. To analyze the reasons for these differences in leaf phenotype and explore the important regulatory genes potentially involved in leaf development, the comparative transcriptome analysis of M8 and 1601 and weighted gene coexpression network analysis (WGCNA) were completed. The results showed that hormones, such as auxins and brassinolides (BRs), along with the transcription factors (TFs), such as the growth-regulating factors (GRFs) and TEOSINTE BRANCHED1/CYCLOIDEA/PROLIFERATION CELL FACTOR (TCPs), play essential roles in the difference of leaf size between 1601 and M8 by regulating cell proliferation. These data further shed light on the developmental mechanisms of the leaves of F. mandshurica.

1. Introduction

Leaves are important organs for the photosynthesis, respiration and transpiration of plants. Their size and shape affect the photosynthetic efficiency and growth of plants, which is related to plant growth, nutrition, yield, quality and stress resistance [1]. Leaves originate from leaf primordia. The morphogenesis of leaf primordia can be divided into two stages: the polarity formation stage and cell expansion stage [2,3]. Cell size and cell number are the determinants of leaf size, and the process of cell expansion and differentiation is regulated by phytohormones, growth-regulating factors (GRFs), TEOSINTE BRANCHED1/CYCLOIDEA/PCF (TCP) and other regulatory factors [3,4]. GRFs regulate cell proliferation by promoting leaf growth and are regulated by miR396. miR319 and its target gene, TCP, also play vital roles in leaf development. Among the 24 TCP genes in Arabidopsis thaliana, the knockout of three or more TCP genes in Arabidopsis results in serrated and wavy leaves [5].
Leaf cotyledons have two basic types, simple and compound leaves, which are distinguished by the pattern of leaf distribution on the petiole. Each petiole of a single leaf has an undivided blade. Compound leaves are instead composed of multiple leaf units independently attached to the petiole and are called leaflets. Compound leaves of different plants have great differences in leaf shape, number of leaflets, organization, etc., and show more morphological diversity in nature. Each leaflet is generally considered to be functionally equivalent to a single leaf, helping plants improve photosynthetic efficiency and enhance the plants’ resilience to herbivores [6,7,8]. Although several regulatory factors involved in compound leaf development have been found in the recent study of the legume model Medicago truncatula, which makes people have a further understanding of the genetic regulation of compound leaf development [9], the regulation mechanism of compound leaf development of Fraxinus mandshurica has not been deeply studied.
Ash trees (Fraxinus Linn.) are commonly found in temperate and subtropical regions, ranging from North America to Eurasia, and are mostly large-to-medium-sized deciduous arbors in habitats. Many Fraxinus species are widely cultivated in urban communities due to their aesthetics and ability to thrive in these areas [10]. Fraxinus mandshurica Rupr., as a precious woody tree species of ash, is widely distributed in Northeast China. Although F. mandshurica has many advantages, its annual wood development period is relatively short. In contemporary societies with increasing wood demand, it is of great importance to breed elite varieties. Due to the existence of heterosis, interspecific hybridization is one of the most effective methods to create and use heterosis to obtain desirable traits [11,12,13,14,15]. In the early stage of our experiment, the artificial cross-breeding method was used, and more than 100 hybrid combinations of interspecific hybrid F1 progenies between F. mandshurica and other three kinds of Fraxinus were obtained [16]. Among these hybrid progenies, we found that the 1601, a clone from the D16 hybrid combination, which was one of the interspecific hybridizations of the 8-th plus tree, with F. mandshurica (M8) as the female parent and Fraxinus sogdiana Bunge as the male parent, had special leaf traits. Significant differences can be observed in leaf size, shape and number of leaflets between “1601” and other F. mandshurica varieties, such as M8.
Because F. sogdiana plants cannot live through winter in the cold high-latitude regions, in this experiment, only the leaf phenotype of 1601 and its female parental control M8 were further compared and analyzed. To analyze the reasons for the significant difference in leaf size between 1601 and M8 and to explore the important regulatory genes potentially involved in leaf development, the leaf phenotype survey, comparative transcriptome analysis and weighted gene coexpression network analysis (WGCNA) were performed. Differentially expressed genes involved in leaf development, especially key transcription factors (TFs), like TCPs, were identified. These results may provide a basis for further elucidating the relationship between leaf development and cell proliferation in F. mandshurica.

2. Materials and Methods

2.1. Plant Material

In this study, F. mandshurica and its interspecific hybrid progeny were selected as the research object. We crossed F. mandshurica (female parent) with F. sogdiana (male parent) to obtain interspecific F1 hybrid clones that could obtain the good characteristics of the parents. Flowering branches of the male parent were collected from Xinjiang Agricultural University in mid-April. The branches were kept in water, and the pollen was collected in test tubes and stored at 4 °C for use. The female parent selected for the interspecific hybridization was F. mandshurica from the Dailing National Seed Orchard (46°50′~47°20′ N, 128°37′~129°7′ E) of Heilongjiang province. The process consisted of pollen treatment by high-voltage electrostatic field to overcome the barriers in interspecific hybridization and improve seed vitality, artificial bagging, pollination, and removing bags [17]. The scions of M8 and 1601 were grafted on the 2 yr appropriate and uniform F. mandshurica seedlings in May 2018. These plants of M8 and 1601 clones were planted in the Maoershan Experimental Forest Farm of Northeast Forestry University (North latitude 45°18′; East longitude 127°30′). Both the M8 and 1601 clones were in the same growth environment, namely lighting, plant nutrition, and variegated soil fertility, and were irrigated at the same time to ensure the same external growth environment. The leaves taken in this experiment were all obtained in June 2021.

2.2. Determination of the Leaf Phenotype

The function fronds of the same position from thirty plants of M8 and 1601 clones were taken to observe and compare their complete leaf morphology. For the phenotype of function fronds, the leaflet distance, leaflet number, petiole length and total length of the fronds were recorded, and a vernier caliper was used to measure the length and width of the leaflets. After stacking 30 pinnules, the average value was calculated to obtain the thickness of leaflets.
30 pinnules of two varieties were fixed onto paper with uniform texture, the shape of the leaves was carefully traced using a pencil along the edge of the leaves, and then they were cut off with scissors. The cut paper was weighed and recorded on the electronic scale. At the same time, the weight of the paper per unit area was weighed, and then the leaf area was obtained. The experiments were performed in three biological replicates. 30 pinnules of two varieties were placed on two Petri dishes together with their respective weighing papers, and then they were weighed every 1 h for 2 days, and the results were recorded.
The middle of the leaves of the two varieties, with a size of 0.5 cm2, were fixed with FAA fixative. These samples were then dehydrated in a series of elevated ethanol concentrations, infiltrated with xylene and paraffin, and embedded in paraffin blocks. A microtome was used to cut the paraffin block into 8 µm sections. Next, xylene and ethanol were used to remove paraffin. The sections were then stained in 0.01% toluidine blue. Then, the slides were examined under a U-LH100HG light microscope, and the image-analysis system was used to observe the distribution of stomata in the epidermis of the leaf, the number of stomata per unit area and the morphology of mesophyll cells.

2.3. Determination of Photosynthetic Parameters of Leaves

Mature leaves from the same position of the parent and offspring were selected, and the net photosynthetic rate, stomatal conductance, intercellular CO2 concentration and net transpiration rate indexes were measured using the Li-6400 photosynthesis meter from 9:00 to 11:00 a.m. In this assay, leaf samples were taken from three plants of M8 and 1601 clones grown in the same environment, and the experimental results were taken as the average value of the 3 biological determinations.

2.4. Complementary DNA Library Construction and RNA Sequencing

The Plant RNA Kit (OMEGA, Canton, China) was used to isolate the total RNA from leaf (L), xylem(X) and phloem(CP) tissue samples of 1601 and M8 (leaves were sampled from three plants of M8 and 1601 clones grown in the same environment, and samples were quickly put into a −80 °C refrigerator for later use). RNA concentration and purity were determined using a NanoDrop 2000 spectrophotometer (Thermo Fisher Scientific, Wilmington, NC, USA) and the Bioanalyzer 2100 system (Agilent Technologies, Santa Clara, CA, USA), respectively. RNA integrity was validated using 1% agarose gel electrophoresis. Then, RNA-seq libraries were prepared for sequencing at the Beijing Genomics Institute (Beijing, China). The DNBSEQ platform was used for transcriptome sequencing. Raw reads were filtered to obtain high-quality reads. The clean reads were aligned with the reference genome using Hisat2 software (version 2.1.0) [18] and the reference genome version for the ash tree genome (http://www.ashgenome.org/transcriptomes (Annotation Version 4 (TGAC v2)—on assembly BATG-0.5), accessed on 15 March 2022). After each sample was spliced using StringTie software (version 1.3.3b), the expression levels of the genes and transcripts were quantified using RSEM software (version 1.3.1), and the quantitative index was expressed in fragments per kilobase of exon model per million mapped fragments (FPKM) [19]. The annotation of the genes and transcripts was performed on public databases, including Nr, GO and KEGG. Differentially expressed genes (DEGs) were determined using DESeq2 (version 1.24.0) by edgeR (version 3.24.3). DEGs met the criteria of |log2(fold-change)| ≥ 1 and corrected for p ≤ 0.05. All the DEGs were analyzed for gene ontology (GO) enrichment using goatools (version 0.6.5) [20] and KEGG enrichment using KOBAS software (version 2.1.1).

2.5. Weighted Gene Coexpression Network Analysis (WCGNA) for Leaf-Specific Expressed Genes

The “WGCNA” package in R software (version 3.6.1) was used to analyze the coexpression network of genes specifically expressed in the leaves of two tree species [21]. This analysis aims to find gene modules that are coexpressed and explore the association between the gene networks and phenotypes of interest, as well as the core genes in the network. It mainly includes four steps: calculation of the correlation coefficient (Pearson coefficient) between genes, determination of gene modules, construction of co-expression network, and association between modules and traits. The details of the correlation analysis for each module of the two species are as follows: FPKM ≥ 1, variation of FPKM: cv ≥ 0.5; weighted network: unsigned; hierarchal clustering tree: dynamic hybrid tree cut algorithm; power: 7; minimum module size: 30; minimum height for merging modules: 0.27. After combining these analysis results, we selected the enrichment module with highly specific gene expression to construct the subsequent core gene-interaction network.
In order to identify the possible relationship between leaf-formation-related genes, the first 1000 gene relationship pairs in the selected edge file of WGCNA were selected, and these pairs were imported into Cytoscape software (version 3.9.0) to construct the coexpression network of leaf-formation-related genes to describe the coexpression relationship between the parent and offspring.

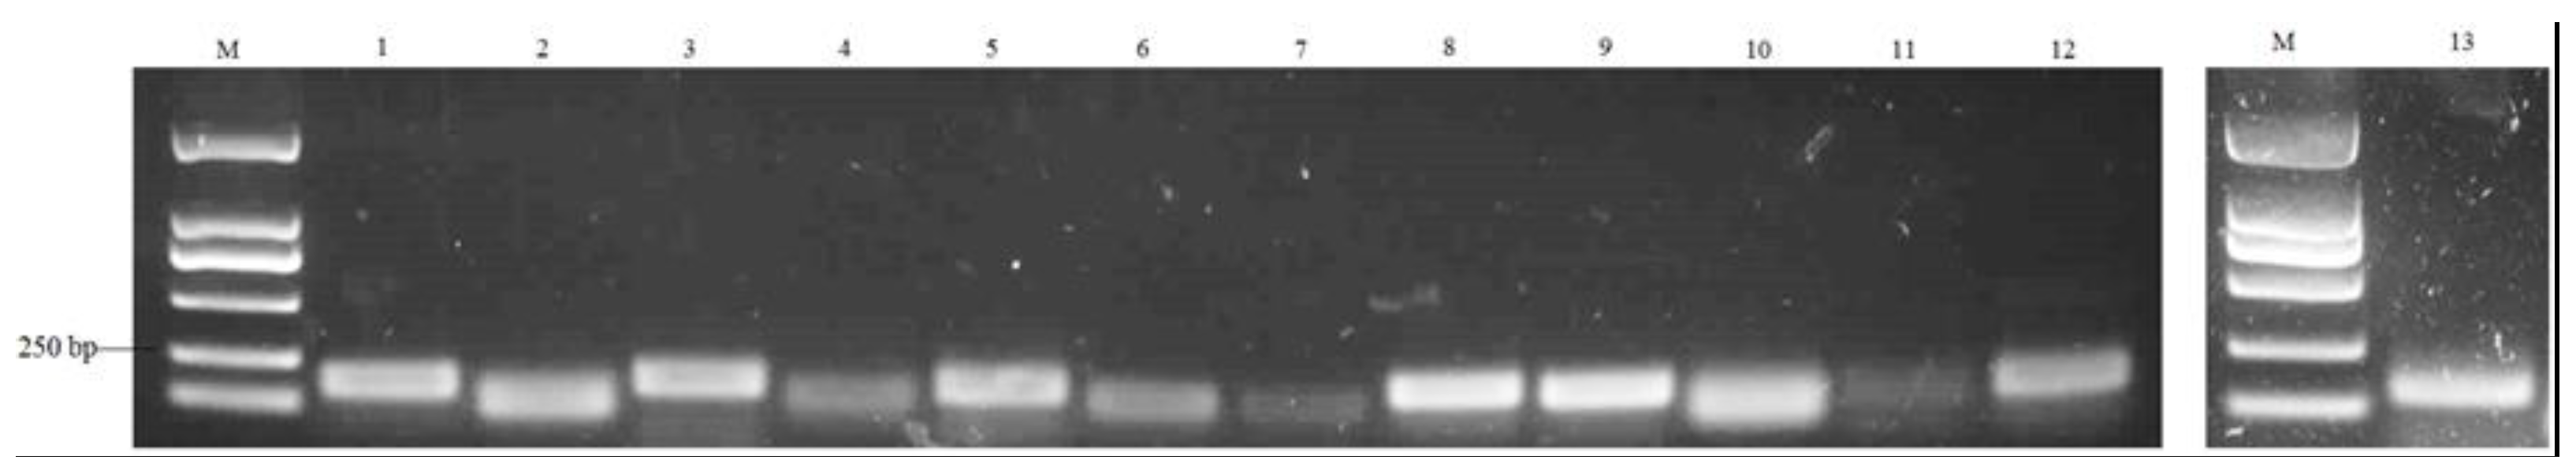
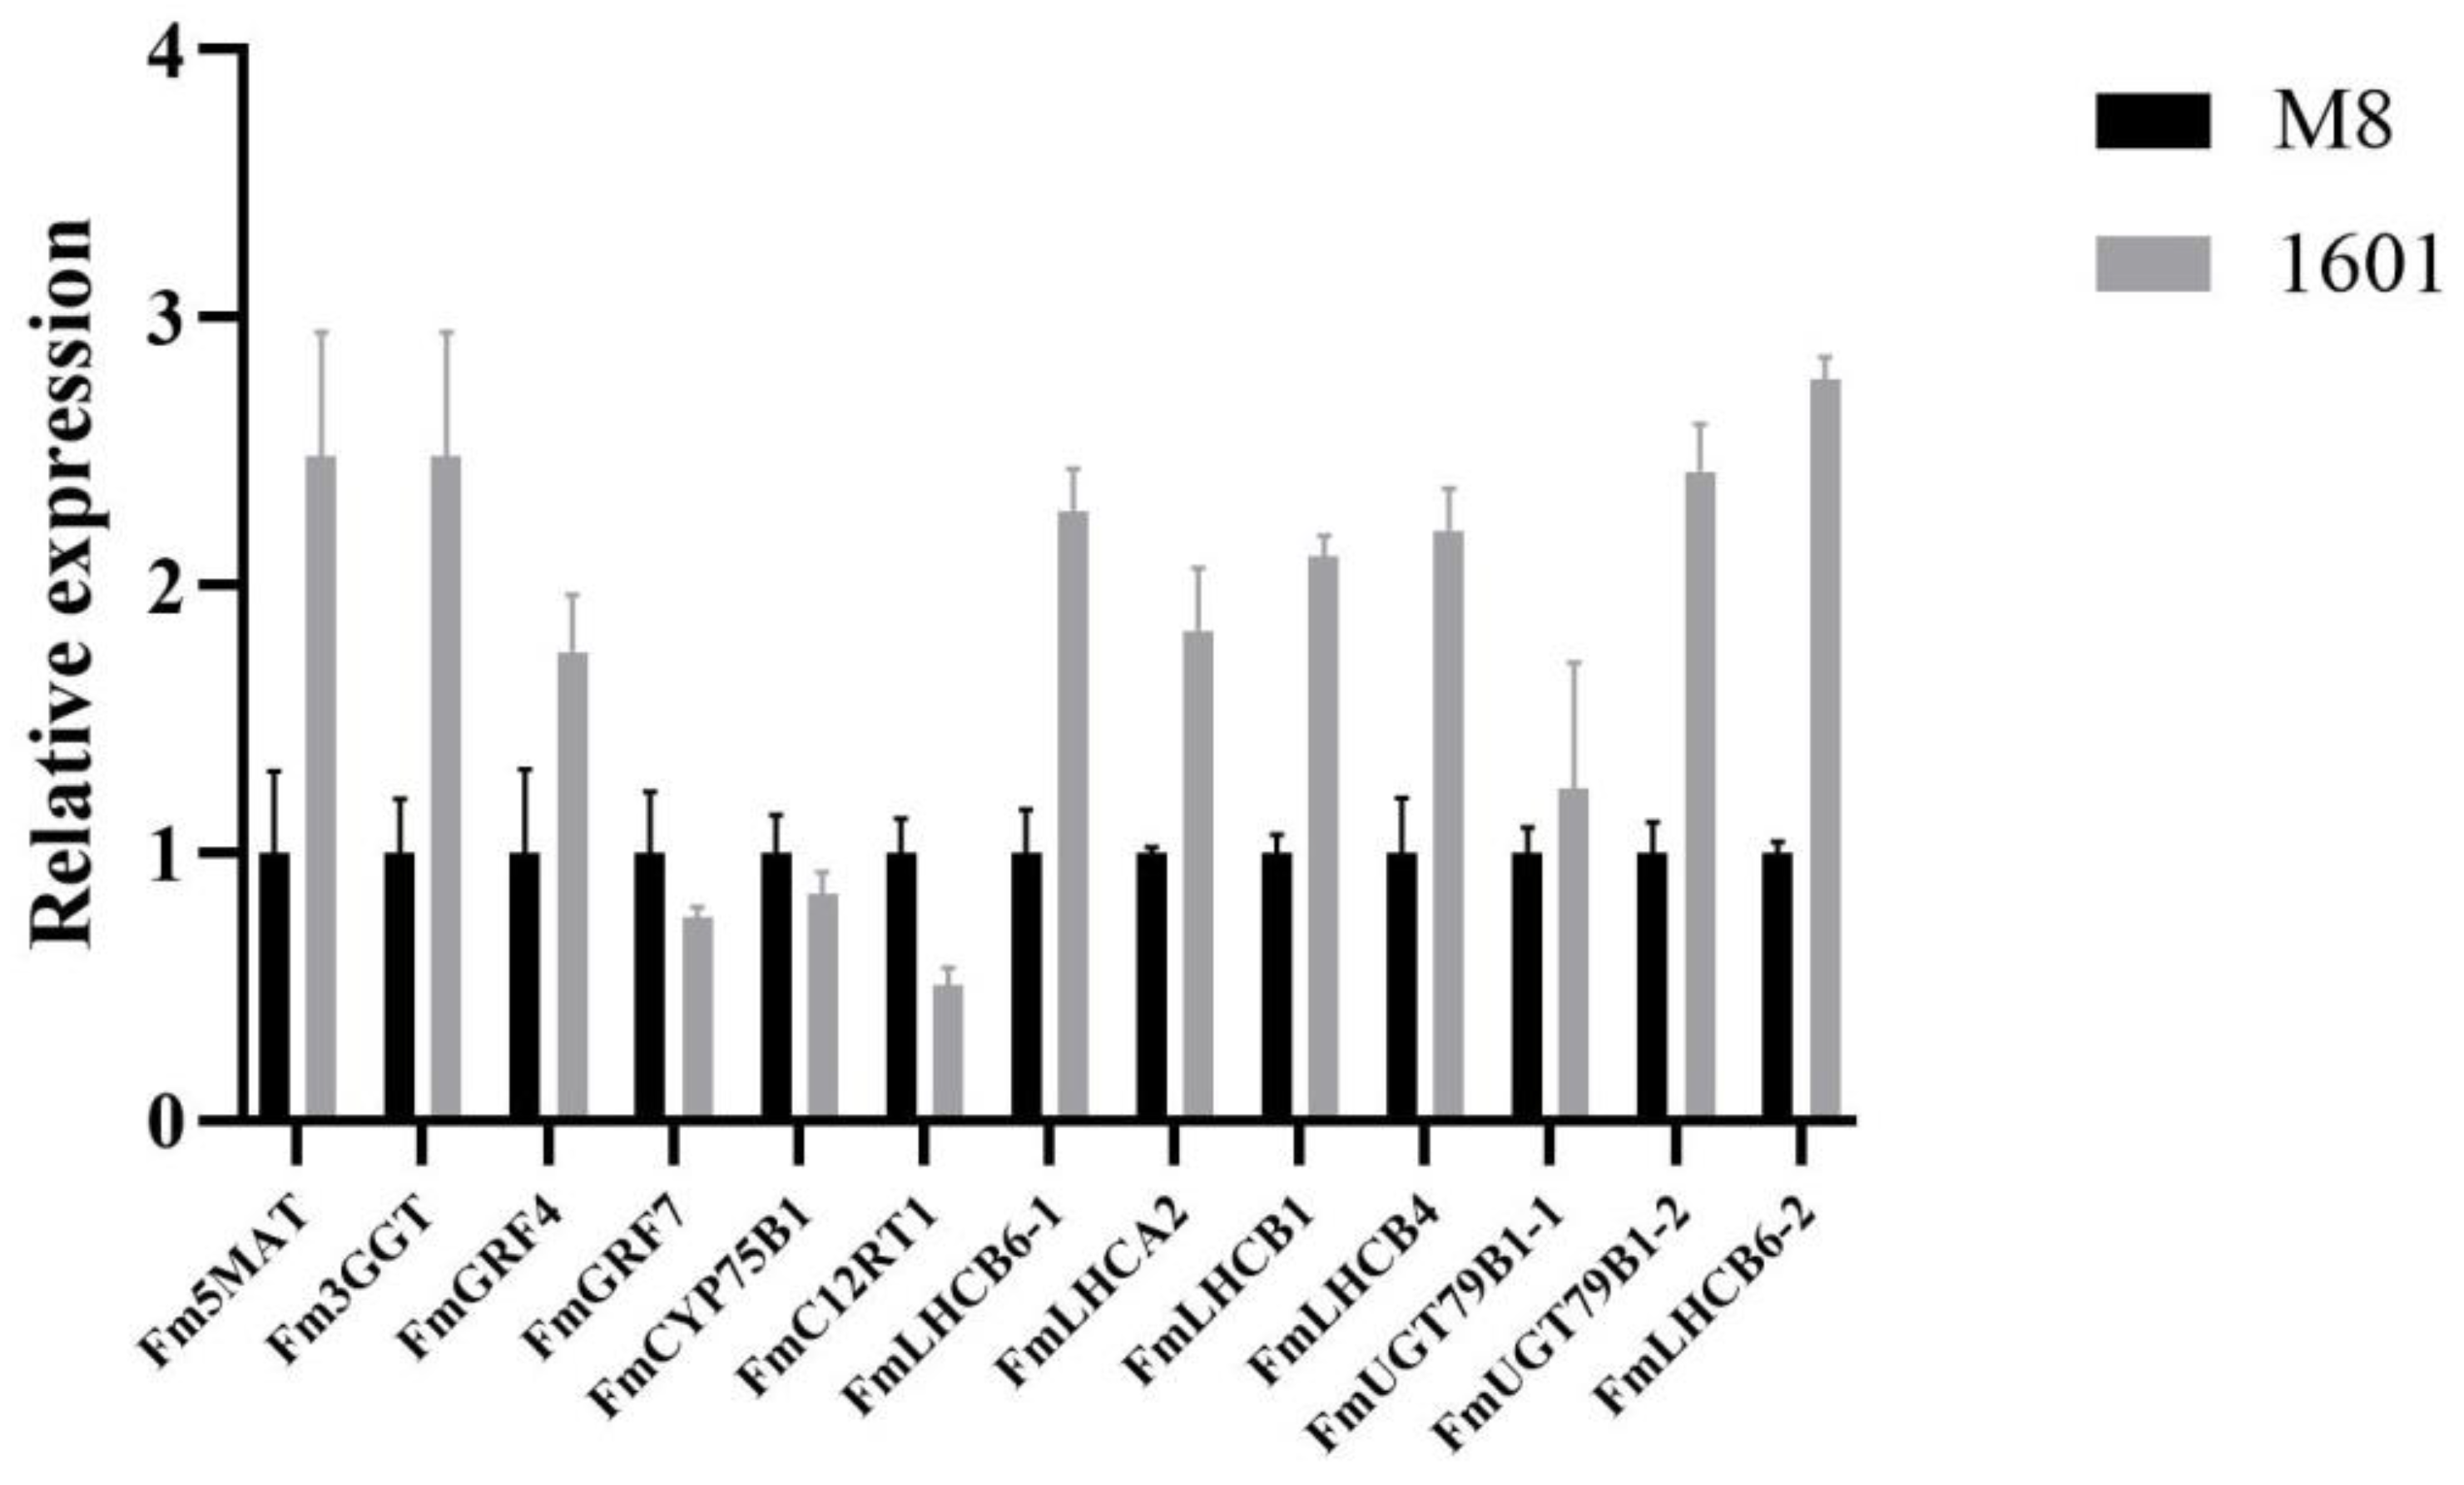
2.6. Validation of RNA-Seq Data by Quantitative Real-Time PCR (qRT-PCR)

The RNA of 1601 and M8 leaves was extracted using the Tris-CTAB method and reverse transcribed into cDNA as template. 13 genes were selected for the qRT-PCR analysis. The primers for qRT-PCR were designed using the primer design tool from NCBI (https://www.ncbi.nlm.nih.gov/, accessed on 1 April 2022), and primer sequences were provided in Table 1. Primer synthesis was carried out by Tsingke Biotechnology Co., Ltd. (Harbin, China). PrimeScript™ II 1st Strand cDNA Synthesis Kit from TAKARA BIO INC. (Beijing, China) was used to synthesize the cDNA from all the RNA samples by reverse transcription. Experiments were performed on a ABI 7500 fluorescent quantitative PCR instrument using a TransStart® Top Green qPCR SuperMix from TransGen Biotech (Beijing, China). Six technical replicates were performed for each sample. The expression levels of the genes in the list were calculated using the 2−∆∆Ct method [22].

2.7. Data Processing and Statistics

Data were processed using Excel and SPSS 22.0 Inc., Software (Chicago, IL, USA), and differences between 1601 and M8 were determined using analysis of variance (ANOVA) followed by Duncan’s test (with a probability level of 0.05 and 0.01 being treated as statistically significant and extremely significant, respectively). The figures were drawn using Prism 7.0.

3. Results

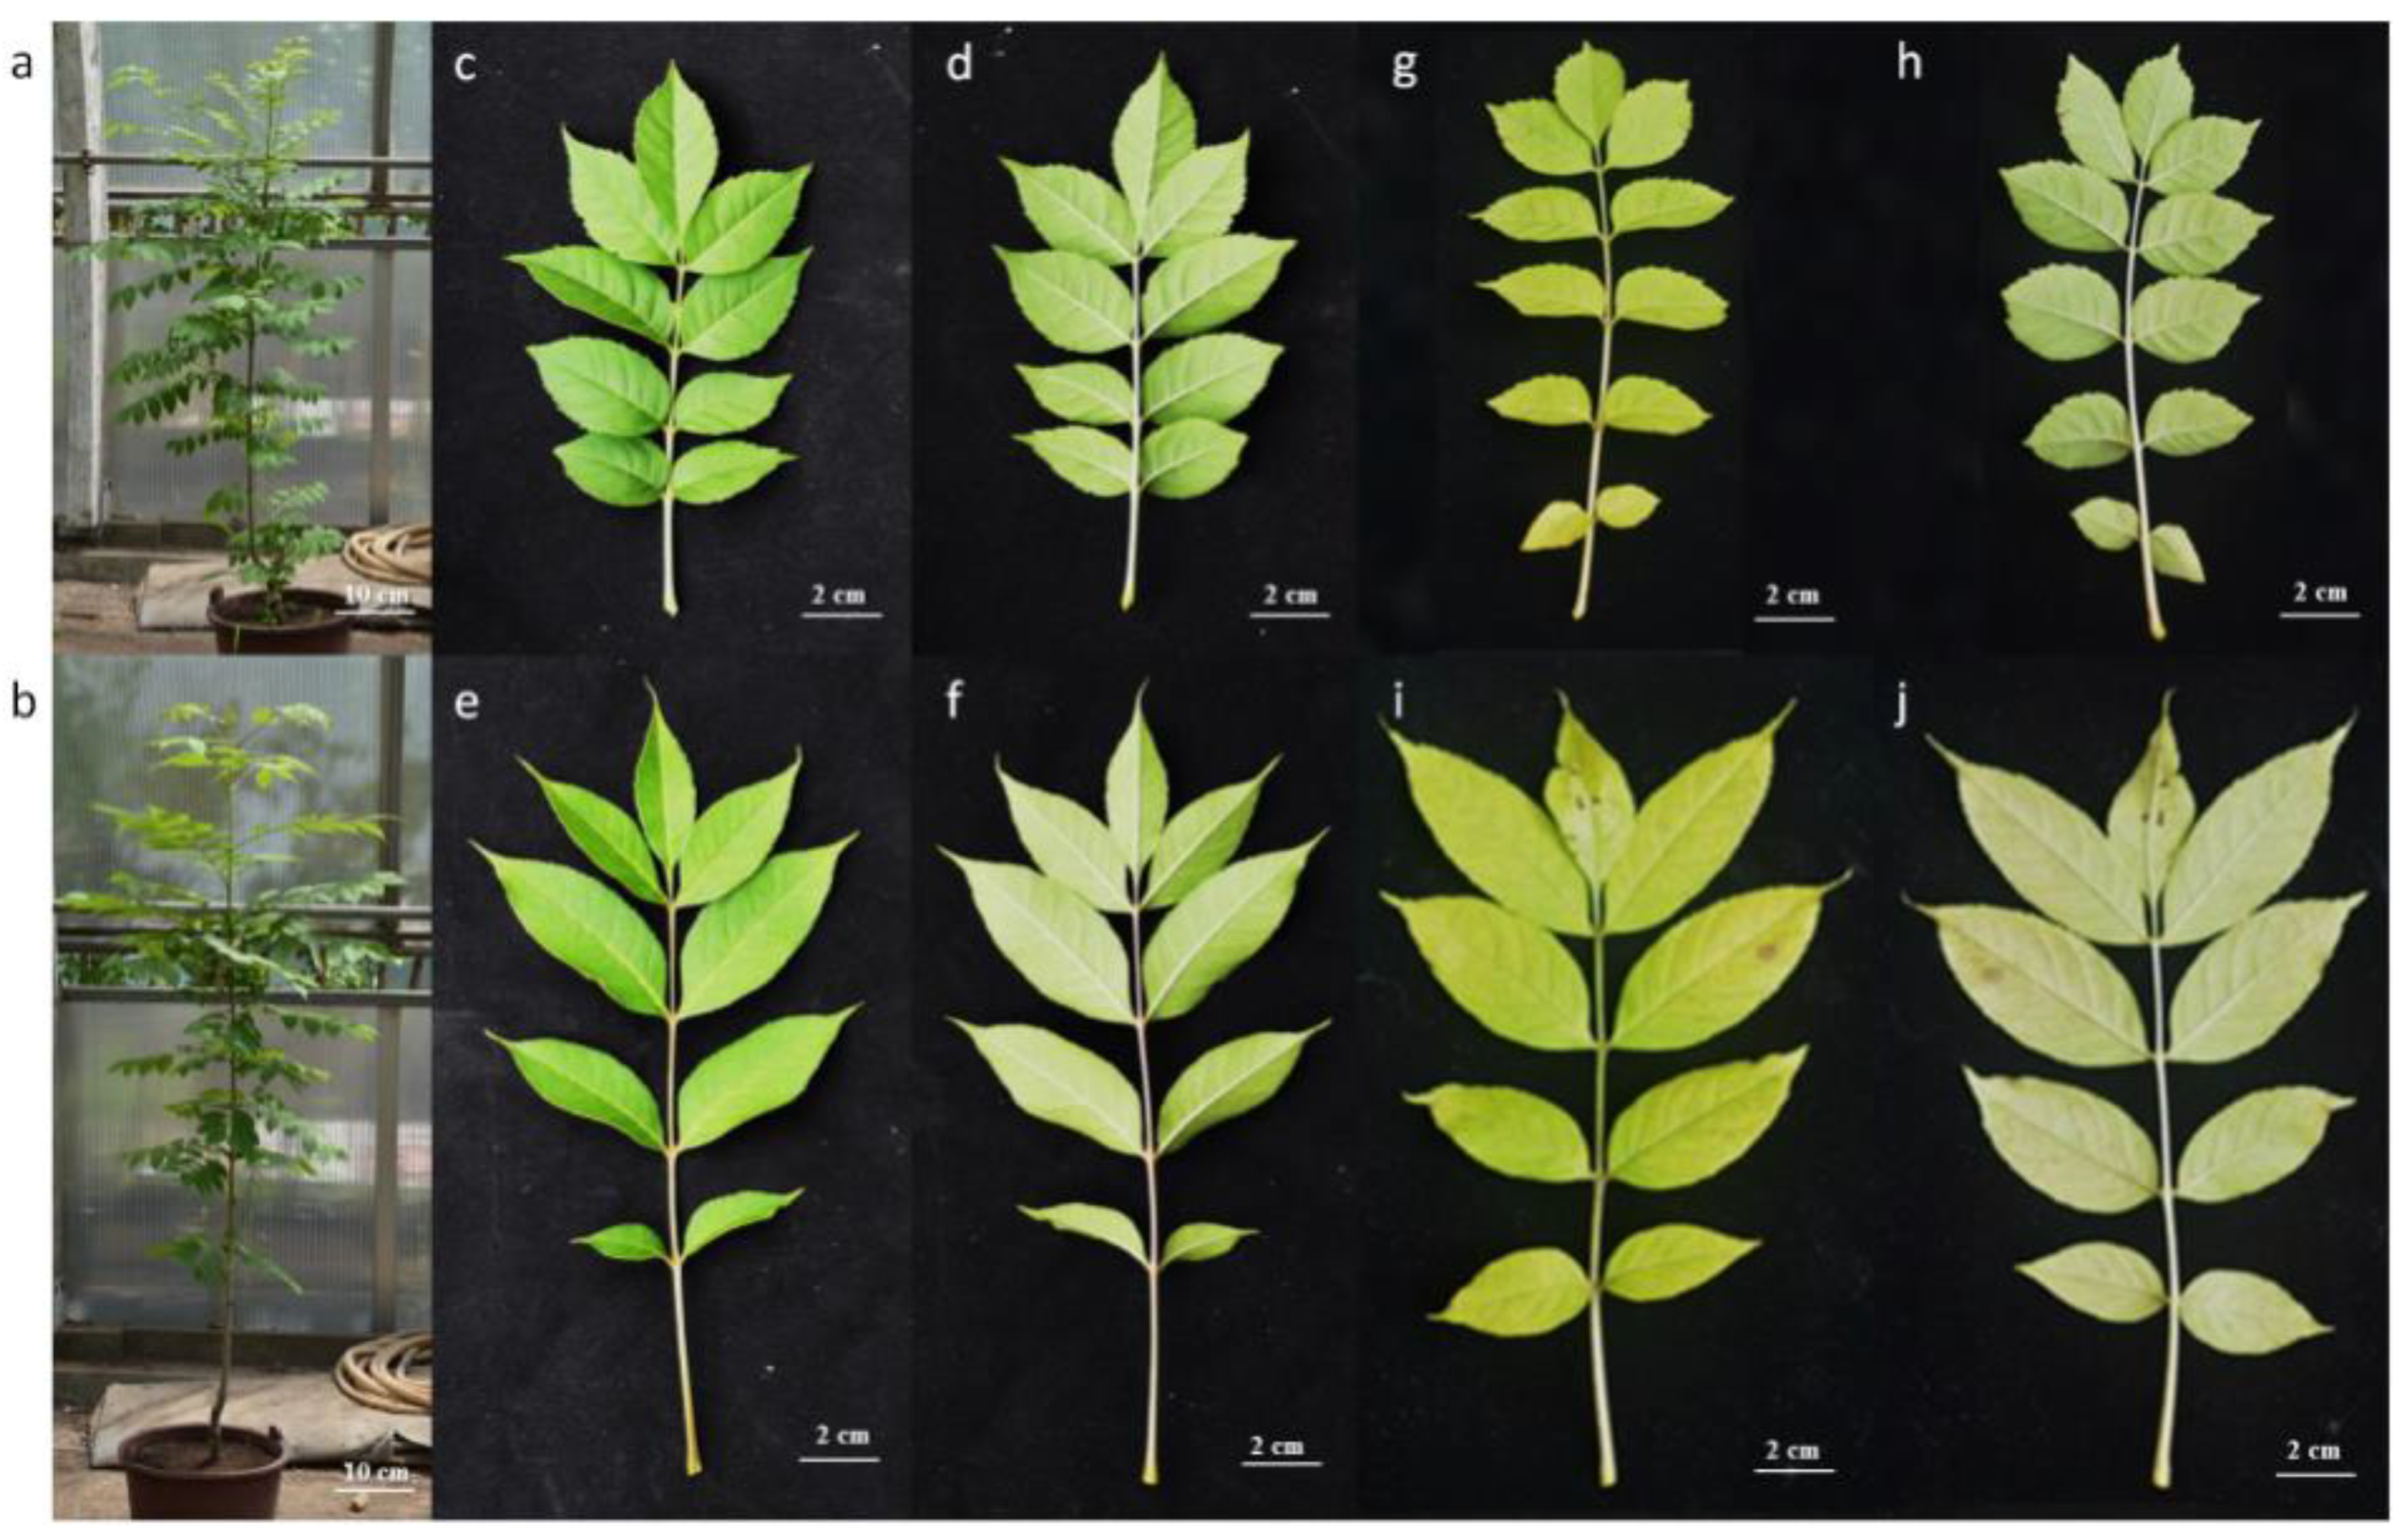
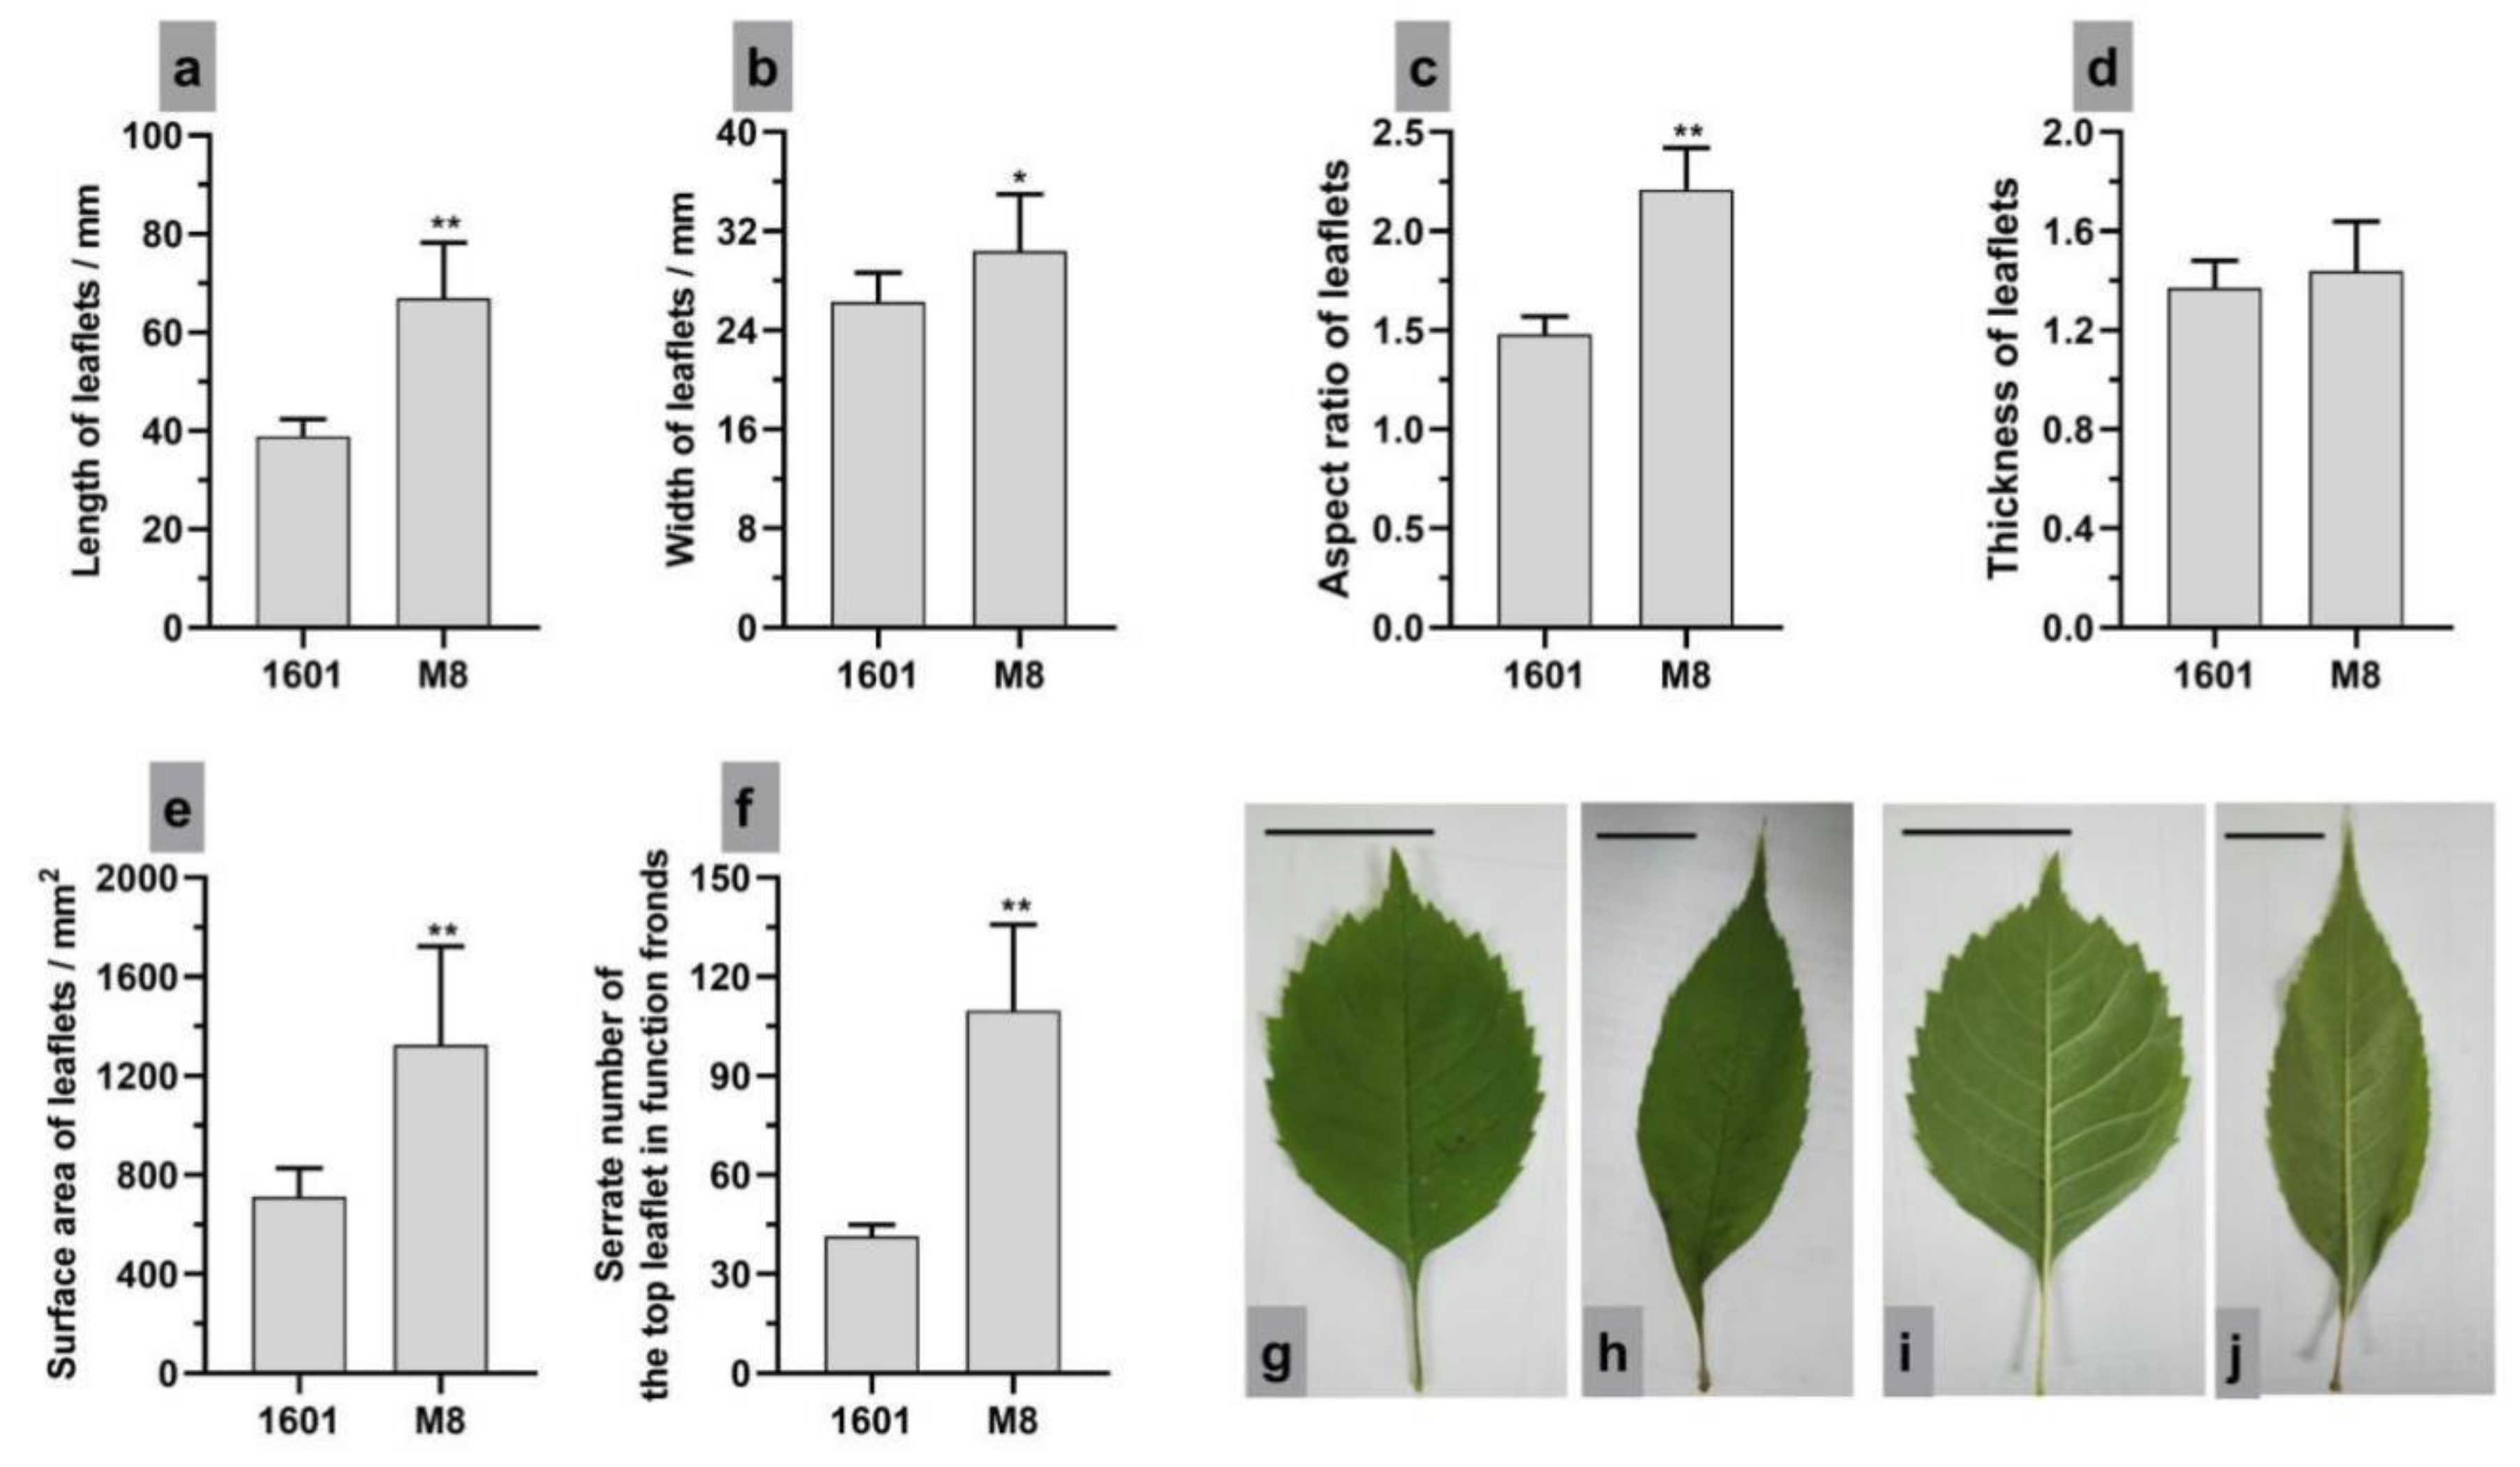
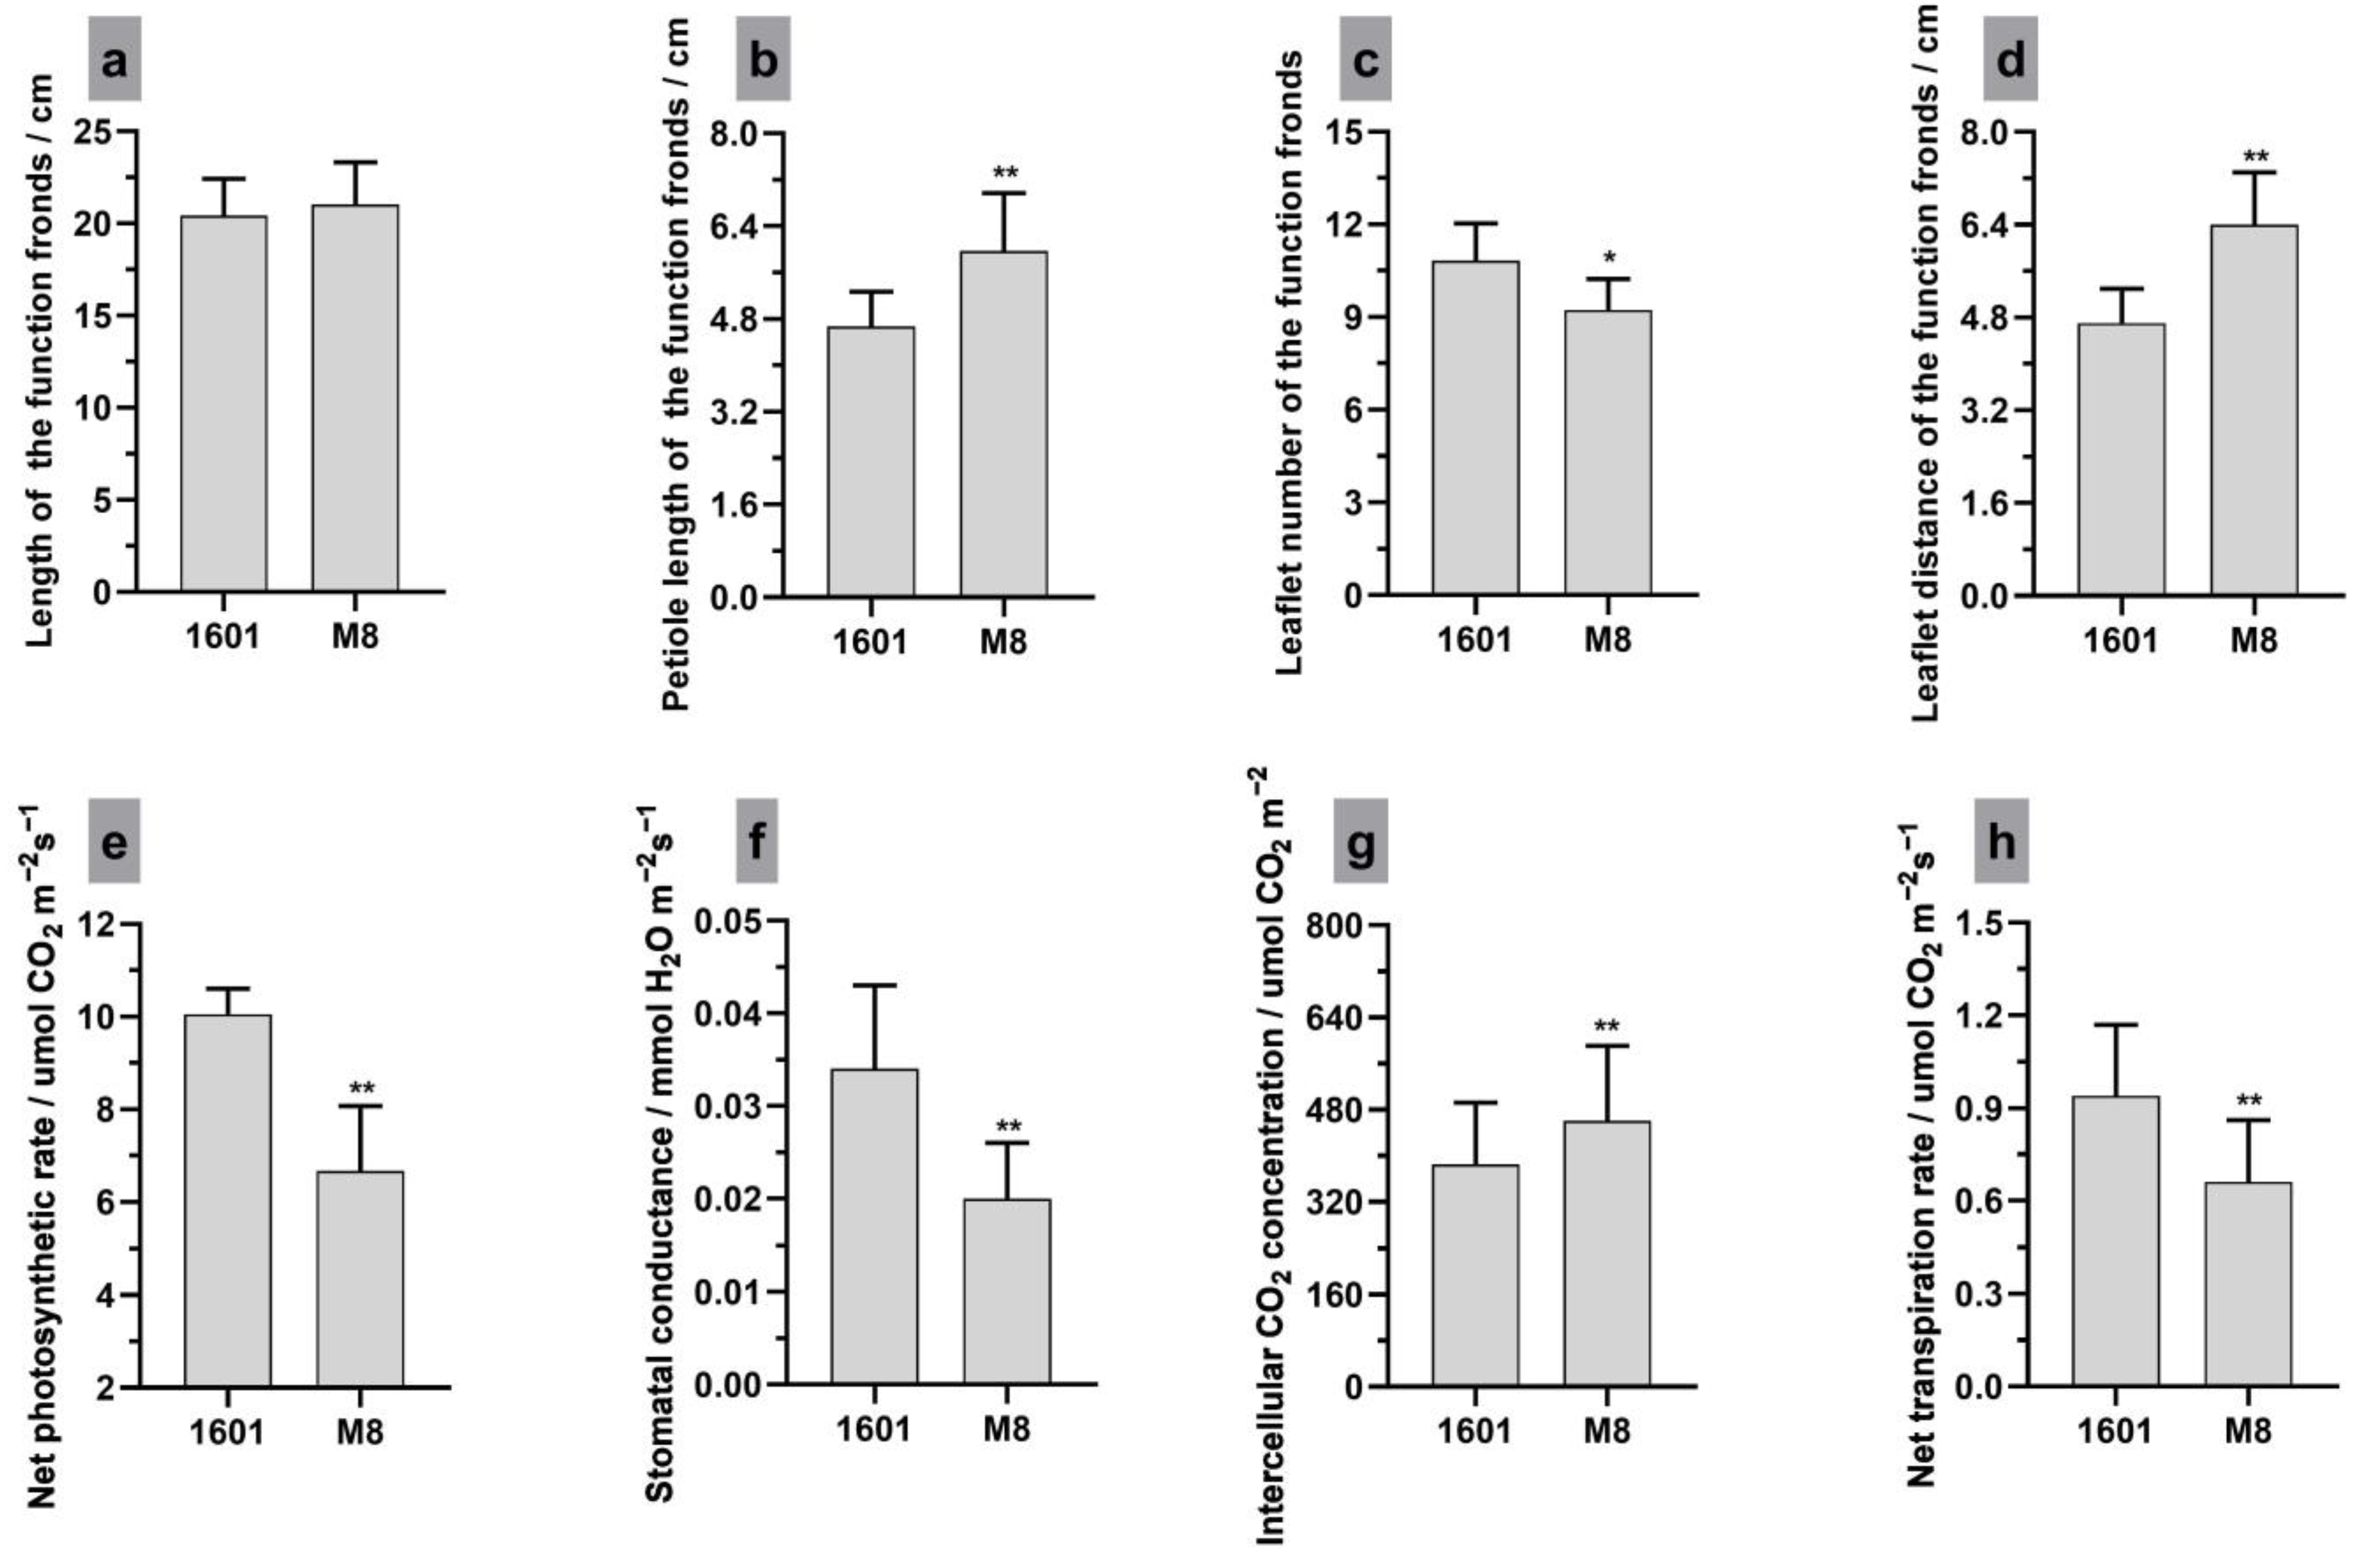
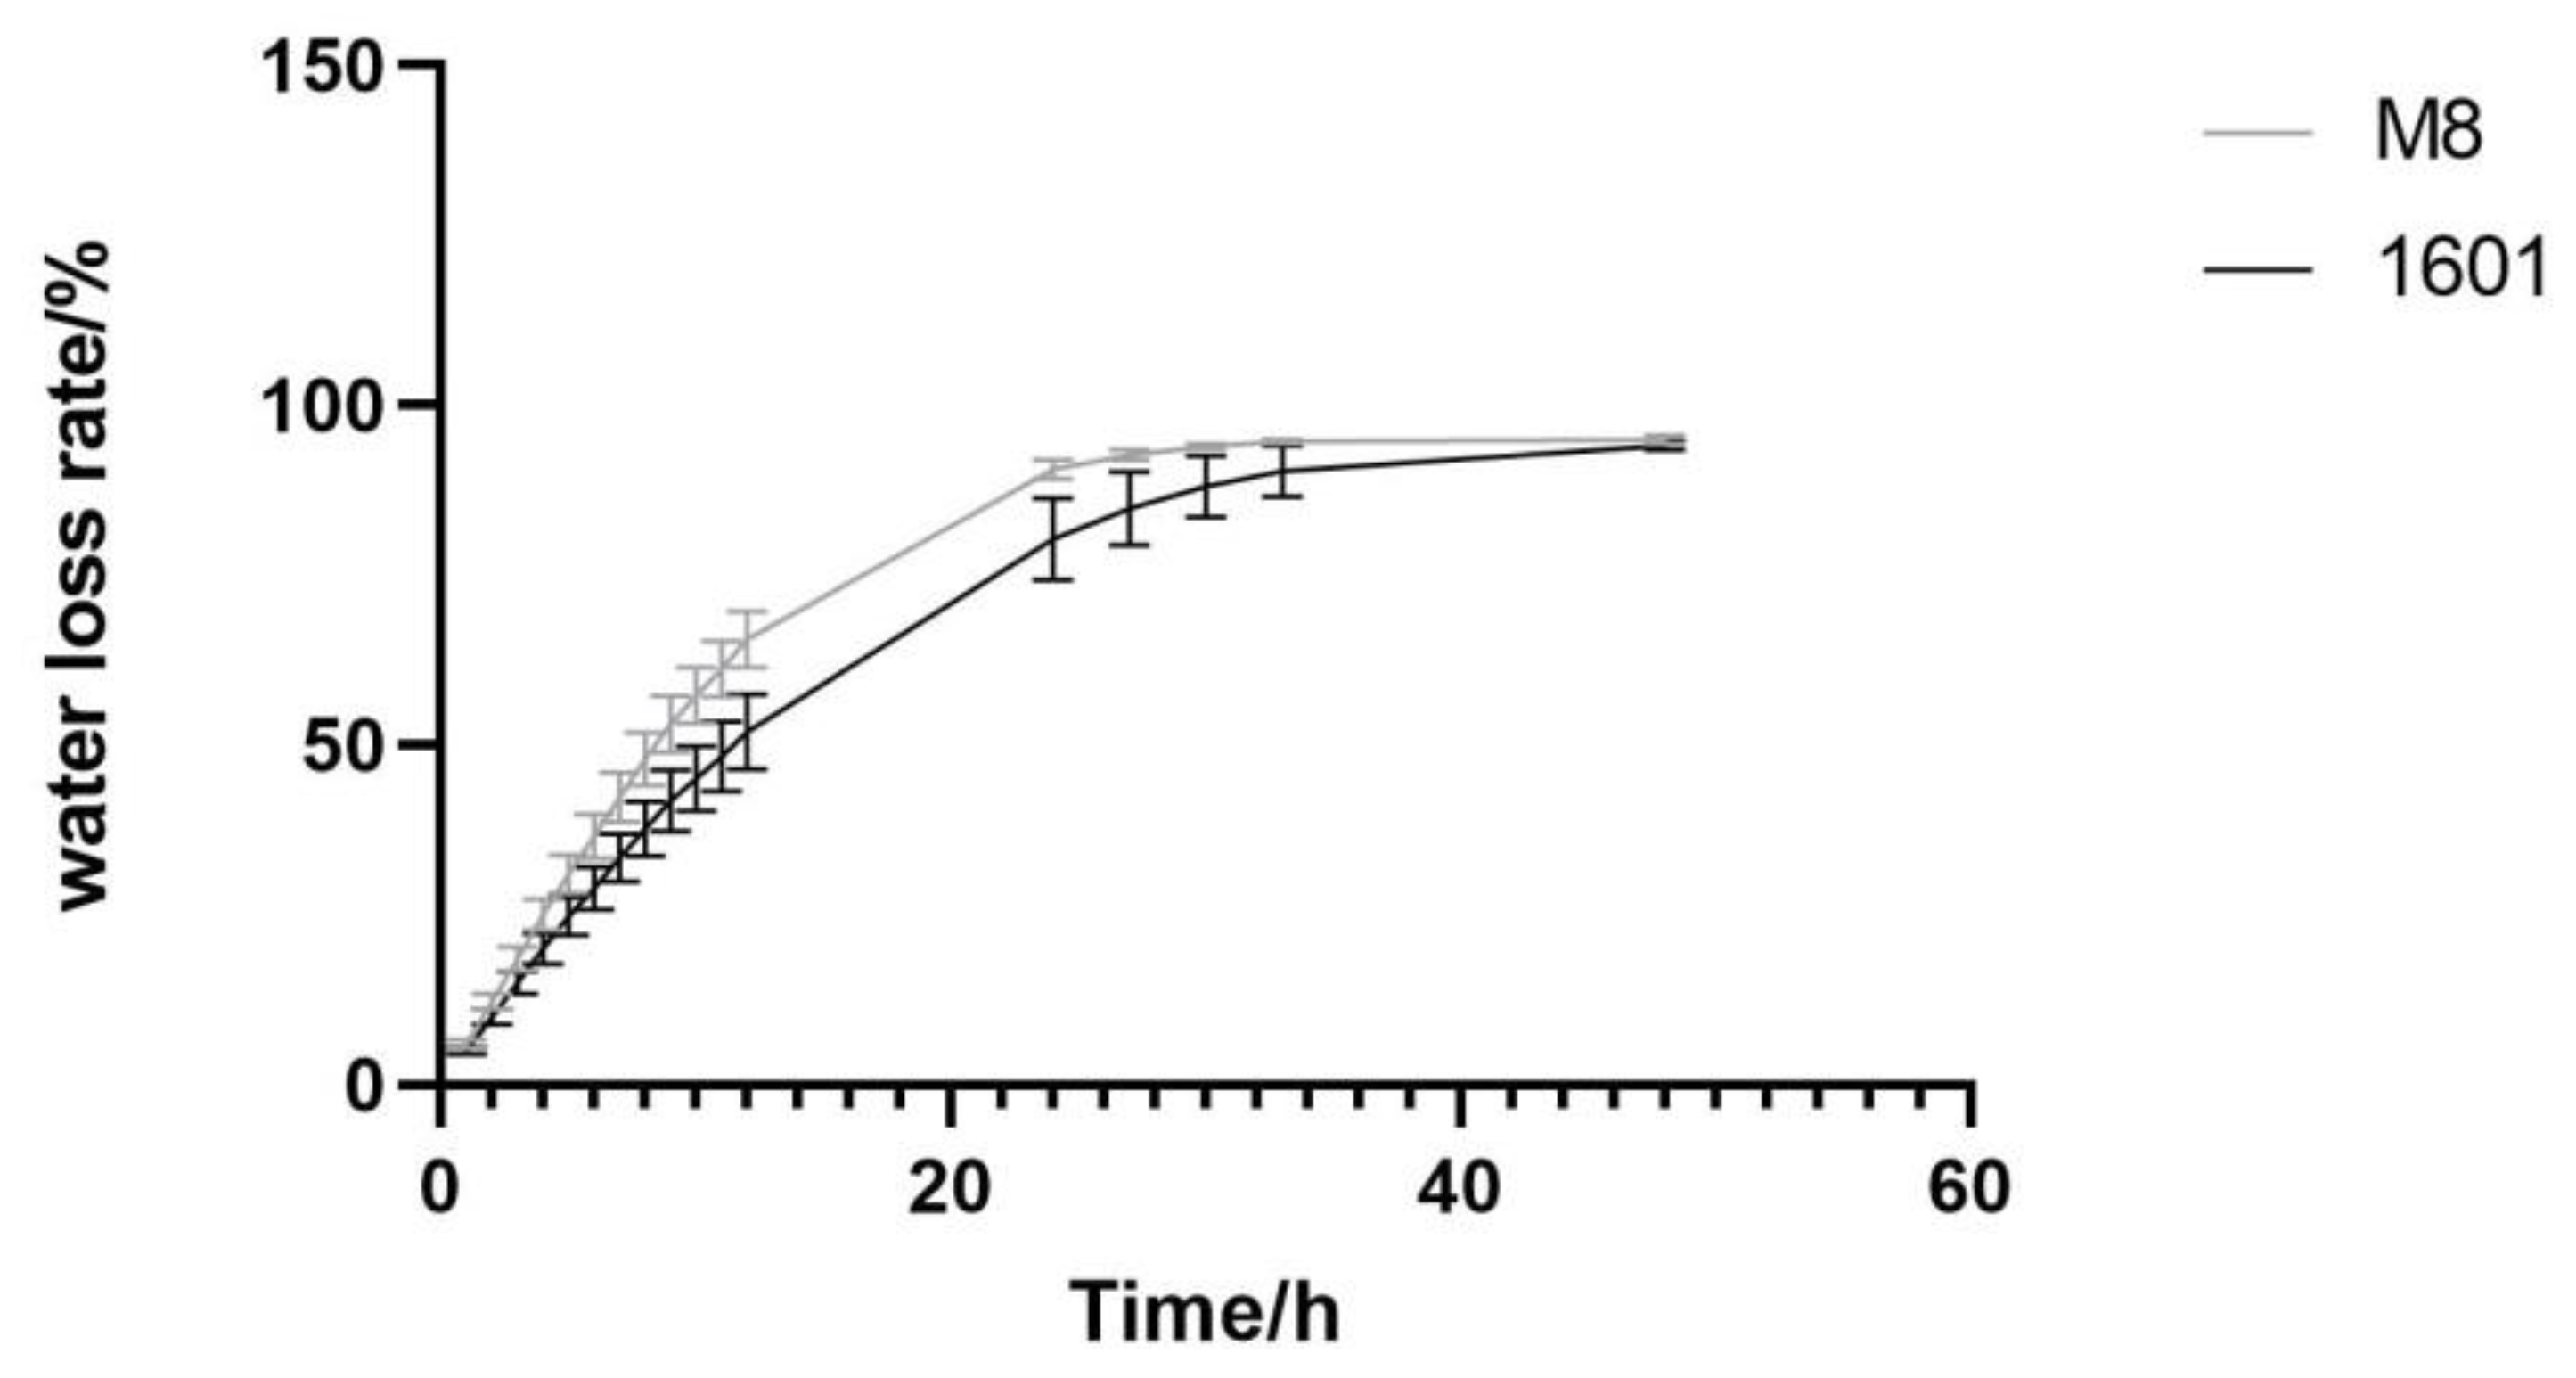
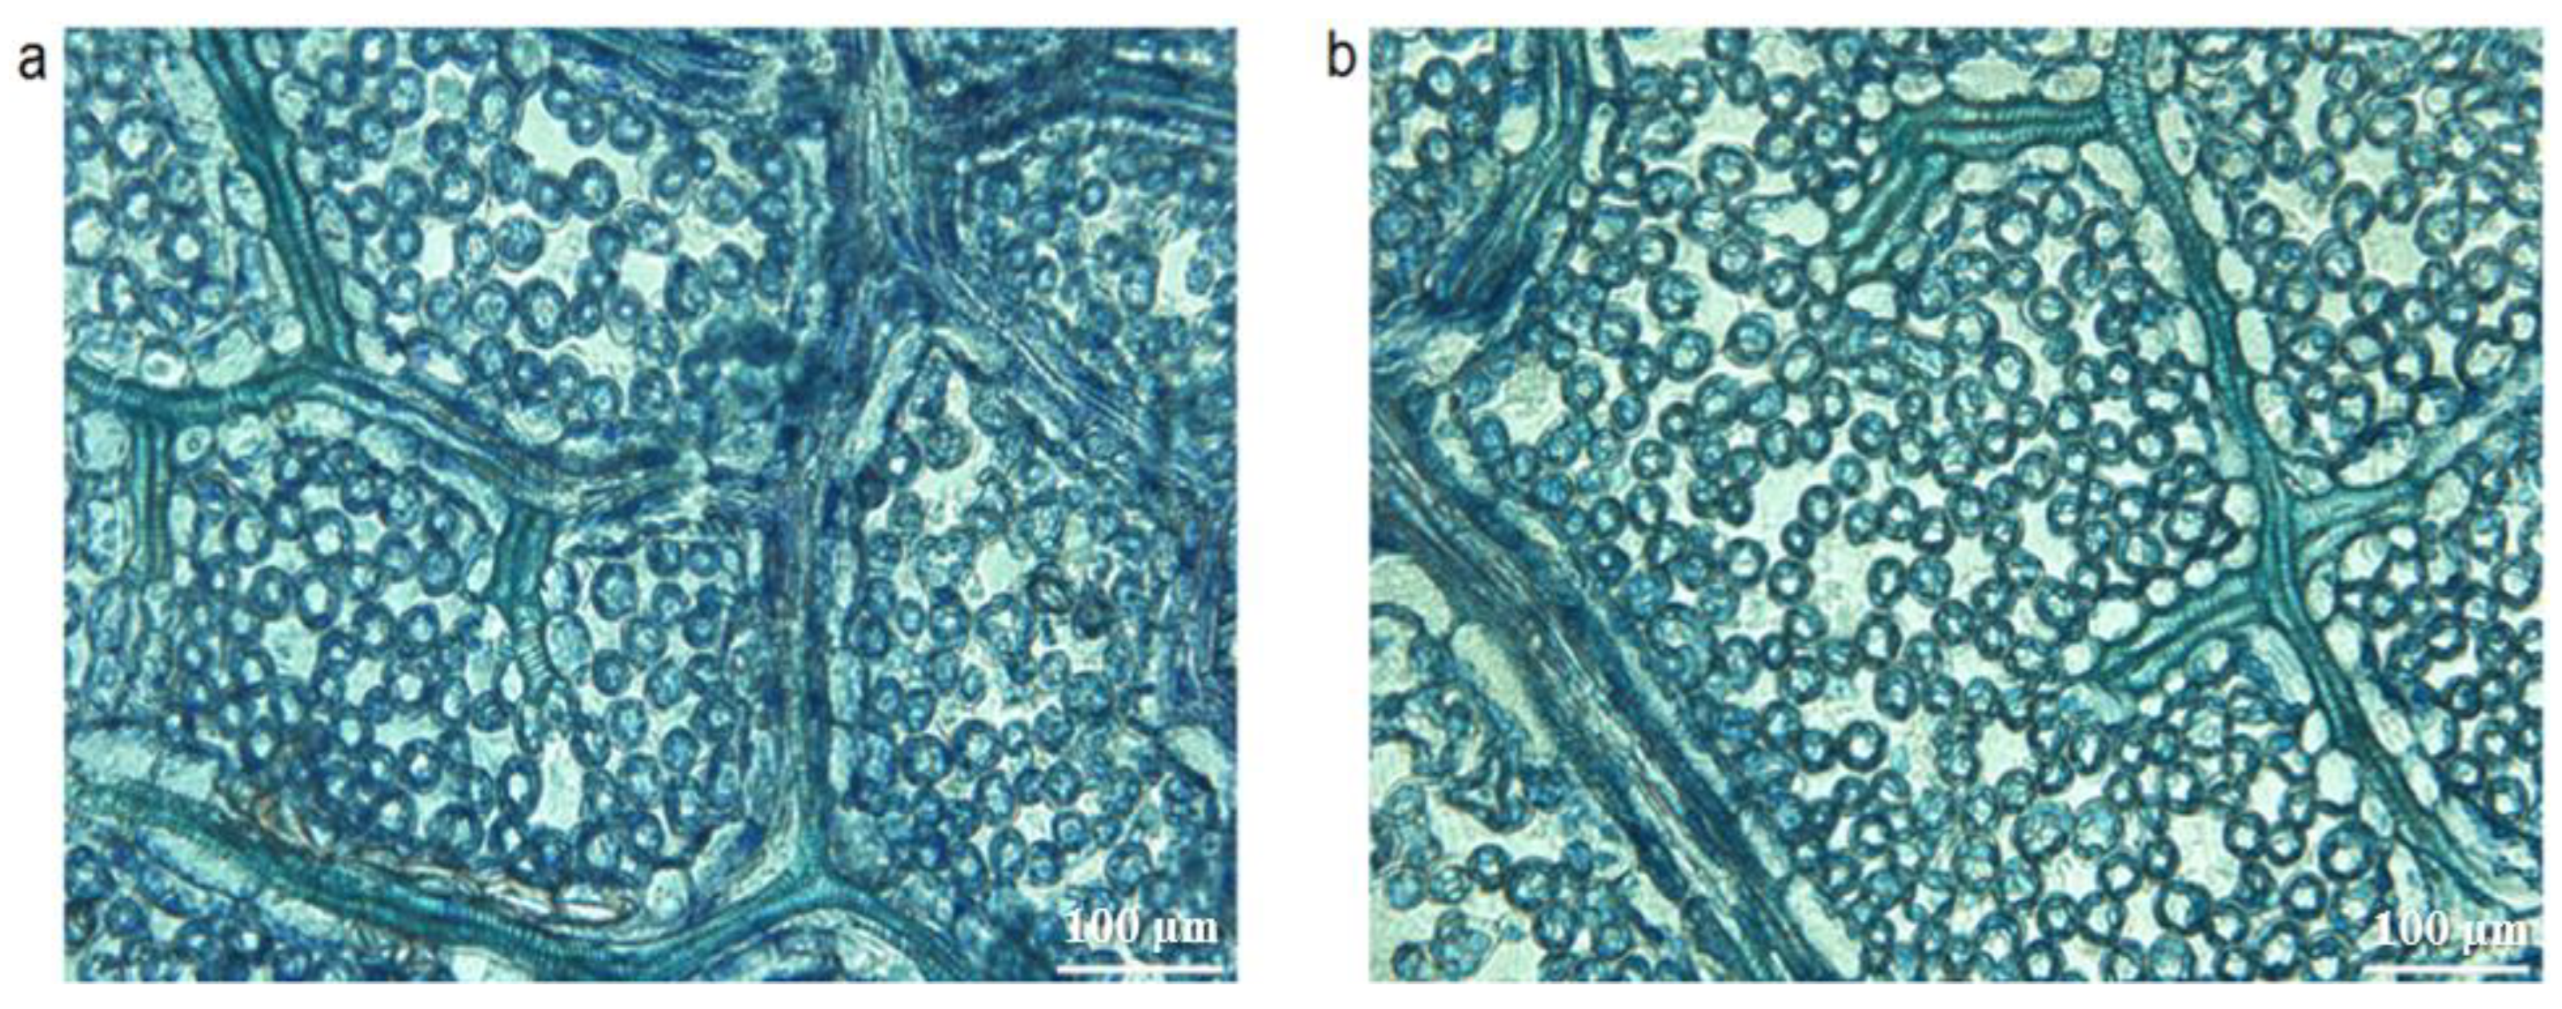
3.1. Leaf Morphology, Photosynthetic Parameters and Microstructure of Interspecific Hybrid (1601) and Its Female Parent (M8)

The plant and leave phenotype of 1601 and M8 at the same position showed that the leaf phenotype of M8 and 1601 were quite different (Figure 1). In order to visualize these differences, the leaf and leaflet phenotype (the length, width, aspect ratio, thickness, surface area and serrate number), the frond phenotype (the total length, leaflet number, petiole length and leaflet distance) and photosynthetic parameters (the net photosynthetic rate, stomatal conductance, intercellular CO2 concentration and net transpiration rate) of the two varieties were measured (Figure 2 and Figure 3). The results showed that the leaflet length of 1601 was 38.84 mm, which was 58.02% that of M8, and the difference was extremely significant (p < 0.01, Figure 2a); the leaflet width was 26.28 mm, which was 86.48% that of M8, and the difference was significant (p < 0.05, Figure 2b); the leaflet aspect ratio was 1.48, which was 66.97% that of M8, and the difference was extremely significant (p < 0.01,Figure 2c); leaflet thickness was 1.37 mm, which was 95.14% that of M8, and the difference was not significant (p > 0.05, Figure 2d); leaflet area was 713.33 mm2, which was 53.78% that of M8, and the difference was extremely significant (p < 0.01, Figure 2e); the serrate number of the top leaflet was 41.47, which was 33.74% that of M8, and the difference was extremely significant (p < 0.01, Figure 2f). In a word, the leaflets of 1601 were significantly smaller and rounder, and its leaf margins were more serrated, especially for the top leaflet (Figure 2g–j).
Meanwhile, the frond phenotype showed that, in comparison to M8 and in addition to the nonsignificant length index (Figure 3a), the function fronds of 1601 have significantly more leaflets (1.17-fold that of M8; Figure 3c) and shorter petiole length and leaflet distance (78.22% and 73.44% that of M8; Figure 3b,d). Photosynthesis is one of the basic physiological activities of plants, which represents the carbon assimilation capacity of tree species. Results showed that the net photosynthetic rate, stomatal conductance, net transpiration rate of 1601 were 9.8 μmol CO2 m−2s−1, 0.034 mol H2O m−2s−1 and 0.94 mmol H2O m−2s−1, which were 1.43, 1.70 and 1.42 times those of M8, respectively, and the differences were all extremely significant (p < 0.01, Figure 3e,f,h); the intercellular CO2 concentration of 1601 was 384.94 μmol CO2 m−2s−1, which was 83.5% that of M8, and the difference was extremely significant (p < 0.01, Figure 3g).
The rate of leaf water loss ex vivo represents the drought tolerance of the plants to some extent, and the faster the rate of water loss indicates the less drought resistant the plants are. After 48 h of continuous observation, we found that the water loss rate of 1601’s isolated leaves was lower than that of M8 within 48 h (Figure 4), which indicated that the drought tolerance of 1601 is higher than that of M8.
To further explore the leaf phenotypic differences between 1601 and M8, we performed paraffin sectioning on the leaves of the two varieties to observe the differences in mesophyll cells (Figure 5). The results of the unit area of mesophyll cells in the leaves showed that the mesophyll cells of 1601 (the cell number was 1180 mm−2) were slightly larger than that of M8 (the cell number was 1260 mm−2), but the difference was not significant (p ≥ 0.05).

3.2. Transcriptome Sequencing of M8 and 1601 Leaves

In order to explore the reasons for the differences in leaf development between 1601 and M8, the leaves of the two varieties at the same position were selected for transcriptome analysis. In the quality detection of RNA, the 28S/18S values of the 1601 and M8 samples were both greater than or equal to 1.2, indicating that the RNA quality of the samples was good. After obtaining clean reads, Hisat2 was used to align the clean reads to the reference genome sequence. The filtering software SOAPnuke (v1.4.0), independently developed by BGI, was used for filtering. The specific steps taken are as follows: the reads containing adapters were removed firstly, the reads with an unknown base N content greater than 5% were removed secondly, and the low-quality reads were removed finally (the bases with a quality value below 15 to account for more than 20% of the total bases in the read were defined as low-quality reads). The proportion of high-quality sequences after filtering all reads was >96%, Q20 (%) was >96% and Q30 (%) was >91%, indicating that the transcriptome data were of good quality and that the sequencing results were highly reliable (Table S1). After preliminary transcriptome analysis, a total of 38,742 genes were found.

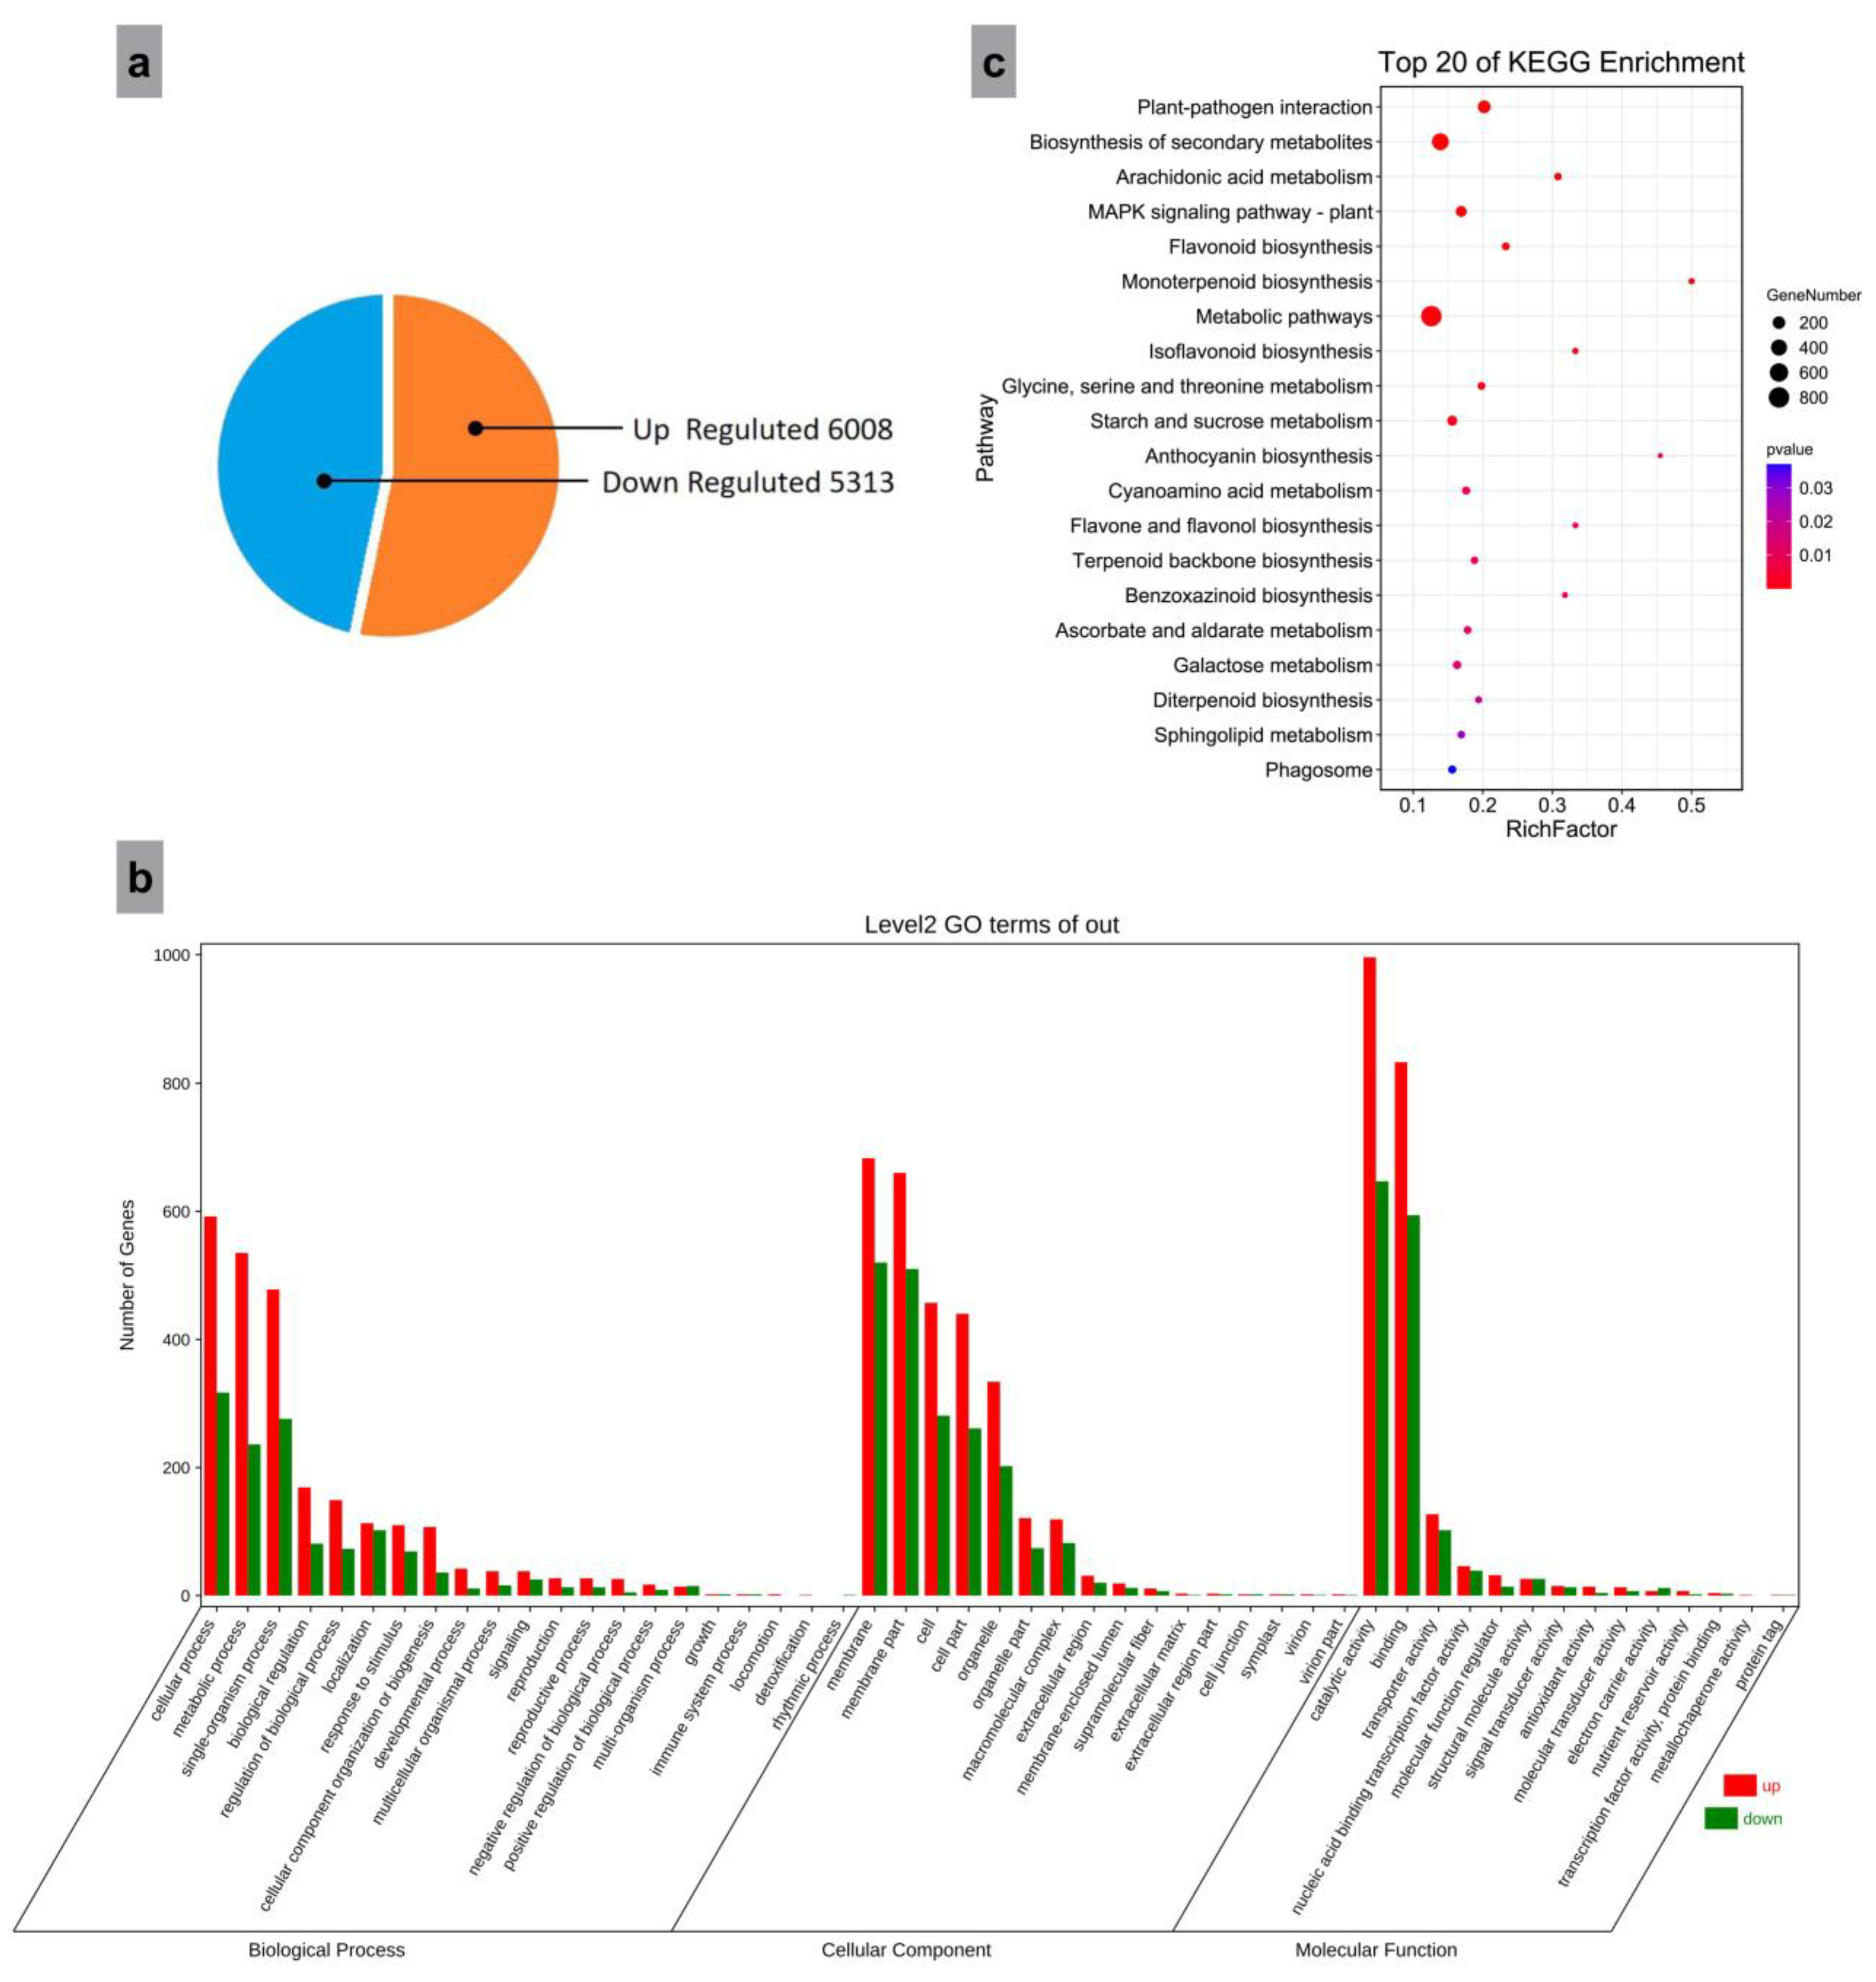
3.3. Screening for Differentially Expressed Genes (DEGs)

Gene functions were annotated by comparing genes with the plant transcription factor database PlantTFDB using hmmseach (v3.0) software, and genes with the ability to encode transcription factors (TFs) to annotate gene functions were predicted. Then, the DEGs were screened using the DEseq2 method [23,24]. There were 11, 321 DEGs in the leaf transcriptome of 1601 and M8. Among them, 6, 008 genes were upregulated in the leaves of 1601, and 5, 313 genes were downregulated in 1601 (Figure 6a).

3.4. Gene Ontology (GO) Enrichment Analysis of DEGs

Gene ontology (GO) is divided into three functional categories: molecular function, cellular component and biological process. In order to predict and analyze the function of DEGs, we performed GO enrichment analysis on them. The top three GO terms were classified into three GO main categories: “cellular process (GO:0009987)”, “metabolic process (GO:0008152)” and “single-organism process (GO:0044699)” for the biological process category; “membrane (GO:0016020)”, “membrane part (GO:0044425)” and “cell (GO:0005623)” for the cellular component category; and “catalytic activity (GO:0003824)”, “binding (GO:0005488)” and “transporter activity (GO:0005215)” for the molecular function category (Figure 6b).

3.5. KEGG Pathway Enrichment Analysis of DEGs

KEGG pathway analysis helps to understand the biological functions of genes and to determine the involvement of DEGs in key signal transduction and biochemical metabolic pathways. The KEGG database was used to annotate the pathways of DEGs in 1601 and M8. A total of 3, 909 DEGs were enriched to the KEGG database into 134 pathways. More than 20 pathways were significantly enriched (p < 0.05), and 15 pathways were extremely significantly enriched (p < 0.01), including flavonoid biosynthesis, isoflavonoid biosynthesis, starch and sucrose metabolism, anthocyanin biosynthesis, and flavone and flavonol biosynthesis (Figure 6c).

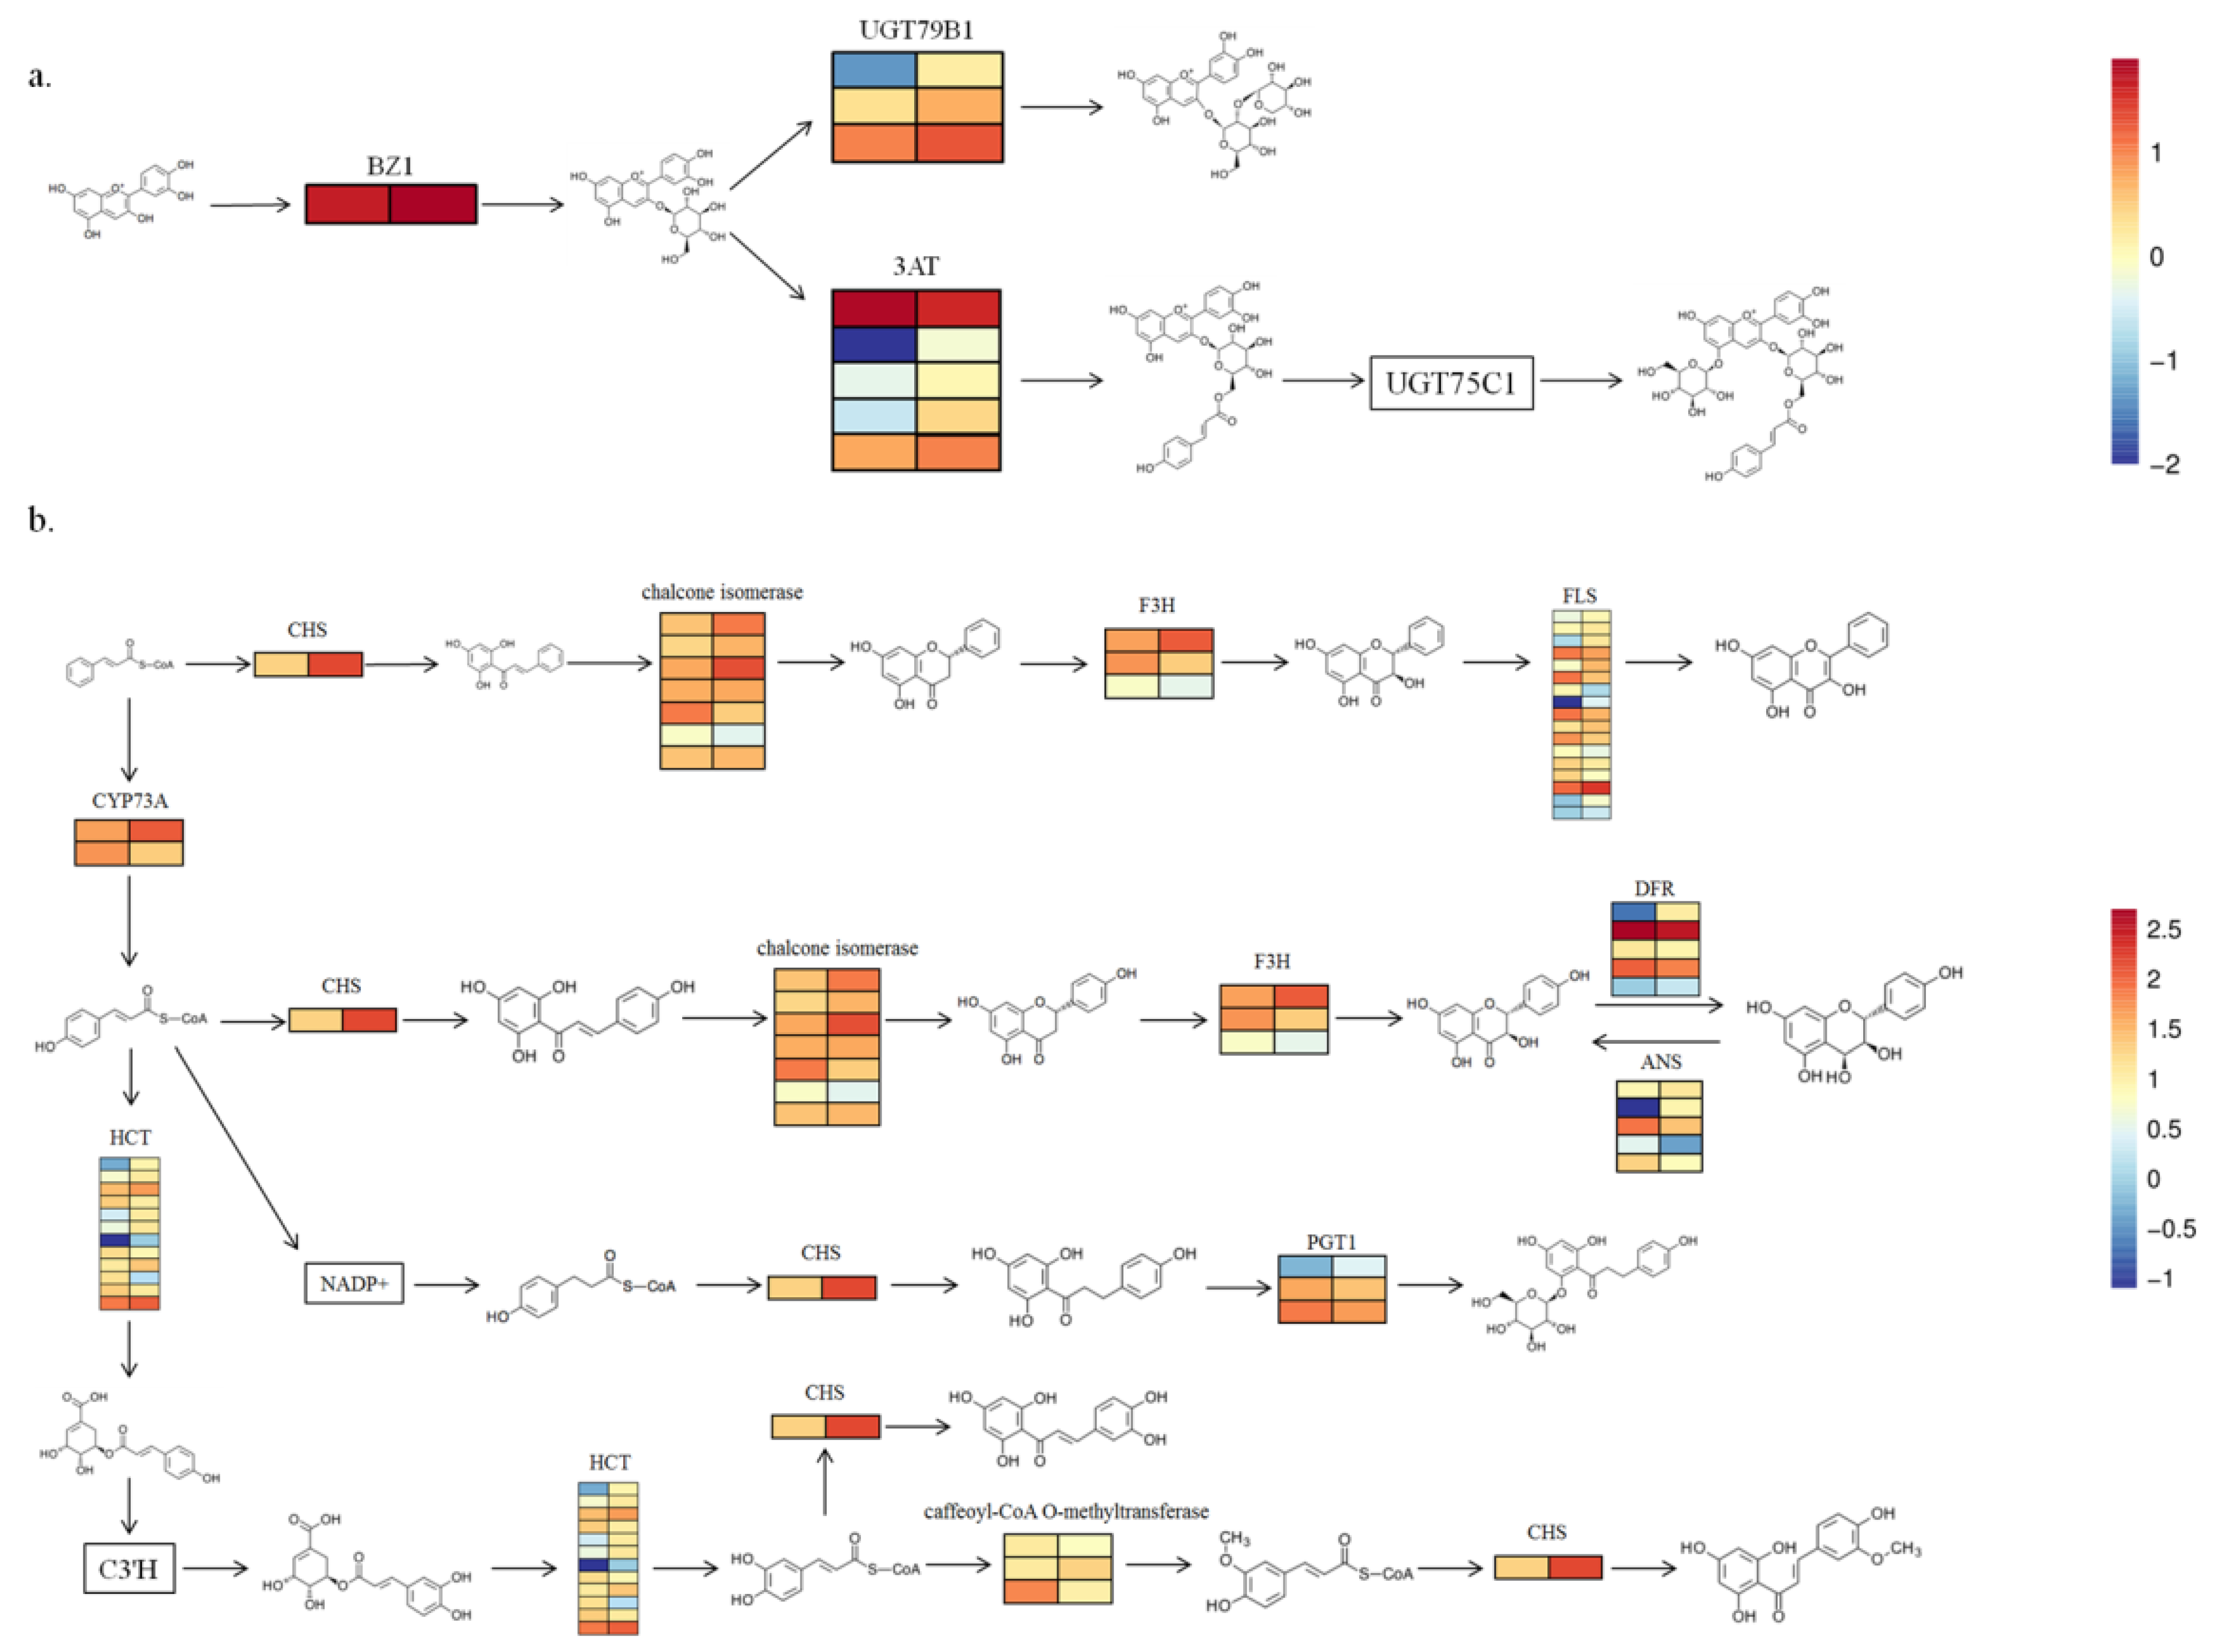
3.6. Biosynthesis Genes of Anthocyanins and Flavonoids Are Involved in the Development of Plant Leaves

In the KEGG analysis, it was found that 1601 and M8 have more DEGs in the process of flavonoid biosynthesis. A total of 67 DEGs in our datasets were associated with the anthocyanin biosynthesis and flavonoid biosynthesis pathway (Figure 7). Among them, one BZ1, three UGT79B1, four 3AT, one CHS, four chalcone isomerase, one F3H, ten FLS, two CYO73A, nine HCT, one DFR, two ANS, one PGT1 and one caffeoyl-CoA O-methyltransferase genes were highly expressed in 1601 leaves, and other DEGs were highly expressed in M8 leaves. Among them, one CHS and two CYP73A, which are key genes in the flavonoid biosynthesis pathway, were highly expressed in 1601 leaves. The expression of CHS was 7.41 times that of M8, and the expressions of the two CYP73A were 2.45 times and 2.64 times, respectively. These genes affect the leaf development of M8 and 1601 by regulating the biosynthesis of anthocyanins and flavonoids, resulting in great differences between them in leaf traits.

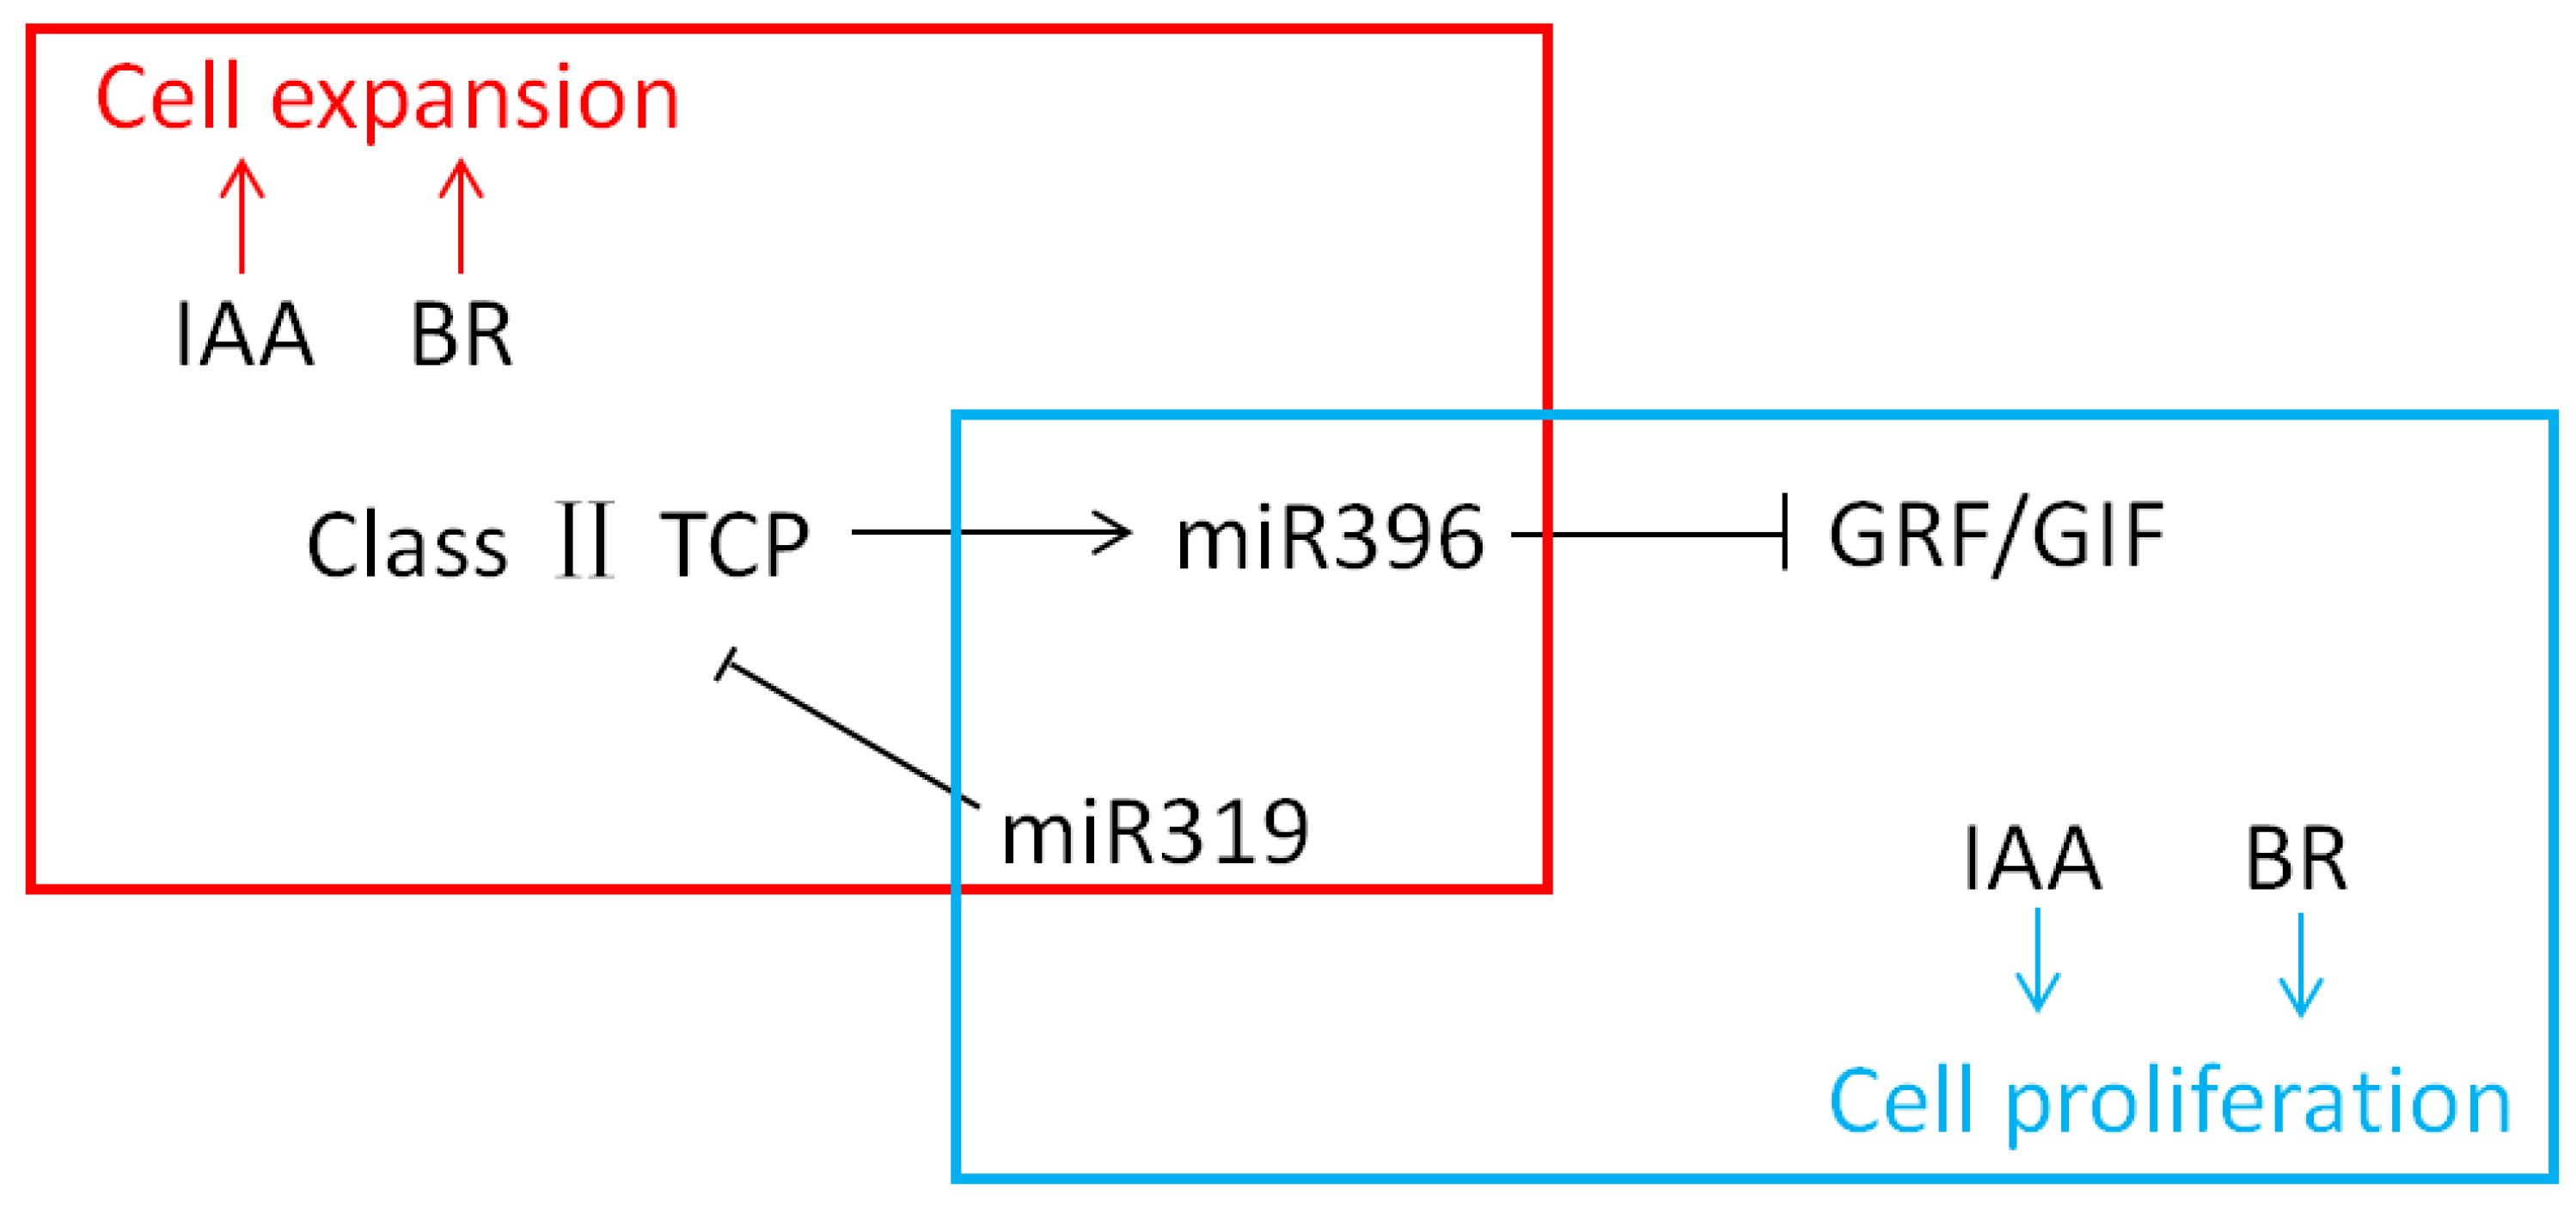
3.7. Auxin and Brassinolides (BRs) Are Involved in the Regulation of Plant-Leaf Development

Plant hormones play an important regulatory role in plant development. A total of 82 DEGs in our datasets were found to be associated with the auxin and BR (brassinolides) pathways (Figure 8). Two AUX1, five TIR1, eight AUX/IAA, eight AUXIN RESPONSE FACTORs (ARFs) and twenty Small Auxin Up RNA (SAUR) genes were found to have differences in the auxin signal transduction pathway (Figure 8a). As the key genes, the AUX/IAA genes can regulate the synthesis of auxin. Among the eight AUX/IAA genes, six genes were highly expressed in 1601, which were 3.74, 1.51, 1.39, 1.47, 86.76 and 1.41 times their expression in M8, respectively; two genes showed low expression in 1601. Its expression were 34.87% and 52.60% of those in M8. Meanwhile, there were twenty-one BRI1, one BKI1, three BSK, five BIN2, two TCH4 and one CYCD3 with differences in the expression of the BR signal transduction pathway (Figure 8b). Five BZR1/2 genes could play a role in the BR synthesis pathway, and they were differentially expressed between 1601 and M8. Among these genes, FmBZR1 was highly expressed in 1601, and the expression level was 1.64 times that in M8; the remaining four genes showed low expression in 1601, and the expression levels were 62.68%, 76.19%, 51.65% and 32.37% those in M8. These DEGs cause the phenotype difference between M8 and 1601 leaves by regulating the contents of auxin and BRs.

3.8. Differences in Transcription Factors Associated with Leaf Development between 1601 and M8

In the analysis of DEGs, we found that some transcription factors, such as GRFs (GROWTH-REGULATING FACTOR), TCPs (TEOSINTE BRANCHED1/CYCLOIDEA/PROLIFERATION CELL FACTOR), have large differences in the expression levels between M8 and 1601. There were four GRFs and 10 TCP transcription factors differentially expressed in M8 and 1601, and the expression data were shown in a heat map according to their expression amounts (Figure 9).
Among the four GRF transcription factors, two genes (FmGRF1, FmGRF4) were strongly transcribed in 1601, the expression level is 2.71 times and 1.83 times those of M8; two genes (FmGRF3, FmGRF7) were weakly transcribed in 1601, the expression level is 28.00% and 87.87% those of M8. Among the 10 TCP transcription factors, the transcription levels of five genes (FmTCP7, FmTCP10, FmTCP14, FmTCP24 and FmTCP27) were significantly higher than those of M8 in 1601, and the expression levels were 1.29, 2.29, 1.82, 1.37 and 1.63 times those in M8; the transcription levels of 5 genes (FmTCP2, FmTCP5, FmTCP6, FmTCP8 and FmTCP13) were significantly lower than those of M8 in 1601, and the expression levels were 73.10%, 55.21%, 54.20%, 50.97% and 41.02% of those in M8.

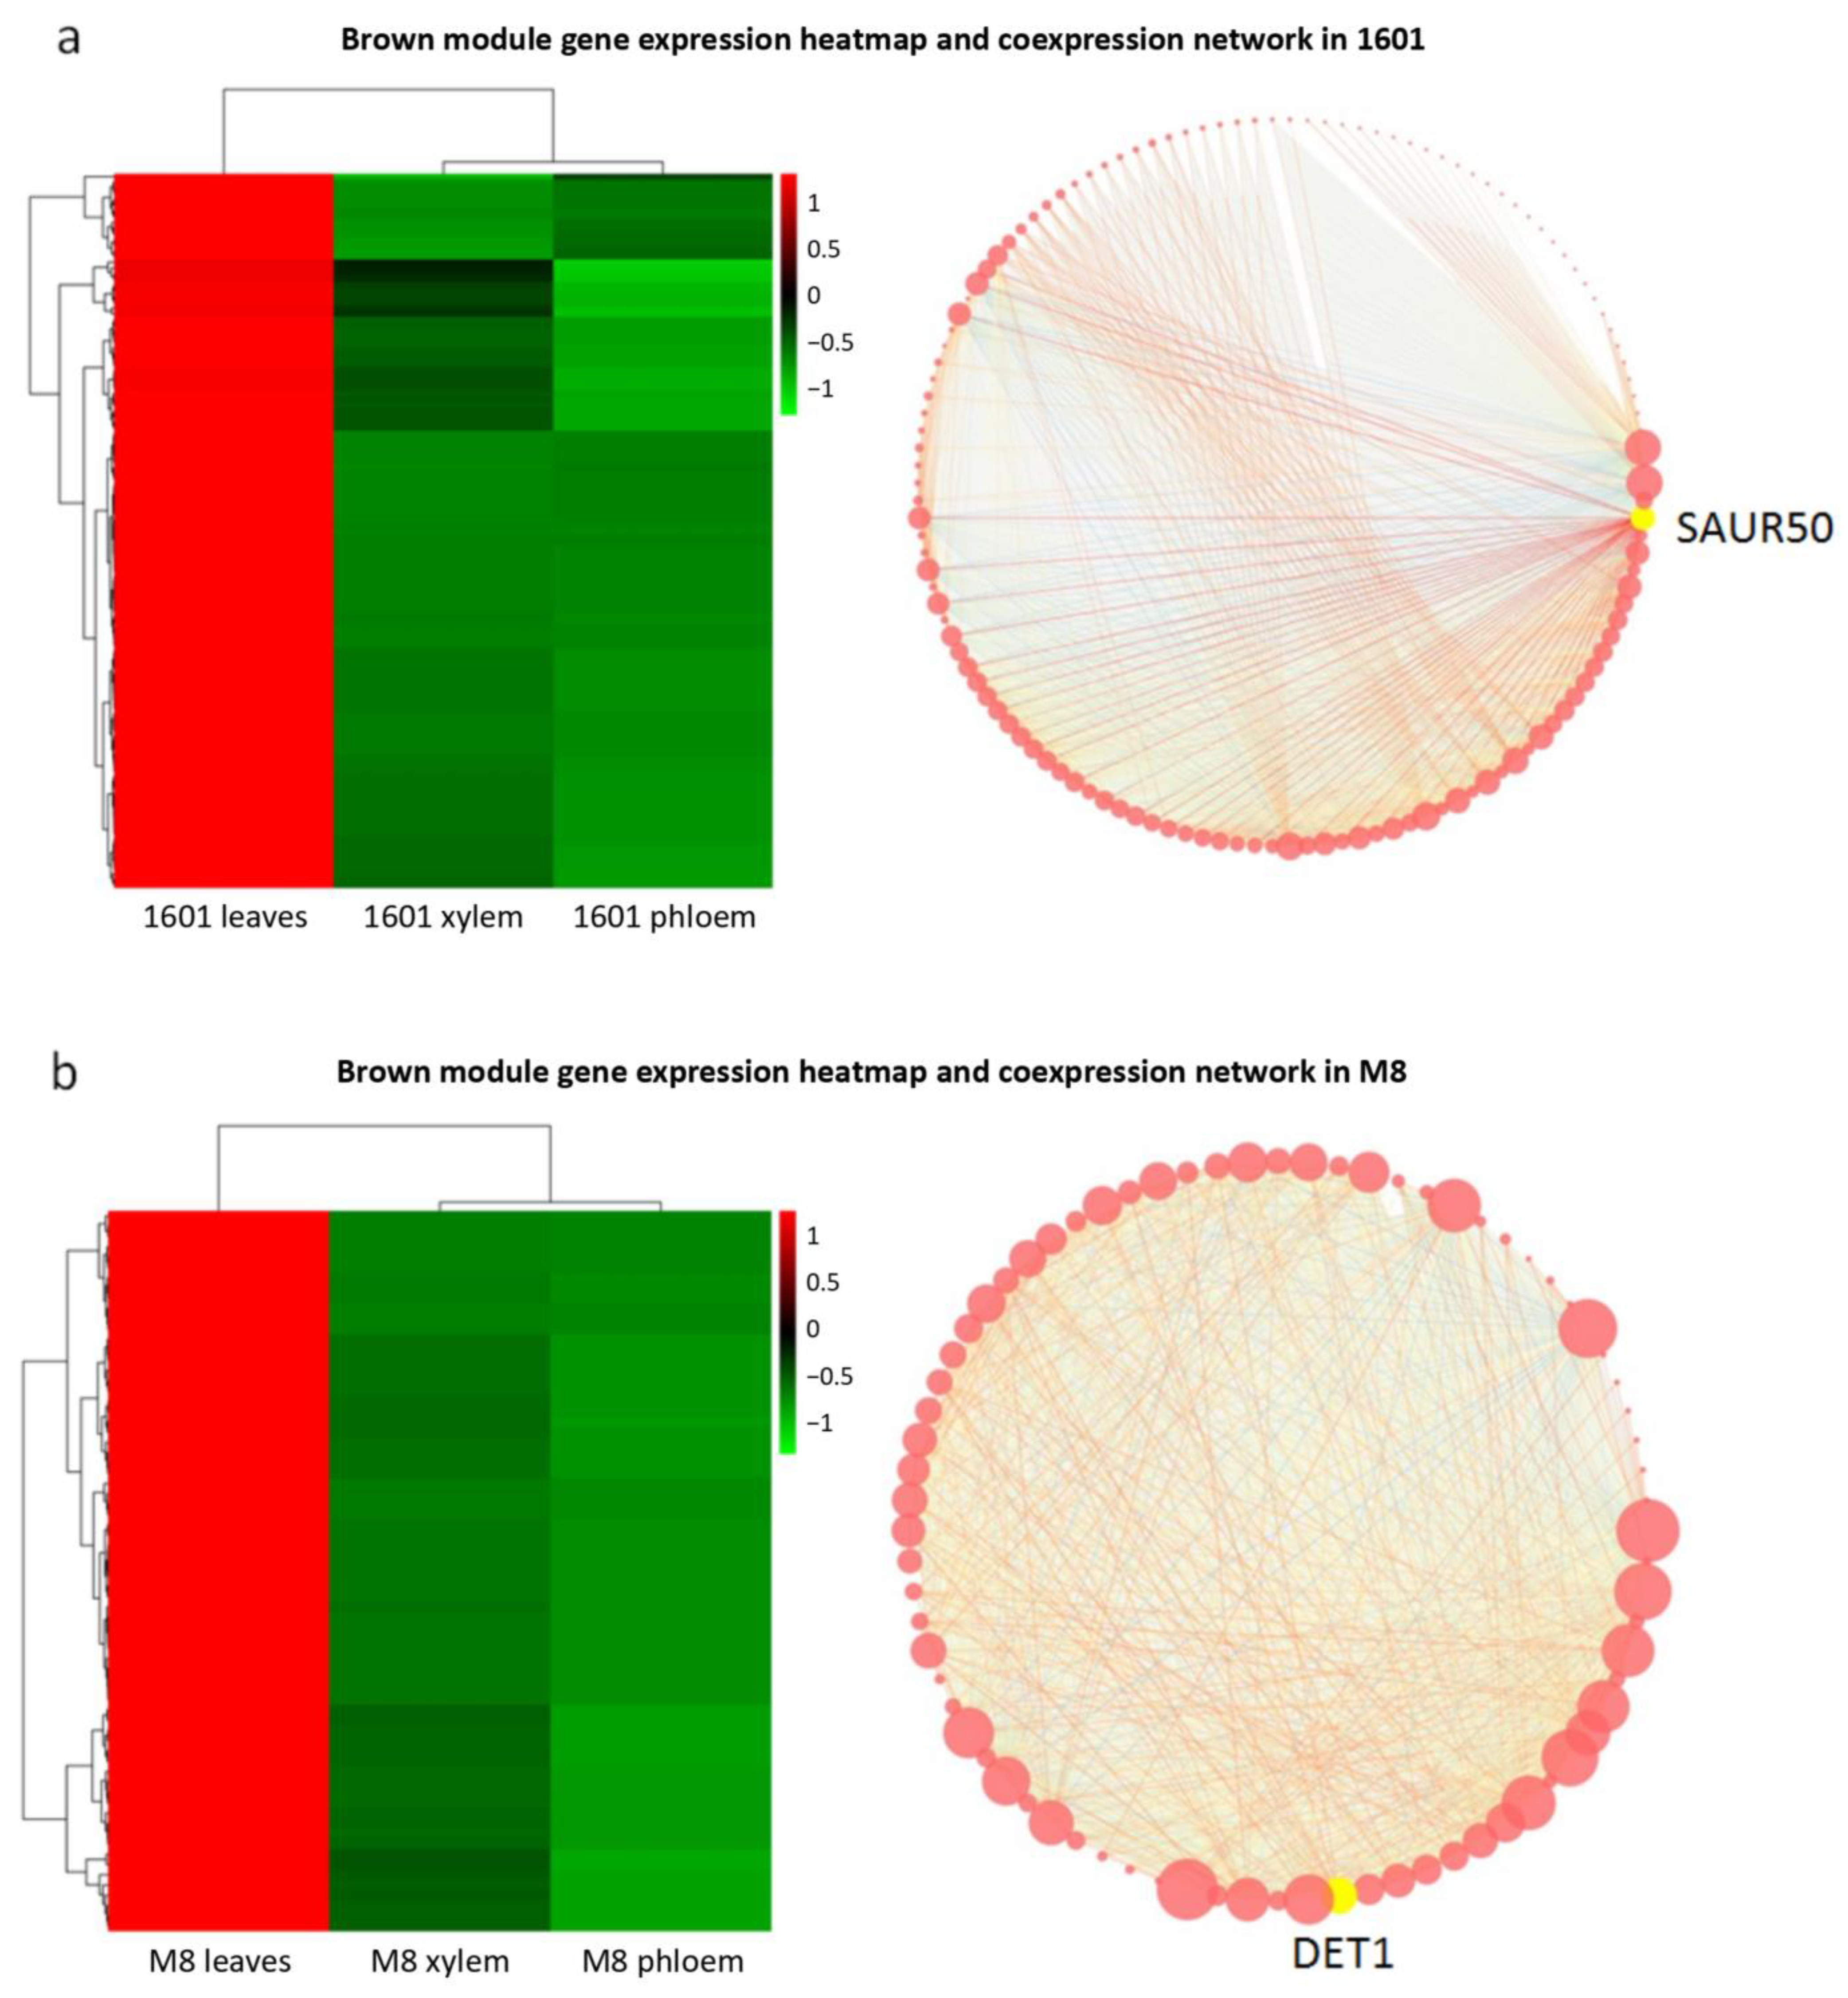
3.9. Association Analysis between Modules and Different Parts in Gene Co-Expression Network

Association analysis was performed with the module after converting the different parts of 1601 and M8 as qualitative traits into continuous traits and plotting the correlation heat map. Phloem was indicated by P, leaves by L and xylem by X (Figure 10). Genes were selected for their specific expression in leaves by contrasting their expression in leaves with that in xylem and phloem. Given the high leaf-specific expression in the brown module between 1601 and M8, the brown module was selected as the target module for subsequent analysis in this study.

3.10. Mining of Core Genes and Construction of Interaction Networks

The gene expression heat map of module Brown was drawn, and the key nodes with weight values in the top 1000 were picked for coexpression network construction and core gene mining. The network was analyzed and gene function queried after data were imported into Cytoscape, with genes associated with leaf development indicated (Figure 11). We found SAUR50 and DET1 separately in the gene coexpression network, in which SAUR50 is closely related to auxin synthesis and a high expression of DET1 leads to increased BR content. We speculate that they may play an important role in leaf development.

3.11. Quantitative Real-Time PCR (qRT-PCR) Validation of DEGs

To verify the accuracy of transcriptome sequencing results, 13 DEGs that are highly correlated with leaf development were further analyzed via RT-qPCR using cDNA obtained from the reverse transcription of RNA for sequencing as a template. To confirm that a single fragment of expected length was amplified and that there was no non-specific annealing, PCR verification was performed on each primer pair (Figure 12). Results showed that the Fm5MAT, Fm3GGT, FmGRF4, FmLHCB6-1, FmLHCA2, FmLHCB1, FmLHCB4, FmUGT79B1-1, FmUGT79B1-2 and FmLHCB6-2 genes were highly expressed in 1601; and that FmGRF7, FmC12RT1 and FmCYP75B1 genes were low expressed in 1601. These results were consistent with transcriptome sequencing results, indicating that the transcriptome sequencing results are highly reliable (Figure 12 and Figure 13).

4. Discussion

Because F. sogdiana and other male ash plants cannot live through the winter in the cold high-latitude regions, in this study, the leaf phenotype of 1601 and its male plants were not compared and analyzed. In nature, hybridization is a frequent phenomenon. However, sometimes the offspring of a hybrid may not have a good phenotype. For example, the hybrid seed generations of F. anjustifolia and F. excelsior, which were introduced into local plantations in Ireland in 1900, showed poor drought resistance [25]. Therefore, for successful cross breeding, good parents should be selected according to different breeding goals. It is well known that the morphological structure of leaves has a great influence on the drought tolerance of plants [26,27,28]. In this study, the leaf area of 1601 is smaller than that of M8, and it shows better drought tolerance in terms of leaf water loss rate in vitro, indicating that 1601 has better drought tolerance than M8. This result is also supported by previous research results, that is, smaller leaves will make plants more drought resistant [29,30].
Two major cellular processes, cell proliferation and cell expansion, control the final size of the leaf lamina [31]. Our results show that the leaf phenotypes of M8 and 1601 are very different, but the difference in the size of mesophyll cells between the two is not obvious. We believe that the main reason for the difference in leaf development between the two is the large difference in the proliferation of mesophyll cells between the two. That is, the faster the mesophyll cells proliferate, the larger the leaf area.
Flavonoids are a type of phytoalexin that play an important role in plant photosynthesis. UV radiation from sunlight can induce the increase in plant flavonoids [32], meanwhile flavonoids can provide a barrier for plants to shield UV radiation and reduce the damage of plants from UV radiation [33]. In our enrichment analysis of the GO pathway, we found that most of the DEGs were enriched in the biosynthetic pathways of flavonoids and anthocyanins. The difference in the content of flavonoids in the two leaves may be one of the main reasons for the difference in the photosynthetic rate between 1601 and M8 leaves.
Auxins are plant hormones of vital importance during plant development. In the DEG analysis, we found 56 DEGs related to the auxin synthesis pathway in 1601 and M8. The ARF transcription factor family is a key response factor in response to auxin signaling, of which ARF2 is a member of the transcription factor family that mediates auxin response to gene expression and is a growth suppressor that affects cell division and cell expansion [34,35,36]. SAUR gene family members are numerous, functionally redundant, widely distributed in higher and lower plants and have been frequently used as a labeled gene for auxin induction in research. The SAUR gene is responsive not only to auxin but also to stimuli such as light, brassinosteroids (BRs), ethylene, gibberellins, abscisic acid and high temperature [37]. Where SAUR17 and SAUR50 exert opposite effects during apical development and cotyledon opening in Arabidopsis through antagonistic conditions on protein phosphatase 2C d-clade 1 (PP2C-D1) [38]. These results all illustrate that the SAUR gene plays an important role in the process of plant growth and development. As is known from the core gene interaction network, SAUR50 was found to be important in leaves of 1601 and might be one of the reasons for its smaller size.
Brassinosteroids (BRs) are a class of steroid hormones essential for plant development, cell elongation and proliferation, and leaf bending [39,40]. In the analysis of different genes in BR signal transduction pathway, we found that there was a great difference in BRI1 gene expression between 1601 and M8. As the key member in the BR signal transduction pathway, BRI1 plays an important role in plant-leaf development. BRI1, together with BSU1 and BIN2, mediates the stomatal development of plant leaves in Arabidopsis and then affects the leaf characters [41]. The difference in BRI1 gene expression may be one of the reasons for the significant difference in the leaf traits of the two varieties. At the same time, de-etiolated 1 (DET1) is an important gene in the BR synthesis pathway. Its high expression in M8 may increase the content of BRs, resulting in the active proliferation of mesophyll cells and larger leaf area.
The final size of the leaf is controlled by two main cellular processes, cell proliferation and cell expansion [31]. In the process of leaf development, two major transcription factor families, TCPs and GRFs, are essential. The gene expressions of classIITCP transcription factors are post-transcriptionally inhibited by miR319, which restricts TCPs to the distal end of the leaf [42,43]. ClassIITCPs can activate NGA, inhibit cell proliferation and promote cell differentiation [44]. At the same time, TCPs activate miR396 to inhibit GRFs, and these interactions further accelerate leaf maturation and inhibit cell proliferation [45]. GRFs have the opposite function to TCP transcription factors. They interact with GIF1 (GRF-INTERACTING FACTOR1), GIF2 and GIF3 to promote cell proliferation by regulating the level of cyclin and delay the transition from proliferation to differentiation in the process of leaf growth [41,46,47].
TCP transcription factor family is a plant-specific gene family. They all contain a conservative atypical bHLH structure (TCP domain) consisting of 59 amino acid residues. TCPs are divided into two main branches: Type I (TCP-P/PCF) and Type II (TCP-C) [48,49,50]. Long-term studies have shown that in the process of leaf development, TCP transcription factors type II play the most prominent role, and type I members are more functionally redundant in its regulation [51,52,53,54,55]. The role of Type I TCP in leaf development is still unclear. In Arabidopsis, TfTCP8 and TfTCP13 mutants of Arabidopsis, homologs of AtTCP5, had larger leaves compared with the wild type, and ectopic expression of TfTCP8 and TfTCP13 resulted in narrow leaves in Arabidopsis [56]. FmTCP8 and FmTCP13 showed significantly higher expression in 1601 leaves compared to M8, which may be one of the reasons why 1601 leaves were significantly smaller than M8 leaves. In the past ten years of research, the role of GRF transcription factor and its co-regulator GIF in regulating cell proliferation and leaf size is well known [47,57,58,59,60,61]. In rice, the leaf size and rice yield of transgenic plants overexpressing GRF have increased compared to the wild type [62,63,64,65]. On the other hand, in Arabidopsis and maize, the leaves of plants with reduced GRF expression due to premature induction of miR396 were smaller [66,67]. Further studies showed that the leaves of GRF1/2/3 triple mutants are much smaller than those of the wild type, whereas those of Arabidopsis overexpressing AtGRF1, AtGRF2, AtGRF3 or AtGRF5 are larger [47,68]. The overexpression of ZmGRF10 resulted in reduced leaf size and plant height [69]. Our results show that the FmGRF3 gene is relatively highly expressed in M8, which may be one of the reasons for the larger leaves of M8 plants.
More and more studies have shown that GRF gene transcription factor is a kind of gibberellin-induced factors, which can participate in the regulation of plant cell proliferation and has the effect of promoting plant growth; it usually regulates a variety of plants by promoting cell proliferation. It plays an important role in organ growth and is associated with GIF and SWI/SNF genes [70]. However, plant growth and development are finely regulated processes that depend on a balance of negative and positive conditions. Among the key genes in the gibberellin (GA) signal transduction pathway, the DELLA protein acts as a negative regulator and is expressed at a higher level in the presence of lower levels of GA. It can inhibit GRF gene expression by transactivation and sequestration. Through transactivation, the DELLA protein can stimulate the expression of miR396, thereby reducing the amount of GRF gene expression, and for the pre-existing GRF protein, it can organize the interaction of GRF protein and GIF in a competitive manner. In the future, more research may be needed to further elucidate the details of the GRF gene regulation mechanism, including how DELLA competes with GRF protein to inhibit its expression, and to clarify its specific mechanism of action.
The transition from cell proliferation to differentiation follows a basal gradient during leaf development. TCP transcription factors are negatively regulated by miR319 and promote cell expansion. Meanwhile, GRF/GIF transcription factors also promote cell proliferation and are negatively regulated by miR-396. TCP activates the expression of miR396, thus forming a feedback loop to regulate the transition at the leading edge of cell cycle arrest. On the other hand, IAA together with BRs also play important regulatory roles in two cellular processes in leaves, which together affect the final leaf size (Figure 14).
In this study, the comparison of leaf trait differences and a transcriptome difference analysis of F. mandshurica and its interspecific hybrid progeny were performed. From these results of leaf trait and transcriptome analysis, it has been demonstrated that transcription factor families, such as TCP and GRF, and hormones, such as IAA and BRs, regulate the development of plant leaves. In recent years, with the increasing demand for wood germplasm resources, the selection and breeding of excellent new tree varieties is very important. Our results provide more data for the breeding of new superior transgenic varieties of F. mandshurica.

5. Conclusions

The significant differences in leaf morphology of the interspecific F1 hybrid progeny 1601 of F. mandshurica × F. sogdiana and its female parent, M8, were compared and confirmed, and the molecular mechanism that determines the difference in leaf phenotype were further explored by the RNA-seq comparison and WGCNA of 1601 and M8. Transcriptome analysis showed that 1601 and M8 had significant differences in plant hormone signal transduction pathways and also had significant differences in the expression of TFs, such as GRFs and TCPs. These results indicated that auxin, BRs, GRFs and TCPs could regulate the leaf development of F. mandshurica, which initially revealed the molecular mechanism of leaf development of F. mandshurica.

Supplementary Materials

The following supporting information can be downloaded at: https://www.mdpi.com/article/10.3390/f14081554/s1. Table S1: Analysis of transcriptome data quality of 1601 and M8.

Author Contributions

Conceptualization, F.Z. and Y.Z.; methodology, F.Z., L.H. and J.Y.; validation, L.H. and J.Y.; investigation, L.H., J.Y., H.L., W.S., S.G. and Y.W.; resources, F.Z. and Y.Z.; data curation, L.H. and J.Y.; writing—original draft preparation, L.H. and J.Y.; writing—review and editing, L.H., J.Y. and F.Z.; visualization, Y.Z.; supervision, F.Z.; project administration, F.Z.; funding acquisition, F.Z. and Y.Z. All authors have read and agreed to the published version of the manuscript.

Funding

This research was funded by the National Key R&D Program of China (2021YFD2200303), the Fundamental Research Funds for the Central Universities (2572021DT06), the Innovation Project of State Key Laboratory of Tree Genetics and Breeding (Northeast Forestry University, 2022A03) and the Heilongjiang Touyan Innovation Team Program (Tree Genetics and Breeding Innovation Team).

Data Availability Statement

Not applicable.

Acknowledgments

The authors thank the Maoershan Experimental Forest Farm for their support and the materials required for this study.

Conflicts of Interest

The authors declare no competing interests.

References

  1. Nicotra, A.B.; Leigh, A.; Boyce, C.K.; Jones, C.S.; Niklas, K.J.; Royer, D.L.; Tsukaya, H. The evolution and functional significance of leaf shape in the angiosperms. Funct. Plant Biol. 2011, 38, 535–552. [Google Scholar] [CrossRef] [PubMed]
  2. Tsukaya, H. Leaf shape: Genetic controls and environmental factors. Int. J. Dev. Biol. 2005, 49, 547–555. [Google Scholar] [CrossRef] [Green Version]
  3. Kalve, S.; De Vos, D.; Beemster, G.T. Leaf development: A cellular perspective. Front. Plant Sci. 2014, 5, 362. [Google Scholar] [CrossRef] [PubMed] [Green Version]
  4. Sarvepalli, K.; Das Gupta, M.; Challa, K.R.; Nath, U. Molecular cartography of leaf development—Role of transcription factors. Curr. Opin. Plant Biol. 2019, 47, 22–31. [Google Scholar] [CrossRef] [PubMed] [Green Version]
  5. Koyama, T.; Mitsuda, N.; Seki, M.; Shinozaki, K.; Ohme-Takagi, M. TCP transcription factors regulate the activities of ASYMMETRIC LEAVES1 and miR164, as well as the auxin response, during differentiation of leaves in Arabidopsis. Plant Cell 2010, 22, 3574–3588. [Google Scholar] [CrossRef] [PubMed] [Green Version]
  6. Champagne, C.; Sinha, N. Compound leaves: Equal to the sum of their parts? Development 2004, 131, 4401–4412. [Google Scholar] [CrossRef] [PubMed] [Green Version]
  7. Warman, L.; Moles, A.T.; Edwards, W. Not so simple after all: Searching for ecological advantages of compound leaves. Oikos 2011, 120, 813–821. [Google Scholar] [CrossRef]
  8. Rubén, M. Compound leaves and the evolution of leaf size and display. Ideas Ecol. Evol. 2012, 5, 6–8. [Google Scholar] [CrossRef]
  9. Chen, R. Functional Genomics and Genetic Control of Compound Leaf Development in Medicago truncatula: An Overview. Methods Mol. Biol. 2018, 1822, 197–203. [Google Scholar] [CrossRef]
  10. Macfarlane, D.W.; Meyer, S.P. Characteristics and distribution of potential ash tree hosts for emerald ash borer—ScienceDirect. For. Ecol. Manag. 2005, 213, 15–24. [Google Scholar] [CrossRef]
  11. Li, B.; Howe, G.T.; Wu, R. Developmental factors responsible for heterosis in aspen hybrids (Populus tremuloides × P. tremula). Tree Physiol. 1998, 18, 29–36. [Google Scholar] [CrossRef] [PubMed] [Green Version]
  12. Eric, J.R.; Daniel, A.H.; David, R.S. Interspecific Variation in Resistance to Emerald Ash Borer (Coleoptera: Buprestidae) Among North American and Asian Ash (Fraxinus spp.). Environ. Entomol. 2008, 37, 242–246. [Google Scholar] [CrossRef] [Green Version]
  13. Shepherd, M.; Kasem, S.; Lee, D.J.; Henry, R. Mapping species differences for adventitious rooting in a Corymbia torelliana × Corymbia citriodora subspecies variegata hybrid. Tree Genet. Genomes 2008, 4, 715–725. [Google Scholar] [CrossRef]
  14. Cheng, X.; Chen, S.; Chen, F.; Fang, W.; Deng, Y.; She, L. Interspecific hybrids between Dendranthema morifolium (Ramat.) Kitamura and D. nankingense (Nakai) Tzvel. achieved using ovary rescue and their cold tolerance characteristics. Euphytica 2010, 172, 101–108. [Google Scholar] [CrossRef]
  15. Wang, J.; Huang, L.; Bao, M.; Liu, G. Production of interspecific hybrids between Lilium longiflorum and L. lophophorum var. linearifolium via Ovule Culture at Early Stage. Euphytica 2009, 167, 45–55. [Google Scholar] [CrossRef]
  16. He, L.; Xu, Y.; Zeng, F.; Tian, H.; Xiao, Y.; Liu, H.; Yu, L.; Zhan, Y. Establishment of a micropropagation supporting technology for the Fraxinus mandshurica × Fraxinus sogdiana. Vitr. Cell. Dev. Biol.-Plant 2021, 57, 307–318. [Google Scholar] [CrossRef]
  17. He, Z.; Zhan, Y.; Zeng, F.; Zhao, X.T.; Wang, X. Drought physiology and gene expression characteristics of Fraxinus interspecific hybrids. Plant Growth Regul. 2016, 78, 179–193. [Google Scholar] [CrossRef]
  18. Kim, D.; Langmead, B.; Salzberg, S.L. HISAT: A fast spliced aligner with low memory requirements. Nat. Methods 2015, 12, 357–360. [Google Scholar] [CrossRef] [PubMed] [Green Version]
  19. Pertea, M.; Pertea, G.M.; Antonescu, C.M.; Chang, T.C.; Mendell, J.T.; Salzberg, S.L. StringTie enables improved reconstruction of a transcriptome from RNA-seq reads. Nat. Biotechnol. 2015, 33, 290–295. [Google Scholar] [CrossRef] [Green Version]
  20. Klopfenstein, D.V.; Zhang, L.; Pedersen, B.S.; Ramírez, F.; Vesztrocy, A.W.; Naldi, A.; Mungall, C.J.; Yunes, J.M.; Botvinnik, O.; Weigel, M.; et al. GOATOOLS: A Python library for Gene Ontology analyses. Sci. Rep. 2018, 8, 10872. [Google Scholar] [CrossRef] [PubMed] [Green Version]
  21. Langfelder, P.; Horvath, S. WGCNA: An R package for weighted correlation network analysis. BMC Bioinform. 2008, 9, 559. [Google Scholar] [CrossRef] [PubMed] [Green Version]
  22. Livak, K.J.; Schmittgen, T.D. Analysis of relative gene expression data using real-time quantitative PCR and the 2−ΔΔCT Method. Methods 2001, 25, 402–408. [Google Scholar] [CrossRef] [PubMed]
  23. Love, M.I.; Huber, W.; Anders, S. Moderated estimation of fold change and dispersion for RNA-seq data with DESeq2. Genome Biol. 2014, 15, 550. [Google Scholar] [CrossRef] [PubMed] [Green Version]
  24. Anders, S.; Huber, W. Differential expression analysis for sequence count data. Genome Biol. 2010, 11, R106. [Google Scholar] [CrossRef] [Green Version]
  25. Thomasset, M.; Fernandez-Manjarres, J.F.; Douglas, G.C.; Frascaria-Lacoste, N.; Raquin, C.; Hodkinson, T.R. Molecular and morphological characterization of reciprocal F1 hybrid ash (Fraxinus excelsior × Fraxinus angustifoua, Oleaceae) and parental species reveals asymmetric character inheritance. Int. J. Plant Sci. 2011, 172, 423–433. [Google Scholar] [CrossRef]
  26. Lopez, J.L.; Abt, R.C.; Dvorak, W.S.; Hodge, G.R.; Phillips, R. Tree breeding model to assess financial performance of pine hybrids and pure species: Deterministic and stochastic approaches for South Africa. New For. 2018, 49, 123–142. [Google Scholar] [CrossRef]
  27. Zeng, F.; Zhou, S.; Zhan, Y.; Dong, J. Drought resistance and DNA methylation of interspecific hybrids between Fraxinus mandshurica and Fraxinus americana. Trees 2014, 28, 1679–1692. [Google Scholar] [CrossRef]
  28. Wu, S.; Xu, J.; Li, G.; Du, Z.; Lu, Z.; Li, B. Age trends and correlations of growth and wood properties in clone of Eucalyptus urophylla × E. grandis in Guangdong, China. J. For. Res. 2012, 23, 467–472. [Google Scholar] [CrossRef]
  29. Wang, R.; Gao, M.; Ji, S.; Wang, S.; Meng, Y.; Zhou, Z. Carbon allocation, osmotic adjustment, antioxidant capacity and growth in cotton under long-term soil drought during flowering and boll-forming period. Plant Physiol. Biochem. 2016, 107, 137–146. [Google Scholar] [CrossRef] [PubMed]
  30. Sandquist, D.R.; Ehleringer, J.R. Population- and family-level variation of brittlebush (Encelia farinosa, Asteraceae) pubescence: Its relation to drought and implications for selection in variable environments. Am. J. Bot. 2003, 90, 1481–1486. [Google Scholar] [CrossRef] [Green Version]
  31. Wang, H.; Kong, F.; Zhuo, C. From genes to networks: The genetic control of leaf development. J. Integr. Plant Biol. 2021, 63, 1181–1196. [Google Scholar] [CrossRef] [PubMed]
  32. Jaakola, L.; Hohtola, A. Effect of latitude on flavonoid biosynthesis in plants. Plant Cell Environ. 2010, 33, 1239–1247. [Google Scholar] [CrossRef] [PubMed]
  33. Tattini, M.; Landi, M.; Brunetti, C.; Giordano, C.; Remorini, D.; Gould, K.S.; Guidi, L. Epidermal coumaroyl anthocyanins protect sweet basil against excess light stress: Multiple consequences of light attenuation. Physiol. Plant. 2014, 152, 585–598. [Google Scholar] [CrossRef] [PubMed]
  34. Schruff, M.C.; Spielman, M.; Tiwari, S.; Adams, S.; Fenby, N.; Scott, R.J. The AUXIN RESPONSE FACTOR 2 gene of Arabidopsis links auxin signalling, cell division, and the size of seeds and other organs. Development 2006, 133, 251–261. [Google Scholar] [CrossRef] [PubMed] [Green Version]
  35. Fu, Y.; Win, P.; Zhang, H.; Li, C.; Shen, Y.; He, F.; Luo, K. PtrARF2.1 Is Involved in Regulation of Leaf Development and Lignin Biosynthesis in Poplar Trees. Int. J. Mol. Sci. 2019, 20, 4141. [Google Scholar] [CrossRef] [PubMed] [Green Version]
  36. Gonzalez, N.; Vanhaeren, H.; Inzé, D. Leaf size control: Complex coordination of cell division and expansion. Trends Plant Sci. 2012, 17, 332–340. [Google Scholar] [CrossRef] [PubMed]
  37. Ren, H.; Gray, W.M. SAUR Proteins as Effectors of Hormonal and Environmental Signals in Plant Growth. Mol. Plant 2015, 8, 1153–1164. [Google Scholar] [CrossRef] [PubMed] [Green Version]
  38. Wang, J.; Sun, N.; Zhang, F.; Yu, R.; Chen, H.; Deng, X.; Wei, N. SAUR17 and SAUR50 Differentially Regulate PP2C-D1 during Apical Hook Development and Cotyledon Opening in Arabidopsis. Plant Cell 2020, 32, 3792–3811. [Google Scholar] [CrossRef] [PubMed]
  39. Yang, X.H.; Xu, Z.H.; Xue, H.W. Arabidopsis membrane steroid binding protein 1 is involved in inhibition of cell elongation. Plant Cell 2005, 17, 116–131. [Google Scholar] [CrossRef] [Green Version]
  40. Bishop, G.J.; Koncz, C. Brassinosteroids and plant steroid hormone signaling. Plant Cell 2002, 14, S97–S110. [Google Scholar] [CrossRef] [Green Version]
  41. Kim, T.W.; Michniewicz, M.; Bergmann, D.C.; Wang, Z.Y. Brassinosteroid regulates stomatal development by GSK3-mediated inhibition of a MAPK pathway. Nature 2012, 482, 419–422. [Google Scholar] [CrossRef] [PubMed] [Green Version]
  42. Palatnik, J.F.; Allen, E.; Wu, X.; Schommer, C.; Schwab, R.; Carrington, J.C.; Weigel, D. Control of leaf morphogenesis by microRNAs. Nature 2003, 425, 257–263. [Google Scholar] [CrossRef] [PubMed] [Green Version]
  43. Ori, N.; Cohen, A.R.; Etzioni, A.; Brand, A.; Yanai, O.; Shleizer, S.; Menda, N.; Amsellem, Z.; Efroni, I.; Pekker, I.; et al. Regulation of LANCEOLATE by miR319 is required for compound-leaf development in tomato. Nat. Genet. 2007, 39, 787–791. [Google Scholar] [CrossRef] [PubMed]
  44. Alvarez, J.P.; Furumizu, C.; Efroni, I.; Eshed, Y.; Bowman, J.L. Active suppression of a leaf meristem orchestrates determinate leaf growth. eLife 2016, 5, e15023. [Google Scholar] [CrossRef] [PubMed]
  45. Du, F.; Guan, C.; Jiao, Y. Molecular Mechanisms of Leaf Morphogenesis. Mol. Plant 2018, 11, 1117–1134. [Google Scholar] [CrossRef] [PubMed] [Green Version]
  46. Ercoli, M.F.; Rojas, A.M.; Debernardi, J.M.; Palatnik, J.F.; Rodriguez, R.E. Control of cell proliferation and elongation by miR396. Plant Signal. Behav. 2016, 11, e1184809. [Google Scholar] [CrossRef] [PubMed] [Green Version]
  47. Kim, J.H.; Choi, D.; Kende, H. The AtGRF family of putative transcription factors is involved in leaf and cotyledon growth in Arabidopsis. Plant J. 2003, 36, 94–104. [Google Scholar] [CrossRef] [PubMed]
  48. Kosugi, S.; Ohashi, Y. DNA binding and dimerization specificity and potential targets for the TCP protein family. Plant J. 2002, 30, 337–348. [Google Scholar] [CrossRef] [PubMed] [Green Version]
  49. Navaud, O.; Dabos, P.; Carnus, E.; Tremousaygue, D.; Hervé, C. TCP transcription factors predate the emergence of land plants. J. Mol. Evol. 2007, 65, 23–33. [Google Scholar] [CrossRef] [PubMed]
  50. Martín-Trillo, M.; Cubas, P. TCP genes: A family snapshot ten years later. Trends Plant Sci. 2009, 15, 31–39. [Google Scholar] [CrossRef] [PubMed]
  51. Causier, B.; Ashworth, M.; Guo, W.; Davies, B. The TOPLESS interactome: A framework for gene repression in Arabidopsis. Plant Physiol. 2012, 158, 423–438. [Google Scholar] [CrossRef] [PubMed] [Green Version]
  52. Schommer, C.; Palatnik, J.F.; Aggarwal, P.; Chételat, A.; Cubas, P.; Farmer, E.E.; Nath, U.; Weigel, D. Control of jasmonate biosynthesis and senescence by miR319 targets. PLoS Biol. 2008, 6, e230. [Google Scholar] [CrossRef] [PubMed] [Green Version]
  53. Jeffrey, C.; Stebbins, G.L. Flowering Plants. Evolution above the Species Level. Kew Bull. 1977, 32, 273. [Google Scholar] [CrossRef]
  54. Juntheikki-Palovaara, I.; Tähtiharju, S.; Lan, T.; Broholm, S.K.; Rijpkema, A.S.; Ruonala, R.; Kale, L.; Albert, V.A.; Teeri, T.H.; Elomaa, P. Functional diversification of duplicated CYC2 clade genes in regulation of inflorescence development in Gerbera hybrida (Asteraceae). Plant J. 2014, 79, 783–796. [Google Scholar] [CrossRef] [PubMed] [Green Version]
  55. Zou, R.; Peng, Y.; Zhao, Y.; Wang, X. Genome-Wide Identification and Expression Analysis of the TCP Genes in Jatropha curcas L. Reveals Its Roles in Involvement of Leaf Shape. Forests 2023, 14, 780. [Google Scholar] [CrossRef]
  56. Zhang, L.; Zhou, L.; Yung, W.S.; Su, W.; Huang, M. Ectopic expression of Torenia fournieri TCP8 and TCP13 alters the leaf and petal phenotypes in Arabidopsis thaliana. Physiol. Plant. 2021, 173, 856–866. [Google Scholar] [CrossRef] [PubMed]
  57. Kim, J.H.; Kende, H. A transcriptional coactivator, AtGIF1, is involved in regulating leaf growth and morphology in Arabidopsis. Proc. Natl. Acad. Sci. USA 2004, 101, 13374–13379. [Google Scholar] [CrossRef] [PubMed]
  58. Kozuka, T.; Horiguchi, G.; Kim, G.T.; Ohgishi, M.; Sakai, T.; Tsukaya, H. The different growth responses of the Arabidopsis thaliana leaf blade and the petiole during shade avoidance are regulated by photoreceptors and sugar. Plant Cell Physiol. 2005, 46, 213–223. [Google Scholar] [CrossRef] [Green Version]
  59. Lee, B.H.; Ko, J.H.; Lee, S.; Lee, Y.; Pak, J.H.; Kim, J.H. The Arabidopsis GRF-INTERACTING FACTOR gene family performs an overlapping function in determining organ size as well as multiple developmental properties. Plant Physiol. 2009, 151, 655–668. [Google Scholar] [CrossRef] [Green Version]
  60. Mecchia, M.A.; Debernardi, J.M.; Rodriguez, R.E.; Schommer, C.; Palatnik, J.F. MicroRNA miR396 and RDR6 synergistically regulate leaf development. Mech. Dev. 2013, 130, 2–13. [Google Scholar] [CrossRef]
  61. Gonzalez, N.; De Bodt, S.; Sulpice, R.; Jikumaru, Y.; Chae, E.; Dhondt, S.; Van Daele, T.; De Milde, L.; Weigel, D.; Kamiya, Y.; et al. Increased leaf size: Different means to an end. Plant Physiol. 2010, 153, 1261–1279. [Google Scholar] [CrossRef] [PubMed] [Green Version]
  62. Che, R.; Tong, H.; Shi, B.; Liu, Y.; Fang, S.; Liu, D.; Xiao, Y.; Hu, B.; Liu, L.; Wang, H.; et al. Control of grain size and rice yield by GL2-mediated brassinosteroid responses. Nat. Plants 2015, 2, 15195. [Google Scholar] [CrossRef] [PubMed]
  63. Hu, J.; Wang, Y.; Fang, Y.; Zeng, L.; Xu, J.; Yu, H.; Shi, Z.; Pan, J.; Zhang, D.; Kang, S.; et al. A Rare Allele of GS2 Enhances Grain Size and Grain Yield in Rice. Mol. Plant 2015, 8, 1455–1465. [Google Scholar] [CrossRef] [PubMed] [Green Version]
  64. Duan, P.; Ni, S.; Wang, J.; Zhang, B.; Xu, R.; Wang, Y.; Chen, H.; Zhu, X.; Li, Y. Regulation of OsGRF4 by OsmiR396 controls grain size and yield in rice. Nat. Plants 2015, 2, 15203. [Google Scholar] [CrossRef] [PubMed]
  65. Li, S.; Gao, F.; Xie, K.; Zeng, X.; Cao, Y.; Zeng, J.; He, Z.; Ren, Y.; Li, W.; Deng, Q.; et al. The OsmiR396c-OsGRF4-OsGIF1 regulatory module determines grain size and yield in rice. Plant Biotechnol. J. 2016, 14, 2134–2146. [Google Scholar] [CrossRef] [PubMed] [Green Version]
  66. Casadevall, R.; Rodriguez, R.E.; Debernardi, J.M.; Palatnik, J.F.; Casati, P. Repression of growth regulating factors by the microRNA396 inhibits cell proliferation by UV-B radiation in Arabidopsis leaves. Plant Cell 2013, 25, 3570–3583. [Google Scholar] [CrossRef] [Green Version]
  67. Fina, J.; Casadevall, R.; AbdElgawad, H.; Prinsen, E.; Markakis, M.N.; Beemster, G.T.S.; Casati, P. UV-B Inhibits Leaf Growth through Changes in Growth Regulating Factors and Gibberellin Levels. Plant Physiol. 2017, 174, 1110–1126. [Google Scholar] [CrossRef] [PubMed] [Green Version]
  68. Beltramino, M.; Ercoli, M.F.; Debernardi, J.M.; Goldy, C.; Rojas, A.M.L.; Nota, F.; Alvarez, M.E.; Vercruyssen, L.; Inzé, D.; Palatnik, J.F.; et al. Robust increase of leaf size by Arabidopsis thaliana GRF3-like transcription factors under different growth conditions. Sci. Rep. 2018, 8, 13447. [Google Scholar] [CrossRef] [PubMed] [Green Version]
  69. Wu, L.; Zhang, D.; Xue, M.; Qian, J.; He, Y.; Wang, S. Overexpression of the maize GRF10, an endogenous truncated growth-regulating factor protein, leads to reduction in leaf size and plant height. J. Integr. Plant Biol. 2014, 56, 1053–1063. [Google Scholar] [CrossRef] [PubMed]
  70. Lu, Y.; Zeng, J.; Liu, Q. The Rice miR396-GRF-GIF-SWI/SNF Module: A Player in GA Signaling. Front. Plant Sci. 2022, 12, 786641. [Google Scholar] [CrossRef] [PubMed]
Figure 1. Comparison of 1601 and M8 plants and leaves. (a,b) are biennial seedlings of 1601 and M8. (c,d) and (e,f) are the leaves of 1601 and M8 growing at the annual stem segment, respectively; (g,h) and (i,j) are the leaves of 1601 and M8 growing at the biennial stem segment, respectively.
Forests 14 01554 g001
Figure 2. The leaflet phenotype of 1601 and M8. The length (a), width (b), aspect ratio (c), thickness (d), surface area (e) of the leaflets and serrate number of top leaflet in function fronds of the two varieties were measured and compared. Data in (af) were mean ± SE, and “*” and “**” means the significant difference at the 0.05 and 0.01 level, respectively. The upper and back surface phenotype of the top leaflet of 1601 (i,g) and M8 (h,j). Bars in (i,g) represent 2 cm.
Forests 14 01554 g002
Figure 3. The frond phenotype and photosynthetic parameters of 1601 and M8. (ad): The frond phenotype, consist of the total length (a), petiole length (b), leaflet number (c) and leaflet distance (d). (eh): The photosynthetic parameters consist of the net photosynthetic rate (e), stomatal conductance (f), intercellular CO2 concentration (g) and net transpiration rate (h). Data are mean ± SE, and “*” and “**”indicated the significant difference at the 0.05 and 0.01 level, respectively.
Forests 14 01554 g003
Figure 4. Determination of water loss rate of detached leaf. The water loss rate of detached leaves of M8 plants was higher than that of 1601.
Forests 14 01554 g004
Figure 5. Observation of paraffin sections of 1601 and M8 leaves. (a) shows the pinnule of 1601, and (b) shows the pinnule of M8.
Forests 14 01554 g005
Figure 6. Results of transcriptome sequencing and analysis. (a): Differentially expressed genes (DEGs) in leaves of 1601 and M8 transcriptome. (b): Gene ontology (GO) classification of DEGs. GO was summarized in three main categories: biological process (left panel), cellular component (middle panel) and molecular function (right panel). The number of genes was also shown. (c) Top 20 significant enrichment analysis of DEGs pathways in hybrid progeny and female parent leaves.
Forests 14 01554 g006
Figure 7. DEGs in the anthocyanin biosynthesis pathway (a) and flavonoid biosynthesis pathway (b). Heatmaps were visualized according to gene expression levels (data log10 processed). The left side is the gene expression level in M8, and the right side is the gene expression level in 1601.
Forests 14 01554 g007
Figure 8. DEGs in the auxin signal pathway (a) and BR signal transduction pathway (b). Heatmaps were visualized according to gene expression levels (data log10 processed). The left side is the gene expression level in M8, and the right side is the gene expression level in 1601.
Forests 14 01554 g008
Figure 9. Heat map of DEG expression in the GRF family and TCP family. The DEGs in the GRF family (a) and in the TCP family (b).
Forests 14 01554 g009
Figure 10. Correlation heat map of gene coexpression network module and different parts. The experimental results were repeated three times. Among all modules, the modules with high expression of genes in leaf sites were selected for further analysis.
Forests 14 01554 g010
Figure 11. Brown module gene expression heatmap and its coexpression network between 1601 (a) and M8 (b). The three columns of the heat map were the gene expression levels in leaves, xylem and phloem, respectively. The results indicated that these genes were specifically expressed in leaves.
Forests 14 01554 g011
Figure 12. Electropherogram for each primer pair. M: 2000 DNA Marker; 1: FmLHCB6-1; 2: Fm5MAT; 3: FmCYP75B1; 4: FmC12RT1; 5: Fm3GGT; 6: FmUGT79B1-1; 7: FmGRF4; 8: FmLHCA2; 9: FmUGT79B1-2; 10: FmLHCB1; 11: FmLHCB6-2; 12: FmLHCB4; 13: FmGRF7.
Forests 14 01554 g012
Figure 13. qRT-PCR for selected genes. The results were consistent with transcriptome sequencing results, indicating that transcriptome sequencing results are highly reliable.
Forests 14 01554 g013
Figure 14. Regulation model of transcription factors (TFs) and hormones in leaf development.
Forests 14 01554 g014
Table 1. qRT-PCR primer sequences.
GeneAmplified Fragment Length (bp)Forward Primer (5′–3′)
(Tm)
Reverse Primer (5′–3′)
(Tm)
Fm5MAT205ACTTCCATCCAATTC
AGCGTCT (53)
GTTAGAGAAACGGAG
TCCCCAG (57)
Fm3GGT241GGCAACAACAACTTG
TACCCAG (55)
ACCCAATCTTGGTTGC
CAATTT (51)
FmGRF4159AGGAACTGGAACAT
CAAGCCAT (53)
ATTTCTTCCCATCTGTC
CTCCG (55)
FmGRF7121TAAATTGGCTGCAAA
CATGGGG (53)
AAAGAGAAGATCAG
CAGGCACA (53)
FmCYP75B1225CGGAGCAGTTTCTTA
AGGTCCA (55)
CTAAGGCGTGTGCAA
GAATAGC (55)
FmC12RT1231GCACATGGACATGTT
TTTCCCT (53)
TGGCATAAGATTTGGT
GGGACA (53)
FmLHCB6-1230TGCATTCTTGAATGG
TGGCAAG (53)
ATGCTGGATCCTTTCC
AAGACC (55)
FmLHCA2241TGATCCTGACAGACC
ATTGTGG (55)
AGCAGTGTACCATGA
AGGAGTG (55)
FmLHCB1220AGATCACAGGCAAC
GGAAGAAT (53)
ACCTCAAGCTCACGGT
TCTTAG (55)
FmLHCB4228ATTCGGAACCAAGA
AAGCTCCA (53)
GTCCCAATAATATCAC
CCCCA (52)
FmUGT79B1-1178TGTTCAAAGCCAGAT
TTCGTCG (53)
TATCGCACTGCGCAAT
TGTTAG (53)
FmUGT79B1-2241GGCAACAACAACTT
GTACCCAG (55)
ACCCAATCTTGGTTGC
CAATTT (51)
FmLHCB6-2223AGCCAGATTTTGTTGT
CTGCAC (53)
AGAATGCTGGATCCTT
TCCGAG (55)
Disclaimer/Publisher’s Note: The statements, opinions and data contained in all publications are solely those of the individual author(s) and contributor(s) and not of MDPI and/or the editor(s). MDPI and/or the editor(s) disclaim responsibility for any injury to people or property resulting from any ideas, methods, instructions or products referred to in the content.

