Article

Seasonal Variation and Soil Texture-Related Thinning Effects on Soil Microbial and Enzymatic Properties in a Semi-Arid Pine Forest

1
Research Group in Forest Science and Technology (Re-ForeST), Research Institute of Water and Environmental Engineering (IIAMA), Universitat Politècnica de València, Camí de Vera s/n, E-46022 Valencia, Spain
2
Independent Researcher, E-46022 Valencia, Spain
*
Author to whom correspondence should be addressed.
Forests 2023, 14(8), 1674; https://doi.org/10.3390/f14081674
Submission received: 29 June 2023 / Revised: 7 August 2023 / Accepted: 16 August 2023 / Published: 18 August 2023

Abstract

:
Thinning is a practice that reduces competition for available soil resources, thereby promoting vegetation growth and affecting soil, which is involved in important ecosystem processes. Soil quality is directly influenced by various aspects such as ground cover, regional climate, and local microclimate, which can further be modified by forest thinning. In this study, the effect of tree thinning and climate on microbiological and enzymatic soil properties was investigated in an Aleppo pine (Pinus halepensis M.) forest more than a decade after silvicultural treatments. The treatments included were clear-felling (100% of mean basal area (BA) removed), moderate thinning (60% BA removed), and control (no thinning). Soil organic carbon (SOC), water-soluble organic carbon (WSOC), basal soil respiration (BSR), microbial biomass carbon (MBC), soil enzymes (β-glucosidase, acid phosphatase, urease, and dehydrogenase), general soil characteristics, soil temperature and humidity, and precipitation were compared seasonally for over two years by analysis of variance and multivariate analysis. Results showed that the effect of 60% thinning improved soil microbial and enzymatic soil properties with variable results, mainly depending on soil organic matter content and soil texture. SOC, WSOC, and MBC were highly correlated with BSR and enzymatic activities. The main reason for the observed differences was water availability, despite a large seasonal variation. In conclusion, microbial activity was strongly affected by soil characteristics and climate, which in turn were influenced by the silvicultural treatments applied. Moderate thinning can be used as a useful practice to improve soil quality in the Mediterranean area.

1. Introduction

The Aleppo pine (Pinus halepensis Miller) is the most widespread thermophilous pine species in the Mediterranean, preferentially growing near the coast but reaching altitudes of up to 2000 metres [1,2]. It can colonise abandoned fields, has excellent resistance to adverse climatic (drought tolerant) and soil conditions, and can regenerate after fire [3,4,5,6]. It typically grows in regions with high summer temperatures and low winter precipitation [7]. As such, it has been widely used in afforestation and reforestation programmes in arid and semi-arid environments for many decades [8,9]. In fact, it is the most abundant pine species in Spain, covering 2,066,306 ha (i.e., 11.37% of the Spanish forest area) [10]. Despite this, the spread of Aleppo pine propagation has been questioned, given that areas dominated by this species in the Mediterranean basin often have low diversity [4,11], high fire risk (lack of self-pruning of cones and branches, high resin content or fuel accumulation, increasing the likelihood of fires) [6,12], and high rainfall interception [13]. Excessive development of this species can also reduce shrub survival and growth through competition for water, nutrients, and light [14,15]. To address these problems, forest thinning has been described as a silvicultural treatment that reduces tree density with the primary aim of improving the growth, health, and value of the remaining trees by increasing water availability, light, and nutrients [16]. Tree thinning reduces fuel loads, can improve pine growth [17], increases stand heterogeneity [11], and can ameliorate drought stress [18]. However, opposite effects have also been observed; for example, Nunes et al. [19] did not detect any effect of pine thinning on the richness and diversity of understory plants.
Soil quality depends on its physical, chemical, and biological properties. It is considered that microbial communities and biochemical properties tend to react most rapidly to changes in the external environment. Forest thinning involves opening the forest canopy, which may affect microclimatic conditions, the amount of litter reaching the soil, the rate of litter decomposition, the leaching of dissolved organic matter, and root density [20,21,22]. With regard to the latter, forest soils are important carbon (C) stores in different pools; 45% of forest C is found as soil organic matter, and 11% as dead wood and litter [23]. It has been described that forest thinning can affect nutrient mineralisation rates in the forest floor and mineral soil, soil organic carbon (SOC) content, and also labile SOC fractions [24,25]. Many studies have focused on the effects of thinning on SOC [26], but the results are still controversial. Some authors have claimed that thinning decreases SOC [27]; however, others have reported no change [26,28] or an increase [29]. Soil labile organic carbon is the fraction of soil organic carbon that is degradable during microbial growth, has the fastest turnover times [30], and is used as an indicator of microbial activity [24,31]. Soil labile organic carbon pools include microbial biomass carbon (MBC), oxidisable C, and water-soluble organic carbon (WSOC), and they can be used as energy for microbial activities. Thinning also affects soil labile carbon pools, and also controversial results have been obtained [24]. Different studies have found that thinning increased labile organic carbon [32], decreased it [33], or produced no effect [34]. Chen et al. [24] also found different results depending on the fraction of labile organic carbon in the soil examined.
Soil microbial and biochemical parameters may reflect the status of soil biological activity, which is responsible for the transformation of litter into soil organic matter, and then for nutrient availability in forest ecosystems. Thinning can affect microbial communities (structure and activity) and enzyme activities [35]. Soil enzymes are involved in soil microbial metabolism and in biogeochemical cycles, and together with other soil properties, can be used to detect the effects of anthropogenic management, including forestry, and to provide information on the ability of soils to carry out biogeochemical reactions [36]. Enzyme activity in soils depends on microbial and root activity, which is regulated by moisture, temperature, and substrate quality [37,38]. Therefore, enzyme activity in soils can change with climatic conditions [39,40]. Among the most studied enzymes associated with changes in soil quality are oxidoreductases (e.g., dehydrogenases) and hydrolases (e.g., β-glucosidase, acid phosphatase, or urease) because they are involved in the transformation of organic matter and participate in the release of C, nitrogen (N) and phosphorus (P) [41,42]. Dehydrogenase is an intracellular enzyme, and its activity is an indicator of oxidative metabolism in soil [43]; however, there is not always a direct correlation between its activity and oxygen consumption and microbial activity [36]. Soil ureases release ammonium ions through urea hydrolysis and are essential for the hydrolysis of amino compounds [44]. Cordero et al. [45] state that urease is widely considered to be a good proxy for N mineralization, although urea is a very small fraction of soil organic N [36]. β-Glucosidase is associated with the breakdown of labile cellulose and other carbohydrate polymers [39] and thus with the C cycle. Phosphatase converts the complex organic forms of P to assimilable P, releasing orthophosphate by hydrolysis of oxygen P bonds [46]. However, it has not always been possible to provide a straightforward interpretation of the results obtained from soil enzyme studies [36].
The above-mentioned controversies for SOC, soil labile organic carbon, and enzymes may be due to tree species, soil properties, climatic conditions, the intensity of thinning, removal of understorey vegetation, season of soil sampling, the time elapsed since treatment, soil depth sampling, retention of thinned material on-site or its incorporation into the soil, among others. It is important to conduct studies that determine seasonal variations in soil microbial properties and soil enzyme activities in order to draw more reliable conclusions about the effect of thinning on these soil parameters. Seasonal variation has been attributed to microclimate, soil chemical factors, changes in organic matter quality, and substrate availability. Based on the high variability observed in the literature on the effects of thinning on biochemical, microbiological, and enzymatic quality indicators, the main objectives of this study were: (1) to characterise the physico-chemical properties of the soils studied eleven years after thinning; (2) to evaluate the potential impact of thinning and seasonal variation on the soil microbial and enzymatic properties; and, (3) to study the relationships between soil properties and soil microclimatic conditions. We hypothesised that thinning would lead to positive changes in microbiological and enzymatic soil properties in the long term.

2. Materials and Methods

2.1. Study Area and Forestry Treatments

The experimental area was located close to the Alto de la Montalbana (39°49′26″ N, 1°05′47″ W, 980 m a.s.l.) in Tuéjar, the province of Valencia, eastern Spain (Figure 1). The dominant species at the study site is Pinus halepensis M. and accompanying species are Quercus coccifera, Juniperus oxycedrus, Juniperus phoenicea, and Brachypodium retusum. There is a scant presence of suppressed Quercus rotundifolia [21]. The predominant climate in this region is Mediterranean, with seasonal rainfall mainly in spring and long dry spells in summer. According to the World Reference Base for Soil Resources, the dominant soils are mainly Rendzic Leptosols (i.e., very shallow soils with minimal development, typically formed on hard rock or highly calcareous materials), although there can also be formations of Albic Luvisols (i.e., typically developed in areas with little slope, dry and wet seasonality, with a tendency to accumulate clay in the lower layers) and Calcaric Regosols (i.e., poorly consolidated soils composed of fine material, with little organic matter, and low water-holding capacity) [47].
The silvicultural treatments were carried out in the year 1998 on a mature pine forest nearing the end of rotation (average tree age 55 years) [21] with a full thickness (forest cover > 80% and density of 900 trees/ha) with the aim of transforming a monospecific homogeneous Aleppo pine forest into a mixed holm oak and Aleppo pine forest. Treatment plots of a minimum size of 30 × 30 m were randomly selected in three blocks and surrounded by a 7.5 m radius to avoid edge effects. Each treatment consisted of three replicates, one replicate per block. The three blocks were separated by less than 3 km and were assumed to be comparable in terms of slope (< 5%), canopy cover, and climate. Three different forest treatments were applied per block, i.e., no thinning (T0) (control), moderate thinning (60% of mean basal area removed) (T60), and complete three removal (T100). In this study, the results were evaluated a decade later in three seasons (spring, summer, and autumn) of the years 2009 and 2010.

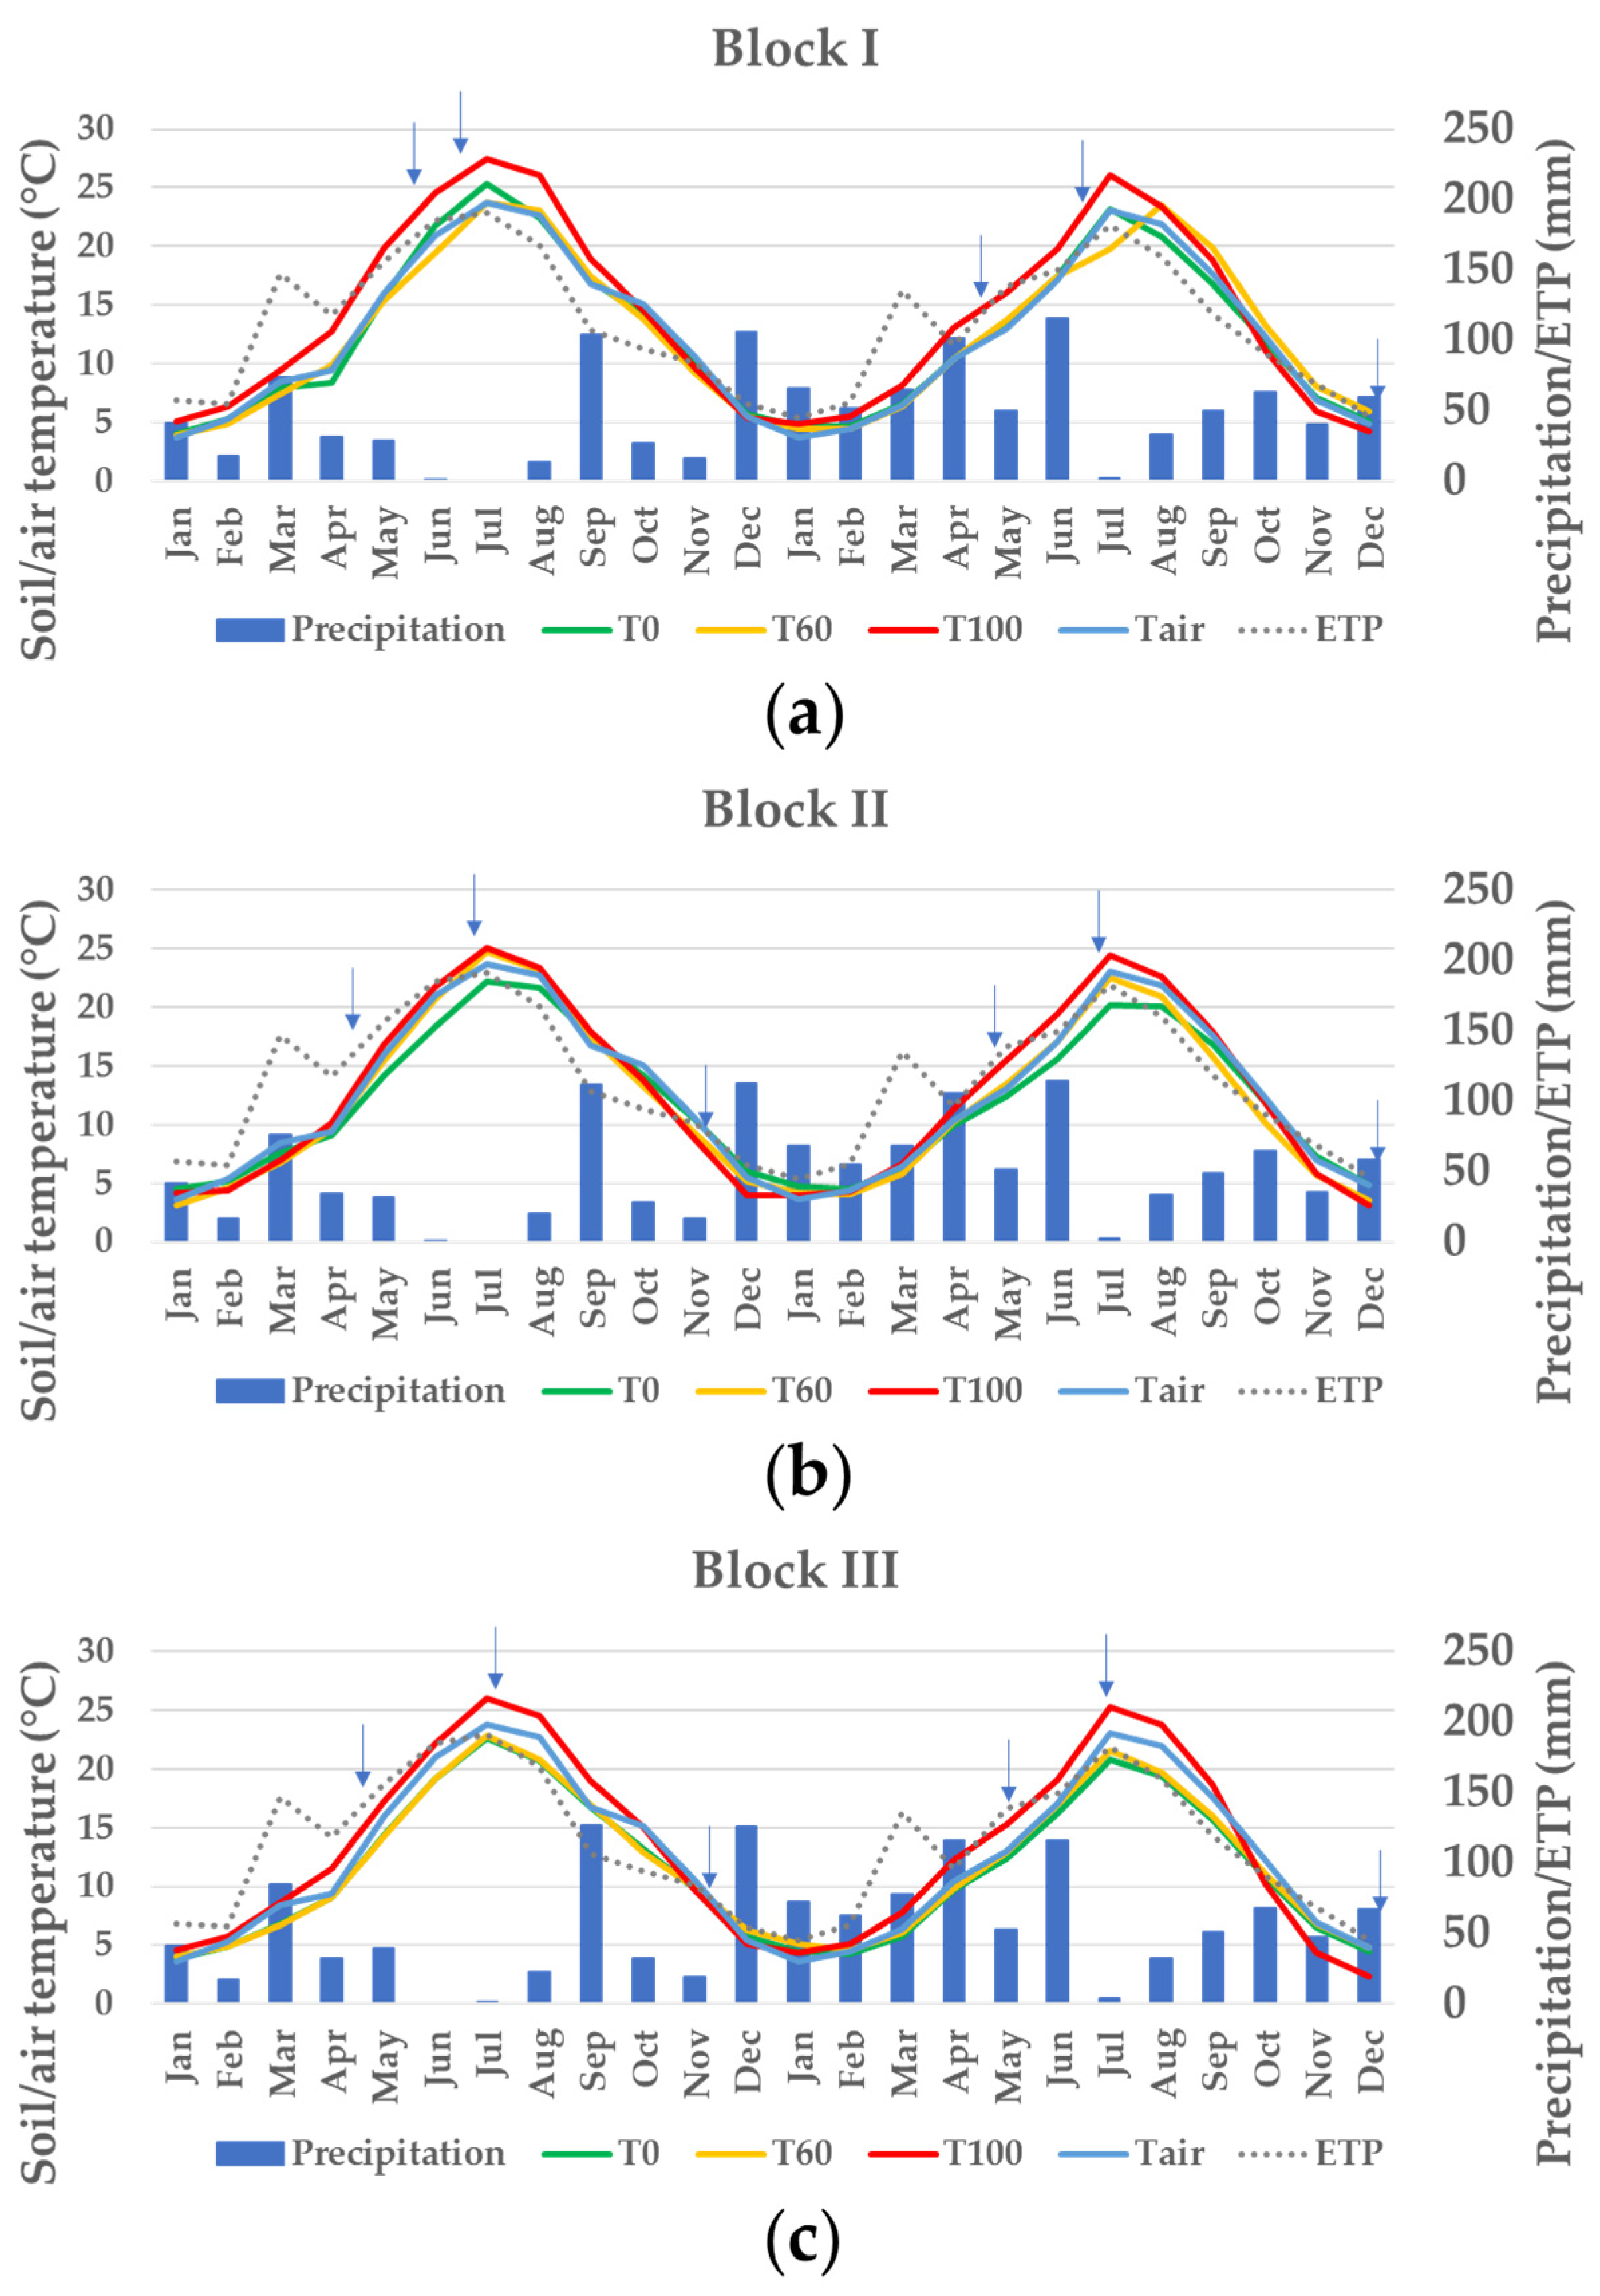
2.2. Microclimate in the Experimental Plots

The average monthly soil and ambient temperature, monthly precipitation, and average monthly ETP of the study years are shown in Figure 2. The incident precipitation and ETP data represented in Figure 2 are the same for the three blocks.
Precipitation and evapotranspiration (ETP) data were collected from a nearby weather station (Chulilla, Valencia, Spain) using a pluviometer (ARG100, Campbell Scientific Inc., Logan, Utah, USA) and a datalogger (CR1000, Campbell Scientific Inc., Logan, UT, USA). Continuous monitoring of the experimental plots was carried out using soil temperature sensors at a depth of 5 cm (model ECT-S, Decagon Devices, Pullman, Washington, DC, USA) with a data logger (EM50, Decagon Devices, Pullman, Washington, DC, USA) recording data hourly. Ambient temperature was similarly recorded by a sensor (model RT-1, Decagon Devices, Pullman, Washington, DC, USA) placed in Block II.

2.3. Soil Sampling

Soil samples were collected in the spring, summer, and autumn of 2009 and 2010 to investigate the influence of climatic factors on the measured properties (except autumn 2009 in Block I). In each plot, three mineral soil samples were taken randomly from 0 to 10 cm after removing the organic horizon. The samples were transported to the laboratory and sieved (2 mm mesh). A sub-sample of each sieved soil was air-dried to determine general soil properties, and the remainder was stored at 4 °C for analysis of microbial and enzymatic parameters. For all analytical tests, the average of two or three replicates per sample was used, and data were expressed on an oven-dry weight basis.

2.4. Analysis of General Soil Properties

Soil water content was measured by the drying method (105 °C, to constant weight) [48]. Electrical conductivity (EC) [49] and pH were measured in a 1:2.5 (w/v) aqueous solution using a conductivimeter (model, Crison, Barcelona, Spain) and pH meter (2001, Crison), respectively. Cation exchange capacity (CEC) was determined by the ammonium acetate extraction method at pH 7 [50]. Carbonate content was determined using Bernard’s calcimeter. The texture was determined by the Bouyoucos method after pre-treatment with hydrogen peroxide to remove organic matter. EC, pH, CEC, carbonates, and texture were determined on samples collected in the summer of 2009. Soil water-holding capacity (WHC) was determined on sieved samples and calculated from the amount of water retained by the saturated soil without drainage at −20 kPa in Richard’s membrane plate extractor [51]. Soil oxidable organic carbon (SOC) was determined by wet oxidation with 1 N potassium dichromate (K2Cr2O7) in an acid medium and evaluation of the dichromate excess with 0.5 N ferrous ammonium sulphate [52]. Water-soluble organic carbon (WSOC) was determined in the (1:2.5) aqueous extract of soils obtained after 30 min of mechanical shaking, centrifugation at 2500 rpm for 5 min, and filtration through a Whatman 42 paper filter. WSOC in the extracts was determined by oxidation of K2Cr2O7 in concentrated H2SO4 [53].

2.5. Soil Respiration

Basal soil respiration (BSR) was measured on 10 g of fresh soil hydrated to 60% of its WHC and incubated in hermetically sealed flasks in the dark at 25 °C for 14 days. The CO2 produced during incubation was collected in 2 mL of 1 M NaOH solution and titrated with HCl after the addition of Cl2Ba to precipitate carbonates (modified from Aoyama and Nagumo [54]).

2.6. Microbial Biomass Carbon

Microbial biomass carbon (MBC) was determined using the chloroform fumigation extraction method [55], and the carbon extracted with 0.5 M K2SO4 was measured in the same way as for WSOC. The difference in C concentration between fumigated and non-fumigated extracts was expressed as microbial biomass C by multiplying by a factor (Kc) of 0.38 [55].

2.7. Enzime Activity Measurements

Acid phosphatase (hereafter abbreviated as ‘PHOS’) activity was evaluated by spectrophotometry as the amount of p-nitrophenol (PNP) released from 1 g of fresh soil after incubation at 37 °C for 1 h with the substrate p-nitrophenyl phosphate in modified universal buffer (MUB) (pH 6.5). Then 0.5 M CaCl2 was added, and the released PNP was extracted with 0.5 M NaOH and filtered (Filter-Lab ref. 1246, Barcelona, Spain) [56].
β-glucosidase (GLUC) activity was determined as described for phosphomonoesterase activity, except that the substrate was p-nitrophenyl-β-d-glucopyranoside in MUB buffer (pH 6) and the p-nitrophenol released was extracted with 0.1 M THAM–NaOH (pH 12) [57]. β-glucosidase activity was quantified by reference to a calibration curve constructed using p-nitrophenol standards incubated with soil under the same conditions described above.
Urease (UREA) activity was determined as the amount of NH4+ released from 2 g of fresh soil after incubation with urea (6.4%) for 1.5 h at 37 °C in 0.2 M phosphate buffer (pH 7) [58]; the released N-NH4+ was determined in a flow injection analyser (FIAStar 5000, Foss 15 Tecator, Höganäs, Sweden).
Dehydrogenase (DEHY) activity was determined using iodonitrotetrazolium violet as substrate, incubated at pH 7.5 (1 M Tris–HCl buffer) and 40 °C for 1 h. The iodonitrotetrazolium formazan (INTF) formed was extracted with a 1:1 (v:v) mixture of ethanol and dimethylformamide and measured spectrophotometrically at 490 nm [59]. The activity was quantified by reference to a calibration curve constructed using INTF standards incubated with soil under the same conditions described above.

2.8. Statistical Analysis

The soil parameters studied were compared using a two-way analysis of variance (ANOVA) with treatment and season as factors for each block. Post-hoc Tukey’s honestly significant difference (HSD) multiple comparison test at p ≤ 0.001, 0.01, or 0.05 was used to determine significant differences. When needed, data were log (LOG10) or square root (SQRT)-transformed prior to ANOVA to meet the conditions of normal distribution and equal variance. Normality and homoscedasticity assumptions were tested using the Shapiro–Wilk and Levene’s test at p ≤ 0.05, respectively. In the same way, one-way ANOVA was carried out on all the characteristics to assess the differences between treatments in each block and seasonal differences for each treatment in each block. Multiple sample comparisons of the variables tested were carried out using Spearman’s method with untransformed data using Principal Component Analysis (PCA) for comparisons with climate variables (accumulated precipitation, average soil temperature and soil moisture at 5 cm depth for the 15 days preceding each sampling) and matrix correlation with soil properties. Data are presented as untransformed means and standard deviations. Statgraphics statistical software program (version XVIII, Statpoint Technologies, Inc., Warrenton, VA, USA) was used for analysis.

3. Results

3.1. Soil Characteristics in the Experimental Blocks

3.1.1. Physico-Chemical Properties of Soils

The soil physico-chemical properties in each treatment and block are shown in Table 1. Soil pH is considered to be a key variable as it affects a number of chemical reactions. Soil pH values were slightly alkaline (7.25–8.14) except for treatment T100 in Block III, which was 6.77. Electrical conductivity (EC) was lower in Block III with values below 0.3 dS m−1; the average values in Blocks I and II were 0.59 and 0.64 dS m−1, respectively. The texture is directly related to WHC and CEC, with clay soils having the highest WHC and CEC. The soils of Blocks I and II were more clayey than those of Block III. It should be noted that in Block III, soil from T60 had between 2.1 and 2.7-fold higher clay content than soils from T0 and T100, respectively. The experimental soils showed a high diversity in their physical and chemical characteristics, typical of Mediterranean forests [60].

3.1.2. Soil Water-Holding Capacity

Soil water-holding capacity is known as the total amount of water that a soil can hold after excess water has been drained. Figure 3a shows the means and standard deviations for each treatment, season, and block for WHC. We found insignificant seasonal variations in Block I. The significant differences in Block II were related to the first summer; however, we did not find a decrease in SOC that could explain the lower values of WHC at this sampling date (Table A1 and Table A2). Small differences found between seasons were attributed to the variability of the forest soil itself. Block III was very different from the previous two; in fact, the global values were quantitatively lower in Block III than in the other two blocks. These differences can be explained by the different textures, as Block III has a higher sand content (Table 1). This significantly reduces its water-holding capacity from about 1.2 to 1.5-fold. This is evident from the correlation between the two variables, WHC and clay content (R2 = 0.87) (Figure 3b). Moreover, WHC was higher in T60 of Block III (24.14% on average), compared to T0 (13.01%) and T100 (16.34%) of this block.

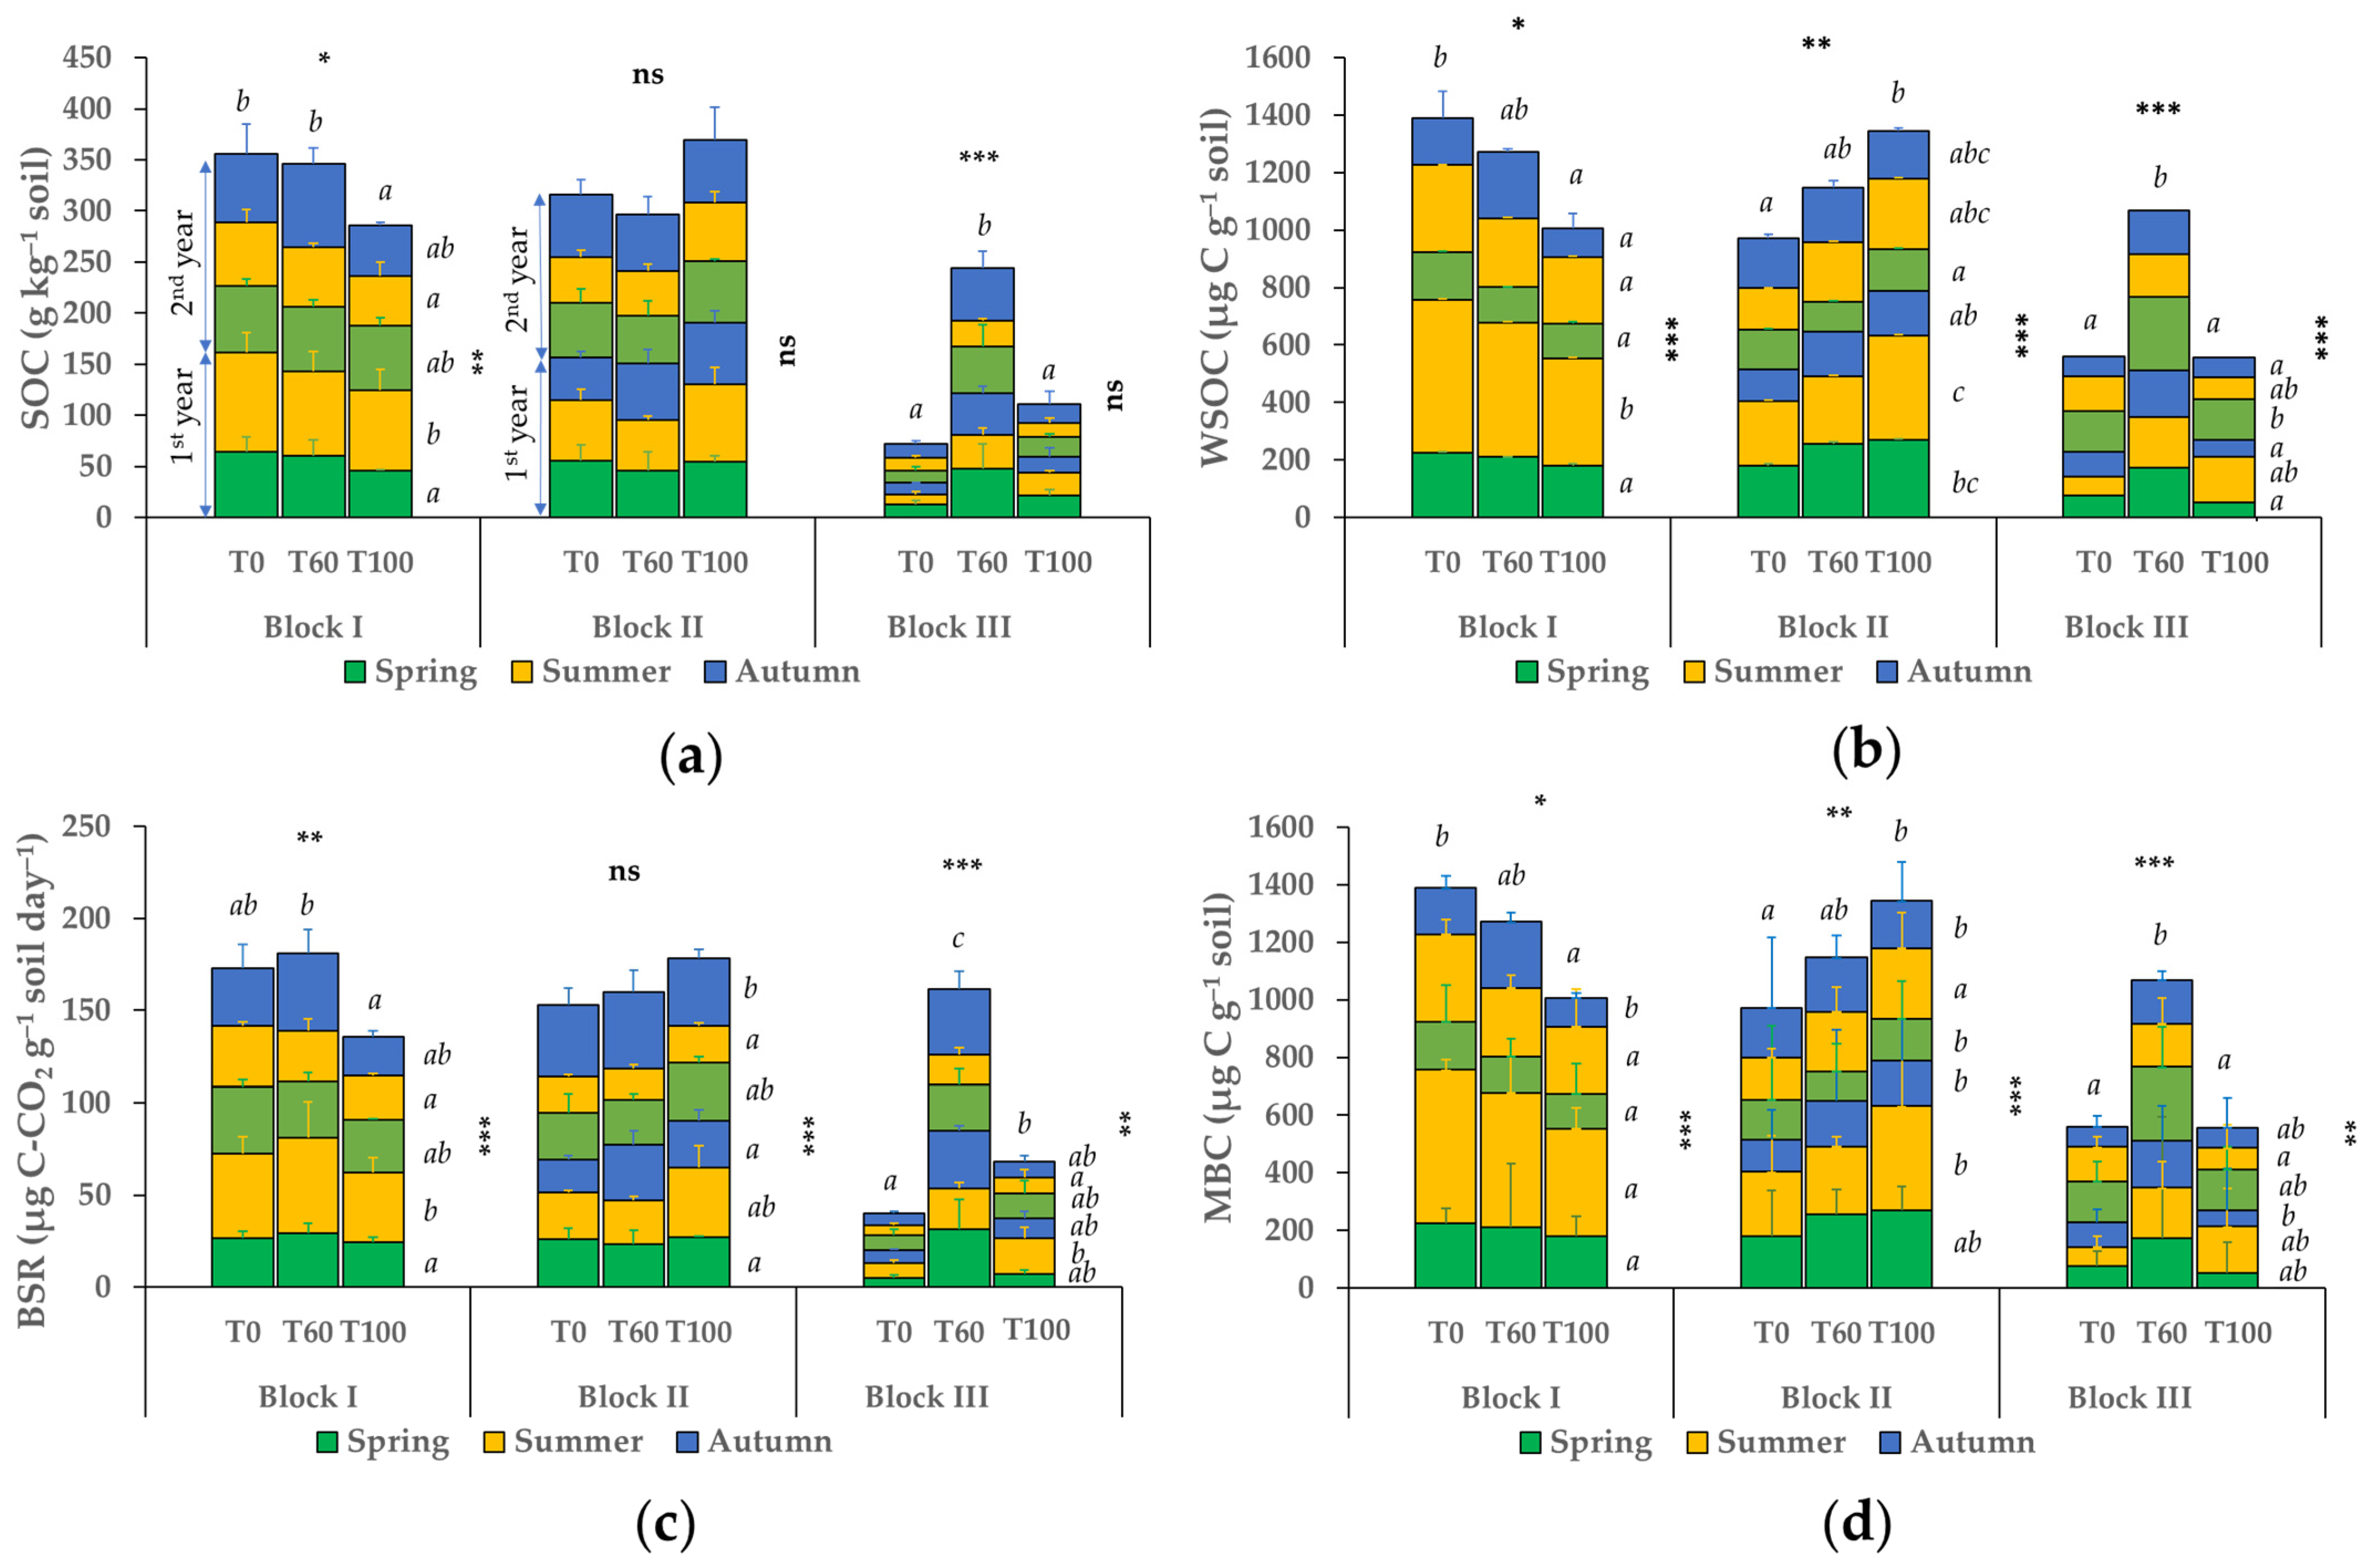
3.2. Seasonal Variation of Soil Labile Organic Carbon Fractions and Basal Soil Respiration

Results on the seasonal variation of SOC and soil labile organic carbon fractions (WSOC and MBC) and soil respiration for each treatment, season, and block are shown in Figure 4, Table A1 and Table A2. SOC content and WSOC (i.e., its soluble fraction) are seasonal-cumulative shown in Figure 4a,b. As shown, the seasonal pattern by block for both parameters was very similar, although the behaviour was different when comparing the three blocks. In Block I, SOC and WSOC decreased significantly (about 0.2 and 0.3-fold, respectively) with overall tree thinning (T100), with significant seasonal changes. The results in block II differed from Block I. In Block II, the observed differences were not significant for SOC; however, WSOC was significantly higher in treatment T100, which could be explained by higher solar radiation on the soil (i.e., Figure 2 shows that the higher temperatures registered in T100 were significantly higher for all sampling periods compared to T0 and T60), as seasonal significant differences were mainly observed in both summers. However, Block III had much higher values in T60, which is explained by the fact that the soil in this treatment has more clay, which changes the soil’s capacity to store organic matter.
The activity of BSR (i.e., the CO2 generated by the metabolic activities of soil organisms) and MBC (i.e., quantifiable soil labile carbon fraction from soil microbial biomass) and their variations based on the different blocks, treatments, and seasons are shown in Figure 3c,d, respectively. As shown, the evolution pattern is practically identical to that of SOC and WSOC. This shows that these characteristics are strongly correlated with the activity of the microorganisms. It can be noted that the seasonal differences of BSR found in T60 of Block I with respect to T0 and T100 were higher (about 1.6–1.8-fold) than the rest of the studied parameters.

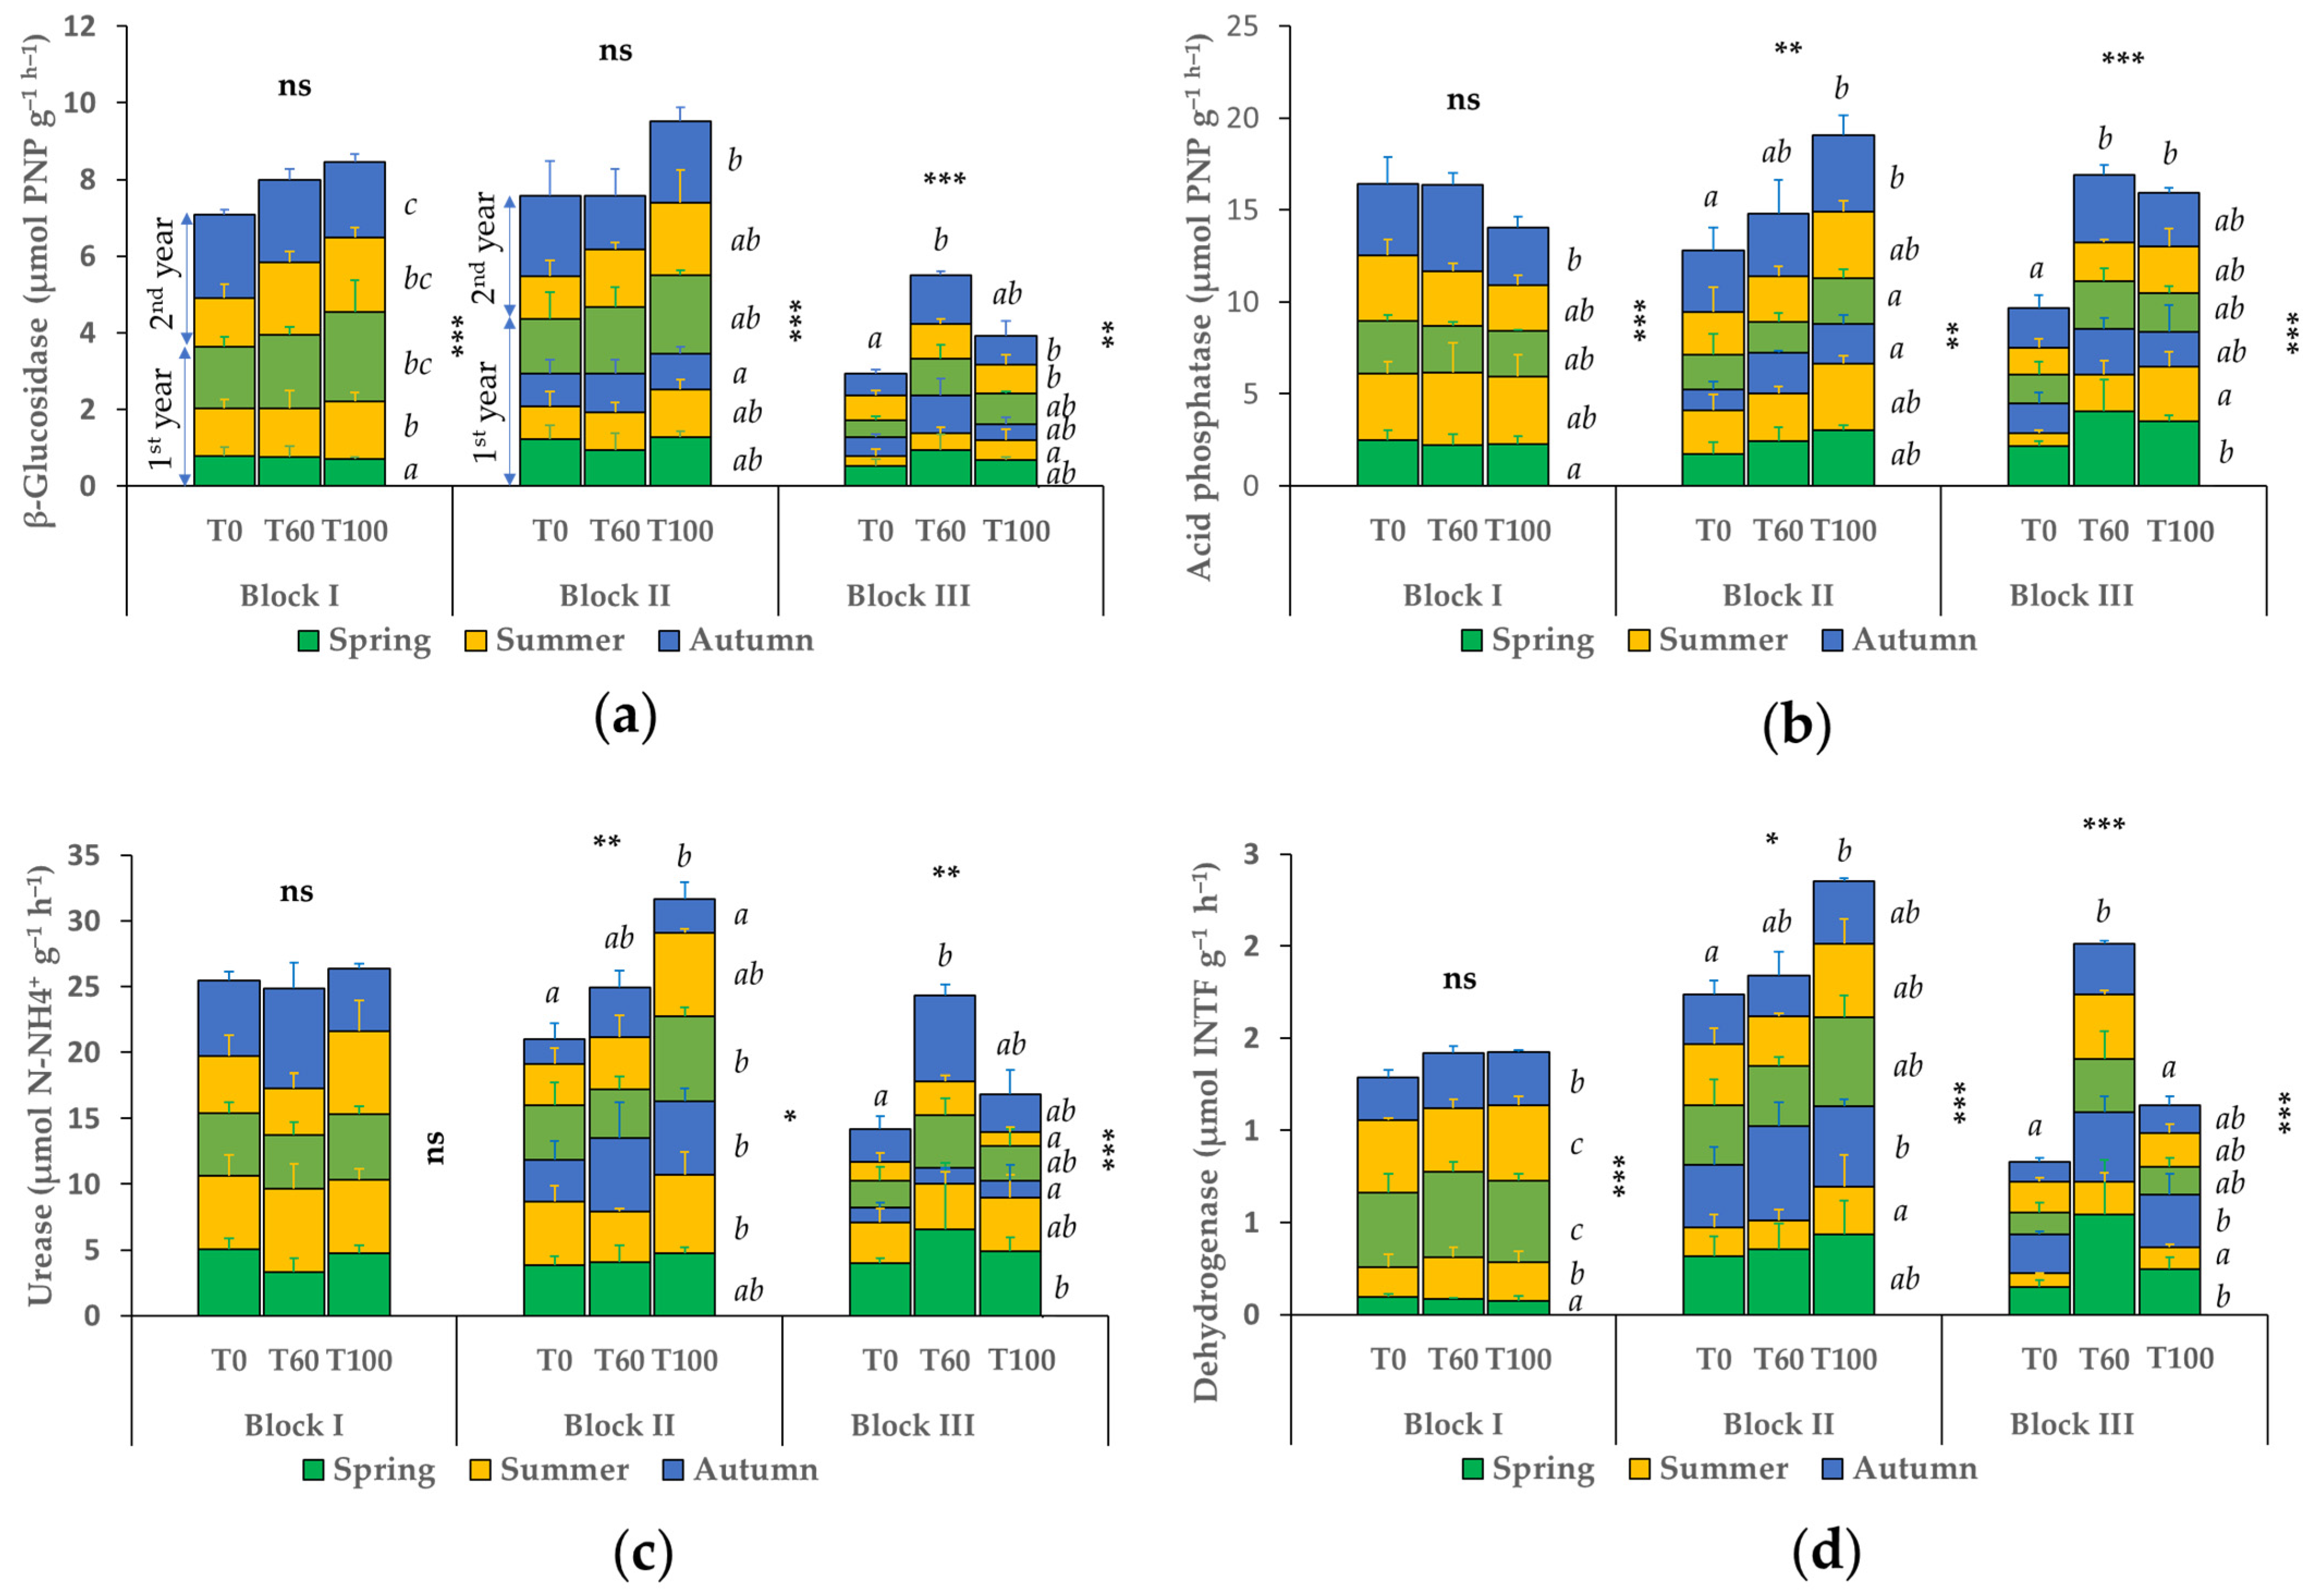
3.3. Seasonal Variation of the Soil Enzyme Parameters for Each Treatment

The results of the seasonal variation of the enzymes β-glucosidase, acid phosphatase, urease, and dehydrogenase as a function of each silvicultural treatment applied and each block are shown in Figure 5, Table A3 and Table A4. β-glucosidase is responsible for the degradation of low molecular weight carbohydrates in soils, resulting in the production of sugars after their hydrolysis. Figure 5a shows that only Block III was affected by the treatments, with T60 having the highest enzymatic activity, followed by T100. As mentioned above, for other soil parameters, this may be due to the textural properties and higher SOC content of the soil at T60. Maximum differences in this Block III were produced in both autumns, being 1.4–1.5-fold higher in T60 compared to T0. In the seasonal comparison, Blocks I and II showed values that were double or almost double compared to Block III. This could be due to the considerable differences in soil physico-chemical properties reported in Blocks I and II compared to Block III. As can be observed, the soils with higher sand content showed a reduced enzymatic activity, which could be due to lower substrate availability and WHC.
The results of the seasonal evolution of acid phosphatase activity are shown in Figure 5b. Phosphatases convert organic phosphorus in the soil into assimilable forms (phosphate ions) for microbes and plants. As it can be observed, a lower cover, which implies a higher incident solar radiation on the soil, a lower input of C to the soil in the form of litterfall, and a higher decomposition activity of soil microorganisms seem to be associated with a higher enzymatic activity considering that treatments T60 and T100 showed higher activity (approx. 1.3-fold) both in Block II (clay loam texture) and in Block III (sandy loam texture) (except for Block I where the differences between treatments were not significant). At the seasonal level, there was a high variability, although the highest levels of enzymatic activities occurred in the first summer and second autumn.
Urease activity is shown in Figure 5c. Urease is an enzyme that catalyses the hydrolysis of urea to CO2 and ammonia. The pattern of its evolution based on the treatments applied showed a pattern similar to that seen for the enzymes β-glucosidase and acid phosphatase, although T60 was highlighted as being significantly higher in Block III at about 1.4-fold. Seasonally, the enzymatic activity for urease was very uneven, with no clear association between seasons and dynamics shown.
Dehydrogenase activity is represented in Figure 5d. This enzyme is important in mineralisation processes because it is required in the early stages of oxidation (i.e., breakdown) of organic matter. Unlike the other three, it is not released into the environment but remains within the microorganisms. The evolution of this enzyme follows a remarkably similar pattern to the other three in terms of blocks, and treatments applied, and seasonality but with significantly greater differences. In Block II, T100 had a higher enzymatic activity, about 1.2-fold higher than T0 and T60. Higher enzymatic activity values may be related to higher soil humidity. Block I also showed no significant differences between treatments either. T60 was found to be more active in Block III, which has a more clayey texture than the other two treatments. Seasonally, the first summer in this Block III had the lowest enzymatic activity, where soil samples were taken later when the soil was warmer.

3.4. Principal Component Analysis (PCA) Correlations between Microbial and Enzymatic Soil Properties and Climate

The Spearman method was used to perform a PCA on each block, including SOC, WSOC, WHC, microbiological properties (BSR and MBC), enzymatic soil enzymatic activities (GLUC, PHOS, UREA, and DEHY), and climatic variables (temperature at 5 cm depth-Temp, soil moisture at 5 cm depth-Hum, and precipitation-Precip) (Figure 6). The factorial inertia of the combinations of variables corresponding to the silvicultural treatments (T0, T60, and T100) and the three seasons (spring, summer, and autumn) was also included.
The biplot (F1, F2) with the components that explained 70.3% of the variability of the parameters studied in Block I is shown in Figure 6a. The climatic variables with the greatest inertia on the F1 component (explaining 41.01% of the variability) were Precip and Hum, while the other variables with the greatest inertia on this component were WSOC, BSR, SOC, and PHOS. According to Spearman, Hum was only significantly and positively correlated with Precip (r = 0.93) and GLUC (r = 0.62), while Precip was also negatively correlated with WSOC (r = −0.58). In other words, higher humidity and precipitation had a negative effect on WSOC and a positive effect on GLUC. The F2 component (which explained 29.32% of the variability) had the greatest inertia compared to Temp, WHC, GLUC, and DEHY. The Spearman correlation with Temp was only significant for WSOC (r = 0.75) (positive) and GLUC (r = −0.63) (negative). Regarding the result of the combination of season and treatment factors, S1 and P1 (1st year) were better correlated with Temp (in fact, they were the seasons in which the highest temperatures were recorded), and spring and summer of the second year (P2 and S2) were more correlated with Hum and Precip (in these seasons the highest soil moisture and rainfall were recorded). No clear differences were observed between most of the treatments applied, which were highly correlated with the climatic conditions of each season. The greatest differences were observed in T100 in the autumn of the second year (A2T100), where a lower correlation was observed with Temp and a higher one with Hum and Precip, explained by the higher rainfall in the second year and the complete removal of all the pines.
According to the PCA for Block II (Figure 6b), which was performed similarly to Block I, the first two components account for 57.1% of the variability. In the first component, F1 (30.46%), the variables with higher inertia were SOC, BSR, WHC, PHOS, and MBC. F2 (26.64%) was the component with the highest inertia on the climatic variables Precip and Hum (positive values on the ordinate axis), Temp (negative values on the ordinate axis), and GLUC. According to Spearman, Temp was significantly correlated with WHC (r = −0.65), BSR (r = −0.48) and UREA (r = 0.48). Hum was significantly correlated with Precip (r = 0.69) and MBC (r = −0.60), and Precip with WSOC (r = −0.48) and GLUC (r = 0.73). As in Block I, high temperatures were associated with the summer and spring of the first year (S1 and P1), while humidity and precipitation were associated with P2 and S2. Regarding the treatments applied, it can be observed that T100 was more associated with high humidity and precipitation, as observed in Block I. Thus, there was a clear influence of seasonality in the treatments. In both summers, T60 had a high correlation with T0, indicating that these experimental plots had very similar climatic behaviour.
In the PCA performed on the results of Block III (Figure 6c), the first two components explained 68.2% of the observed variability. The F1 (48.05%) had more inertia on the variables SOC, MBC, WHC, BSR, GLUC, PHOS, WSOC, and DEHY, while the F2 (20.17%) had more inertia on Hum and Precip. Temp had more inertia on a third component (square cosine of the variable equal to 0.33, with 0.31 being the value obtained for the F2 component), which had more inertia on UREA. In terms of significant Spearman correlations, Precip was positively correlated with Hum (r = 0.49). The climatic variables were not significantly correlated by Spearman with the microbiological and enzymatic parameters analysed in Block III (i.e., in spite of the ANOVAs carried out by season being significant in some cases). This indicates that there were variables other than the climatic ones (i.e., soil properties) that were more influential in the observed changes. In this block, a high correlation of T60 in different seasons was observed with the microbiological and enzymatic parameters, indicating the positive effect of thinning.

3.5. Relationships between Microbial and Enzymatic Variables and Soil Characteristics

The spearman rank correlation matrix is shown in Table 2. We found that there was a strong positive correlation between WHC and the other parameters, except for SAND, which had a negative correlation. The correlations between the different enzymes also show a strong positive correlation with the other parameters, although SAND also had a negative correlation. Regarding the general soil parameters, there was a higher correlation (e.g., > 0.5) with the parameters related to microbiological activity. However, it can be observed that the soil characteristics influenced, to a greater or lesser extent, the evolution of the microbial and enzymatic parameters studied. It is noteworthy that SAND had a negative correlation with all the parameters studied; this explains the different behaviour of Block III, which had a sandier texture, compared to Blocks I and II, which were more clayey. In fact, CLAY was positively correlated with all the parameters studied and, to a greater extent, with WHC, SOC, BSR, and GLUC. Among the highest correlations (i.e., greater than or close to 0.7) stands out WHC with SOC (0.86), BSR (0.79), MBC (0.64), GLUC (0.75), and general soil parameters—especially relevant with SILT (0.69) and CLAY (0.71). SOC was highly correlated with WSOC (0.68), BSR (0.85), MBC (0.67), GLUC (0.71), SILT (0.71) and CLAY (0.75). BSR correlated to a higher degree with GLUC (0.66), SILT (0.62) and CLAY (0.66). Based on the correlations obtained, the enzymatic activity was less influenced by the soil parameters, with correlations generally lower than 0.5, being negative for SAND. In fact, there was a higher correlation between GLUC and parameters such as WHC (0.75), SOC (0.71), and BSR (0.63). PHOS and UREA correlated better with SOC (0.57 and 0.64, respectively) and BSR (0.56 and 0.53, respectively). In contrast, DEHY was more highly correlated with WHC (0.55).

4. Discussion

Forest thinning is a technique often used in the Mediterranean region to increase resource availability by allowing more tree and shrub growth [17,19]. By improving the availability of water and nutrients, proper forest thinning can help combat desertification [61,62]. In this study, after a decade of thinning in the experimental plots, it was possible to confirm that the removal of trees had a direct influence on the microbiological processes occurring in the soil. The effects of shelterwood intensity thinning (60%) and complete removal of pine trees were compared with those of unaltered plots. Several different soil physical (texture and WHC), chemical (pH, carbonates, EC, CEC, SOC, and WSOC), and biological (microbial and enzymatic) parameters were evaluated seasonally (i.e., including climate as a variable). A multivariate approach was applied owing to the fact that soil quality cannot be assessed by simply evaluating one of the physical, chemical, or biological parameters due to the complexity and site-specificity of soils [63,64]. In fact, to determine soil quality, a representative set of significant data consisting of soil variables comprising soil chemical, physical and biological parameters is usually chosen [65,66].
As results, the soils in this study had a pH between about 6.8 and 8.1, which is typical of Mediterranean areas [60]. Texture analysis revealed a difference between Blocks I and II, which had a higher presence of clay and silt, and Block III, which was sandier. Different textures confer different physico-chemical properties to soils [67,68,69]; in fact, a smaller particle size implies a larger reaction surface, affecting processes such as cation exchange capacity (i.e., higher nutrient adsorption), water retention capacity (i.e., smaller pore size), oxygen availability for microorganisms (i.e., less O2 availability), capacity to store organic carbon, or higher plasticity and cohesion [70]. The texture-related WHC parameter was higher in Blocks I and II. In contrast, Block III had lower WHC values (i.e., indicating lower water availability) and was higher in the moderate thinning plot (T60) due to clay and SOC content. In related research, thinning by 50% improved the growth and water use efficiency of Aleppo pine, suggesting a reduction in drought stress [61]. This is explained by a reduction in climate dependence (i.e., a reduction in the resources competition) which favours conditions for shrub development, especially in arid and semi-arid regions [71]. In fact, the establishment and survival of Pinus pinaster seedlings, as well as early primary and secondary growth, were both strongly and weakly positively influenced by thinning [72]. Centenaro et al. [73] found that thinning intensity and topography accounted for most of the total variance in understory species composition in a Mediterranean pine forest, with 18% and 16%, respectively.
Increasing forest productivity through thinning can increase C inputs to soils through the decomposition of organic matter, although the effects depend on various aspects such as practices (i.e., thinning intensity), growth conditions, climate, or time for resilience [74,75]. Although organic matter increases the WHC of mineral soils, the effects depend on soil characteristics or texture [76]. SOC and WSOC content (i.e., the fraction of organic carbon that is soluble in water) is used as quality indices that determine the degree of decomposition of organic matter and its utilisation by microorganisms (i.e., higher levels are associated with increased microbial activity) [77]. In fact, Zhang et al. [78] reported that thinning improved SOC stability by affecting the amount of soil bacterial and fungal necromass C in the soil. However, several studies have found that heavy thinning reduces litterfall and consequently the different fractions of organic carbon [27,79]. In fact, it is reported that intensive thinning dramatically reduced organic carbon in mineral soils 0–5 years after harvest but recovered after 6–20 years, considering recovery times of up to 50–70 years in spodosol forest soils [80]. Also, a larger canopy (i.e., broadleaved and mixed forests) correlates with a high input of organic matter to the forest floor, but coniferous forests produced the most recalcitrant litter of low quality (i.e., in terms of organic matter supply) [26]. The decomposition of organic matter in these latter situations (including Aleppo pine) is greatly influenced by abiotic factors, such as solar radiation or precipitation, conditioned by the intensity of thinning [33]. It was observed that the clayey soils (Blocks I and II) have higher SOC and WSOC levels than Block III, which is attributed to a higher organic matter storage capacity due to the different texture (i.e., the following correlation was found: Clay (%) = 5.43 SOC (%) + 5.24, R2 = 0.93). In fact, soil texture is considered an indicator of soil quality, growth, and activity of microbial biomass [69,81]. Seasonally, it was observed that at higher temperatures (i.e., first summer), the levels of oxidable organic carbon were higher; this is attributed to a higher activity associated with temperature. In fact, drought increased dissolved organic C accumulation due to slower mineralisation and higher stability of dissolved organic matter [82]; and lower C leaching has also been reported in drier periods [77]. However, as SOC and WSOC are dependent on many factors, unpredictable results are usually found in different studies. In fact, mineral soils showed less variation in organic C than forest soils, which in most cases was not significant and dependent mainly on species composition, soil taxonomic order and time since thinning [26,33,80]. Our results were mixed, as no significant difference was found under clayey soils (Blocks I and II), but a positive significant effect was found under sandier soils (Block III). This was explained by the positive effects of long-term moderate thinning, which improves the C content of poorer soils.
BSR (i.e., heterotrophic respiration performed mainly by saprophytic fungi and bacteria through decomposition of organic debris) and MBC (i.e., the C content measure of soil organic matter life, such as bacteria and fungi) showed a similar pattern to that of SOC and WSOC, confirming that the labile fractions of soil organic matter are the substrates for microbial activity (i.e., this was confirmed by Spearman correlations) and are viable quality indicators of microbial activity. In addition, the thinning effects of T60 were remarkably higher in Block III (i.e., BSR and MBC levels were comparable to those found in Blocks I and II), indicating its positive effects on microbial activity; T60 in Blocks I and II was very similar to T0, indicating that these experimental plots behaved similarly climatically. Some studies, such as Vinhal-Freitas et al. [69], highlighted the importance of texture, as heavy-textured soils have higher levels of microbial activity and carbon content than light-textured soils within the same soil class, achieving significantly higher levels of BSR and MBC; in agreement with our results. Das et al. [83] analysed data from all publications between 1989 and 2022 and showed that (1) MBC was positively correlated with high temperatures and negatively correlated with high soil humidity, and (2) MBC was positively correlated with levels of SOC and BSR; also in agreement with our results by multivariate analysis. Wang et al. [84] also reported that reduced soil moisture and microbial biomass C were the main regulators of the decrease in soil respiration. Our results showed a high Spearman’s correlation between WSOC, SOC, and BSR, with the component having higher inertia over soil temperature, and a high correlation was also found between WHC and BSR (although we did not observe a clear correlation between soil moisture and precipitation with BSR). In fact, the effect of forest thinning on soil respiration is the consequence of a combination of reduced root respiration, increased soil organic matter, and fluctuations in soil temperature and moisture caused by both thinning and interannual climate variability [85,86,87].
Enzymes are classically used as quality indicators of soil microbial activity [63,88,89,90]. In this study, the levels of three extracellular enzymes (i.e., β-glucosidase, urease, and phosphatase) and another intracellular (i.e., dehydrogenase) were measured. Exocellular hydrolytic enzymes decompose organic matter and release nutrients into the soil solution, where they can be used by microorganisms and plant growth [69]. These extracellular activities are highly dependent on temperature, humidity, pH, substrate availability, and the chemical characteristics of the surface layer [91,92]. In fact, as a result, β-glucosidase was positively correlated with soil moisture (r = 0.62) and negatively correlated with temperature (r = −0.63) in Block I, and positively correlated with precipitation (r = 0.73) in Block II. β-glucosidase is produced by microbial communities for cellulose degradation, converting oligosaccharides to glucose [93]. Anaerobic fungi have very strong cellulolytic activity and are, therefore, efficient cellulose degraders [94]. This may explain the high levels of this enzyme at high soil moisture (i.e., less O2 available for aerobic microorganisms). This enzyme is also produced by thermophilic microorganisms, which explains the lower dependence on soil temperature [95]. The lower levels found in Block III are explained by the poorer soil quality, which causes a decrease in the diversity and abundance of microorganisms [63]. In fact, all the enzymes studied were significantly Spearman’s positively correlated with clay and negatively correlated with sand. Although T60 in Block III showed higher levels of β-glucosidase, the changes observed in this enzyme could not be entirely explained by the influence of thinning (i.e., this was also applicable to the other three enzymes). Soil microorganisms and plants secrete extracellular enzymes (i.e., phosphatases) to break down organic P in soils into readily available Pi [96]. Acid-phosphatase did not correlate well with the climatic parameters analysed. This could be explained by the fact that soil microorganisms mainly produce alkaline phosphatases, whereas acid phosphatases are mainly found in the rhizosphere (i.e., as root exudates) [97]; and our sampling was not focused only on the rhizosphere soil. In addition, due to the limited bioavailable P in soils, soil microorganisms often experience P starvation conditions as their metabolism is limited [81]. These factors explain why the levels in the three blocks were comparatively of the same order (except T0 in Block III, with about 1.3 to 1.4-fold significantly lower levels). Urease is produced by microorganisms to degrade urea (i.e., releasing NH3 and CO2) [45]. Our results showed that urease was significantly correlated with soil temperature in Block II, but seasonal differences were not constant. By treatment, the seasonal pattern of urease was very close to that of β-glucosidase; this is in agreement with the results obtained by Vinhal-freitas et al. [69], who demonstrated the existence of a high correlation with soil texture, although not always a significant correlation was found [98]. Urease activity was also positively correlated with SOC, N, and soil moisture [99,100]; we agree for SOC (i.e., this may partly explain the higher results for T60 in Block III). Dehydrogenase is suggested as a more reliable sign of microbial activity because it is located at the intracellular level in microorganisms [101]. In the soil environment, this enzyme can be significantly affected by a number of environmental factors, including soil moisture, oxygen availability, oxidation-reduction potential, pH, organic matter content, depth of soil profile, temperature, season, heavy metal contamination and soil fertilizer or pesticide use [102]. As a result, significant seasonal differences were found with respect to the first summer (as indicated hotter and drier) with lower values; in fact, in Block I, dehydrogenase activity has more inertia over the axis correlated with higher soil humidities and precipitation. Despite the variability in the results found, the levels with T60 in Block III were significant (i.e., about 1.4 to 1.6-fold higher than T0 and T100), explained by the beneficial long-term effects of thinning, which increases the organic residues and consequently the supply of organic matter to the soil. Discrepancies found between seasons could be due to the fact that the levels of dehydrogenase analysed in the soil do not always correlate with microbial activity [103]. Nannipieri et al. [36] explain that catalytic enzymes of biological origin which are no longer regulated or associated with living cells can be immobilised on clay minerals, humic substances, or organo-mineral complexes but remain inactive. Also, a significant proportion of the activity could be attributed to enzymes in the soil matrix that have certainly been present for many years. Nevertheless, our results showed correlation between all the enzymes studied and most of the soil parameters analysed, with the exception of sand content, confirming the close connection between soil properties and the activity of microbial organisms.

5. Conclusions

The microbial and enzymatic quality indicators studied revealed that the effects of long-term thinning showed variable results depending on soil characteristics and climate. The values of water-holding capacity and soil organic carbon in its different forms were higher in the more clayey soils. In fact, sand content was negatively correlated with all the parameters analysed. Therefore, poorer soils have a reduced retention of organic matter, high leaching, and a limited holding capacity of different chemical forms. All microbiological and enzymatic parameters were correlated, indicating that soil properties, climate, thinning intensity, or a combination of these factors influenced them to varying degrees. In fact, although high correlations were found, it is difficult or impossible to determine the extent to which each of these variables influenced the other. The most striking finding is that moderate thinning had a significant positive long-term effect on soil parameters, with greater differences in poorer soils. The climate was a determining variable based on its seasonality, but its influence was not always well correlated with soil parameters, although it was undoubtedly crucial in the seasonal shifts of each variable as deduced from the multivariate analysis, which was primarily conditioned by water availability. Despite the discrepancy of the existing results in the literature, we conclude that thinning is an invasive technique that, in the short term, generally leads to deterioration of the microbiological and enzymatic activity of the soil, requiring a more or less long period of resilience for its recovery; and that in the long term, at moderate levels, it can be beneficial by favouring soil properties in the Mediterranean region. By promoting microbial activity, moderate thinning is a tool that, when utilised properly in forest management programs, can enhance the nutrients and resources available to plants, assisting vegetation restoration and high-quality forestry.

Author Contributions

Conceptualization, C.L., I.B., A.L. and R.G.-O.; methodology, C.L.; formal analysis, C.L., I.B., A.L. and R.G.-O. (data); investigation, C.L., I.B. and A.L.; resources, C.L. and R.G.-O.; writing—original draft preparation, C.L., I.B., A.L. and R.G.-O.; writing—review and editing, C.L., I.B., A.L. and R.G.-O.; supervision, C.L.; project administration, C.L.; funding acquisition, C.L. All authors have read and agreed to the published version of the manuscript.

Funding

This research was funded by Universitat Politècnica de València, project number PAID-06-08-3226, and the APC was funded by C.L. and R.G.-O.

Data Availability Statement

The data presented in this study are available upon request from the corresponding author.

Acknowledgments

Silvicultural treatments were carried out by the Mediterranean Centre for Environmental Studies (CEAM) through the program “R&D related to vegetation cover restoration and other aspects of forestry research”. We thank Joana Oliver and Inés María Lasala for their help in the laboratory work.

Conflicts of Interest

The authors declare no conflict of interest.

Appendix A

Table A1. Summary of two-way ANOVA for the soil water-holding capacity (WHC), soil organic carbon (SOC), water-soluble organic carbon (WSOC), and microbial soil parameters (basal soil respiration—BSR and microbial biomass carbon—MBC) tested in each block using treatment (T) or season (S) as factors and their interactions (T × S) in terms of F, df, and p-value.
Parameter 2 Factor/Interaction
Treatment (T)Season (S)T × S Residuals
BlockFdfp-Value 1Fdfp-Value 1Fdfp-Value 1df
WHC
(non-transformed)
I3.4320.0455 *2.1440.0999 ns0.6380.7430 ns30
II6.8220.0031 **3.8150.0072 **0.55100.8445 ns36
III44.012<0.0001 ***5.5250.0007 ***1.34100.2474 ns36
SOC
(LOG10-transformed)
I4.6320.0177 *5.6740.0016 **0.8380.5857 ns30
II3.0920.0576 ns0.8150.5512 ns0.62100.7905 ns36
III58.272<0.0001 ***1.5650.1974 ns0.95100.5007 ns36
WSOC
(SQRT-transformed)
I3.5720.0406 *20.304<0.0001 ***0.6380.7480 ns30
II6.0120.0056 **10.135<0.0001 ***1.1100.3875 ns36
III35.902<0.0001 ***7.2250.0001 ***2.3100.0328 *36
BSR
(LOG10-transformed)
I6.4920.0046 **7.4540.0003 ***1.2080.3337 ns30
II3.0120.0617 ns10.355<0.0001 ***1.34100.2479 ns36
III84.862<0.0001 ***3.8450.0068 **1.94100.0710 ns36
MBC
(SQRT-transformed)
I4.7920.0157 *25.024<0.0001 ***1.2180.3258 ns30
II6.6220.0036 **9.125<0.0001 ***0.53100.8594 ns36
III39.092<0.0001 ***3.9850.0056 **1.94100.0713 ns36
1 Level of significance: not significant (ns) or significant results at p ≤ 0.05 (*), 0.01 (**), or 0.001 (***). 2 LOG10 or SQRT transformations were used to meet normality and homoscedasticity requirements.
Table A2. Results of means and standard deviations (n = 3) for soil water-holding capacity (WHC), soil organic carbon (SOC), water-soluble organic carbon (WSOC), and soil microbial parameters (basal soil respiration—BSR and microbial biomass carbon—MBC) tested in each block. Different letters in a column (superscript letters) or row (normal letters) indicate the presence of significant statistical differences by one-way ANOVA followed by post-hoc Tukey-HSD means comparison with treatment (T) or season (S) as factors.
Parameter 2 TreatmentSpring 1stSummer 1stAutumn 1stSpring 2ndSummer 2ndAutumn 2ndS C.l. 1
WHCBlock IT032.62 ± 6.0138.41 ± 3.2536.64 ± 2.8234.84 ± 1.7834.48 ± 4.89 abns
T6033.03 ± 4.1135.16 ± 4.8434.87 ± 2.6433.40 ± 0.7336.95 ± 0.96 bns
T10030.07 ± 0.7133.94 ± 3.4234.97 ± 1.1932.73 ± 2.6830.45 ± 2.43 ans
T C.l. 1nsnsnsns*
Block IIT038.13 ± 5.95 ab b27.78 ± 3.82 ab a28.13 ± 2.3 ab32.11 ± 8.24 ab30.96 ± 1.71 ab ab37.36 ± 4.37 b*
T6032.17 ± 6.88 a b25.44 ± 0.21 a a33.84 ± 2.14 ab30.56 ± 3.07 ab29.49 ± 8.89 a ab33.31 ± 4.34 b*
T10040.83 ± 3.82 b b31.76 ± 7.99 b a35.28 ± 2.98 ab35.88 ± 3.09 ab37.15 ± 5.21 b ab39.01 ± 2.28 b*
T C.l. 1**nsns*ns
Block IIIT013.08 ± 5.2310.63 ± 4.37 a16.6 ± 1.97 a12.79 ± 4.27 a11.92 ± 1.67 a13.06 ± 0.86 ans
T6026.69 ± 6.49 b20.10 ± 2.82 b ab28.8 ± 1.98 b ab24.34 ± 3.02 b ab18.06 ± 3.07 b a27.25 ± 2.31 b ab**
T10015.32 ± 2.9518.09 ± 4.02 ab19.2 ± 5.17 a19.7 ± 2.2 ab9.24 ± 2.91 a16.5 ± 5.3 ans
T C.l. 1ns***************
SOCBlock IT064.5 ± 14.44 a96.68 ± 19.93 b65.46 ± 6.48 ab62.00 ± 12.73 a66.76 ± 29.22 ab ab**
T6060.62 ± 15.05 ab82.11 ± 19.3 b63.58 ± 6.94 ab57.7 ± 4.8 a82.39 ± 15.63 b ab**
T10045.26 ± 0.96 a79.47 ± 20.24 b62.47 ± 7.99 ab49.50 ± 13.35 ab49.36 ± 3.13 a ab***
T C.l. 1nsns nsns*
Block IIT055.78 ± 15.0959.40 ± 9.8941.47 ± 6.153.77 ± 13.1644.06 ± 7.5261.19 ± 14.47ns
T6045.81 ± 17.9949.14 ± 3.9255.91 ± 13.3760.09 ± 2.1843.96 ± 6.6855.02 ± 16.96ns
T10054.71 ± 5.4375.70 ± 16.5959.87 ± 11.6746.77 ± 14.3757.98 ± 10.8261.54 ± 31.59ns
T C.l. 1nsnsnsnsnsns
Block IIIT012.85 ± 3.97 a9.97 ± 2.27 a10.09 ± 0.33 a12.50 ± 3.43 a12.41 ± 1.46 a13.56 ± 2.67 ans
T6047.48 ± 24.81 b33.03 ± 6.94 b40.08 ± 6.74 b46.34 ± 20.55 b24.66 ± 2.4 b52.03 ± 15.78 bns
T10021.08 ± 6.26 a22.36 ± 2.24 a15.8 ± 8.56 a19.41 ± 2.98 a13.40 ± 4.92 a18.77 ± 12.36 ans
T C.l. 1******************
WSOCBlock IT0223.10 ± 51.14 a532.31 ± 108.81 b167.48 ± 20.66 a304.87 ± 97.15 ab160.15 ± 93.82 a***
T60211.35 ± 64.51 a465.69 ± 197.45 b125.13 ± 20.07 a239.78 ± 57.8 ab228.55 ± 96.5 a***
T100180.38 ± 19.23 a374.07 ± 111.7 b119.29 ± 52.55 a232.86 ± 66.97 ab100.69 ± 13.06 a***
T C.l. 1nsns nsnsns
Block IIT0180.71 ± 32.63 ab222.78 ± 26.14 a b112.93 ± 24.61 a136.89 ± 80.27 a144.77 ± 39.93 ab174.40 ± 51.14 ab***
T60255.93 ± 97.78 a234.59 ± 65.95 ab a157.61 ± 48.98 ab101.20 ± 20.67 a208.13 ± 59.6 ab188.65 ± 37.96 ab***
T100269.83 ± 12.28 bc361.18 ± 72.92c c155.47 ± 30.51 ab147.06 ± 25.58 a246.20 ± 54.67 abc163.72 ± 50.04 ab***
T C.l. 1ns*nsnsnsns
Block IIIT074.66 ± 22.83 a66.98 ± 19.74 a85.57 ± 2.59 a142.50 ± 40.3 a120.2 ± 33.93 ab70.61 ± 11.5 ans
T60172.41 ± 93.18 b a175.58 ± 57.99 b ab163.94 ± 9.71 b a254.00 ± 54.53 b b151.23 ± 6.71 b ab150.59 ± 25.79 b a**
T10051.6 ± 10.23 a a160.94 ± 31.93 ab ab58.12 ± 20.55 a a140.34 ± 45.3 a b75.33 ± 39.71 a ab69.82 ± 12.82 a a*
T C.l. 1******************
BSRBlock IT026.48 ± 3.64 ab a46.15 ± 9.19 ab b35.97 ± 3.67 ab ab32.75 ± 2.39 ab ab31.62 ± 13.06 ab ab***
T6029.33 ± 5.23 b a51.97 ± 19.32 b b29.97 ± 4.73 b ab27.6 ± 6.6 b ab41.90 ± 13.19 b ab***
T10024.47 ± 2.71 a a37.51 ± 8.13 a b28.71 ± 0.67 a ab23.61 ± 1.56 a a21.27 ± 3.03 a ab***
T C.l. 1*** ***
Block IIT025.96 ± 5.9 ab25.18 ± 1.09 ab18.13 ± 1.98 a25.14 ± 10.29 ab19.36 ± 1.31 a39.14 ± 9.2 b***
T6023.19 ± 7.79 ab24.1 ± 2.09 ab27.97 ± 7.72 a24.35 ± 3.45 ab16.99 ± 2.18 a41.07 ± 12.07 b***
T10027.22 ± 0.43 a37.71 ± 11.84 ab25.44 ± 5.75 a31.14 ± 3.08 ab20.09 ± 1.69 a36.93 ± 4.39 b***
T C.l. 1nsnsnsnsnsns
Block IIIT04.89 ± 1.61 a8.15 ± 1.61 a7 ± 0.67 a8.33 ± 2.87 a5.25 ± 0.82 a6.38 ± 1.05 ans
T6031.34 ± 16.08 b22.41 ± 3.11c31.2 ± 2.49 b24.71 ± 8.87 b16.34 ± 3.52 b35.73 ± 9.36 bns
T1007.16 ± 2.14 a19.64 ± 5.78 b10.4 ± 3.99 a13.89 ± 6.6 a8.28 ± 4.63 a8.93 ± 2.93 ans
T C.l. 1******************
MBCBlock IT0630.28 ± 51.81 a434.05 ± 35.38 a572.92 ± 126.66 a398.88 ± 51.05 a232.75 ± 43.27 a b***
T60648.47 ± 219.19 b491.88 ± 183.09 ab768.48 ± 60.94 b492.76 ± 43.26 ab387.13 ± 31.45 b a***
T100615.33 ± 67.42 b520.47 ± 70.74 b660.39 ± 103.37 b563.75 ± 130.52 b242.11 ± 16.74 ab a***
T C.l. 1nsns nsns*
Block IIT0483.1 ± 156.35 ab617.93 ± 126.75 b467.19 ± 103.6 b493.33 ± 255.47 ab239.77 ± 32.87 a447.04 ± 243.39 ab***
T60373.8 ± 84.87 ab526.97 ± 34.12 b641.98 ± 246.54 b456.88 ± 96.39 ab218.6 ± 85.57 a562.05 ± 76.75 b***
T100552.98 ± 83.29 ab834.96 ± 323.17 b708.25 ± 146.35 b681.87 ± 130.21 b292.13 ± 121.8 a673.81 ± 134.62 b***
T C.l. 1nsnsnsnsnsns
Block IIIT0148.14 ± 51.6 a110.53 ± 38.48 a262.51 ± 45.06 a177.9 ± 70.64 a140.06 ± 35.54 a133.85 ± 38.26 ans
T60755.95 ± 423.05 b b327.49 ± 91.74 b ab682.26 ± 121.05 b b416.36 ± 141.23 b ab314.49 ± 86.94 b a508.77 ± 30.26 b ab*
T100339.86 ± 105.64 a378.95 ± 131.84 ab272.9 ± 144.47 a274.42 ± 78.01 ab148.33 ± 79.51 ab209.23 ± 102.90 ans
T C.l. 1******************
1 Confidence level: ns, *, **, and *** correspond to not significant or significant results at p ≤ 0.05, 0.01 or 0.001, respectively. 2 LOG10 (SOC and BSR) or SQRT (WSOC and MBC) transformations were used to meet normality and homoscedasticity requirements.
Table A3. Summary of two-way ANOVA for the soil enzymatic parameters (β-glucosidase, acid phosphatase, urease, and dehydrogenase) tested in each block with treatment (T) or season (S) as factors and their interactions (T × S) in terms of F, df, and p-value.
Parameter 2 Factor/Interaction
Treatment (T)Season (S)T × S Residuals
BlockFdfp-Value 1Fdfp-Value 1Fdfp-Value 1df
β-glucosidase
(SQRT-transformed)
I2.4720.1012 ns29.054<0.0001 ***1.3480.2626 ns30
II3.1720.0539 ns6.2150.0003 ***0.76100.6632 ns36
III13.482<0.0001 ***4.8450.0017 **0.87100.5689 ns36
Acid phosphatase
(SQR- transformed)
I1.7020.1998 ns6.8040.0005 ***0.6780.7101 ns30
II7.8820.0014 **5.0350.0014 **0.38100.9472 ns36
III14.032<0.0001 ***5.9250.0004 ***1.36100.2358 ns36
Urease
(non-transformed)
I0.2220.8025 ns3.1240.0293 *2.2980.0477 *30
II8.2920.0011 **3.4250.0125 *1.48100.1864 ns36
III5.6920.0071 **8.155<0.0001 ***0.97100.4853 ns36
Dehydrogenase
(SQRT-transformed)
I1.4720.2463 ns92.054<0.0001 ***1.1180.3841 ns30
II4.6020.0167 *6.3850.0002 ***0.54100.8491 ns36
III32.042<0.0001 ***8.45<0.0001 ***0.74100.6847 ns36
1 Level of significance: ns, *, **, and *** correspond to not significant or significant results at p ≤ 0.05, 0.01, or 0.001, respectively. 2 LOG10 or SQRT transformations were used to meet normality and homoscedasticity requirements.
Table A4. Results of means and standard deviations (n = 3) for the soil enzymatic parameters (β-glucosidase, acid phosphatase, urease, and dehydrogenase) tested in each block. Different letters in a column (superscript letters) or a row (normal letters) indicate the presence of significant statistical differences by one-way ANOVA followed by post-hoc Tukey-HSD means comparison with treatment (T) or season (S) as factors.
Parameter 2 TreatmentSpring 1stSummer 1stAutumn 1stSpring 2ndSummer 2ndAutumn 2ndS C.l. 1
β-GlucosidaseBlock IT00.78 ± 0.228 a1.26 ± 0.23 b1.6 ± 0.27 bc1.28 ± 0.35 bc2.16 ± 0.13 c***
T600.75 ± 0.282 a1.28 ± 0.47 ab1.92 ± 0.2 bc1.9 ± 0.27 bc2.14 ± 0.30 c***
T1000.71 ± 0.040 a1.49 ± 0.25 b2.34 ± 0.82 b1.96 ± 0.26 b1.96 ± 0.22 b***
T C.l. 1nsns nsnsns
Block IIT01.23 ± 0.35 ab0.86 ± 0.38 ab0.85 ± 0.35 a1.42 ± 0.68 ab1.11 ± 0.40 ab2.10 ± 0.89 b***
T600.95 ± 0.43 ab0.96 ± 0.27 a1.02 ± 0.36 a1.73 ± 0.52 b1.51 ± 0.18 ab1.40 ± 0.69 b**
T1001.27 ± 0.15 ab1.25 ± 0.27 ab0.94 ± 0.16 a2.05 ± 0.12 ab1.87 ± 0.87 ab2.14 ± 0.35 b***
T C.l. 1nsnsnsnsnsns
Block IIIT00.53 ± 0.17 a ab0.25 ± 0.18 a a0.49 ± 0.09 a ab0.44 ± 0.12 a ab0.67 ± 0.11 a ab0.56 ± 0.11 a b**
T600.94 ± 0.4 b ab0.49 ± 0.15 b a0.99 ± 0.43 b ab0.95 ± 0.36 b ab0.91 ± 0.13 b b1.28 ± 0.09 b b**
T1000.67 ± 0.1 ab0.52 ± 0.3 ab0.44 ± 0.17 ab0.79 ± 0.06 ab0.75 ± 0.26 ab0.76 ± 0.39 abns
T C.l. 1***********
PhosphataseBlock IT02.5 ± 0.5 a3.62 ± 0.63 ab2.858 ± 0.31 ab3.545 ± 0.85 ab3.89 ± 1.44 b**
T602.19 ± 0.6 a3.97 ± 1.64 ab2.535 ± 0.21 ab2.981 ± 0.41 ab4.70 ± 0.64 b***
T1002.26 ± 0.42 a3.67 ± 1.20 b2.487 ± 0.07 ab2.490 ± 0.56 ab3.14 ± 0.60 b**
T C.l. 1nsns nsnsns
Block IIT01.73 ± 0.62 a ab2.37 ± 0.84 a ab1.16 ± 0.41 a a1.86 ± 1.17 a a2.31 ± 1.37 a ab3.37 ± 1.25 b**
T602.43 ± 0.77 ab ab2.59 ± 0.39 ab ab2.22 ± 0.12 ab a1.65 ± 0.49 ab a2.48 ± 0.58 ab ab3.42 ± 1.84 b*
T1003.02 ± 0.24 b ab3.61 ± 0.42 b ab2.14 ± 0.52 b a2.52 ± 0.46 b a3.61 ± 0.58 b ab4.15 ± 1.06 b**
T C.l. 1*****ns
Block IIIT02.17 ± 0.26 a b0.69 ± 0.15 a a1.6 ± 0.6 a ab1.57 ± 0.74 a ab1.46 ± 0.47 a ab2.17 ± 0.7 a ab***
T604.05 ± 1.74 b b2.02 ± 0.74 b a2.45 ± 0.6 b ab2.58 ± 0.75 b ab2.13 ± 0.16 ab ab3.7 ± 0.53 b ab**
T1003.48 ± 0.37 ab2.98 ± 0.81 ab1.93 ± 1.42 ab2.09 ± 0.36 ab2.55 ± 0.98 b2.89 ± 0.28 abns
T C.l. 1**********
UreaseBlock IT05.04 ± 0.855.6 ± 1.564.75 ± 0.824.3 ± 1.635.76 ± 0.69ns
T603.33 ± 1.02 a6.29 ± 1.93 ab4.12 ± 0.97 ab3.59 ± 1.07 ab7.51 ± 2 b**
T1004.74 ± 0.595.62 ± 0.814.96 ± 0.646.31 ± 2.294.75 ± 0.33ns
T C.l. 1nsns nsnsns
Block IIT03.85 ± 0.7 ab4.82 ± 1.19 b3.18 ± 1.46 a ab4.14 ± 1.77 a ab3.11 ± 1.24 a ab1.93 ± 1.18 a*
T604.05 ± 1.313.86 ± 0.225.58 ± 2.72 ab3.71 ± 0.97 a3.98 ± 1.66 ab3.74 ± 1.34ns
T1004.75 ± 0.47 ab5.96 ± 1.78 b5.63 ± 0.94 b ab6.39 ± 0.69 b b6.4 ± 0.3 b ab2.52 ± 1.3 a**
T C.l. 1nsns****ns
Block IIIT04.01 ± 0.38 a b3.11 ± 1.06 ab1.08 ± 0.38 a2.05 ± 1.06 ab1.47 ± 0.64 ab2.49 ± 0.99 a ab***
T606.59 ± 5.07 b c3.46 ± 0.89 abc1.17 ± 0.04 a4.07 ± 1.27 abc2.57 ± 0.45 ab6.45 ± 0.83 b bc***
T1004.89 ± 1.08 ab b4.12 ± 1.69 ab1.29 ± 1.15 a2.64 ± 1.23 ab0.99 ± 0.42 a2.87 ± 1.86 a ab***
T C.l. 1*nsnsnsns*
DehydrogenaseBlock IT00.09 ± 0.02 a0.16 ± 0.07 b0.41 ± 0.1 c0.4 ± 0.01 c0.23 ± 0.04 b***
T600.08 ± 0.01 a0.23 ± 0.05 b0.46 ± 0.05 d0.35 ± 0.05 cd0.3 ± 0.03 bc***
T1000.08 ± 0.03 a0.21 ± 0.06 b0.45 ± 0.03 d0.41 ± 0.05 cd0.29 ± 0.02 bc***
T C.l. 1nsns nsnsns
Block IIT00.32 ± 0.11 ab0.16 ± 0.07 a0.34 ± 0.1 b0.33 ± 0.14 b0.33 ± 0.08 ab0.27 ± 0.08 ab**
T600.35 ± 0.14 ab0.16 ± 0.06 a0.51 ± 0.13 b0.32 ± 0.05 ab0.27 ± 0.01 ab0.22 ± 0.13 ab***
T1000.44 ± 0.18 ab0.26 ± 0.17 a0.44 ± 0.04 b0.48 ± 0.12 ab0.4 ± 0.14 ab0.34 ± 0.02 ab***
T C.l. 1nsnsnsnsnsns
Block IIIT00.15 ± 0.04 a ab0.08 ± 0.002 a a0.21 ± 0.02 a b0.12 ± 0.06 a ab0.17 ± 0.03 a ab0.11 ± 0.02 a ab**
T600.54 ± 0.3 b b0.18 ± 0.05 b a0.38 ± 0.09 b b0.29 ± 0.15 b ab0.35 ± 0.02 b ab0.27 ± 0.02 b ab***
T1000.25 ± 0.06 a ab0.12 ± 0.02 ab a0.29 ± 0.11 ab b0.15 ± 0.05 ab ab0.18 ± 0.05 ab ab0.15 ± 0.05 ab ab*
T C.l. 1******************
1 Confidence level: ns, *, **, and *** correspond to not significant or significant results at p ≤ 0.05, 0.01, or 0.001, respectively. 2 SQRT transformations (excluded urease) were used to meet normality and homoscedasticity requirements.

References

  1. Bonari, G.; Fernández-González, F.; Çoban, S.; Monteiro-Henriques, T.; Bergmeier, E.; Didukh, Y.P.; Xystrakis, F.; Angiolini, C.; Chytrý, K.; Acosta, A.T.R.; et al. Classification of the Mediterranean lowland to submontane pine forest vegetation. Appl. Veg. Sci. 2021, 24, e12544. [Google Scholar] [CrossRef]
  2. Quézel, P. Taxonomy and biogeography of Mediterranean pines (Pinus halepensis and P. brutia). In Ecology, Biogeography and Management of Pinus halepensis and P. brutia Forest Ecosystems in the Mediterranean Basin; G. Ne’eman, G., Trabaud, L., Eds.; Backhuys Publishers: Leiden, The Netherlands, 2000; pp. 1–12. [Google Scholar]
  3. de las Heras, J.; Moya, D.; Vega, J.A.; Daskalakou, E.; Vallejo, V.R.; Grigoriadis, N.; Tsitsoni, T.; Baeza, J.; Valdecantos, A.; Fernández, C.; et al. Post-fire management of serotinous pine forests. In Post-Fire Management and Restoration of Southern European Forests; Moreira, F., Arianoutsou, M., Corona, P., De las Heras, J., Eds.; Springer: Dordrecht, The Netherlands, 2012; pp. 121–150. [Google Scholar] [CrossRef]
  4. Maestre, F.T.; Cortina, J.; Bautista, S.; Bellot, J. Does Pinus halepensis facilitate the establishment of shrubs in Mediterranean semi-arid afforestations? For. Ecol. Manag. 2003, 176, 147–160. [Google Scholar] [CrossRef]
  5. Resco de Dios, V. What is a Mediterranean pine? Physiological trade-offs under stress and perturbation. In Pines and Their Mixed Forest Ecosystems in the Mediterranean Basin; Ne’eman, G., Osem, Y., Eds.; Springer International Publishing: Cham, Switzerland, 2021; pp. 103–115. [Google Scholar] [CrossRef]
  6. Rodríguez-García, E.; Santana, V.M.; Alloza, J.A.; Ramón Vallejo, V. Predicting natural hyperdense regeneration after wildfires in Pinus halepensis (Mill.) forests using prefire site factors, forest structure and fire severity. For. Ecol. Manag. 2022, 512, 120164. [Google Scholar] [CrossRef]
  7. Bueis, T.; Bravo, F.; Pando, V.; Turrión, M.-B. Site factors as predictors for Pinus halepensis Mill. productivity in Spanish plantations. Ann. For. Sci. 2017, 74, 6. [Google Scholar] [CrossRef]
  8. Maestre, F.T.; Cortina, J. Are Pinus halepensis plantations useful as a restoration tool in semiarid Mediterranean areas? For. Ecol. Manag. 2004, 198, 303–317. [Google Scholar] [CrossRef]
  9. Ruiz-Navarro, A.; Barberá, G.G.; Navarro-Cano, J.A.; Albaladejo, J.; Castillo, V.M. Soil dynamics in Pinus halepensis reforestation: Effect of microenvironments and previous land use. Geoderma 2009, 153, 353–361. [Google Scholar] [CrossRef]
  10. MITECO (Ministerio para la Transición Ecológica y el Reto Demográfico). Spanish Forest Strategy 2050. Available online: https://www.miteco.gob.es/es/biodiversidad/temas/politica-forestal/estrategiaforestalespanolahorizonte2050_tcm30-549806.pdf (accessed on 16 June 2023).
  11. Jiménez, M.N.; Spotswood, E.N.; Cañadas, E.M.; Navarro, F.B. Stand management to reduce fire risk promotes understorey plant diversity and biomass in a semi-arid Pinus halepensis plantation. Appl. Veg. Sci. 2015, 18, 467–480. [Google Scholar] [CrossRef]
  12. Ne’eman, G.; Goubitz, S.; Nathan, R. Reproductive traits of Pinus halepensis in the light of fire—A critical review. Plant Ecol. 2004, 171, 69–79. [Google Scholar] [CrossRef]
  13. Molina, A.J.; del Campo, A.D. The effects of experimental thinning on throughfall and stemflow: A contribution towards hydrology-oriented silviculture in Aleppo pine plantations. For. Ecol. Manag. 2012, 269, 206–213. [Google Scholar] [CrossRef]
  14. Bellot, J.; Maestre, F.T.; Chirino, E.; Hernández, N.; de Urbina, J.O. Afforestation with Pinus halepensis reduces native shrub performance in a Mediterranean semiarid area. Acta Oecol. 2004, 25, 7–15. [Google Scholar] [CrossRef]
  15. Hernandez-Tecles, E.; Osem, Y.; Alfaro Sánchez, R.; Heras, J. Vegetation structure of planted versus natural Aleppo pine stands along a climatic gradient in Spain. Ann. For. Sci. 2015, 72, 641–650. [Google Scholar] [CrossRef]
  16. Vilà-Cabrera, A.; Coll, L.; Martínez-Vilalta, J.; Retana, J. Forest management for adaptation to climate change in the Mediterranean basin: A synthesis of evidence. For. Ecol. Manag. 2018, 407, 16–22. [Google Scholar] [CrossRef]
  17. Olivar, J.; Bogino, S.; Rathgeber, C.; Bonnesoeur, V.; Bravo, F. Thinning has a positive effect on growth dynamics and growth–climate relationships in Aleppo pine (Pinus halepensis) trees of different crown classes. Ann. For. Sci. 2014, 71, 395–404. [Google Scholar] [CrossRef]
  18. Calev, A.; Zoref, C.; Tzukerman, M.; Moshe, Y.; Zangy, E.; Osem, Y. High-intensity thinning treatments in mature Pinus halepensis plantations experiencing prolonged drought. Eur. J. For. Res. 2016, 135, 551–563. [Google Scholar] [CrossRef]
  19. Nunes, A.; Oliveira, G.; Cabral, M.S.; Branquinho, C.; Correia, O. Beneficial effect of pine thinning in mixed plantations through changes in the understory functional composition. Ecol. Eng. 2014, 70, 387–396. [Google Scholar] [CrossRef]
  20. Navarro, F.B.; Romero-Freire, A.; Del Castillo, T.; Foronda, A.; Jiménez, M.N.; Ripoll, M.A.; Sánchez-Miranda, A.; Huntsinger, L.; Fernández-Ondoño, E. Effects of thinning on litterfall were found after years in a Pinus halepensis afforestation area at tree and stand levels. For. Ecol. Manag. 2013, 289, 354–362. [Google Scholar] [CrossRef]
  21. Lado-Monserrat, L.; Lidón, A.; Bautista, I. Erratum to: Litterfall, litter decomposition and associated nutrient fluxes in Pinus halepensis: Influence of tree removal intensity in a Mediterranean forest. Eur. J. For. Res. 2016, 135, 203–214. [Google Scholar] [CrossRef]
  22. Lemay, A.; Krause, C.; Achim, A. Comparison of wood density in roots and stems of black spruce before and after commercial thinning. For. Ecol. Manag. 2018, 408, 94–102. [Google Scholar] [CrossRef]
  23. FAO (Food and Agriculture Organization of the United Nations). Global Forest Resources Assessment 2020: Main Report; FAO: Rome, Italy, 2020. [Google Scholar] [CrossRef]
  24. Chen, X.; Chen, H.Y.H.; Chen, X.; Wang, J.; Chen, B.; Wang, D.; Guan, Q. Soil labile organic carbon and carbon-cycle enzyme activities under different thinning intensities in Chinese fir plantations. Appl. Soil Ecol. 2016, 107, 162–169. [Google Scholar] [CrossRef]
  25. Bautista, I.; Lado-Monserrat, L.; Lull, C.; Lidón, A. Mid-term effects of forest thinning on N mineralization in a semi-arid Aleppo pine forest. Forests 2021, 12, 1470. [Google Scholar] [CrossRef]
  26. Zhang, X.; Guan, D.; Li, W.; Sun, D.; Jin, C.; Yuan, F.; Wang, A.; Wu, J. The effects of forest thinning on soil carbon stocks and dynamics: A meta-analysis. For. Ecol. Manag. 2018, 429, 36–43. [Google Scholar] [CrossRef]
  27. Yang, L.; Wang, J.; Geng, Y.; Niu, S.; Tian, D.; Yan, T.; Liu, W.; Pan, J.; Zhao, X.; Zhang, C. Heavy thinning reduces soil organic carbon: Evidence from a 9-year thinning experiment in a pine plantation. Catena 2022, 211, 106013. [Google Scholar] [CrossRef]
  28. Erkan, N.; Güner, Ş.T.; Aydın, A.C. Thinning effects on stand growth, carbon stocks, and soil properties in Brutia pine plantations. Carbon Balance Manag. 2023, 18, 6. [Google Scholar] [CrossRef]
  29. Ma, J.; Kang, F.; Cheng, X.; Han, H. Moderate thinning increases soil organic carbon in Larix principis-rupprechtii (Pinaceae) plantations. Geoderma 2018, 329, 118–128. [Google Scholar] [CrossRef]
  30. Parton, W.J.; Schimel, D.S.; Cole, C.V.; Ojima, D.S. Analysis of factors controlling soil organic matter levels in Great Plains grasslands. Soil Sci. Soc. Am. J. 1987, 51, 1173–1179. [Google Scholar] [CrossRef]
  31. Zou, X.M.; Ruan, H.H.; Fu, Y.; Yang, X.D.; Sha, L.Q. Estimating soil labile organic carbon and potential turnover rates using a sequential fumigation–incubation procedure. Soil Biol. Biochem. 2005, 37, 1923–1928. [Google Scholar] [CrossRef]
  32. Shen, Y.; Cheng, R.; Xiao, W.; Yang, S.; Guo, Y.; Wang, N.; Zeng, L.; Lei, L.; Wang, X. Labile organic carbon pools and enzyme activities of Pinus massoniana plantation soil as affected by understory vegetation removal and thinning. Sci. Rep. 2018, 8, 573. [Google Scholar] [CrossRef] [PubMed]
  33. Molina, A.J.; Bautista, I.; Lull, C.; del Campo, A.; González-Sanchis, M.; Lidón, A. Effects of thinning intensity on forest floor and soil biochemical properties in an Aleppo pine plantation after 13 years: Quantity but also quality matters. Forests 2022, 13, 255. [Google Scholar] [CrossRef]
  34. Cheng, X.; Yu, M.; Wang, G. Effects of thinning on soil organic carbon fractions and soil properties in Cunninghamia lanceolata stands in Eastern China. Forests 2017, 8, 198. [Google Scholar] [CrossRef]
  35. Zhang, X.; Chen, L.; Wang, Y.; Jiang, P.; Hu, Y.; Ouyang, S.; Wu, H.; Lei, P.; Kuzyakov, Y.; Xiang, W. Plantations thinning: A meta-analysis of consequences for soil properties and microbial functions. Sci. Total Environ. 2023, 877, 162894. [Google Scholar] [CrossRef]
  36. Nannipieri, P.; Trasar-Cepeda, C.; Dick, R. Soil enzyme activity: A brief history and biochemistry as a basis for appropriate interpretations and meta-analysis. Biol. Fertil. Soils 2018, 54, 11–19. [Google Scholar] [CrossRef]
  37. Tabatabai, M.A. Soil enzymes. In Methods of Soil Analysis: Part 2 Microbiological and Biochemical Properties, 5.2; Weaver, R.W., Angle, S., Bottomley, P., Bezdicek, D., Smith, S., Tabatabai, A., Wollum, A., Eds.; SSSA Book Series; Soil Science Society of America, Inc.: Madison, WI, USA, 1994; pp. 775–833. [Google Scholar] [CrossRef]
  38. Egamberdieva, D.; Renella, G.; Wirth, S.; Islam, R. Enzyme activities in the rhizosphere of plants. In Soil Enzymology; Shukla, G., Varma, A., Eds.; Springer: Berlin/Heidelberg, Germany, 2011; pp. 149–166. [Google Scholar]
  39. Zuccarini, P.; Asensio, D.; Ogaya, R.; Sardans, J.; Peñuelas, J. Effects of seasonal and decadal warming on soil enzymatic activity in a P-deficient Mediterranean shrubland. Glob. Chang. Biol. 2020, 26, 3698–3714. [Google Scholar] [CrossRef]
  40. Fanin, N.; Mooshammer, M.; Sauvadet, M.; Meng, C.; Alvarez, G.; Bernard, L.; Bertrand, I.; Blagodatskaya, E.; Bon, L.; Fontaine, S.; et al. Soil enzymes in response to climate warming: Mechanisms and feedbacks. Funct. Ecol. 2022, 36, 1378–1395. [Google Scholar] [CrossRef]
  41. Wic Baena, C.; Andrés-Abellán, M.; Lucas-Borja, M.E.; Martínez-García, E.; García-Morote, F.A.; Rubio, E.; López-Serrano, F.R. Thinning and recovery effects on soil properties in two sites of a Mediterranean forest, in Cuenca Mountain (South-eastern of Spain). For. Ecol. Manag. 2013, 308, 223–230. [Google Scholar] [CrossRef]
  42. Hedo de Santiago, J.; Lucas-Borja, M.E.; Wic-Baena, C.; Andrés-Abellán, M.; de las Heras, J. Effects of thinning and induced drought on microbiological soil properties and plant species diversity at dry and semiarid locations. Land Degrad. Dev. 2016, 27, 1151–1162. [Google Scholar] [CrossRef]
  43. Trevors, J.T. Effect of substrate concentration, inorganic nitrogen, O2 concentration, temperature and pH on dehydrogenase activity in soil. Plant Soil 1984, 77, 285–293. [Google Scholar] [CrossRef]
  44. Zantua, M.I.; Bremner, J.M. Stability of urease in soils. Soil Biol. Biochem. 1977, 9, 135–140. [Google Scholar] [CrossRef]
  45. Cordero, I.; Snell, H.; Bardgett, R.D. High throughput method for measuring urease activity in soil. Soil Biol. Biochem. 2019, 134, 72–77. [Google Scholar] [CrossRef]
  46. Sardans, J.; Peñuelas, J.; Estiarte, M. Changes in soil enzymes related to C and N cycle and in soil C and N content under prolonged warming and drought in a Mediterranean shrubland. Appl. Soil Ecol. 2008, 39, 223–235. [Google Scholar] [CrossRef]
  47. GVA (Generalitat Valenciana). Mapa de suelos de la Comunidad Valenciana. Chelva (666); Proyecto LUCDEME (Icona), Centro de Investigaciones sobre Desertificación y Conselleria d’Agricultura i Mig Ambient: Valencia, Spain, 1995; (Original in Spanish). [Google Scholar]
  48. Clarke Topp, G.; Parkin, G.W.; Ferre, P.A. Soil water content. In Soil Sampling and Methods of Analysis, 2nd ed.; Carter, M.R., Gregorich, E.G., Eds.; CRC Press: Boca Raton, FL, USA, 2008; pp. 939–961. [Google Scholar]
  49. Sonmez, S.; Buyuktas, D.; Okturen, F.; Citak, S. Assessment of different soil to water ratios (1:1, 1:2.5, 1:5) in soil salinity studies. Geoderma 2008, 144, 361–369. [Google Scholar] [CrossRef]
  50. Sumner, M.E.; Miller, W.P. Cation exchange capacity and exchange coefficients. In Methods of Soil Analysis; Sparks, D.L., Page, A.L., Helmke, P.A., Loeppert, R.H., Soltanpour, P.N., Tabatabai, M.A., Johnston, C.T., Sumner, M.E., Eds.; SSSA Book Series: Madison, WI, USA, 1996; pp. 1201–1229. [Google Scholar] [CrossRef]
  51. Richards, L.A.; Fireman, M. Pressure-plate apparatus for measuring moisture sorption and transmission by soils. Soil Sci. 1943, 56, 395–404. [Google Scholar] [CrossRef]
  52. Walkley, A.; Black, I.A. An examination of the Degtjareff method for determining soil organic matter, and a proposed modification of the chromic acid titration method. Soil Sci. 1934, 37, 29–38. [Google Scholar] [CrossRef]
  53. Yakovchenko, V.; Sikora, L.J. Modified dichromate method for determining low concentrations of extractable organic carbon in soil. Commun. Soil Sci. Plant Anal. 1998, 29, 421–433. [Google Scholar] [CrossRef]
  54. Aoyama, M.; Nagumo, T. Effects of heavy metal accumulation in apple orchard soils on microbial biomass and microbial activities. Soil Sci. Plant Nutr. 1997, 43, 601–612. [Google Scholar] [CrossRef]
  55. Vance, E.D.; Brookes, P.C.; Jenkinson, D.S. An extraction method for measuring soil microbial biomass C. Soil Biol. Biochem. 1987, 19, 703–707. [Google Scholar] [CrossRef]
  56. Tabatabai, M.A.; Bremner, J.M. Use of p-nitrophenyl phosphate for assay of soil phosphatase activity. Soil Biol. Biochem. 1969, 1, 301–307. [Google Scholar] [CrossRef]
  57. Eivazi, F.; Tabatabai, M.A. Glucosidases and galactosidases in soils. Soil Biol. Biochem. 1988, 20, 601–606. [Google Scholar] [CrossRef]
  58. Nannipieri, P.; Ceccanti, B.; Cervelli, S.; Matarese, E. Extraction of phosphatase, urease, proteases, organic carbon, and nitrogen from soil. Soil Sci. Soc. Am. J. 1980, 44, 1011–1016. [Google Scholar] [CrossRef]
  59. Camiña, F.; Trasar-Cepeda, C.; Gil-Sotres, F.; Leirós, C. Measurement of dehydrogenase activity in acid soils rich in organic matter. Soil Biol. Biochem. 1998, 30, 1005–1011. [Google Scholar] [CrossRef]
  60. Torrent, J. Mediterranean soils. In Encyclopedia of Soils in the Environment; Hillel, D., Ed.; Elsevier: Oxford, UK, 2005; pp. 418–427. [Google Scholar]
  61. Manrique-Alba, À.; Beguería, S.; Molina, A.J.; González-Sanchis, M.; Tomàs-Burguera, M.; del Campo, A.D.; Colangelo, M.; Camarero, J.J. Long-term thinning effects on tree growth, drought response and water use efficiency at two Aleppo pine plantations in Spain. Sci. Total Environ. 2020, 728, 138536. [Google Scholar] [CrossRef]
  62. Sardans, J.; Peñuelas, J. Plant-soil interactions in Mediterranean forest and shrublands: Impacts of climatic change. Plant Soil 2013, 365, 1–33. [Google Scholar] [CrossRef]
  63. Maurya, S.; Abraham, J.S.; Somasundaram, S.; Toteja, R.; Gupta, R.; Makhija, S. Indicators for assessment of soil quality: A mini-review. Environ. Monit. Assess. 2020, 192, 604. [Google Scholar] [CrossRef] [PubMed]
  64. Bünemann, E.K.; Bongiorno, G.; Bai, Z.; Creamer, R.E.; De Deyn, G.; de Goede, R.; Fleskens, L.; Geissen, V.; Kuyper, T.W.; Mäder, P.; et al. Soil quality—A critical review. Soil Biol. Biochem. 2018, 120, 105–125. [Google Scholar] [CrossRef]
  65. Liu, Z.F.; Fu, B.J.; Liu, G.H.; Zhu, Y.G. Soil quality: Concept, indicators and its assessment. Acta Ecol. Sin. 2006, 26, 901–913. [Google Scholar]
  66. Thakur, P.; Paliyal, S.S.; Dev, P.; Datt, N. Methods and approaches—Soil quality indexing, minimum data set selection & interpretation—A critical review. Commun. Soil Sci. Plant Anal. 2022, 53, 1849–1864. [Google Scholar] [CrossRef]
  67. Castellano, M.J.; Lewis, D.B.; Kaye, J.P. Response of soil nitrogen retention to the interactive effects of soil texture, hydrology, and organic matter. J. Geophys. Res. Biogeosci. 2013, 118, 280–290. [Google Scholar] [CrossRef]
  68. Saxton, K.E.; Rawls, W.J. Soil water characteristic estimates by texture and organic matter for hydrologic solutions. Soil Sci. Soc. Am. J. 2006, 70, 1569–1578. [Google Scholar] [CrossRef]
  69. Vinhal-Freitas, I.C.; Corrêa, G.F.; Wendling, B.; Bobuľská, L.; Ferreira, A.S. Soil textural class plays a major role in evaluating the effects of land use on soil quality indicators. Ecol. Indic. 2017, 74, 182–190. [Google Scholar] [CrossRef]
  70. Hillel, D. Fundamentals of Soil Physics, 1st ed.; Academic Press, Inc.: London, UK, 1980; pp. 1–413. [Google Scholar]
  71. McKinley, D.; Rice, C.; Blair, J. Conversion of grassland to coniferous woodland has limited effects on soil nitrogen cycle processes. Soil Biol. Biochem. 2008, 40, 2627–2633. [Google Scholar] [CrossRef]
  72. Erdozain, M.; Bonet, J.A.; Martínez de Aragón, J.; de-Miguel, S. Forest thinning and climate interactions driving early-stage regeneration dynamics of maritime pine in Mediterranean areas. For. Ecol. Manag. 2023, 539, 121036. [Google Scholar] [CrossRef]
  73. Centenaro, G.; de Miguel, S.; Amouzgar, L.; Piñuela, Y.; Son, D.; Bonet, J.A.; de Aragón, J.M.; Dashevskaya, S.; Castaño, C.; Alday, J.G. Silvicultural management and altitude prevail on soil properties and fungal community in shaping understorey plant communities in a Mediterranean pine forest. Sci. Total Environ. 2023, 858, 159860. [Google Scholar] [CrossRef] [PubMed]
  74. Xue, W.; Zhang, W.; Chen, Y. Heavy thinning temporally reduced soil carbon storage by intensifying soil microbial phosphorus limitation. Plant Soil 2023, 484, 33–48. [Google Scholar] [CrossRef]
  75. Mayer, M.; Prescott, C.E.; Abaker, W.E.A.; Augusto, L.; Cécillon, L.; Ferreira, G.W.D.; James, J.; Jandl, R.; Katzensteiner, K.; Laclau, J.P.; et al. Influence of forest management activities on soil organic carbon stocks: A knowledge synthesis. For. Ecol. Manag. 2020, 466, 118127. [Google Scholar] [CrossRef]
  76. Bouyoucos, G.J. Effect of organic matter on the water-holding capacity and the wilting point of mineral soils. Soil Sci. 1939, 47, 377–384. [Google Scholar] [CrossRef]
  77. Lull, C.; Bautista, I.; Lidón, A.; del Campo, A.D.; González-Sanchis, M.; García-Prats, A. Temporal effects of thinning on soil organic carbon pools, basal respiration and enzyme activities in a Mediterranean Holm oak forest. For. Ecol. Manag. 2020, 464, 118088. [Google Scholar] [CrossRef]
  78. Zhang, Z.; Hao, M.; Yu, Q.; Dun, X.; Xu, J.; Gao, P. The effect of thinning intensity on the soil carbon pool mediated by soil microbial communities and necromass carbon in coastal zone protected forests. Sci. Total Environ. 2023, 881, 163492. [Google Scholar] [CrossRef] [PubMed]
  79. Achat, D.L.; Fortin, M.; Landmann, G.; Ringeval, B.; Augusto, L. Forest soil carbon is threatened by intensive biomass harvesting. Sci. Rep. 2015, 5, 15991. [Google Scholar] [CrossRef]
  80. Nave, L.E.; Vance, E.D.; Swanston, C.W.; Curtis, P.S. Harvest impacts on soil carbon storage in temperate forests. For. Ecol. Manag. 2010, 259, 857–866. [Google Scholar] [CrossRef]
  81. Richardson, A.E.; Simpson, R.J. Soil microorganisms mediating phosphorus availability. Plant Physiol. 2011, 156, 989–996. [Google Scholar] [CrossRef]
  82. Deng, L.; Peng, C.; Kim, D.G.; Li, J.; Liu, Y.; Hai, X.; Liu, Q.; Huang, C.; Shangguan, Z.; Kuzyakov, Y. Drought effects on soil carbon and nitrogen dynamics in global natural ecosystems. Earth Sci. Rev. 2021, 214, 103501. [Google Scholar] [CrossRef]
  83. Das, S.; Deb, S.; Sahoo, S.S.; Sahoo, U.K. Soil microbial biomass carbon stock and its relation with climatic and other environmental factors in forest ecosystems: A review. Acta Ecol. Sin. 2023; in press. [Google Scholar] [CrossRef]
  84. Wang, J.; Liu, H.; Hu, M.; Du, Y.; Liu, Y.; Lu, L.; Han, S. Effects of decreased precipitation and thinning on soil respiration in a temperate forest: A one-year field experiment in Central China. Catena 2023, 229, 107239. [Google Scholar] [CrossRef]
  85. Tang, J.; Qi, Y.; Xu, M.; Misson, L.; Goldstein, A.H. Forest thinning and soil respiration in a ponderosa pine plantation in the Sierra Nevada. Tree Physiol. 2005, 25, 57–66. [Google Scholar] [CrossRef] [PubMed]
  86. Concilio, A.; Chen, J.; Ma, S.; North, M. Precipitation drives interannual variation in summer soil respiration in a Mediterranean-climate, mixed-conifer forest. Clim. Change 2009, 92, 109–122. [Google Scholar] [CrossRef]
  87. Fernandez, I.; Álvarez-González, J.G.; Carrasco, B.; Ruíz-González, A.D.; Cabaneiro, A. Post-thinning soil organic matter evolution and soil CO2 effluxes in temperate radiata pine plantations: Impacts of moderate thinning regimes on the forest C cycle. Can. J. For. Res. 2012, 42, 1953–1964. [Google Scholar] [CrossRef]
  88. Gatica-Saavedra, P.; Aburto, F.; Rojas, P.; Echeverría, C. Soil health indicators for monitoring forest ecological restoration: A critical review. Restor. Ecol. 2023, 31, e13836. [Google Scholar] [CrossRef]
  89. Adetunji, A.T.; Lewu, F.B.; Mulidzi, R.; Ncube, B. The biological activities of β-glucosidase, phosphatase and urease as soil quality indicators: A review. J. Soil Sci. Plant Nutr. 2017, 17, 794–807. [Google Scholar] [CrossRef]
  90. Rao, M.A.; Scelza, R.; Acevedo, F.; Diez, M.C.; Gianfreda, L. Enzymes as useful tools for environmental purposes. Chemosphere 2014, 107, 145–162. [Google Scholar] [CrossRef]
  91. Sinsabaugh, R.L.; Moorhead, D.L. Resource allocation to extracellular enzyme production: A model for nitrogen and phosphorus control of litter decomposition. Soil Biol. Biochem. 1994, 26, 1305–1311. [Google Scholar] [CrossRef]
  92. Baldrian, P.; Šnajdr, J.; Merhautová, V.; Dobiášová, P.; Cajthaml, T.; Valášková, V. Responses of the extracellular enzyme activities in hardwood forest to soil temperature and seasonality and the potential effects of climate change. Soil Biol. Biochem. 2013, 56, 60–68. [Google Scholar] [CrossRef]
  93. Zang, X.; Liu, M.; Fan, Y.; Xu, J.; Xu, X.; Li, H. The structural and functional contributions of β-glucosidase-producing microbial communities to cellulose degradation in composting. Biotechnol. Biofuels 2018, 11, 51. [Google Scholar] [CrossRef] [PubMed]
  94. Harhangi, H.R.; Steenbakkers, P.J.M.; Akhmanova, A.; Jetten, M.S.M.; van der Drift, C.; Op den Camp, H.J.M. A highly expressed family 1 β-glucosidase with transglycosylation capacity from the anaerobic fungus Piromyces sp. E2. BBA-Gene Struct. Expr. 2002, 1574, 293–303. [Google Scholar] [CrossRef] [PubMed]
  95. Pei, J.; Pang, Q.; Zhao, L.; Fan, S.; Shi, H. Thermoanaerobacterium thermosaccharolyticum β-glucosidase: A glucose-tolerant enzyme with high specific activity for cellobiose. Biotechnol. Biofuels 2012, 5, 31. [Google Scholar] [CrossRef] [PubMed]
  96. Park, Y.; Solhtalab, M.; Thongsomboon, W.; Aristilde, L. Strategies of organic phosphorus recycling by soil bacteria: Acquisition, metabolism, and regulation. Environ. Microbiol. Rep. 2022, 14, 3–24. [Google Scholar] [CrossRef]
  97. Mndzebele, B.; Ncube, B.; Fessehazion, M.; Mabhaudhi, T.; Amoo, S.; Plooy, C.; Venter, S.; Modi, A. Effects of cowpea-amaranth intercropping and fertiliser application on soil phosphatase activities, available soil phosphorus, and crop growth response. Agronomy 2020, 10, 79. [Google Scholar] [CrossRef]
  98. Nourbakhsh, F.; Monreal, C.M. Effects of soil properties and trace metals on urease activities of calcareous soils. Biol. Fertil.Soils 2004, 40, 359–362. [Google Scholar] [CrossRef]
  99. Hossain, M.Z.; Karim, M.R.; Majumder, B.R.; Akter, F. Microbial and enzymatic activity as influenced by existing cropping pattern in the soils of Ganges floodplain. Plant Sci. Today 2019, 6, 309–314. [Google Scholar] [CrossRef]
  100. Adetunji, A.; Ncube, B.; Mulidzi, A.; Lewu, F. Potential use of soil enzymes as soil quality indicators in agriculture. In Frontiers in Soil and Environmental Microbiology, 1st ed.; Nayak, S.K., Mishra, B.B., Eds.; CRC Press: Boca Raton, FL, USA, 2020; Chapter 6. [Google Scholar] [CrossRef]
  101. Kumar, S. Soil dehydrogenase enzyme activity in natural and mine soil—A review. Middle East J. Sci. Res. 2013, 13, 898–906. [Google Scholar] [CrossRef]
  102. Wolińska, A.; Stępniewska, Z. Dehydrogenase activity in the soil environment. In Dehydrogenases; Canuto, R.S., Ed.; IntechOpen: Rijeka, Croatia, 2012; Chapter 8. [Google Scholar] [CrossRef]
  103. Skujiņš, J.J. Enzymes in soil. In Soil Biochemistry; McLaren, A.D., Peterson, G.H., Eds.; Marcel Dekker: New York, NY, USA, 1967; Volume 1, pp. 371–414. [Google Scholar]
Figure 1. (a) Location map of experimental Blocks I, II, and III. (bd) Photographs of 2009 of each of the treatments T0 (trees not thinned), T60 (60% thinning), and T100 (removal of all trees) belonging to Block III.
Forests 14 01674 g001
Figure 2. Climate conditions in the studied Block I (a), Block II (b), and Block III (c) for each treatment. Data correspond to monthly average records of temperatures (climate–Tair and soil at 5 cm depth), precipitation, and evapotranspiration (ETP). The arrows indicate the sampling dates for each season (spring, summer, and autumn of 2009 and 2010). Treatments: no tree thinning (T0), 60% thinning (T60), 100% thinning (T100).
Forests 14 01674 g002
Figure 3. (a) Cumulative bar graphs showing soil water-holding capacity (WHC) for each Block (I, II, and III), year-season (spring, summer, and autumn), and silvicultural treatment (T0—no trees thinning, T60—thinning at 60%, and T100—thinning at 100%). Results are shown as means ± standard deviations with three sample points for each combination of treatments per season (n = 3). For each block, two-way ANOVA global comparisons were made between treatments (including all seasons for each treatment) or between seasons (including all treatments for each season). Two-way ANOVA factors and interaction factors details (F, df, and p-value) are indicated in Table A1. Different letters between treatments (top letters) or seasons (side letters) indicate significant differences at p ≤ 0.05 (*), 0.01 (**), or 0.001 (***); not significant (ns). (b) Linear regression between WHC and the soil clay content of the three blocks and applied treatments (n = 9).
Forests 14 01674 g003
Figure 4. Cumulative bar graphs showing the quantification of the studied microbial parameters SOC (soil organic carbon) (a), WSOC (water-soluble organic carbon) (b), BSR (basal soil respiration) (c), and MBC (microbial biomass carbon) (d) for each Block (I, II, and III), year-season (spring, summer, and autumn), and silvicultural treatment (T0—no trees thinning, T60—thinning at 60%, and T100—thinning at 100%). Results are shown as means ± standard deviations with three sample points for each combination of treatments per season (n = 3). For each block, two-way ANOVA global comparisons were made between treatments (including all seasons for each treatment) or between seasons (including all treatments for each season). Two-way ANOVA factors and interaction factors details (F, df, and p-value) are indicated in Table A1. Different letters between treatments (top letters) or seasons (side letters) indicate significant differences at p ≤ 0.05 (*), 0.01 (**), or 0.001 (***); not significant (ns).
Forests 14 01674 g004
Figure 5. Cumulative bar graphs showing the quantification of the studied enzymatic parameters β-glucosidase (a), acid phosphatase (b), urease (c), and dehydrogenase (d) for each Block (I, II, and III), year-season (spring, summer, and autumn), and silvicultural treatment (T0—no trees thinning, T60—thinning at 60%, and T100—thinning at 100%). Results are shown as means ± standard deviations with three sample points for each combination of treatments per season (n = 3). For each block, two-way ANOVA global comparisons were made between treatments (including all seasons for each treatment) or between seasons (including all treatments for each season). Two-way ANOVA factors and interaction factors details (F, df, and p-value) are indicated in Table A3. Different letters between treatments (top letters) or seasons (side letters) indicate significant differences at p ≤ 0.05 (*), 0.01 (**), or 0.001 (***); not significant (ns).
Forests 14 01674 g005
Figure 6. Principal component analysis biplot correlations between soil microbial, enzymatic, and climatic parameters for each studied Block I (a), II (b), and III (c). Soil water-holding capacity (WHC), soil organic carbon (SOC), water-soluble organic carbon (WSOC), and soil microbial and enzymatic parameters (basal soil respiration (BSR), microbial biomass carbon (MBC), β-glucosidase (GLUC), acid phosphatase (PHOS), urease (UREA), dehydrogenase (DEHY)) are indicated in red. Soil climate parameters from the 15 days prior to each sampling are shown in black as average soil temperature at 5 cm depth (Temp), average soil humidity at 5 cm depth (Hum), and accumulated precipitation (Precip). Each square represents the correlation power for each combination of the season (P-spring, S-summer, A-autumn) and silvicultural treatment applied (T0-no trees thinning, T60-thinning at 60%, and T100-thinning at 100%). The highlighted areas correspond to high correlations found between the different treatments applied for each season (spring-green, summer-yellow, and autumn-blue). Data were analysed using the Spearman method on untransformed data.
Forests 14 01674 g006
Table 1. Soil chemical and physical properties for each block and treatment (T0—no trees thinning, T60—thinning with 60% Basal Area removed, and T100—thinning at 100% BA removed). Data are means and standard deviations of three samples taken in the summer of the first year of sampling.
pHCarbonatesEC 1:2.5 1CEC 1SandSiltClayTexture
(g kg−1)(dS m−1)(cmolc kg−1)(%)(%)(%)
Block IT07.77 ± 0.04 a10.06 ± 1.11 a0.62 ± 0.05 a46.39 ± 8.83 a17.84 ± 3.76 a41.16 ± 4.30 a41.00 ± 5.00 aSilty clay
T607.99 ± 0.23 a21.83 ± 14.68 ab0.59 ± 0.09 a43.35 ± 6.19 a19.35 ± 8.93 a38.98 ± 5.44 a41.67 ± 8.50 aClay
T1008.02 ± 0.12 a32.03 ± 7.18 b0.56 ± 0.07 a33.54 ± 3.36 a19.08 ± 8.89 a41.59 ± 7.05 a39.33 ± 9.45 aSilty clay loam
Block IIT08.14 ± 0.07 b45.63 ± 7.83 c0.54 ± 0.08 a34.44 ± 1.68 a30.64 ± 0.92 a36.10 ± 2.77 a33.27 ± 3.29 aClay loam
T607.88 ± 0.16 a5.15 ± 1.80 a0.64 ± 0.10 ab37.88 ± 5.08 a23.34 ± 5.58 a38.13 ± 8.20 a38.53 ± 6.93 aClay loam
T1008.01 ± 0.11 ab28.00 ± 5.39 b0.75 ± 0.11 b41.11 ± 5.61 a27.82 ± 5.61 a36.58 ± 1.39 a35.60 ± 5.72 aClay loam
Block IIIT07.25 ± 0.25 b0.55 ± 0.05 a0.28 ± 0.17 a19.63 ± 4.20 a79.84 ± 3.27 b9.82 ± 1.56 a10.33 ± 2.52 aSandy loam
T607.83 ± 0.15 c5.18 ± 1.35 b0.30 ± 0.03 a34.48 ± 3.34 b50.56 ± 4.18 a21.11 ± 1.06 b28.33 ± 5.13 bSandy clay loam
T1006.77 ± 0.13 a0.56 ± 0.10 a0.17 ± 0.02 a21.96 ± 1.45 a65.58 ± 8.78 a21.08 ± 5.65 b13.33 ± 6.11 aSandy loam
1 EC: electrical conductivity. CEC: cation exchange capacity. Different lower case letters indicate significant differences between the treatments in each block at p ≤ 0.05.
Table 2. Spearman’s correlation matrix of microbial, enzymatic, and soil properties analysed, including all Blocks (I, II, and III), seasons (spring, summer, and autumn), and silvicultural treatments applied (T0—no trees thinning, T60—thinning at 60%, and T100—thinning at 100%).
WHC
SOC0.86 **SOC
WSOC0.58 **0.68 **WSOC
BSR0.79 **0.85 **0.66 **BSR
MBC0.64 **0.67 **0.48 **0.72 **MBC
GLUC0.75 **0.72 **0.35 **0.63 **0.46 **GLUC
PHOS0.48 **0.57 **0.44 **0.56 **0.33 **0.54 **PHOS
UREA0.52 **0.64 **0.49 **0.53 **0.48 **0.50 **0.51 **UREA
DEHY0.55 **0.42 **ns0.38 **0.45 **0.63 **0.28 **0.33 **DEHY
pH0.59 **0.54 **0.36 **0.43 **0.47 **0.51 **ns0.31 **0.38 **pH
EC0.73 **0.67 **0.52 **0.58 **0.51 **0.57 **0.28 **0.45 **0.40 **0.52 **CE
CEC0.65 **0.68 **0.55 **0.66 **0.46 **0.49 **0.35 **0.39 **0.33 **0.23 *0.77 **CEC
SAND−0.70 **−0.73 **−0.52 **−0.64 **−0.48 **−0.61 **−0.35 **−0.50 **−0.27 **−0.46 **−0.73 **−0.75 **SAND
SILT0.69 **0.71 **0.50 **0.62 **0.49 **0.62 **0.34 **0.50 **0.28 **0.52 **0.70 **0.68 **−0.99 **SILT
CLAY0.71 **0.75 **0.53 **0.66 **0.49 **0.62 **0.36 **0.47 **0.28 **0.47 **0.73 **0.81 **−0.97 **0.95 **
Confidence level: ns, *, and ** correspond to not significant or significant results at p ≤ 0.01 or 0.001, respectively. Colour scale from red (1) to blue (−1). Abbreviations: Soil water-holding capacity (WHC), soil organic carbon (SOC), water-soluble organic carbon (WSOC), basal soil respiration (BSR), microbial biomass carbon (MBC), β-glucosidase (GLUC), acid phosphatase (PHOS), urease (UREA), dehydrogenase (DEHY), electrical conductivity (EC), cation exchange capacity (CEC).
Disclaimer/Publisher’s Note: The statements, opinions and data contained in all publications are solely those of the individual author(s) and contributor(s) and not of MDPI and/or the editor(s). MDPI and/or the editor(s) disclaim responsibility for any injury to people or property resulting from any ideas, methods, instructions or products referred to in the content.

