
Comparative Chloroplast Genomics Reveals a Unique Gene Inversion in Two Cordia Trees (Cordiaceae)

1
Department of Biology, College of Sciences, King Khalid University, Abha 61421, Saudi Arabia
2
Department of Biological Sciences, Faculty of Sciences, King Abdulaziz University, Jeddah 21589, Saudi Arabia
3
Department of Biological Sciences, Faculty of Applied Sciences, Umm Al-Qura University, Makkah 24382, Saudi Arabia
*
Author to whom correspondence should be addressed.
Forests 2023, 14(9), 1778; https://doi.org/10.3390/f14091778
Submission received: 27 July 2023
/
Revised: 29 August 2023
/
Accepted: 30 August 2023
/
Published: 31 August 2023
(This article belongs to the Special Issue Genetic Variation and Adaptation of Forest Trees to Environmental Changes)
Abstract
:Cordiaceae is a family comprising more than 400 species in the order Boraginales. The classification of this family has undergone changes over time, transitioning between family and subfamily status. In the present study, the complete chloroplast (cp) genomes of Cordia monoica and Cordia sinensis were sequenced, and their cp genomes were then characterized, analyzed, and compared to those of closely related taxa. The lengths of the cp genomes of C. monoica and C. sinensis were 151,813 bp and 152,050 bp, respectively. Both genomes consisted of 114 genes, divided into 4 ribosomal RNA genes, 30 transfer RNA genes, and 80 protein-coding genes. We observed a unique gene inversion in the trnM-rbcL region of both Cordia species. The long repeats analysis revealed that both species’ chloroplast genomes contained forward and palindromic repeats. The simple sequence repeats (SSRs) analysis detected 155 microsatellites in each genome, with the majority being mononucleotide repeats (A/T). Phylogenetic analysis based on maximum likelihood and Bayesian analyses confirmed two major clades in the order Boraginales: clade I comprised Boraginaceae, while clade II included Cordiaceae, Ehretiaceae, and Heliotropiaceae. This study expands our knowledge of the evolutionary relationships across the order Boraginales and offers useful genetic resources.
Keywords:
Cordia monoica; Cordia sinensis; Cordiaceae; Boraginales; plastomes; chloroplast; phylogenetic tree; inversion1. Introduction
Cordiaceae (Cordioideae) is a family within the flowering plant order Boraginales. The Cordiaceae family is split into two genera, Cordia and Varronia, and has over 400 species [1]. The species of the Cordiaceae family are shrubs or trees; the leaves are arranged in a spiral, simple and entire; the flowers are mostly 5-merous, actinomorphic; the petals are white; and the fruit is a drupe, thinly fleshy or dry and hard [2].
Initially, members of the Cordiaceae were included within the Boraginaceae family as subfamilies of the Cordioideae [3,4,5,6]. This taxonomic treatment is still recognized by the Angiosperm Phylogeny Group (APG) and some phylogenetic studies [7,8,9]. On the other hand, a number of phylogenetic studies have identified Cordiaceae as a distinct family in the order Boraginales [10,11,12,13]. Previous studies on the phylogenetic relationships of the Cordiaceae family have totally relied on a small number of nuclear DNA, chloroplast, and mitochondrial genes [14]. To date, only one member of the Cordiaceae family (Cordia dichotoma) has a chloroplast (cp) genome sequence that is available in GenBank.
Scientists have increasingly relied on genetic data as robust evidence for understanding the evolutionary relationships among different organisms. The plastome offers valuable genetic data for comparative studies of species diversification [15]. The chloroplast is a cell organelle inside plant cells and performs the photosynthesis process [16]. The cp genomes of flowering plants are extremely stable regarding the content, structure, and arrangement of genes [17]. In most angiosperms, the cp genome has circular and quadripartite structures. However, recent studies on chloroplast genomes have identified multibranched linear structures in some species of flowering plants [18]. The cp genome is characterized by two identical copies of the inverted repeat (IR) separated by a small single-copy region (SSC) and a large single-copy region (LSC) [19]. The significance of the plastome in plant science studies is evidenced by the existence of over 5998 stored plastomes in the National Center for Biotechnology Information (NCBI) [20]. Utilizing cp genomes, as opposed to a limited number of genes, can provide more accurate results with regard to evolutionary relationships, gene transfer, and cloning procedures [21].
The cp genome structure, gene number, and arrangement are conserved in angiosperms and normally have slow rates of nucleotide substitution [22,23]. However, numerous species of plants have sequence rearrangements in the chloroplast genomes [24,25,26,27]. A gene inversion in the LSC region is an example of these rearrangements [28,29]. Large inversions in cp genomes may be caused by intramolecular recombination [30,31]. The tRNA activity, or intragenomic recombination, in GC-rich regions is likely the cause of the inversion phenomenon [32,33,34]. Because they are rare, inversion events and gene relocations in chloroplast genomes are considered valuable for phylogenetic analysis [35].
In this study, the complete chloroplast (cp) genome of Cordia monoica and Cordia sinensis were sequenced to explore the phylogenetic relationships between Cordiaceae and other families within Boraginales. The authors have selected C. monoica and C. sinensis as representatives of the Cordiaceae family because their samples can be easily found and collected in the place of the study (Saudi Arabia), while the other genus (Varronia) in the Cordiaceae family is native to South America, and it was difficult to obtain samples from this genus to use in this study. The comparative analysis was carried out utilizing the plastome sequences of three Cordia taxa, along with eight taxa from three Boraginales families, and two outgroup taxa from Solanales and Gentianales. Comparing complete cp genomes offers the opportunity to observe sequence variation. Such comparisons also make it possible to explore the evolutionary molecular features related to structural rearrangement and clarify their genetic mechanisms. The ultimate purposes of this research were to (i) obtain complete plastome genomes of C. monoica and C. sinensis, (ii) analyze and identify the gene characteristics, GC content, gene inversions, codon use, IR junctions, RNA editing and sequence repeats, and (iii) shed light on the evolutionary relationships of Cordiaceae and other families in Boraginales.
2. Materials and Methods
2.1. Plant Specimens, DNA Extraction, and Sequencing
On 18 March 2021, plant samples of C. monoica (19°44′34.2″ N 41°27′34.9″ E) and C. sinensis (19°44′33.4″ N 41°27′33.3″ E) were collected from the Al-Baha region, Saudi Arabia.
Both species were identified using their morphological traits. C. monoica and C. sinensis A DNeasy Plant Mini Kit was used to extract DNA from the plant specimens. Qualified DNA samples were sent to BGI Genomics Company in Hong Kong for library construction and sequencing. The raw data were filtered using SOAPnuke v.2.1.7 software [36].
2.2. Assembly, Annotation, Codon Usage, and RNA Editing Sites
Genome assembly was carried out using NOVOPlasty 4.3.1 [37]. The C. dichotoma cp sequence (ON872368) was selected as a reference to assemble the C. monoica and C. sinensis cp sequences. The annotation and gene prediction were performed using GeSeq [38]. The circular chloroplast genomes were visualized using OGDRAW 1.3.1 [39]. The annotated plastome sequences were uploaded to GenBank and assigned accession numbers: C. monoica (OP793888) and C. sinensis (OP850801). MEGA v.11 [40] was employed to assess the codon usage. The PREPACT Tool [41] was utilized to determine the RNA editing sites in the cp sequences of C. monoica and C. sinensis using BLASTX mode analysis and a cutoff E-value of 0.8.
2.3. Repeat Analysis and Characterization of Substitution Rate
The REPuter program [42] was used to recognize the long repeats in C. monoica and C. sinensis. The minimal repeat sizes were set at 10 bp and the similarity among the repeat sequences was higher than 85%. The Microsatellite Identification Tool (MISA) [43] was used for identifying simple sequence repeats (SSRs) with the following parameters: 8, 5, 4, 3, 3, and 3, indicating microsatellite repeats. Geneious Prime v 2023.0.4 [44] was used to extract the coding sequences (CDS) from C. monoica and C. sinensis cp sequences, and then DNAsp v6.12.03 [45] was used to determine which genes are under selective pressure and to compute the synonymous (dS) and nonsynonymous (dN) substitution rates.
2.4. Divergence Sequences and IR Junctions Analyses
The mVISTA v.1 software [46] under Shuffle-LAGAN mode was used to compare and analyze the plastomes of C. dichotoma, C. monoica, and C. sinensis. The plastome of C. monoica was used as a reference. Then, the borders of the IR, LSC, and SSC junction positions among the Cordia plastome sequences were visualized using the IRscope v.1 software [47].
2.5. Phylogenetic Analysis
The Phylogenetic analysis was performed based on three Cordia plastome sequences (C. dichotoma, C. monoica, and C. sinensis), eight taxa representing three families (Boraginaceae, Ehretiaceae, and Heliotropiaceae) belonging to the order Boragianles, and two taxa belonging to the Solanales and Gentianales orders used as outgroups. All sequences were aligned using MAFFT v.7.520 software [48]. The phylogenetic trees were generated using two analyses: maximum likelihood (ML) using IQ-TREE v.2.2.2.6 [49] and Bayesian inference (BI) using MrBayes v.3.2.7 [50]. The ML analysis was conducted using 5000 ultra-fast bootstrap replicates, and Modelfinder [51] was utilized to determine the substitution model (TVM + F + I + G4). The BI analysis was performed with the following settings: 500,000 generations sampling and printing each 250 generations, and jModelTest [52] was utilized to determine the substitution model (GTR + G).
3. Results
3.1. Characteristics of C. monoica and C. sinensis
The plastomes were circular with a quadripartite structure, and their sizes ranged from 151,813 bp in C. monoica to 152,050 bp in C. sinensis (Table 1 and Figure 1). The plastomes of C. monoica and C. sinensis contain four regions: the SSC region (17,847 bp and 17,840 bp), the LSC region (83,812 bp and 84,124 bp), and two IR regions (25,077 bp and 25,043 bp), respectively (Table 1). The overall GC content is 38.16% in C. monoica and 38.17% in C. sinensis. The IR regions occupied most of the GC contents, ranging from 43.41% in C. monoica to 43.48% in C. sinensis. The SSC and LSC regions have GC contents of 36.23% and 32.49% in C. monoica and 36.23% and 32.49% in C. sinensis, respectively (Table 1).
The plastomes of C. monoica and C. sinensis showed unique structural changes, revealing an inversion in the trnM-rbcL region (Figure 1). These inversions or transpositions caused the gene rearrangements observed in the LSC region. The plastomes of C. monoica and C. sinensis comprised 134 genes. Table S1 displays the 114 unique genes that were found in both Cordia plastomes, which included 19 genes duplicated in IR regions, and rps12 gene was duplicated in IR regions as well as in the LSC region. Each genome included 4 rRNA genes, 30 tRNA genes, and 80 protein-coding genes. The SSC region comprised 1 tRNA gene and 12 protein-coding genes; the LSC region comprised 22 tRNA genes and 60 protein-coding genes; and the IR regions comprised 4 rRNA genes, 7 tRNA genes, and 8 protein-coding genes. In each genome, a total of 6 tRNA genes and 11 protein-coding genes comprised one intron, whereas one gene (ycf3) comprised two introns (Table S2). The trnK-UUU gene has the longest intron, with 2460 bp in C. monoica and 2463 bp in C. sinensis.
3.2. Codon Usage
The codon usage frequency in chloroplast genomes was computed based on the sequences of the tRNA and protein-coding genes. The involved sequence lengths were 80,250 bp in C. monoica and 79,779 bp in C. sinensis. Tables S3 and S4 show the relative synonymous codon usage of the genes in these plastomes. The analysis showed that the genes in the plastomes of C. monoica and C. sinensis were encoded by 26,750 and 26,593 codons, respectively. Codons coding for leucine were the most common, with 2699 (10.09%) in C. monoica and 3106 (11.68%) in C. sinensis, whereas coding for methionine was less frequent, with 484 (1.81%) in C. monoica, while the tryptophan with 494 (1.86%) was in C. sinensis (Figure 2). The analysis (Tables S3 and S4) also showed that 31/64 of the codons in each plastome had an RSCU value greater than 1(the majority ended with A/U), while 33/64 codons had an RSCU value less than 1 (the majority ended with C/G). Moreover, the majority of amino acids had a codon usage bias, with the exception of tryptophan and methionine, which had RSCU values equal to 1.
3.3. RNA Editing Sites
Using the PREPACT Tool, the C-to-U RNA editing sites in C. monoica and C. sinensis have been predicted. The analysis identified 33 RNA editing sites in C. monoica and 32 RNA editing sites in C. sinensis. In both genomes, the ndhB gene possessed the highest number of editing sites with eight sites, followed by ndhD with six editing sites in C. monoica and five editing sites in C. sinensis. The rest of the genes ranged from three to one editing sites (atpA, atpF, rps2, rpoC2, rpoB, rps14, petB, psbL, rpl23, rpoA, ndhA, and ndhF) (Figure 3 and Table S5). In C. monoica and C. sinensis, 93.93% and 93.75% of the editing sites were present in the next nucleotide of the codon, respectively, and 6.07% and 6.25% of the editing sites were present in the start nucleotide of the codon. The result also revealed that most amino acid conversions were from serine to leucine, proline to leucine, and serine to phenylalanine (Table S5).
3.4. Long Repeats
The long repeat sequences of C. monoica and C. sinensis plastomes were detected by the REPuter program. Only forward and palindromic repeats were recognized in C. monoica and C. sinensis as follows: 28 and 27 forward repeats and 21 and 22 palindromic repeats, respectively (Figure 4, Tables S6 and S7). In total, both chloroplast genomes contained 49 repeats. Most of the repeat sizes in C. monoica were between 28 and 39 bp (55.10%), 44 and 55 bp (18.36%), 73 and 99 bp (16.32%), and 109 and 131 bp (10.20%). In C. sinensis, most of the repeat sizes were between 28 and 39 bp (51.02%), 44 and 65 bp (22.40%), 73 and 91 bp (18.36%), and 100 and 109 bp (8.16%). In C. monoica and C. sinensis, the protein-coding genes harbored 85.72% and 89.80% of the repeats, respectively; the intergenic spacer region comprised 13.26% of the repeats in C. monoica and 9.18% in C. sinensis; and the tRNA genes contained the same percentage of repeats (1.02%) in both taxa (Tables S6 and S7).
3.5. Simple Sequence Repeats (SSRs)
Microsatellites, also known as simple sequence repeats (SSRs), are spread across both genomes. The plastomes of C. monoica and C. sinensis comprised 155 microsatellites in each genome (Tables S8 and S9). In the plastome of C. monoica, mononucleotides harbored the majority of SSRs (84.51%), and the A/T motif had the most frequency (92.9%), followed by C/G (7.1%) (Table 2). Moreover, one dinucleotide (AT/AT), five tetranucleotides (AAAC/GTTT, AAAT/ATTT, AAAG/CTTT, AATT/AATT, and AATC/ATTG), and one pentanucleotide (AAAAT/ATTTT) were discovered in the plastome. In C. sinensis, mononucleotides harbored the majority of SSRs (86.45%), and the A/T motif had the most frequency (94.35%), followed by C/G (5.65%) (Table 2). Moreover, one dinucleotide (AT/AT) and five tetranucleotides (AAAG/CTTT, AAAC/GTTT, AATT/AATT, AAAT/ATTT, and AGGC/CCTG) were discovered in the plastome.
3.6. Comparative Analysis
The IR-SSC and IR-LSC boundaries among three Cordia plastomes (C. dichotoma, C. monoica, and C. sinensis) were compared. The analysis showed similarities among the cp plastomes of Cordia taxa (Figure 5). C. sinensis harbored the largest plastomes (152,050 bp), followed by C. dichotoma (151,990 bp) and C. monoica (151,813 bp). The size of the SSC region was 17,834 bp in C. dichotoma, 17,847 bp in C. monoica, and 17,840 bp in C. sinensis. The size of the LSC region was 83,992 bp in C. dichotoma, 83,812 bp in C. monoica, and 84,124 bp in C. sinensis. The sizes of the IR regions were 25,082 bp in C. dichotoma, 25,077 bp in C. monoica, and 25,043 bp in C. sinensis.
In addition, the analysis indicated that the rpsl9 gene was located within the LSC and IRb boundaries in all genomes. The ycf1 gene was found within the IRb/SSC boundaries (IRb 755 bp/SSC 3 bp) in C. dichotoma and (IRb 749 bp/SSC 3 bp) in C. monoica and C. sinensis. It was also present at the boundary of the SSC/IRa regions (SSC 4447 bp/IRa 755 bp) in C. dichotoma and (SSC 4450 bp/IRa 749 bp) in C. monoica and C. sinensis. The ndhF is located within IRb/SSC boundaries in C. dichotoma, with 2223 bp in the SSC region and 60 bp in the IRb region, while in C. monoica and C. sinensis, it is only found in the SSC region with 2282 bp. No genes were found at the boundaries of IRa/LSC. The psbA and trnH genes were located totally in the LSC region of all plastomes (Figure 5).
3.7. Divergence of Protein-Coding Gene Sequence
Three Cordia plastomes were compared using the C. monoica plastome as a reference. This was carried out in order to observe the sequence divergence regions (Figure 6). The analysis revealed that the plastomes were extremely conserved, with few variable regions. Most of the divergences occurred in the LSC region, and more variables were detected in the noncoding region than in the coding region. The ycf1, ycf2, psaB, and psbN genes had the highest divergence in the coding regions. The evolutionary relationships within the Cordiaceae can be clarified using these divergence markers.
3.8. Characterization of Substitution Rate
To identify the selective pressure within 80 protein-coding genes of two Cordia plastomes, the rates of synonymous (dS) as well as the dN/dS ratio were computed. The analysis shows that the dN/dS ratios were lower than 1 in all genes of C. monoica vs. C. sinensis, except for the rpl23 gene, which had a dN/dS ratio of 1.03 (Figure 7). In all genes, the ratio of synonymous (dS) substitutions was between 0 and 0.6.
3.9. Phylogenetic Analysis
Both the ML and BI analyses produced phylogenetic trees that were virtually identical. The results are represented as one tree in Figure 8, with support results on branches, which represent the bootstrap (BS) and posterior probability (PP) values. The order Boraginales fell into two clades. The first clade (Boraginales I) comprises Boraginaceae (s. str.) with two subfamilies, namely Boraginoideae and Cynoglossoideae, forming a well-supported clade (BS = 100/PP = 1). Boraginoideae comprise two genera: Arnebia and Borago, whereas Cynoglossoideae contain two genera: Bothriospermum and Cynoglossum. The second clade (Boraginales II) comprises the Cordiaceae, Ehretiaceae, and Heliotropiaceae families, with strong support (BS = 100/PP = 1). Cordiaceae and Ehretiaceae were recovered as sisters, with BS = 96/PP = 1 support values. Heliotropiaceae was a sister to both Cordiaceae + Ehretiaceae.
4. Discussion
The cp genome produced an abundance of genetic data to enable scientists to understand the complex phylogenetic relationships between plants [53]. In this research, we presented the plastomes of two taxa belonging to the Cordiaceae. The plastomes of C. monoica and C. sinensis structurally resembled the plastomes of other Boraginales species [54,55]. The plastome sizes of C. monoica and C. sinensis ranged from 151,813 bp to 152,050 bp, respectively (Figure 1). The GC contents of C. monoica and C. sinensis cp genomes were 38.16% and 38.17%, respectively (Table 1). The GC contents are close to those observed in C. dichotoma (37.7%) [56]. The fact that different taxa possess different codon usage biases might be responsible for the variation in GC content across different species within the same genus. The highest GC contents were found within IR regions, with 43.41% in C. monoica and 43.48% in C. sinensis, possibly because all rRNA genes are located within these regions [57]. Since the IR regions have more GC than the LSC and SSC regions, they are highly stable [58]. Each plastome comprised 114 genes, split into 4 rRNA genes, 30 tRNA genes, and 80 protein-coding genes (Table S1). Introns were present in 18 genes of both cp genomes, with 12 protein-coding genes and 6 tRNA genes (Table S2). The introns in cp genomes are considered to be significant for controlling gene expression [59].
The trnM-rbcL region in the C. monoica and C. sinensis cp genomes showed an inversion. Inversion is a form of genomic variant related to adaptation and phenotype variation in organisms [60]. The same inversions have been reported in C. dichotoma [56]. Inversion events in the genome are possibly caused by tRNA activity or intragenomic recombination in GC-rich regions [31,32,33,34]. After all analyses had been conducted, we became aware of a published paper that covered one species (C. monoica) that was analyzed in our paper [61], but the findings were different from those reported here, especially the absence of inversions that were found in the trnM-rbcL region of the C. monoica plastome. The difference in chloroplast genome sequences of individuals from the same species has been reported in some plant taxa [62,63,64]. The nature of the intraspecific cp genome is mostly limited to deletion/insertion and alterations in restriction sites, but in a few cases, it has been linked to inversion [65]. It would be interesting to characterize more of the Cordia taxa to determine if inversion and intraspecific cp genome variation are common in the members of this genus.
The codon usage analysis showed that the genes in the plastome of C. monoica were encoded by 26,750 codons, while in the plastome of C. sinensis they were encoded by 26,593 codons. The use of codons is critical in the expression of genes [66], resulting in a connection with the conservation of amino acids, gene expression level, transcriptional preference, and GC content [67]. Most of the codons in each plastome had an RSCU value of less than 1, and codons coding for leucine were the most common (Figure 2), similar to those found in C. dichotoma [56]. The C-to-U RNA editing sites analysis revealed 33 editing sites in C. monoica and 32 in C. sinensis, and they were dispersed across 14 protein-coding genes of both species (Figure 3). RNA editing is a crucial aspect of the alteration of nucleotides in the mRNA of genes with functions within the cp genome [68]. The RNA editing process affects the expression of functional proteins [69]. Most amino acid conversions were found to be serine to leucine, which matches the characteristic of RNA editing in a number of angiosperm plants [70].
The analysis of the long repeat sequence in C. monoica and C. sinensis cp genomes recognized 21 and 22 palindromic repeats and 28 and 27 forward repeats, respectively, and the absence of complement and reverse repeats (Figure 4). The number and regions of repeat sequences might be the reason for the recombination and arrangement events in the chloroplast genome [71]. The palindromic and forward repeats are the dominant types of repeats in the angiosperm plastomes [72,73,74]. The SSRs analysis revealed that both genomes contained 155 microsatellites (Table 2). It has been proven that the SSRs are an important molecular marker in taxonomic studies [75]. Additionally, they have served in many areas of research, including estimating sequence variation and analyzing gene flow in plant plastomes [76,77]. The majority of SSRs were mononucleotides, with A/T repeats representing the most frequent type. The majority of SSRs in angiosperm plastomes are often poly(thymine) or poly(adenine) [78,79].
This study compared the IR-SSC and IR-LSC borders of three Cordia plastomes. The shrinkage and extension of IR regions have been linked to differences in genome length [80,81]. The differences in the IR/SSC and IR/LSC borders might be used as phylogenetic signals. The analysis revealed that most of the genes found in the junctions of Cordia plastomes were well preserved, except for the ndhF gene, which was found at the IRb/SSC regions in C. dichotoma and entirely in the SSC region in C. monoica and C. sinensis (Figure 5). In the cp genomes of the Boraginales species, the location of the ndhF gene varies; it has been found at IRb/SSC in Tournefortia montana, Nonea vesicaria, Trigonotis peduncularis, and Arnebia euchroma, and entirely in the SSC region in Heliotropium arborescens, Lappula myosotis, Ehretia dicksonii, and Cynoglossum amabile [56].
The sequence divergence region analysis showed that the plastomes were well preserved. Genetic regions were more preserved than intergenic regions, as noted in most angiosperm plastomes [82,83]. However, a few variable regions were observed in ycf1, ycf2, psaB, and psbN genes (Figure 6). A number of these divergence markers were used in the past to understand the evolutionary relationship among plant species [84,85]. It would be useful to use these high-diversity regions in the Cordia cp genomes as taxa-specific DNA markers. The results of the selective pressure rate analysis within the two Cordia plastomes showed that the dN/dS ratios were below 1 in all genes, with the exception of the rpl23 gene, which was found under positive selection and had dN/dS ratios greater than 1 (Figure 7). Further investigation into the functions of this gene is required because it might have played an essential role in the adaptive evolution of Cordia taxa.
According to the results of phylogenetic analysis, there are two main clades within the order Boraginales (Figure 8). The first clade comprises Boraginaceae with two subfamilies (Boraginoideae and Cynoglossoideae), which is consistent with the recently revised familial classification of Boraginaceae based on phylogenetic studies [86]. The second clade consists of Cordiaceae, Ehretiaceae, and Heliotropiaceae; Cordiaceae resolved as sister to Ehretiaceae, which is consistent with previous phylogenetic studies [56,87]. Our results support treating the order Boraginales to include several distinct families, consistent with a number of recent molecular studies [1,12,56,88] and contrary to what the APG IV system suggested, which treated the Boraginales to include only one family, Boraginaceae [9].
5. Conclusions
In this study, the basic characteristics of two Cordia plastomes (C. monoica and C. sinensis) were analyzed and compared. RNA editing, codon usage, IR boundaries, long repeats, and SSRs were analyzed and identified in these plastomes. The results of the phylogenetic analysis confirmed that there are two main clades within the order Boraginales, the first clade containing Boraginaceae and the second clade containing Cordiaceae, Ehretiaceae, and Heliotropiaceae. These results provide clarity regarding the phylogenetic relationships within the Boraginales. We recommend that more sequences from other families in Boraginales, such as Codonaceae, Coldeniaceae, Hoplestigmataceae, Hydrophyllaceae, Lennoaceae, Namaceae, and Wellstediaceae, are needed to develop a better understanding of the intrafamilial classification of Boraginales.
Supplementary Materials
The following supporting information can be downloaded at: https://www.mdpi.com/article/10.3390/f14091778/s1, Table S1: Genes contents in the C. monoica and C. sinensis chloroplast genomes; Table S2: Exons and introns lengths in C. monoica and C. sinensis chloroplast genomes; Table S3: Codon-anticodon recognition patterns and codon usage of the C. monoica chloroplast genome; Table S4: Codon-anticodon recognition patterns and codon usage of the C. sinensis chloroplast genome; Table S5: Predicted RNA editing site in the C. monoica and C. sinensis chloroplast genome; Table S6: Repeat sequences present in the C. monoica chloroplast genome; Table S7: Repeat sequences present in the C. sinensis chloroplast genome; Table S8: Simple sequence repeats in the chloroplast genome of C. monoica; Table S9: Simple sequence repeats in the chloroplast genome of C. sinensis.
Author Contributions
Conceptualization, M.S.A. and E.J.A.; methodology, E.J.A.; software, M.S.A.; validation, E.J.A.; formal analysis, M.S.A.; investigation, M.S.A.; validation, E.J.A.; writing—original draft preparation, M.S.A.; supervision, E.J.A. All authors have read and agreed to the published version of the manuscript.
Funding
This research received no external funding.
Data Availability Statement
The datasets generated and analyzed in this study are available in the GeneBank of NCBI, and the complete chloroplast genome sequences of C. monoica and C. sinensis are deposited in GenBank of NCBI under the following accession numbers: C. monoica (OP793888) and C. sinensis (OP850801).
Conflicts of Interest
The authors declare no conflict of interest.
References
- Luebert, F.; Cecchi, L.; Frohlich, M.W.; Gottschling, M.; Guilliams, C.M.; Hasenstab-Lehman, K.E.; Hilger, H.H.; Miller, J.S.; Mittelbach, M.; Nazaire, M.; et al. Familial Classification of the Boraginales. Taxon 2016, 65, 502–522. [Google Scholar] [CrossRef]
- Simpson, M.G. Diversity and Classification of Flowering Plants: Eudicots. In Plant Systematics; Elsevier: Amsterdam, The Netherlands, 2019; pp. 285–466. [Google Scholar]
- John, H. The Families of Flowering Plants. I. Dicotyledons. Arranged According to a New System Based on Their Probable Phylogeny. J. Hutchinson. Bot. Gaz. 1926, 82, 111–112. [Google Scholar] [CrossRef]
- Dahlgren, R.M.T. A Revised System of Classification of the Angiosperms. Bot. J. Linn. Soc. 1980, 80, 91–124. [Google Scholar] [CrossRef]
- Thorne, R. An Updated Phylogenetic Classification of the Flowering Plants. Aliso 1992, 13, 265–389. [Google Scholar] [CrossRef]
- Takhtajan, A. Diversity and Classification of Flowering Plants; Columbia University Press: New York, NY, USA, 1997; ISBN 9780231100984. [Google Scholar]
- Moore, M.J.; Jansen, R.K. Molecular Evidence for the Age, Origin, and Evolutionary History of the American Desert Plant Genus Tiquilia (Boraginaceae). Mol. Phylogenetics Evol. 2006, 39, 668–687. [Google Scholar] [CrossRef]
- Nazaire, M.; Hufford, L. A Broad Phylogenetic Analysis of Boraginaceae: Implications for the Relationships of Mertensia. Syst. Bot. 2012, 37, 758–783. [Google Scholar] [CrossRef]
- The Angiosperm Phylogeny Group. An Update of the Angiosperm Phylogeny Group Classification for the Orders and Families of Flowering Plants: APG IV. Bot. J. Linn. Soc. 2016, 181, 1–20. [Google Scholar] [CrossRef]
- Gottschling, M.; Hilger, H.H.; Wolf, M.; Diane, N. Secondary Structure of the ITS1 Transcript and Its Application in a Reconstruction of the Phylogeny of Boraginales. Plant Biol. 2001, 3, 629–636. [Google Scholar] [CrossRef]
- Cohen, J.I. A Phylogenetic Analysis of Morphological and Molecular Characters of Boraginaceae: Evolutionary Relationships, Taxonomy, and Patterns of Character Evolution. Cladistics 2013, 30, 139–169. [Google Scholar] [CrossRef]
- Refulio-Rodriguez, N.F.; Olmstead, R.G. Phylogeny of Lamiidae. Am. J. Bot. 2014, 101, 287–299. [Google Scholar] [CrossRef]
- Hasenstab-Lehman, K. Phylogenetics of the Borage Family: Delimiting Boraginales and Assessing Closest Relatives. Aliso 2017, 35, 41–49. [Google Scholar] [CrossRef]
- Gottschling, M.; Weigend, M.; Hilger, H. Congruence of a Phylogeny of Cordiaceae (Boraginales) Inferred from ITS1 Sequence Data with Morphology, Ecology, and Biogeography. Ann. Mo. Bot. Gard. 2005, 92, 425–437. [Google Scholar]
- Grevich, J.J.; Daniell, H. Chloroplast Genetic Engineering: Recent Advances and Future Perspectives. CRC Crit. Rev. Plant Sci. 2005, 24, 83–107. [Google Scholar] [CrossRef]
- Roston, R.L.; Jouhet, J.; Yu, F.; Gao, H. Editorial: Structure and Function of Chloroplasts. Front. Plant Sci. 2018, 9, 1656. [Google Scholar] [CrossRef]
- Shaw, J.; Lickey, E.B.; Schilling, E.E.; Small, R.L. Comparison of Whole Chloroplast Genome Sequences to Choose Noncoding Regions for Phylogenetic Studies in Angiosperms: The Tortoise and the Hare III. Am. J. Bot. 2007, 94, 275–288. [Google Scholar] [CrossRef] [PubMed]
- Mower, J.P.; Vickrey, T.L. Chapter Nine—Structural Diversity Among Plastid Genomes of Land Plants. In Plastid Genome Evolution; Chaw, S.-M., Jansen, R.K., Eds.; Academic Press: Cambridge, MA, USA, 2018; Volume 85, pp. 263–292. ISBN 0065-2296. [Google Scholar]
- Bendich, A.J. Circular Chloroplast Chromosomes: The Grand Illusion. Plant Cell 2004, 16, 1661–1666. [Google Scholar] [CrossRef]
- Liu, S.; Ni, Y.; Li, J.; Zhang, X.; Yang, H.; Chen, H.; Liu, C. CPGView: A Package for Visualizing Detailed Chloroplast Genome Structures. Mol. Ecol. Resour. 2023, 23, 694–704. [Google Scholar] [CrossRef]
- Yao, J.; Zhao, F.; Xu, Y.; Zhao, K.; Quan, H.; Su, Y.; Hao, P.; Liu, J.; Yu, B.; Yao, M.; et al. Complete Chloroplast Genome Sequencing and Phylogenetic Analysis of Two Dracocephalum Plants. Biomed. Res. Int. 2020, 2020, 4374801. [Google Scholar] [CrossRef]
- Wolfe, K.H.; Li, W.H.; Sharp, P.M. Rates of Nucleotide Substitution Vary Greatly among Plant Mitochondrial, Chloroplast, and Nuclear DNAs. Proc. Natl. Acad. Sci. USA 1987, 84, 9054–9058. [Google Scholar] [CrossRef]
- Bell, C.D.; Soltis, D.E.; Soltis, P.S. The Age and Diversification of the Angiosperms Re-Revisited. Am. J. Bot. 2010, 97, 1296–1303. [Google Scholar] [CrossRef]
- Doyle, J.J.; Doyle, J.L.; Ballenger, J.; Palmer, J. The Distribution and Phylogenetic Significance of a 50-Kb Chloroplast DNA Inversion in the Flowering Plant Family Leguminosae. Mol. Phylogenet. Evol. 1996, 5, 429–438. [Google Scholar] [CrossRef] [PubMed]
- Tangphatsornruang, S.; Uthaipaisanwong, P.; Sangsrakru, D.; Chanprasert, J.; Yoocha, T.; Jomchai, N.; Tragoonrung, S. Characterization of the Complete Chloroplast Genome of Hevea Brasiliensis Reveals Genome Rearrangement, RNA Editing Sites and Phylogenetic Relationships. Gene 2011, 475, 104–112. [Google Scholar] [CrossRef] [PubMed]
- Walker, J.F.; Jansen, R.K.; Zanis, M.J.; Emery, N.C. Sources of Inversion Variation in the Small Single Copy (SSC) Region of Chloroplast Genomes. Am. J. Bot. 2015, 102, 1751–1752. [Google Scholar] [CrossRef] [PubMed]
- Kang, J.-S.; Lee, B.Y.; Kwak, M. The Complete Chloroplast Genome Sequences of Lychnis Wilfordii and Silene Capitata and Comparative Analyses with Other Caryophyllaceae Genomes. PLoS ONE 2017, 12, e0172924. [Google Scholar] [CrossRef]
- Palmer, J.D.; Nugent, J.M.; Herbon, L.A. Unusual Structure of Geranium Chloroplast DNA: A Triple-Sized Inverted Repeat, Extensive Gene Duplications, Multiple Inversions, and Two Repeat Families. Proc. Natl. Acad. Sci. USA 1987, 84, 769–773. [Google Scholar] [CrossRef]
- Tangphatsornruang, S.; Sangsrakru, D.; Chanprasert, J.; Uthaipaisanwong, P.; Yoocha, T.; Jomchai, N.; Tragoonrung, S. The Chloroplast Genome Sequence of Mungbean (Vigna Radiata) Determined by High-Throughput Pyrosequencing: Structural Organization and Phylogenetic Relationships. DNA Res. 2010, 17, 11–22. [Google Scholar] [CrossRef]
- Ogihara, Y.; Terachi, T.; Sasakuma, T. Intramolecular Recombination of Chloroplast Genome Mediated by Short Direct-Repeat Sequences in Wheat Species. Proc. Natl. Acad. Sci. USA 1988, 85, 8573–8577. [Google Scholar] [CrossRef]
- Hiratsuka, J.; Shimada, H.; Whittier, R.; Ishibashi, T.; Sakamoto, M.; Mori, M.; Kondo, C.; Honji, Y.; Sun, C.-R.; Meng, B.-Y.; et al. The Complete Sequence of the Rice (Oryza Sativa) Chloroplast Genome: Intermolecular Recombination between Distinct TRNA Genes Accounts for a Major Plastid DNA Inversion during the Evolution of the Cereals. Mol. Gen. Genet. 1989, 217, 185–194. [Google Scholar] [CrossRef]
- Fullerton, S.M.; Bernardo Carvalho, A.; Clark, A.G. Local Rates of Recombination Are Positively Correlated with GC Content in the Human Genome. Mol. Biol. Evol. 2001, 18, 1139–1142. [Google Scholar] [CrossRef]
- Smith, N.G.C.; Webster, M.T.; Ellegren, H. Deterministic Mutation Rate Variation in the Human Genome. Genome Res. 2002, 12, 1350–1356. [Google Scholar] [CrossRef]
- Walker, J.F.; Zanis, M.J.; Emery, N.C. Comparative Analysis of Complete Chloroplast Genome Sequence and Inversion Variation in Lasthenia Burkei (Madieae, Asteraceae). Am. J. Bot. 2014, 101, 722–729. [Google Scholar] [CrossRef] [PubMed]
- Liu, H.; He, J.; Ding, C.; Lyu, R.; Pei, L.; Cheng, J.; Xie, L. Comparative Analysis of Complete Chloroplast Genomes of Anemoclema, Anemone, Pulsatilla, and Hepatica Revealing Structural Variations Among Genera in Tribe Anemoneae (Ranunculaceae). Front. Plant Sci. 2018, 9, 1097. [Google Scholar] [CrossRef] [PubMed]
- Chen, Y.Y.; Chen, Y.Y.; Shi, C.; Huang, Z.; Zhang, Y.; Li, S.; Li, Y.; Ye, J.; Yu, C.; Li, Z.; et al. SOAPnuke: A MapReduce Acceleration-Supported Software for Integrated Quality Control and Preprocessing of High-Throughput Sequencing Data. Gigascience 2018, 7, 1–6. [Google Scholar] [CrossRef]
- Dierckxsens, N.; Mardulyn, P.; Smits, G. NOVOPlasty: De Novo Assembly of Organelle Genomes from Whole Genome Data. Nucleic Acids Res. 2017, 45, e18. [Google Scholar] [CrossRef]
- Tillich, M.; Lehwark, P.; Pellizzer, T.; Ulbricht-Jones, E.S.; Fischer, A.; Bock, R.; Greiner, S. GeSeq—Versatile and Accurate Annotation of Organelle Genomes. Nucleic Acids Res. 2017, 45, W6–W11. [Google Scholar] [CrossRef]
- Greiner, S.; Lehwark, P.; Bock, R. OrganellarGenomeDRAW (OGDRAW) Version 1.3.1: Expanded Toolkit for the Graphical Visualization of Organellar Genomes. Nucleic Acids Res. 2019, 47, W59–W64. [Google Scholar] [CrossRef]
- Tamura, K.; Stecher, G.; Peterson, D.; Filipski, A.; Kumar, S. MEGA6: Molecular Evolutionary Genetics Analysis Version 6.0. Mol. Biol. Evol. 2013, 30, 2725–2729. [Google Scholar] [CrossRef]
- Lenz, H.; Knoop, V. PREPACT 2.0: Predicting C-to-U and U-to-C RNA Editing in Organelle Genome Sequences with Multiple References and Curated RNA Editing Annotation. Bioinform. Biol. Insights 2013, 7, 1–19. [Google Scholar] [CrossRef]
- Kurtz, S.; Choudhuri, J.V.; Ohlebusch, E.; Schleiermacher, C.; Stoye, J.; Giegerich, R. REPuter: The Manifold Applications of Repeat Analysis on a Genomic Scale. Nucleic Acids Res. 2001, 29, 4633–4642. [Google Scholar] [CrossRef]
- Beier, S.; Thiel, T.; Münch, T.; Scholz, U.; Mascher, M. MISA-Web: A Web Server for Microsatellite Prediction. Bioinformatics 2017, 33, 2583–2585. [Google Scholar] [CrossRef]
- Kearse, M.; Moir, R.; Wilson, A.; Stones-Havas, S.; Cheung, M.; Sturrock, S.; Buxton, S.; Cooper, A.; Markowitz, S.; Duran, C.; et al. Geneious Basic: An Integrated and Extendable Desktop Software Platform for the Organization and Analysis of Sequence Data. Bioinformatics 2012, 28, 1647–1649. [Google Scholar] [CrossRef] [PubMed]
- Librado, P.; Rozas, J. DnaSP v5: A Software for Comprehensive Analysis of DNA Polymorphism Data. Bioinformatics 2009, 25, 1451–1452. [Google Scholar] [CrossRef] [PubMed]
- Mayor, C.; Brudno, M.; Schwartz, J.R.; Poliakov, A.; Rubin, E.M.; Frazer, K.A.; Pachter, L.S.; Dubchak, I. VISTA: Visualizing Global DNA Sequence Alignments of Arbitrary Length. Bioinformatics 2000, 16, 1046–1047. [Google Scholar] [CrossRef] [PubMed]
- Amiryousefi, A.; Hyvönen, J.; Poczai, P. IRscope: An Online Program to Visualize the Junction Sites of Chloroplast Genomes. Bioinformatics 2018, 34, 3030–3031. [Google Scholar] [CrossRef]
- Katoh, K.; Standley, D.M. MAFFT Multiple Sequence Alignment Software Version 7: Improvements in Performance and Usability. Mol. Biol. Evol. 2013, 30, 772–780. [Google Scholar] [CrossRef]
- Nguyen, L.-T.; Schmidt, H.A.; von Haeseler, A.; Minh, B.Q. IQ-TREE: A Fast and Effective Stochastic Algorithm for Estimating Maximum-Likelihood Phylogenies. Mol. Biol. Evol. 2015, 32, 268–274. [Google Scholar] [CrossRef]
- Ronquist, F.; Teslenko, M.; van der Mark, P.; Ayres, D.L.; Darling, A.; Höhna, S.; Larget, B.; Liu, L.; Suchard, M.A.; Huelsenbeck, J.P. MrBayes 3.2: Efficient Bayesian Phylogenetic Inference and Model Choice across a Large Model Space. Syst. Biol. 2012, 61, 539–542. [Google Scholar] [CrossRef]
- Kalyaanamoorthy, S.; Minh, B.Q.; Wong, T.K.F.; von Haeseler, A.; Jermiin, L.S. ModelFinder: Fast Model Selection for Accurate Phylogenetic Estimates. Nat. Methods 2017, 14, 587–589. [Google Scholar] [CrossRef]
- Posada, D. JModelTest: Phylogenetic Model Averaging. Mol. Biol. Evol. 2008, 25, 1253–1256. [Google Scholar] [CrossRef]
- Luo, J.; Hou, B.-W.; Niu, Z.-T.; Liu, W.; Xue, Q.-Y.; Ding, X.-Y. Comparative Chloroplast Genomes of Photosynthetic Orchids: Insights into Evolution of the Orchidaceae and Development of Molecular Markers for Phylogenetic Applications. PLoS ONE 2014, 9, e99016. [Google Scholar] [CrossRef]
- Carvalho Leonardo, I.; Barreto Crespo, M.T.; Capelo, J.; Bustos Gaspar, F. The Complete Plastome of Echium Plantagineum L. (Boraginaceae), the First Chloroplast Genome Belonging to the Echium Genus. Mitochondrial DNA B Resour. 2022, 7, 1154–1156. [Google Scholar] [CrossRef] [PubMed]
- Wu, J.-H.; Li, H.-M.; Lei, J.-M.; Liang, Z.-R. The Complete Chloroplast Genome Sequence of Trigonotis Peduncularis (Boraginaceae). Mitochondrial DNA B Resour. 2022, 7, 456–457. [Google Scholar] [CrossRef]
- Li, Q.; Wei, R. Comparison of Boraginales Plastomes: Insights into Codon Usage Bias, Adaptive Evolution, and Phylogenetic Relationships. Diversity 2022, 14, 1104. [Google Scholar] [CrossRef]
- Liu, K.; Wang, R.; Guo, X.-X.; Zhang, X.-J.; Qu, X.-J.; Fan, S.-J. Comparative and Phylogenetic Analysis of Complete Chloroplast Genomes in Eragrostideae (Chloridoideae, Poaceae). Plants 2021, 10, 109. [Google Scholar] [CrossRef] [PubMed]
- Long, L.; Li, Y.; Wang, S.; Liu, Z.; Wang, J.; Yang, M. Complete Chloroplast Genomes and Comparative Analysis of Ligustrum Species. Sci. Rep. 2023, 13, 212. [Google Scholar] [CrossRef] [PubMed]
- Shaul, O. How Introns Enhance Gene Expression. Int. J. Biochem. Cell Biol. 2017, 91, 145–155. [Google Scholar] [CrossRef] [PubMed]
- Giner-Delgado, C.; Villatoro, S.; Lerga-Jaso, J.; Gayà-Vidal, M.; Oliva, M.; Castellano, D.; Pantano, L.; Bitarello, B.D.; Izquierdo, D.; Noguera, I.; et al. Evolutionary and Functional Impact of Common Polymorphic Inversions in the Human Genome. Nat. Commun. 2019, 10, 4222. [Google Scholar] [CrossRef]
- Alshegaihi, R.M.; Mansour, H.; Alrobaish, S.A.; Al Shaye, N.A.; Abd El-Moneim, D. The First Complete Chloroplast Genome of Cordia Monoica: Structure and Comparative Analysis. Genes 2023, 14, 976. [Google Scholar] [CrossRef]
- Kim, Y.; Cullis, C. A Novel Inversion in the Chloroplast Genome of Marama (Tylosema Esculentum). J. Exp. Bot. 2017, 68, 2065–2072. [Google Scholar] [CrossRef]
- Zhang, W.; Zhang, Z.; Liu, B.; Chen, J.; Zhao, Y.; Huang, Y. Comparative Analysis of 17 Complete Chloroplast Genomes Reveals Intraspecific Variation and Relationships among Pseudostellaria Heterophylla (Miq.) Pax Populations. Front. Plant Sci. 2023, 14, 1163325. [Google Scholar] [CrossRef]
- Lian, C.; Yang, H.; Lan, J.; Zhang, X.; Zhang, F.; Yang, J.; Chen, S. Comparative Analysis of Chloroplast Genomes Reveals Phylogenetic Relationships and Intraspecific Variation in the Medicinal Plant Isodon Rubescens. PLoS ONE 2022, 17, e0266546. [Google Scholar] [CrossRef] [PubMed]
- Tsumura, Y.; Suyama, Y.; Yoshimura, K. Chloroplast DNA Inversion Polymorphism in Populations of Abies and Tsuga. Mol. Biol. Evol. 2000, 17, 1302–1312. [Google Scholar] [CrossRef] [PubMed]
- Chen, X.; Li, Q.; Li, Y.; Qian, J.; Han, J. Chloroplast Genome of Aconitum Barbatum Var. Puberulum (Ranunculaceae) Derived from CCS Reads Using the PacBio RS Platform. Front. Plant Sci. 2015, 6, 42. [Google Scholar] [CrossRef] [PubMed]
- Sharp, P.M.; Emery, L.R.; Zeng, K. Forces That Influence the Evolution of Codon Bias. Philos. Trans. R. Soc. B Biol. Sci. 2010, 365, 1203–1212. [Google Scholar] [CrossRef] [PubMed]
- Tang, W.; Luo, C. Molecular and Functional Diversity of RNA Editing in Plant Mitochondria. Mol. Biotechnol. 2018, 60, 935–945. [Google Scholar] [CrossRef]
- Shikanai, T. RNA Editing in Plant Organelles: Machinery, Physiological Function and Evolution. Cell Mol. Life Sci. 2006, 63, 698–708. [Google Scholar] [CrossRef]
- Konhar, R.; Debnath, M.; Vishwakarma, S.; Bhattacharjee, A.; Sundar, D.; Tandon, P.; Dash, D.; Biswal, D. The Complete Chloroplast Genome of Dendrobium Nobile, an Endangered Medicinal Orchid from North-East India and Its Comparison with Related Dendrobium Species. PeerJ 2019, 7, e7756. [Google Scholar] [CrossRef]
- Guisinger, M.M.; Kuehl, J.V.; Boore, J.L.; Jansen, R.K. Extreme Reconfiguration of Plastid Genomes in the Angiosperm Family Geraniaceae: Rearrangements, Repeats, and Codon Usage. Mol. Biol. Evol. 2010, 28, 583–600. [Google Scholar] [CrossRef]
- Li, J.; Yang, M.; Li, Y.; Jiang, M.; Liu, C.; He, M.; Wu, B. Chloroplast Genomes of Two Pueraria DC. Species: Sequencing, Comparative Analysis and Molecular Marker Development. FEBS Open Bio. 2022, 12, 349–361. [Google Scholar] [CrossRef]
- Tian, C.; Li, X.; Wu, Z.; Li, Z.; Hou, X.; Li, F.Y. Characterization and Comparative Analysis of Complete Chloroplast Genomes of Three Species From the Genus Astragalus (Leguminosae). Front. Genet. 2021, 12, 1163325. [Google Scholar] [CrossRef]
- Gan, J.; Li, Y.; Tang, D.; Guo, B.; Li, D.; Cao, F.; Sun, C.; Yu, L.; Yan, Z. The Complete Chloroplast Genomes of Gynostemma Reveal the Phylogenetic Relationships of Species within the Genus. Genes 2023, 14, 929. [Google Scholar] [CrossRef] [PubMed]
- Provan, J.; Powell, W.; Hollingsworth, P.M. Chloroplast Microsatellites: New Tools for Studies in Plant Ecology and Evolution. Trends Ecol. Evol. 2001, 16, 142–147. [Google Scholar] [CrossRef] [PubMed]
- Addisalem, A.B.; Esselink, G.D.; Bongers, F.; Smulders, M.J.M. Genomic Sequencing and Microsatellite Marker Development for Boswellia Papyrifera, an Economically Important but Threatened Tree Native to Dry Tropical Forests. AoB Plants 2015, 7, plu086. [Google Scholar] [CrossRef] [PubMed]
- Ebert, D.; Peakall, R. Chloroplast Simple Sequence Repeats (CpSSRs): Technical Resources and Recommendations for Expanding CpSSR Discovery and Applications to a Wide Array of Plant Species. Mol. Ecol. Resour. 2009, 9, 673–690. [Google Scholar] [CrossRef] [PubMed]
- Ishaq, M.N.; Ehirim, B.O.; Nwanyanwu, G.C.; Abubaka, R.I. DNA Fingerprinting Simple Sequence Repeat (SSR) Marker-Basedof Some Varieties of Rice (Oryza Sativa L.) Released in Nigeria. Afr. J. Biotechnol. 2019, 18, 242–248. [Google Scholar] [CrossRef]
- Kuang, D.-Y.; Wu, H.; Wang, Y.-L.; Gao, L.-M.; Zhang, S.-Z.; Lu, L. Complete Chloroplast Genome Sequence of Magnolia Kwangsiensis (Magnoliaceae): Implication for DNA Barcoding and Population Genetics. Genome 2011, 54, 663–673. [Google Scholar] [CrossRef]
- Raubeson, L.A.; Peery, R.; Chumley, T.W.; Dziubek, C.; Fourcade, H.M.; Boore, J.L.; Jansen, R.K. Comparative Chloroplast Genomics: Analyses Including New Sequences from the Angiosperms Nuphar Advena and Ranunculus Macranthus. BMC Genom. 2007, 8, 174. [Google Scholar] [CrossRef]
- Wang, W.; Messing, J. High-Throughput Sequencing of Three Lemnoideae (Duckweeds) Chloroplast Genomes from Total DNA. PLoS ONE 2011, 6, e24670. [Google Scholar] [CrossRef]
- Huo, Y.; Gao, L.; Liu, B.; Yang, Y.; Kong, S.; Sun, Y.; Yang, Y.; Wu, X. Complete Chloroplast Genome Sequences of Four Allium Species: Comparative and Phylogenetic Analyses. Sci. Rep. 2019, 9, 12250. [Google Scholar] [CrossRef]
- Song, Y.; Zhang, Y.; Xu, J.; Li, W.; Li, M. Characterization of the Complete Chloroplast Genome Sequence of Dalbergia Species and Its Phylogenetic Implications. Sci. Rep. 2019, 9, 20401. [Google Scholar] [CrossRef]
- Huang, J.L.; Sun, G.L.; Zhang, D.M. Molecular Evolution and Phylogeny of the Angiosperm Ycf2 Gene. J. Syst. Evol. 2010, 48, 240–248. [Google Scholar] [CrossRef]
- Dong, W.; Xu, C.; Li, C.; Sun, J.; Zuo, Y.; Shi, S.; Cheng, T.; Guo, J.; Zhou, S. Ycf1, the Most Promising Plastid DNA Barcode of Land Plants. Sci. Rep. 2015, 5, 8348. [Google Scholar] [CrossRef] [PubMed]
- Chacón, J.; Luebert, F.; Hilger, H.H.; Ovchinnikova, S.; Selvi, F.; Cecchi, L.; Guilliams, C.M.; Hasenstab-Lehman, K.; Sutorý, K.; Simpson, M.G.; et al. The Borage Family (Boraginaceae s.Str.): A Revised Infrafamilial Classification Based on New Phylogenetic Evidence, with Emphasis on the Placement of Some Enigmatic Genera. Taxon 2016, 65, 523–546. [Google Scholar] [CrossRef]
- Gottschling, M.; Luebert, F.; Hilger, H.H.; Miller, J.S. Molecular Delimitations in the Ehretiaceae (Boraginales). Mol. Phylogenetics Evol. 2014, 72, 1–6. [Google Scholar] [CrossRef] [PubMed]
- Tang, C.; Li, S.; Wang, Y.; Wang, X. Comparative Genome/Transcriptome Analysis Probes Boraginales’ Phylogenetic Position, WGDs in Boraginales, and Key Enzyme Genes in the Alkannin/Shikonin Core Pathway. Mol. Ecol. Resour. 2019, 20, 228–241. [Google Scholar] [CrossRef]
Figure 1.
Gene map of C. monoica and C. sinensis plastomes. The LSC and SSC indicate the large and small single-copy regions. The IR indicates inverted repeat regions. The INV refers to inversion.
Figure 1.
Gene map of C. monoica and C. sinensis plastomes. The LSC and SSC indicate the large and small single-copy regions. The IR indicates inverted repeat regions. The INV refers to inversion.

Figure 2.
Codon content in C. monoica and C. sinensis plastomes.

Figure 3.
The C-to-U RNA editing sites in C. monoica and C. sinensis plastomes.
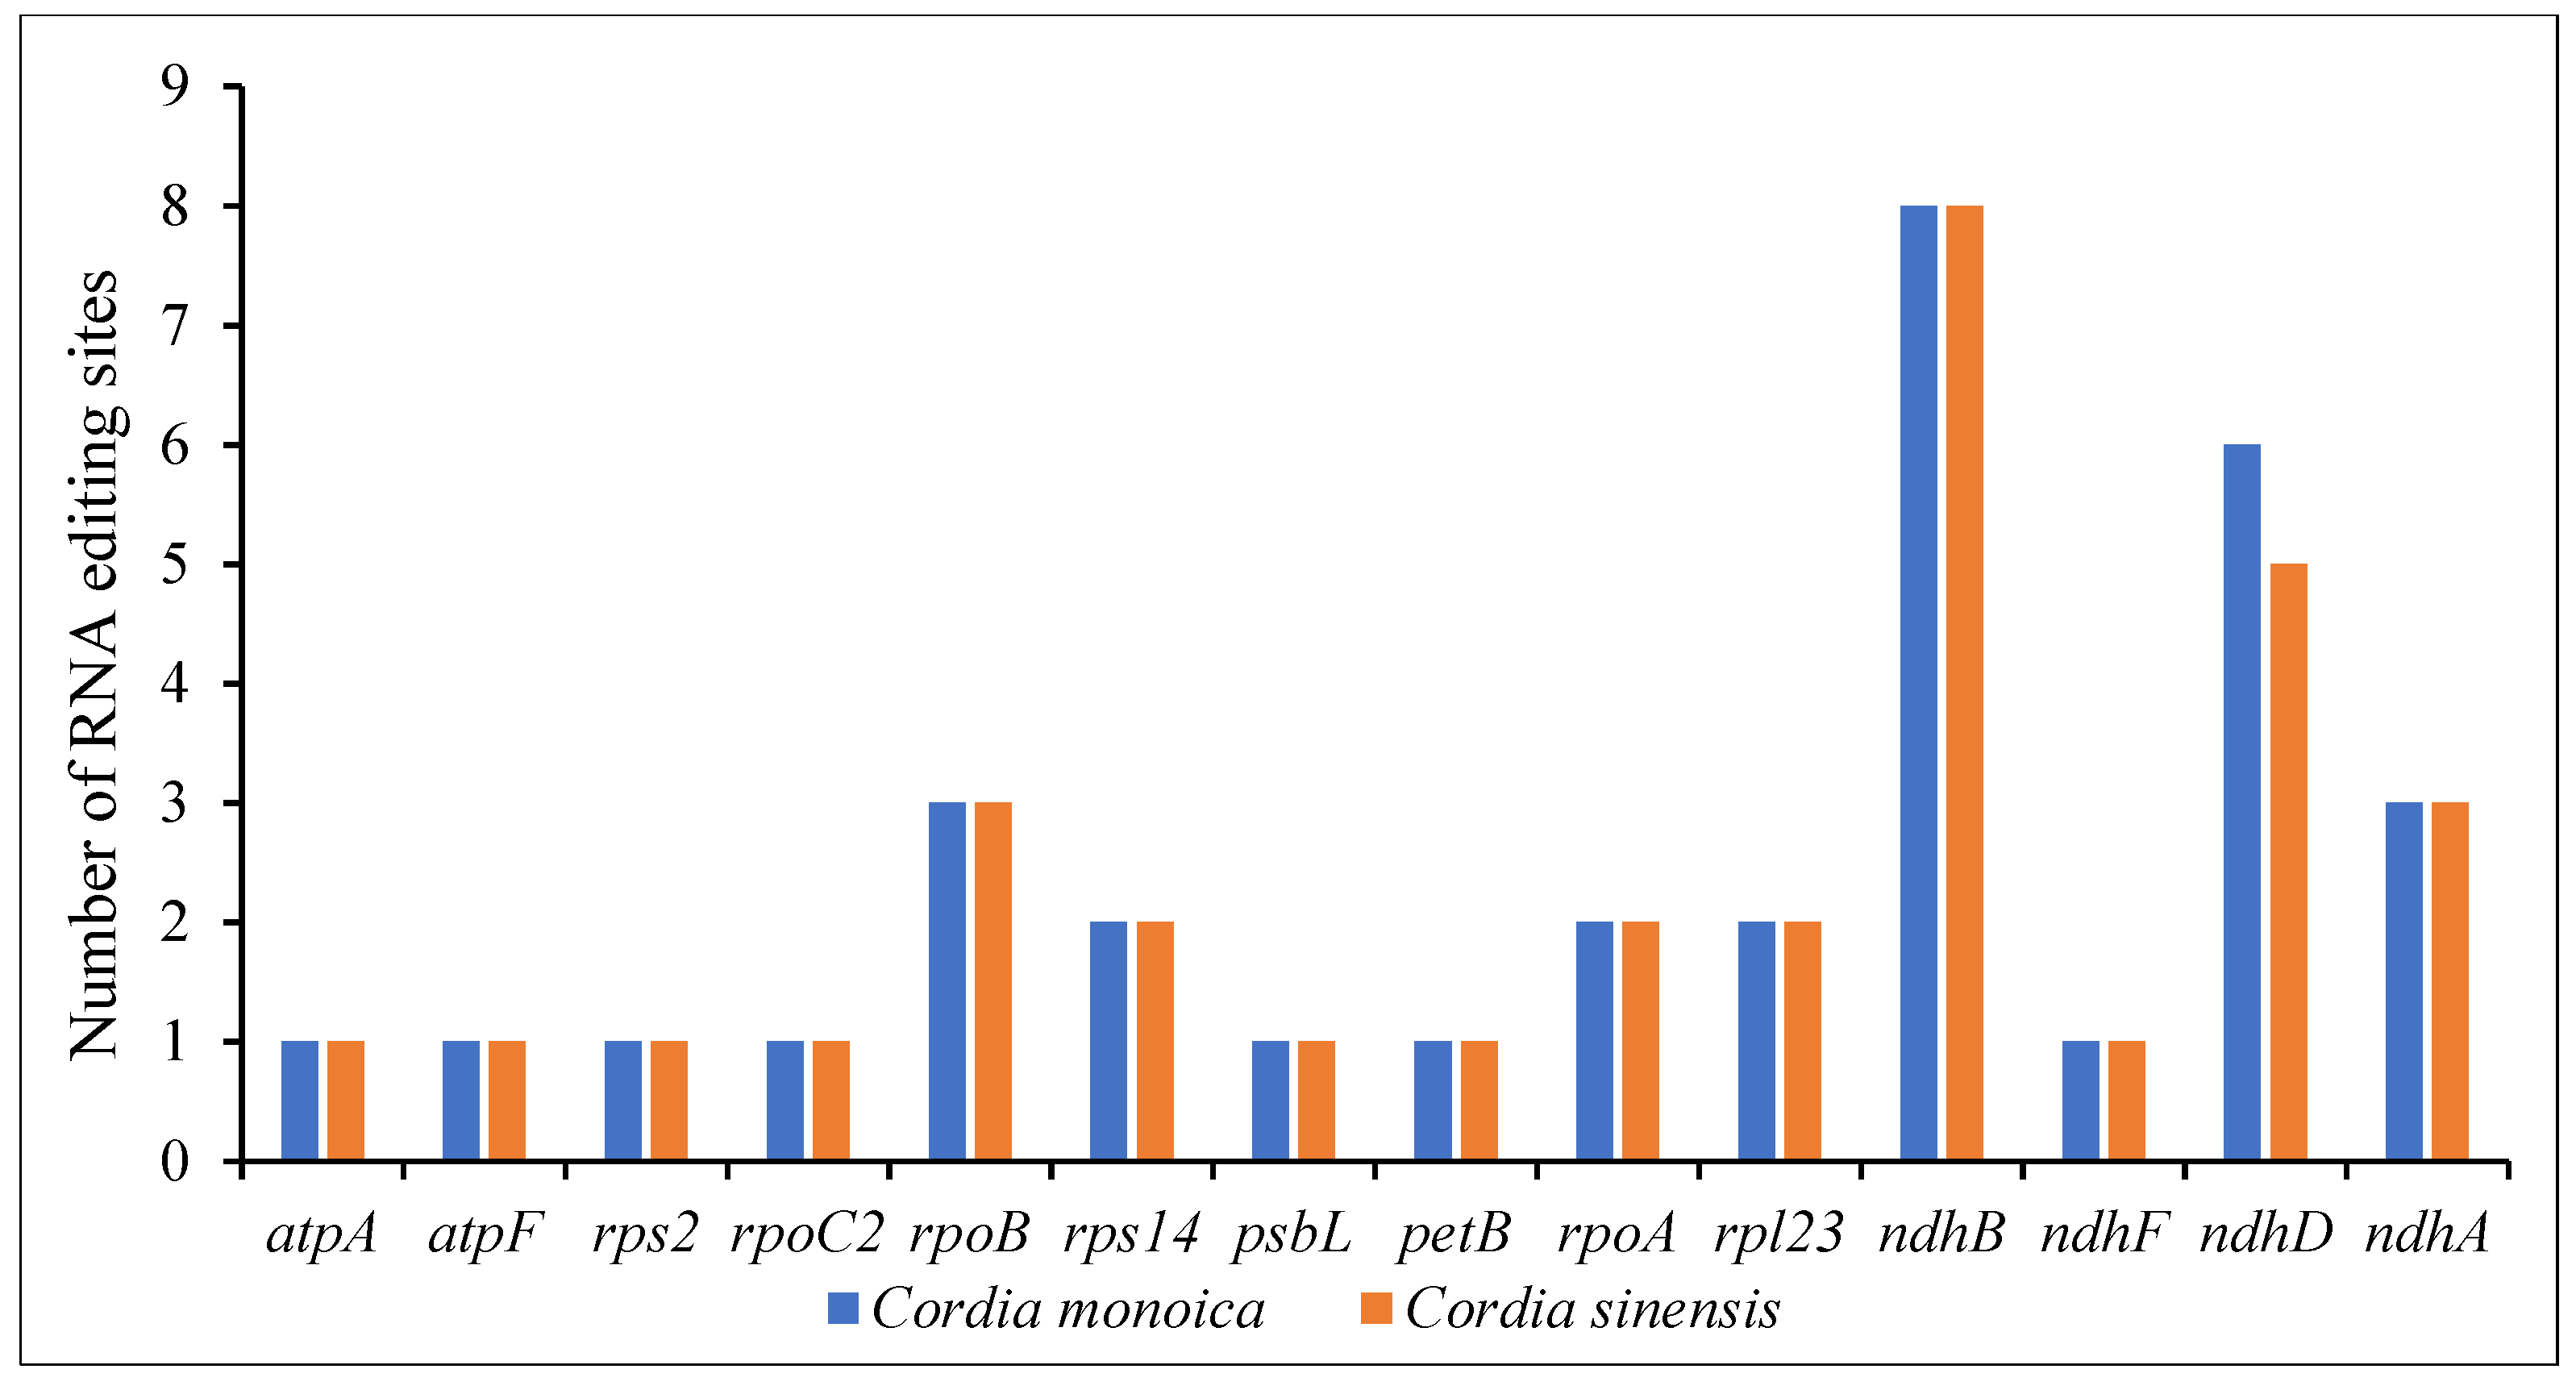
Figure 4.
The number and type of repeats in the plastomes of C. monoica and C. sinensis. C—complement; R—reverse; P—palindromic; F—forward.
Figure 4.
The number and type of repeats in the plastomes of C. monoica and C. sinensis. C—complement; R—reverse; P—palindromic; F—forward.
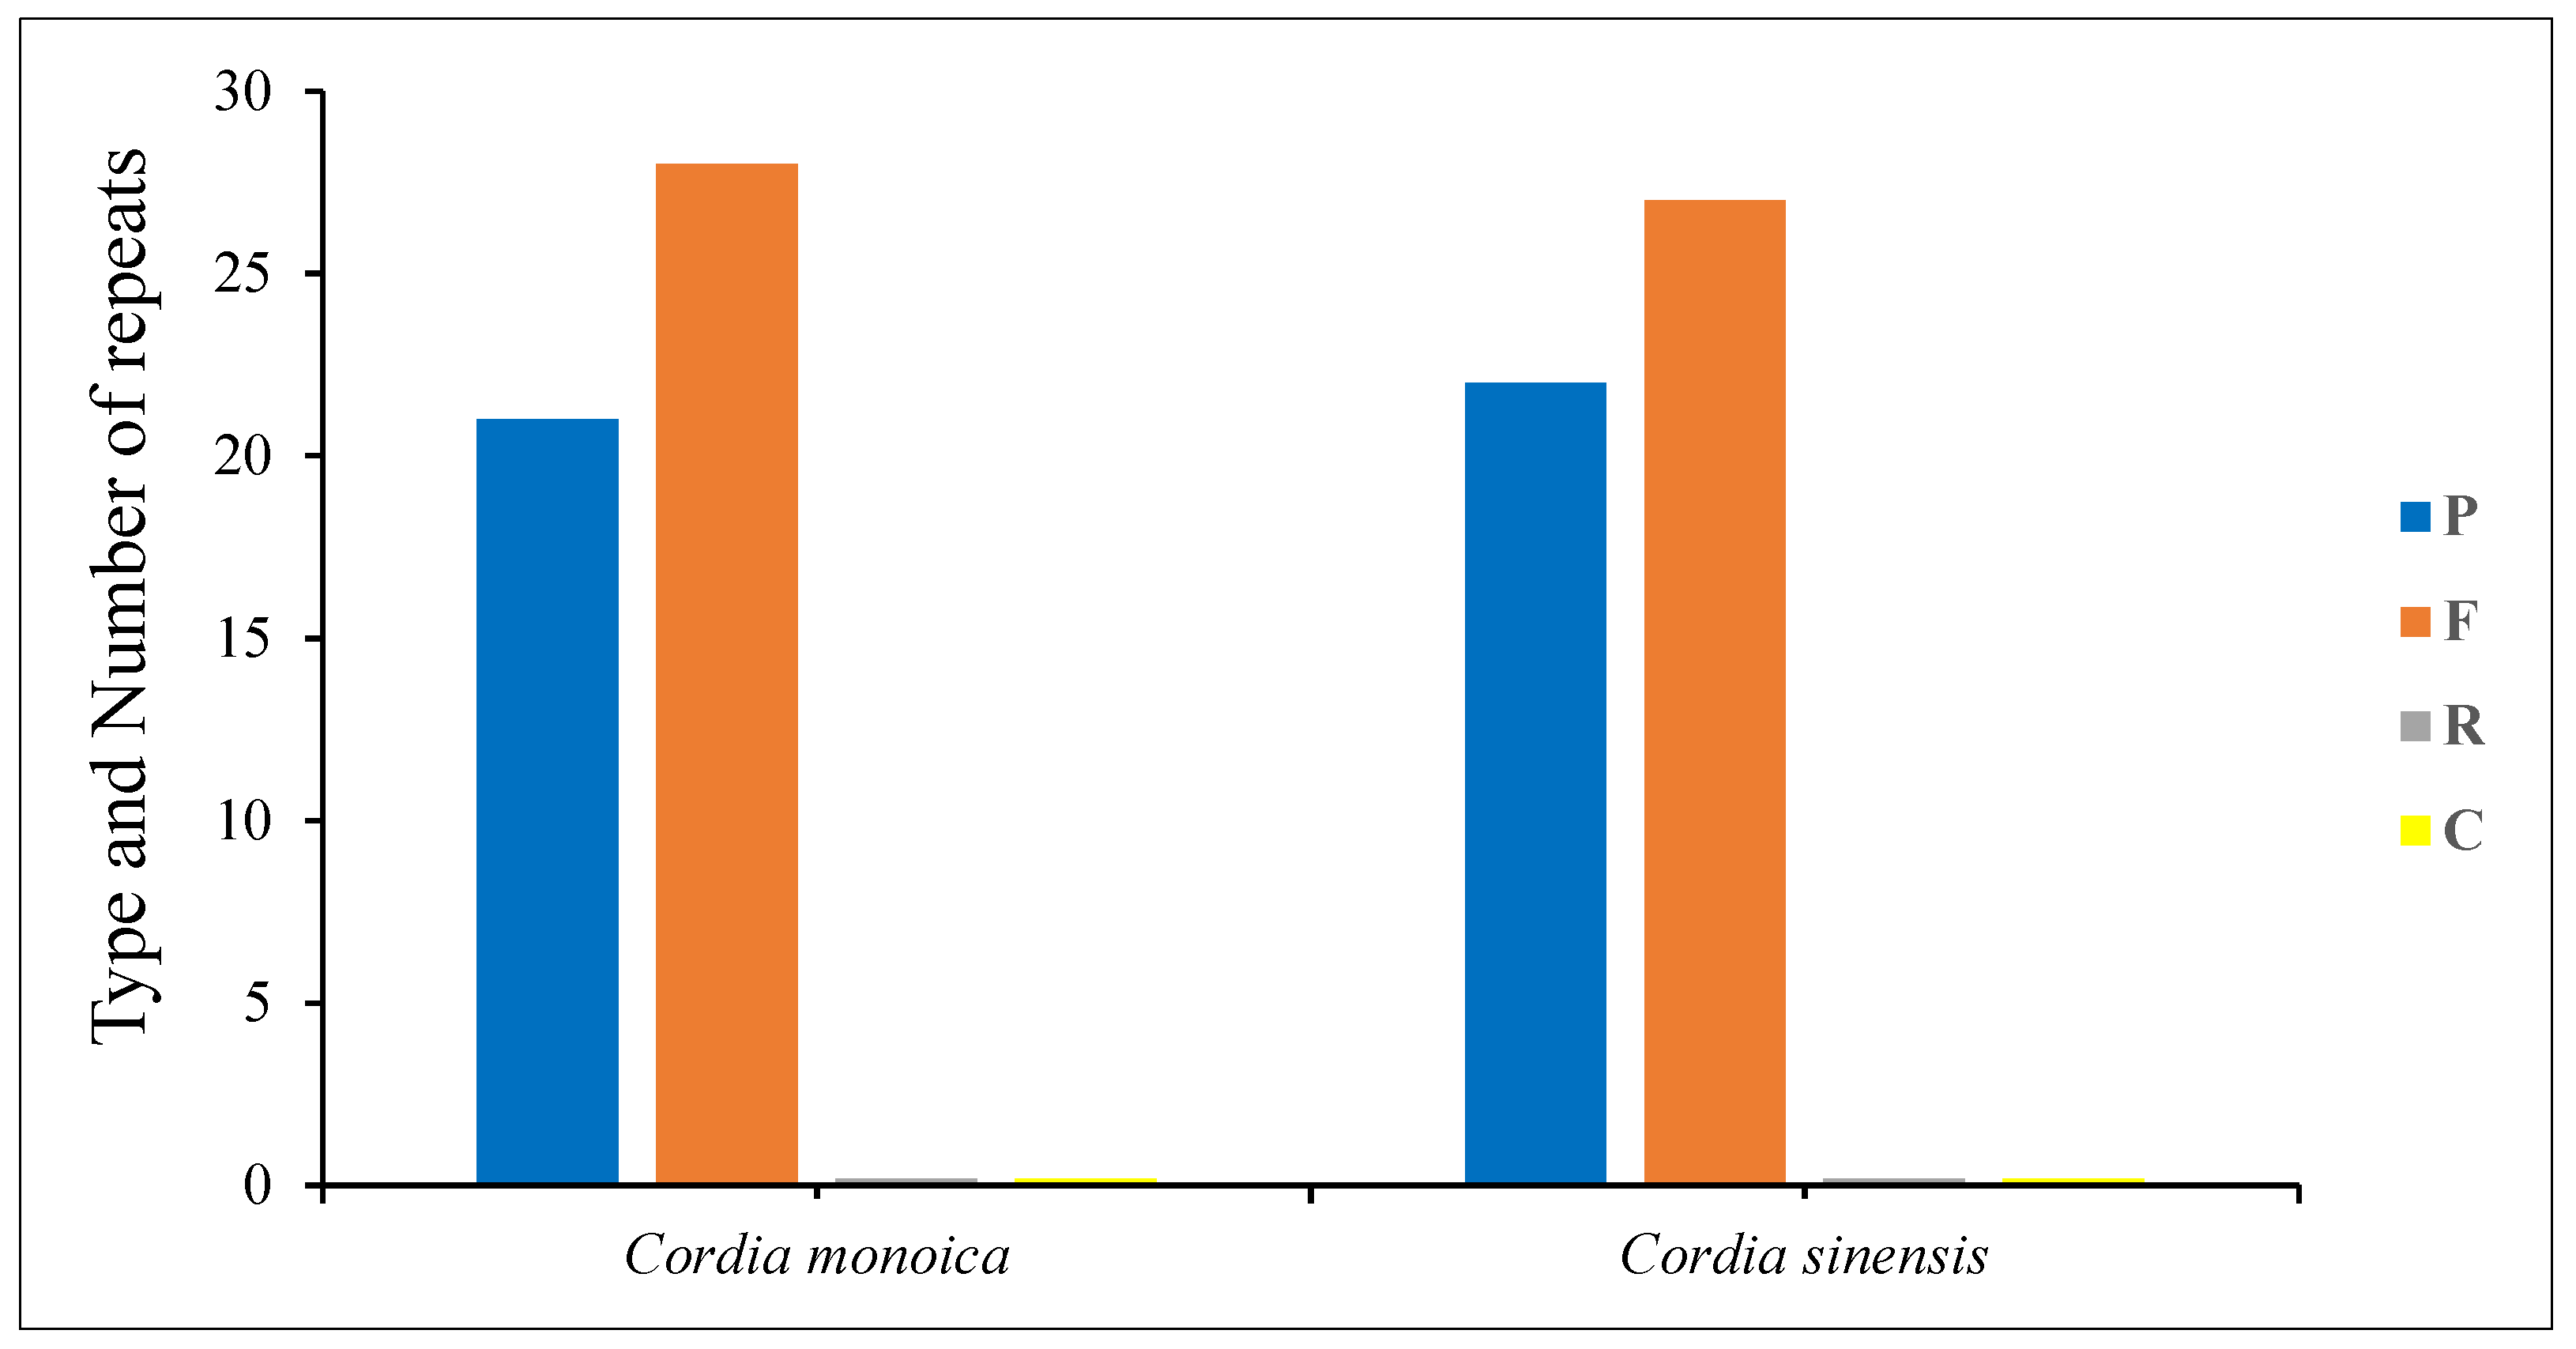
Figure 5.
A comparison between the LSC, SSC, and IRs boundaries of three Cordia plastomes.

Figure 6.
Three Cordia plastomes were visually aligned using C. monoica as a reference. The plastome coordinate is shown by the x-axis, while the identity percentage (between 50% and 100%) is represented by the y-axis. The direction of each gene is indicated by the upper arrows. CNS stands for conserved non-coding regions; UTR stands for untranslated regions. The mVISTA program was used for the sequence alignment.
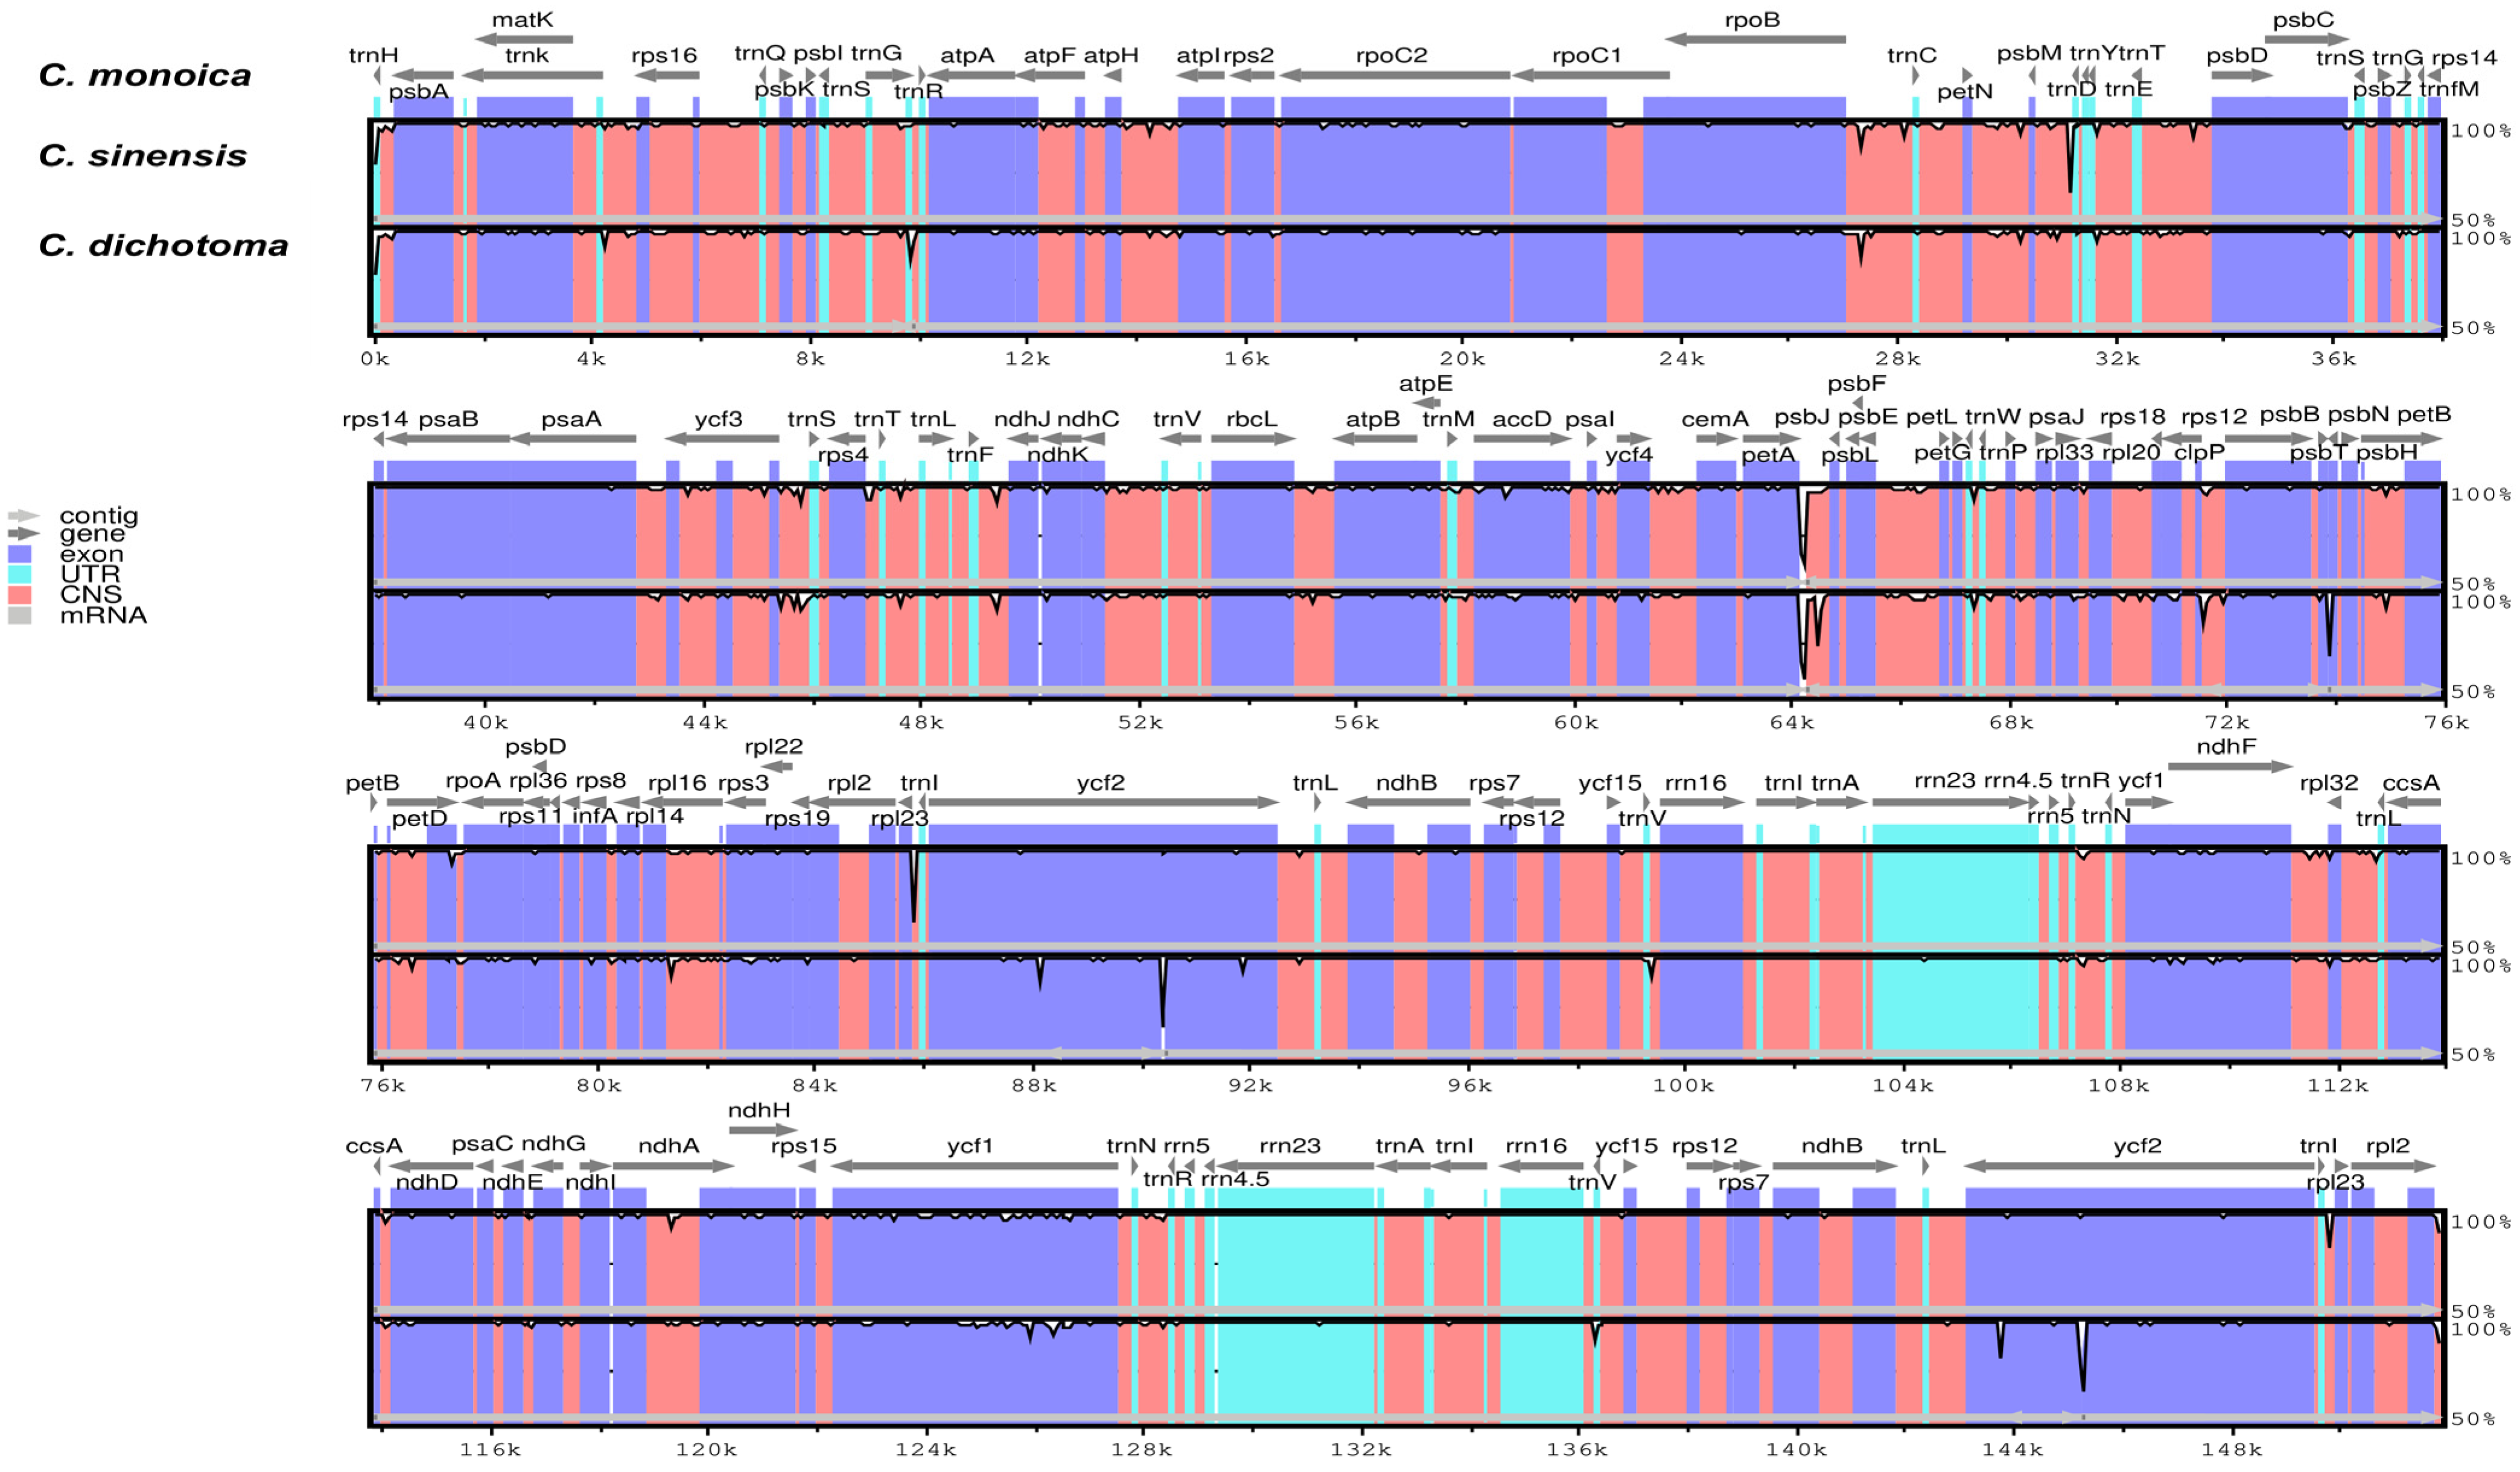
Figure 7.
The ratios of dN/dS and dS subsituation of protein-coding genes from C. monoica and C. sinensis plastomes.
Figure 7.
The ratios of dN/dS and dS subsituation of protein-coding genes from C. monoica and C. sinensis plastomes.

Figure 8.
A phylogenetic tree showing the relationships between four families of the order Boraginales was produced by ML and BI analyses using 13 plastomes. The branch nodes’ numbers represent the (BS)/(PP) values.
Figure 8.
A phylogenetic tree showing the relationships between four families of the order Boraginales was produced by ML and BI analyses using 13 plastomes. The branch nodes’ numbers represent the (BS)/(PP) values.


Table 1.
The characteristics of C. sinensis and C. monoica plastomes.
| Species | C. monoica | C. sinensis |
|---|---|---|
| Cp genome size (bp) | 151,813 | 152,050 |
| IR (bp) | 25,077 | 25,043 |
| LSC (bp) | 83,812 | 84,124 |
| SSC (bp) | 17,847 | 17,840 |
| Total number of genes | 134 | 134 |
| rRNA | 4 | 4 |
| tRNA | 30 | 30 |
| Protein-coding genes | 80 | 80 |
| T (U) % | 31.17 | 31.15 |
| C % | 19.42 | 19.42 |
| A % | 30.65 | 30.66 |
| G % | 18.74 | 18.75 |
| Overall GC content % | 38,16 | 38,17 |
| GC in LSC % | 36.23 | 36.23 |
| GC in SSC % | 32.49 | 32.49 |
| GC in IR % | 43.41 | 43.48 |
Table 2.
The microsatellites in C. monoica and C. sinensis cp genomes.
| SSR Type | Repeat Unit | Species | |
|---|---|---|---|
| C. monoica | C. sinensis | ||
| Mono | A/T | 131 | 134 |
| C/G | 10 | 8 | |
| Di | AT/AT | 2 | 2 |
| Tetra | AAAC/GTTT | 2 | 2 |
| AAAG/CTTT | 2 | 2 | |
| AAAT/ATTT | 5 | 5 | |
| AATC/ATTG | 1 | 0 | |
| AATT/AATT | 1 | 1 | |
| AGGC/CCTG | 0 | 1 | |
| Penta | AAAAT/ATTTT | 1 | 0 |
Disclaimer/Publisher’s Note: The statements, opinions and data contained in all publications are solely those of the individual author(s) and contributor(s) and not of MDPI and/or the editor(s). MDPI and/or the editor(s) disclaim responsibility for any injury to people or property resulting from any ideas, methods, instructions or products referred to in the content. |
© 2023 by the authors. Licensee MDPI, Basel, Switzerland. This article is an open access article distributed under the terms and conditions of the Creative Commons Attribution (CC BY) license (https://creativecommons.org/licenses/by/4.0/).
Share and Cite
MDPI and ACS Style
Alawfi, M.S.; Albokhari, E.J. Comparative Chloroplast Genomics Reveals a Unique Gene Inversion in Two Cordia Trees (Cordiaceae). Forests 2023, 14, 1778. https://doi.org/10.3390/f14091778
AMA Style
Alawfi MS, Albokhari EJ. Comparative Chloroplast Genomics Reveals a Unique Gene Inversion in Two Cordia Trees (Cordiaceae). Forests. 2023; 14(9):1778. https://doi.org/10.3390/f14091778
Chicago/Turabian StyleAlawfi, Mohammad S., and Enas J. Albokhari. 2023. "Comparative Chloroplast Genomics Reveals a Unique Gene Inversion in Two Cordia Trees (Cordiaceae)" Forests 14, no. 9: 1778. https://doi.org/10.3390/f14091778
Note that from the first issue of 2016, this journal uses article numbers instead of page numbers. See further details here.