Article

Identifying the Determinants of the Increase in Native Forests in Southern Chile

1
Center of Economics for Sustainable Development (CEDES), Faculty of Economics and Government, Universidad San Sebastián, Valdivia 5090000, Chile
2
Institute of Agricultural Economics, Faculty of Agricultural and Food Sciences, Universidad Austral de Chile, Valdivia 5090000, Chile
3
Department of Forestry, Faculty of Agriculture and Forestry, Universidad Católica del Maule, Talca 3460000, Chile
*
Author to whom correspondence should be addressed.
Forests 2023, 14(9), 1926; https://doi.org/10.3390/f14091926
Submission received: 29 June 2023 / Revised: 30 August 2023 / Accepted: 12 September 2023 / Published: 21 September 2023

Abstract

:
In Chile, the native forest has suffered anthropic pressure that has resulted in the reduction in its surface and increased degradation, which has led to the development of public policies to reverse this scenario and encourage its sustainable management and conservation. This study examines the socioeconomic variables that influence the area increase in native forests in southern Chile, based on the analysis of 154 properties in the regions of Los Ríos, La Araucanía and Los Lagos. Georeferenced information from the 2015 SIMEF program survey and the Cadastre and Evaluation of Native Vegetation Resources of Chile were used. A Probit regression model was implemented, which associates a traceable increase in the native forest area with the variables regarding the owner: location, gender, age, schooling, management plan and technical advisory; and regarding the exploitation: farm size, percentage of native forest, scrub and forest plantations of the property and number of animal units. The econometric results show that smaller farms and those located in Los Lagos presented less probability of increasing their native forests. In the same way, an increase in the share of forest plantations area decreases the probability. Conversely, the scrub area share is related to the recovery of native forests in the sample. No significant effects of the variables associated with the implementation of management plans and technical assistance were found.

1. Introduction

Globally, deforestation is considered an undeniable factor of environmental changes in recent decades [1]. Deforestation is responsible for 10 to 17% of carbon emissions globally, which, since 2007, has led to intergovernmental efforts to mitigate them under initiatives such as REDD+, which implements programs to reduce the amount of forested land converted to other purposes [2].
Several reports across the globe have studied forest management and human dimensions. Dey et al. [3] argue that dramatic changes in climate, invasive species, human population and land use have created novel disturbance regimes challenging forest’s regeneration. Poudyal et al. [4] found that landowner’s decisions in the US south are influenced by socioeconomic characteristics, forest ownership motivation, management objectives and expected financial returns. The study of Joseph et al. [5] indicates that improvements of properties and education of landowners are key for the success of forest restoration programs in Peru. In the same line, Thorn et al. [6] indicate that knowledge and education are key for forest management practice adoption in El Salvador. A case in Kenya claimed that employment status, education, ownership, and access to market were relevant to improve participation in forest management [7]. Owusu et al. [8] identified land access and land security as determinants for landscape restoration in Tanzania. Adhikari et al. [9] noted that the enforcement of property rights is a key element for forest resource governance in Nepal; Pokharel et al. [10] indicate that sustainability index use is useful to identify key issues to enhance forest management in the same country. Silva et al. [11] argue that forest fire dynamics are determinant in landscape changes in Portugal. The design of systems that combine productivity and the features of traditional farm woodlands are crucial for biodiversity and ecosystem services [12].
In Chile, there are 14.7 million hectares of native forest, of which 4.7 million hectares, corresponding to 31.9% of the total area in the country, are distributed in the regions of La Araucanía, Los Ríos, and Los Lagos, 25.7% are within the National System of State Protected Areas (SNASPE) and the remaining 74.3% are in private hands [13]. The forests in this area correspond to the Valdivian rainforest ecoregion, which develops in Chile and adjacent areas of Argentina between parallels 35° and 48° S, including various types of forests, scrublands, wetlands, rivers, and lakes [14]. These forest ecosystems support fundamental ecological functions at local and global levels, such as nutrient recycling, soil protection, biodiversity conservation, climate regulation and hydrological control [15]. These functions support important ecosystem services that are the basis for various economic activities, such as water production for cities, aquaculture, sport fishing and ecotourism [16].
This ecoregion has been classified among those with conservation priority worldwide due to its status as a biodiversity hotspot, its high level of endemism and rapid rate of destruction and degradation due to anthropic causes [14,17,18]. Valdivian Temperate Rainforests are in a poor and fragile state of conservation due to the high human population density and conflicting land use demands on productive sites [19]. These forests have been subject to strong anthropic pressure due to the habilitation of land for agriculture and livestock, fires and burning, inappropriate management practices, the advance of cities and the consequent increase in the demand for fuelwood. In the year 1550, the native forest in the ecoregion covered 11.3 million hectares, a figure that decreased in 2007 to 5.8 million hectares, 51% of the original area [20]. A recent estimation for Arauco Province, part of the study area, indicates a native forest loss of 6.5% per year for the 2001–2016 period [21].
Additionally, another important factor of deforestation is the effect of livestock on the native forest. The main non-timber product obtained from the native forest is fodder, its extraction by the animals is known as browsing and brings benefits to the producers thanks to the production of meat for sale and/or self-consumption; however, this practice has not been valued by the technicians, nor by the Law, and produces forest degradation of the “bottom up” type, negatively affecting its natural regeneration [22].
Considering the case of Chile and its investments in the forestry sector, the State expressed its concern starting in 1931 and intensified when Decree Law 701 (DL701) was implemented in 1974 [23]; this provided subsidies corresponding to 13.5 million dollars per year between 1976 and 2010 [24], giving great importance to the forestry sector, which currently represents 2.1% of the national gross domestic product [3]. Despite the macroeconomic growth that this promotion brought about, it brought negative consequences in the social and environmental spheres since the municipalities with the greatest poverty in the country correspond to those with the highest proportion of forest plantations [23]. The practical effect of this economic incentive was the expansion from an area of 300,000 hectares in 1970 to an area of 3 million hectares in 2016 [25] and places the plantation of exotic species in the main land use, in which the native forest has been converted between the Maule region (35.5 S) and the coastal zone of the Los Ríos and La Araucanía regions (40 S), according to the study by Miranda et al. [26].
In this line, in 2012, Law 20,283, known as the Native Forest Law, was promulgated, which establishes a series of regulations and economic incentives for the recovery and promotion of the resource. However, during its first years of operation it was not very effective in meeting its objectives [27]. Between 2009 and 2012, 3.7% of the program budget was effectively assigned, demonstrating a low participation of users and forestry impact; however, the figures improved to an average of 19.6% for the period between 2013 and 2017 [28]. According to Reyes et al. [22], understanding the reasons for this situation requires a comprehensive analysis that addresses public policies, their programs, and of course, the reality of the people, who ultimately are the ones who decide how to manage the forest and the use or not use of the Law. Access to information, the link with institutions, subsidy amounts, infrastructure and technological means, cultural values, economic pressures, knowledge, and traditional management practices are some of the many variables that can be mentioned. Given that 74% of the native forest is in private hands, it is crucial to know the socioeconomic forces that may lead owners to make the decision to use it.
There is insufficient information on the disturbance recurrence and recovery of forests [29]. Additionally, most of the existing literature of deforestation and land use change are based on regional and even national and global macroscopic perspectives, while studies on smaller scale are rare [30].
With this background, the objective of this study was to determine the socioeconomic and productive variables behind the increase in native forest in the regions of La Araucanía, Los Ríos and Los Lagos in southern Chile. The area increase in native forest was investigate, because, in the cases that this area maintains, decreases are more complex to detect, and the natural tendency of the forest is to expand. To meet this objective, properties were identified in which an increase in the native forest area was evidenced in the period of interest (16–17 years) in the study area and an explanatory model was elaborated to identify probabilities of area increase in native forest according to the background of the decision makers and other relevant variables. We combined a farm-level survey and cadasters information.

2. Methods

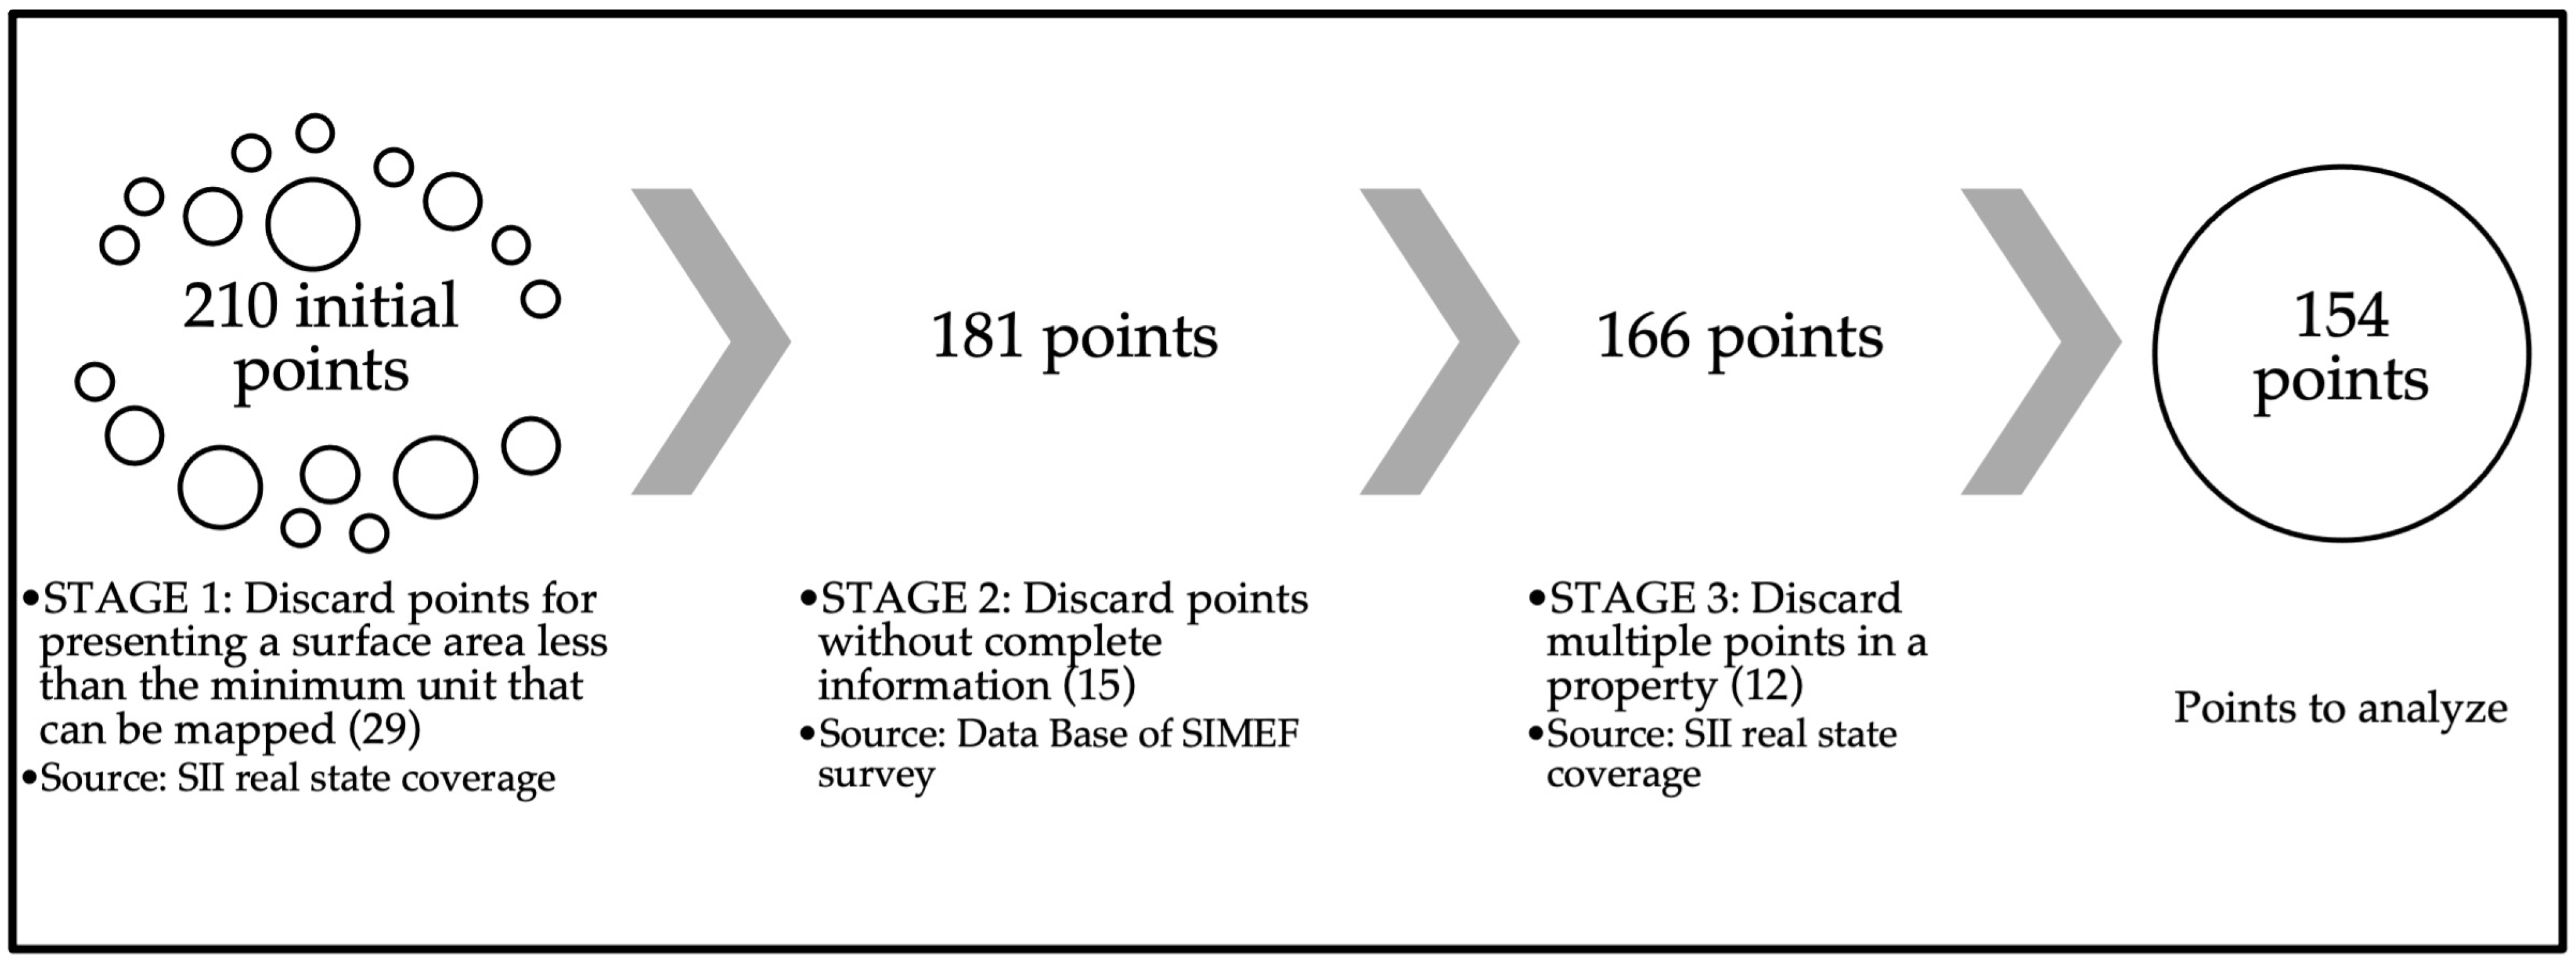
2.1. Information Sources and Study Area

A section of the database of the SIMEF program (SIMEF is the Integrated System for Monitoring Native Forest Ecosystems of Chile, it is a national program promoted by the Chilean Ministry of Agriculture and implemented collaboratively by the Chilean Forestry Institute (INFOR), the Chilean Forestry Corporation (CONAF) and the Chilean Information Center for Natural Resources (CIREN) to implement and strengthen an integrated monitoring and evaluation system of the country’s native forest ecosystems (https://simef.minagri.gob.cl, accessed on 2 June 2023) was used, in which a survey of socioeconomic information was carried out in the same georeferenced sampling points (Figure 1). Those points are used to monitor biophysical variables of the forests and, additionally, there is an application of surveys and semi-structured interviews carried out with the main decision makers of farms between the regions of Coquimbo and Magallanes. The survey began in August 2016 and ended in May 2017.
This study includes the regions of La Araucanía, Los Ríos and Los Lagos, between the parallels 38°14′ S and 43°07′ S and the meridians 73°59′ W and 71°30′ W. It corresponds to one of the five climatic macro-regions of the country, called the South Zone, and has a temperate oceanic climate (Cfb), according to the Köppen classification, due to the low height of the Andes, the influence of the west winds, its high rainfall, and oceanic conditions [31].
The process contemplated three successive stages. The analysis began with 210 points corresponding to the three regions, from which the following were discarded:
  • 29 for having a size smaller than the minimum mappable unit,
  • 15 not having complete information within the survey,
  • and 12 having more than one point within the limits of a property (which would mean that a subdivision process was experienced).
The above generated 154 points that were used in the analysis (Figure 1), this process is reflected in Figure 2.

2.2. Native and Mixed Forest Surface Estimation

In the case of forests, recovery is a part of resilience, joint with persistence and reorganization [32,33]. To estimate the recovery area of native forest at each analyzed property, the information sources described in Table 1 were used, using the open-source Geographic Information System software QGIS version 3.10.5. For this, the following layers were used:
  • Internal Revenue Service Roles: Layer that contains the boundaries of non-urban properties. These properties are identified by the role, which are numbers that are used to identify properties or real estate and that are unique at the community level.
  • Cadastre and Evaluation of Chile’s Native Vegetation Resources: Layers prepared by the National Forestry Corporation that classify land use classes and subclasses. For this study, the area of native and mixed forest defined by the following parameters were quantified [34]:
    Native Forest, ecosystem in which the tree layer is made up of native species that have a height ≥ 2 m and a crown cover ≥ 25%.
    Mixed Forest, which corresponds to a combination of two situations: mixture of native forest (adult or sapling) and planted species in proportions that fluctuate between 33% and 66% coverage. Native forest with feral exotics: corresponds to a mixture of native forest (adult or sapling) and exotic species that have regenerated naturally in proportions that fluctuate between 25% and 75% coverage for each of the categories that it contains.
  • Surveyed points: Spatially locates the owners who participated in the SIMEF survey and assigns them an identifier number made up of the region number and the surveyed number. The survey comprises the following sections: general information; decision maker information; income sources; productive characteristics; among other questions.
One of the limitations of the inputs of this study is to use the coverage of roles from the year 2000 for the De Los Ríos region since, in subsequent years, there may have been subdivisions in the properties that would not be reflected.
The information was projected in the WGS 84/UTM zone 19S coordinate reference system. For each region of the study, the intersection between the layer of properties and points was made to select the polygons of the properties that were surveyed, which gave rise to a new layer of information. With this new layer and that of the Vegetation Cadastre, vector operations (dissolve) were performed with respect to the fields of the attribute table corresponding to native forest and mixed forest. Subsequently, the respective attribute tables were exported to Excel and operations were carried out to determine the absolute and area change percentage of native and mixed forest (an example is contained in Figure 3).

2.3. The Probit Model

This study focused on the points where increases in native forest were detected due to the traceability of the information from the cadaster and the survey (see Figure 2). The dependent variable (Y) takes value 1 if it is possible to determine an increase in native forests, and 0 otherwise. To determine the probability of increase in the native forest area by the owners of the sample, a binary response model was estimated using Probabilistic Regression (Probit), Equation (1). The definition of the equation to be used is [35]:
P i = P r Y = 1 = P r U i 1 U i 0 = F U i = 1 2 π β X i e t / 2 d t
where:
Pi: probability of occurrence of the increase in native forest area on the property.
β: vector of coefficients.
Xi: set of variables that explain the increase in native forest area.
t: standardized normal variable.
This model is centered on the utility theory or the rational choice perspective of behavior, which is based on the premise that people can systematically rank their choices based on their preferences [35]. Recent studies have used this approach to link decisions to the socioeconomic and productive characteristics of forest owners, see [36,37,38,39,40,41,42]. Although in this study the dependent variable does not represent an explicit decision, there is an implicit decision to extract forest products, whether they are wood or non-wood, which would negatively affect the success of the variable in the analysis.
The model corresponds to a binary response, where the dependent variable can take the value 1 to indicate success in the analysis variable or 0 in the case of not doing so; it uses a cumulative distribution function that must cross a threshold so that the variable takes the value of 1. As the dependent variable is unobservable or latent, the maximum likelihood method must be used, assuming that the distribution of errors is normal. It has a latent variable that is determined by the explanatory variables detailed below [43].
In accordance with previous studies on forest management [36,37,38,39,40,41,42], it is expected that socioeconomic variables (age of the owner, schooling, among others) of the productive system (farm size, animal units, land use) and others, such as if it has current management plan or access to technical assistance, are influencing the probability that the area of native forest increases. For this study, the variables in Table 2 were considered, according to the information obtained from the survey.

3. Results and Discussion

The following results and their discussion are presented below: native forests area change in the timeframe of the study, characterization of the surveyed owners and the Probit probabilistic regression model. Table 3 summarizes the estimated changes in the timeframe through the identification of the increase in forest area in the surveyed properties using the QGIS software.

3.1. Change in the Area of Native Forests in the Timeframe

The total area of native forest surveyed is 161,265 hectares, corresponding to 3.43% of the area of native forest in the study area. According to the computation through the QGIS program, we found an increase in 83 of 154 cases (53.9%; see Table 3). We focused the analyses in this category given that it is possible to make a traceable monitoring of each point. The determination of the decreasing or the no change point is more complex given the source of information used in this analysis. The use of land covers to evaluate changes at farm level is a challenge given the different information sources used for this purpose.
The main limitation of this study is due to the fact that there have been methodological changes in the estimation of changes in the native forest cover which quantify changes in the class of land use due to changes in the classification criteria and do not correspond to changes on the surface, that is, the methodology is not consistent over time, making it a non-comparable system [44]. Due to this, emphasis was placed on the socioeconomic factors of the owners that showed an increase in the native forest evaluated through the geographic information system.

3.2. Characteristics of the Owners Surveyed

Based on the results obtained from the SIMEF survey completed in 2017 (Table 2), it was possible to characterize the owners through demographic variables and their exploitation.
The average age of the owners is 58 years, 87% are men and only 13% are women, they have an average education of 10 years, which is equivalent to incomplete secondary education, and inequality is also reflected with a standard deviation of 4.2 years.
Farm size has a mean value of 1047 ha and ranges from 0.5 to 50,000 ha. Given the heterogeneity of this variable, we decided to consider the four quartiles as dummy variables in the model. Regarding farm size, with a Gini coefficient of 0.91, Chile ranks second in inequality in terms of the distribution of land ownership at the Latin American level [45].
Farms have an average of 60.1% of their area corresponding to native forest, which has a great impact on the property economy since, as indicated by Reyes et al. [22], for many small and medium-sized owners, it works as an emergency resource usable when there are no other sources of income, and as a savings account that can be used intergenerationally. The main product that the owners extract is firewood, which is produced by 75% of them, while only 5% produce saw logs, which correspond to the main product to which added value can be given. This fact has generated several ecosystem conservation problems in the study area [46,47].
The scrub area share presented a mean of 3.4% at farm level, ranging from 0 to 65%. It is expected that this type of land cover allows the expansion of the surface of native forests. On the other hand, the forest plantation covers presented a mean value of 5%, ranging from 0 to 62%. We can expect a certain substitutive effect among native forests and plantations in economic terms given that both compete for labor and land in the farm.
Two key elements affecting the applicability of the Native Forest Law are the implementation of management plans and the access to technical advisory for this objective. In our sample, while one half of the producers presented access to technical advisory, only 21.4% of the forest owners presented this document.

3.3. Probit Model Fitted

The results obtained through the Probit probabilistic regression model (Table 4) elaborated in the STATA 15 software are detailed below.
The relative area of scrubs presented a significant and positive influence with the native forest recovery; an increase of 10% of scrub share generates an increase of 16% in the probability of finding a recovery of native forests at farm level. Conversely, the share of forest plantations presented a significant and negative effect. An increase of 10% of forests plantations generates an increased probability of 8%, approximately.
In relation to the total area of the farm, we detected a positive and significant effect of the farms in the second quartile compared to the smallest quartile (29.5%). This is consistent with what was observed by Reyes [48]; the probability of extracting wood from the native forest increases in smaller properties, being especially high in those with less than 150 hectares. This is an antecedent that suggests alternatives to meet the objectives of the Native Forest Law. To achieve improvements in the social sphere, with such a reduction in the inequality of income, it is convenient to focus on small landowners; however, in quantitative terms of the Native Forest area and according to the model results, it is better to focus on large landowners, as indicated by Reyes et al. [22]. In addition, these are the ones who can take advantage of the economies of scale [49].
The econometric results show that the location of the property is highly relevant. A significant and positive influence was detected when the owner belongs to the Los Ríos region; the probability of finding an increase in native forests increased by 27.7% in comparation to those located in the region of Los Lagos (omitted variable). Regarding the Los Lagos region, it is important to point out that it is the third region in which the Native Forest Law in Chile is least known, after the Coquimbo region and the Metropolitan region [48]. However, the Los Lagos region has the second largest area of native forest in the country [3], therefore the knowledge of the Native Forest Law should be in accordance with these proportions; as this is not the case, it indicates the urgency to implement a training design and forestry extension focused on this region.
The variables of gender, age, years of schooling, number of animal units, advice and current management plan did not show a significant effect on the probability of detecting an increase in native forest.
The selected model has an acceptable predictive power, correctly classifying 70.13% of the observations (Table 5). Additionally, we checked for multicollinearity problems evaluating the bivariate correlations among independent variables (Appendix A, Table A1).
Both the academic and policy literature debate the extent to which decentralized forest management programs in developing countries should incorporate poverty reduction goals. While some authors argue that targeting poverty reduction objectives will decrease the effectiveness of conservation because poorer households do not have the scale to promote conservation like wealthier households or commercial entities, others argue that the targeting of benefits towards the most vulnerable sectors would contribute to the effectiveness of conservation, either by promoting sustainable livelihoods or helping to legitimize conservation programming; however, the authors of this study emphasized the precarious stage of the evidence base for programming conservation plans and their social effects [2].
DL 701 was effective in terms of establishing economic growth as a result of promoting afforestation, however, as the concept of development evolved and the externalities of DL 701 began to become evident [50], the challenge of a forestry policy according to the evolution of this concept became clear, requiring further interdisciplinary studies. Despite the fact that the Evaluating Panel considered it necessary to “Deepen, through specific studies, the knowledge about the target population and about the reasons for the low participation of native forest owners in the bonus system of the Program” [49], the percentages of participation show such low levels that it is considered necessary to focus more attention on the Law than on the owners. This fact is relevant in view of Nationally Determined Contributions to preclude the worst effects of climate change; Chile is committed to conserve one hundred thousand hectares of native forests [51].
According to Skewes et al. [52], the living practices that contribute to the regeneration of the Chilean temperate forest are related to the understanding of relationships between species such as families and associations, where trees play a significant role; however, it occurs in the context of hybrid landscapes and is strongly influenced by the historical circumstances faced by communities. Incentives for forest conservation in Chile can be improved on to consider the actual private cost of conservation and the ecosystem benefits of forest conservation [53].
According to Reid et al. [54], due to the long timeframes, costs and complex social dynamics associated with temperate forest restoration and rehabilitation, innovative inter-generational policy, funding, and business solutions, together with careful consideration of monitoring and evaluation processes and social understanding are required to ensure the success of multi-decadal and multi-century projects. In this line, Donoso et al. [55] argue that there are several opportunities for silvicultural systems to contribute to sustainable management, reverse forest degradation and cope with climate change, developing mixed- and single-species productive and carbon-rich forests with a greater adaptive capacity. According to Auffret & Thomas [56], it is important to consider multiple drivers of global change when trying to understand, manage and predict biodiversity in the future.

4. Conclusions

In our study, we identified 83 of 154 properties in which there was an area increase in native forest according to the analysis carried out through the geographic information system. These systems are characterized by presenting differences in terms of gender; schooling; farm size and, in general, the land use at farm level.
According to the explanatory model, it was possible to identify that the variable relative area of scrubs positively affects the probability of increasing the area of native forest, and that the variable forests plantation share negatively affects the probabilities of increasing the area of native forest. Small farms and those located in the region of Los Lagos were less likely to increase their native forest surface. No significant results were found for the variables associated with management plans and technical assistance. Our results suggest the importance of improving the understanding of human dimensions for forest decision management. The regulations and incentives design must consider the multiple realities, characteristics, and motivations of forest decision makers to achieve sustainability goals.
In future studies, it is necessary to carry out analyses in larger areas, considering social and psychological factors that were not captured by the survey that could affect the decision-making processes of the owners. Additionally, it is necessary to advance in studies considering spatial or neighborhood effects, given that ecosystem functions cannot be related to farm or administrative limits.
Some specific proposals for the improvement of the Law, taking into account the results of this study, include the standardization of cartographic monitoring with a consistent and comparable methodology over time [44]; promote the addition of value of sawn timber and encourage the formal market in such a way that the resource acquires competitiveness, for these purposes, there are already precedents of technical-economic studies [57]; and finally, study in depth the table of costs of subsidized activities, in such a way that they represent the real value of activities, and adjust based on the realities of variables such as the accessibility of the property among others.

Author Contributions

Conceptualization, L.R.; Data curation, L.R. and J.G.; Formal analysis, L.R., J.G. and P.R.; Investigation, L.R., J.G., P.R. and C.B.; Methodology, L.R., P.R. and C.B.; Writing—original draft, L.R. and J.G.; Writing—review and editing, L.R., P.R. and C.B. All authors have read and agreed to the published version of the manuscript.

Funding

L.R. thanks the Vice-rectorate for Research (VRID) of Universidad San Sebastián.

Data Availability Statement

Not applicable.

Acknowledgments

The authors thank INFOR for the access to data used in this study, specifically the SIMEF program. Also, the authors thank René Reyes of INFOR for his valuable comments and suggestions.

Conflicts of Interest

The authors declare no conflict of interest.

Appendix A

Table A1. Correlations among independent variables.
VariableAgeSchoolingAnimal UnitsNative Forests ShareScrub ShareForests Plantations ShareFarm Size Q1 (Omitted)Farm Size Q2Farm Size Q3Farm Size Q4AraucaníaLos RíosLos Lagos (Omitted)GenderForest Management PlanTechnical Advisory
Age1
Schooling−0.291
Animal units−0.100.151
Native forests share−0.100.08−0.111
Scrub share−0.06−0.04−0.07−0.161
Forest plantations share−0.020.08−0.05−0.17−0.111
Farm size Q1 (omitted)−0.02−0.36−0.13−0.06−0.05−0.031
Farm size Q20.07−0.18−0.130.040.01−0.04−0.331
Farm size Q30.110.21−0.02−0.24−0.020.10−0.33−0.331
Farm size Q4−0.160.330.270.250.07−0.03−0.33−0.33−0.331
Araucanía0.190.03−0.08−0.13−0.150.230.060.060.01−0.121
Los Ríos−0.080.030.09−0.060.320.07−0.25−0.100.010.34−0.341
Los Lagos (omitted)−0.06−0.05−0.030.15−0.20−0.230.210.06−0.01−0.25−0.38−0.731
Gender0.02−0.06−0.080.130.030.01−0.030.01−0.070.08−0.150.040.071
Forest management plan−0.120.180.100.18−0.060.14−0.230.030.020.170.090.02−0.090.091
Technical advisory0.080.250.160.16−0.160.14−0.33−0.030.040.31−0.020.11−0.090.120.431

References

  1. Bologna, M.; Aquino, G. Deforestation and world population sustainability: A quantitative analysis. Sci. Rep. 2020, 10, 7631. [Google Scholar] [CrossRef]
  2. Samii, C.; Lisiecki, M.; Kulkarni, P.; Paler, L.; Chavis, L. Decentralized Forest Management for Reducing Deforestation and Poverty in Low-and Middle-Income Countries: A Systematic Review. Systematic Review 16, International Initiative for Impact Evaluation 3ie. 2015. Available online: http://3ieimpact.org/evidence-hub/publications/systematic-reviews/decentralised-forest-management-reducing-deforestation (accessed on 25 April 2023).
  3. Dey, D.C.; Knapp, B.O.; Battaglia, M.A.; Deal, R.L.; Hart, J.L.; O’Hara, K.L.; Schweitzer, C.J.; Schuler, T.M. Barriers to natural regeneration in temperate forests across the USA. New For. 2019, 50, 11–40. [Google Scholar] [CrossRef]
  4. Poudyal, N.C.; Joshi, O.; Hodges, D.G.; Hoyt, K. Factors Related with Nonindustrial Private Forest Landowners’ Forest Conversion Decision in Cumberland Plateau, Tennessee. For. Sci. 2014, 60, 988–993. [Google Scholar] [CrossRef]
  5. Joseph, L.; Yaranga Cano, R.M.; Arizapana-Almonacid, M.; Venelli Pyles, M.; Freire de Siqueira, F.; van den Berg, E. Socioeconomic Conditions and Landowners’ Perception Affect the Intention to Restore Polylepis Forests in the Central Andes of Peru. Forests 2021, 12, 118. [Google Scholar] [CrossRef]
  6. Thorn, S.; Leverkus, A.B.; Thorn, C.J.; Beudert, B. Education and knowledge determine preference for bark beetle control measures in El Salvador. J. Environ. Manag. 2019, 232, 138–144. [Google Scholar] [CrossRef] [PubMed]
  7. Okumu, B.; Muchapondwa, E. Determinants of successful collective management of forest resources: Evidence from Kenyan Community Forest Associations. For. Policy Econ. 2020, 113, 102122. [Google Scholar] [CrossRef]
  8. Owusu, R.; Kimengsi, J.N.; Moyo, F. Community-based Forest Landscape Restoration (FLR): Determinants and policy implications in Tanzania. Land Use Policy 2021, 109, 105664. [Google Scholar] [CrossRef]
  9. Adhikari, S.; Kingi, T.; Ganesh, S. Incentives for community participation in the governance and management of common property resources: The case of community forest management in Nepal. For. Policy Econ. 2014, 44, 1–9. [Google Scholar] [CrossRef]
  10. Pokharel, R.K.; Neupane, P.R.; Tiwari, K.R.; Köhl, M. Assessing the sustainability in community-based forestry: A case from Nepal. For. Policy Econ. 2015, 58, 75–84. [Google Scholar] [CrossRef]
  11. Silva, J.S.; Vaz, P.; Moreira, F.; Catry, F.; Rego, F.C. Wildfires as a major driver of landscape dynamics in three fire-prone areas of Portugal. Landsc. Urban Plan. 2011, 101, 349–358. [Google Scholar] [CrossRef]
  12. Plieninger, T.; Schaich, H. Socialist and postsocialist land-use legacies determine farm woodland composition and structure: Lessons from Eastern Germany. Eur. J. For. Res. 2014, 133, 597–610. [Google Scholar] [CrossRef]
  13. INFOR. Anuario Forestal 2019. Boletín Estadístico N° 168; Ministerio de Agricultura: Instituto Forestal, Santiago, Chile, 2020; Available online: https://wef.infor.cl/index.php/publicaciones/boletines-estadisticos/anuario-forestal (accessed on 25 April 2023).
  14. Olson, D.M.; Dinerstein, E. The Global 200: Priority ecoregions for global conservation. Ann. Mo. Bot. Gard. 2002, 89, 199–224. [Google Scholar] [CrossRef]
  15. Jullien, C.; Nahuelhual, L.; Mazzorana, B.; Aguayo, M. Assessment of the ecosystem service of water regulation under scenarios of conservation of native vegetation and expansion of forest plantations in south-central Chile. Bosque Valdivia 2018, 39, 277–289. [Google Scholar] [CrossRef]
  16. Oyarzún, C.E.; Nahuelhual, L.; Núñez, D. Los servicios ecosistémicos del bosque templado lluvioso: Producción de agua y su valoración económica. Ambiente Desarro. 2005, 21, 87–98. [Google Scholar]
  17. Heilmayr, R.; Echeverría, C.; Lambin, E.F. Impacts of Chilean forest subsidies on forest cover, carbon and biodiversity. Nat. Sustain. 2020, 3, 701–709. [Google Scholar] [CrossRef]
  18. Echeverría, C.; Newton, A.; Nahuelhual, L.; Coomes, D.; Rey-Benayas, J.M. How landscapes change: Integration of spatial patterns and human processes in temperate landscapes of southern Chile. Appl. Geogr. 2012, 32, 822–831. [Google Scholar] [CrossRef]
  19. Donoso, P.J.; Romero, J.E. Towards a New Forest Model for Chile: Managing Forest Ecosystems to Increase Their Social, Ecological and Economic Benefits. In Ecological Economic and Socio Ecological Strategies for Forest Conservation; Fuders, F., Donoso, P., Eds.; Springer: Cham, Switzerland, 2020. [Google Scholar] [CrossRef]
  20. Lara, A.; Solari, M.E.; Prieto, M.D.; Peña, M.P. Reconstrucción de la cobertura de la vegetación y uso del suelo hacia 1550 y sus cambios a 2007 en la ecorregión de los bosques valdivianos lluviosos de Chile (35°–43° 30′ S). Bosque Valdivia 2012, 33, 13–23. [Google Scholar] [CrossRef]
  21. Jaque Castillo, E.; Ojeda, C.G.; Fuentes Robles, R. Landscape fragmentation at Arauco Province in the Chilean forestry model context (1976–2916). Land 2022, 11, 1992. [Google Scholar] [CrossRef]
  22. Reyes, R.; Blanco, G.; Laraguirre, A.; Rojas, F. Ley de Bosque Nativo: Desafíos Socioculturales para su Implementación; Instituto Forestal y Universidad Austral de Chile, Informe Interno: Santiago, Chile, 2016; 82p. [Google Scholar] [CrossRef]
  23. Reyes, R.; Sepúlveda, C.; Astorga, L. Gobernanza del sector forestal chileno: Tensiones y conflictos entre las fuerzas de mercado y las demandas de la ciudadanía. In Ecología Forestal. Bases Para el Manejo Sustentable y Conservación de los Bosques Nativos de Chile; Donoso, C., González, M.E., Lara, A., Eds.; Ediciones UACh: Valdivia, Chile, 2014; pp. 693–720. [Google Scholar]
  24. Cabaña Chávez, C. Reseña Histórica de la Aplicación del DL 701, de 1974, Sobre Fomento Forestal; Corporación Nacional Forestal: Santiago, Chile, 2011; Available online: https://www.corma.cl/wp-content/uploads/2020/03/resena-historica-de-la-aplicacion-del-dl-701-de-1974-sobre-fomento-forestal.pdf (accessed on 25 April 2023).
  25. INFOR. Anuario Forestal 2016. Boletín Estadístico N° 154; Ministerio de Agricultura, Instituto Forestal: Santiago, Chile, 2016. [Google Scholar] [CrossRef]
  26. Miranda, A.; Altamirano, A.; Cayuela, L.; Lara, A.; González, M. Native Forest loss in the Chilean biodiversity hotspot: Revealing the evidence. Reg. Environ. Chang. 2017, 17, 285–297. [Google Scholar] [CrossRef]
  27. De la Fuente, J.; Calderón, C.; Torres, J. Informe Final Programa Ley de Bosque Nativo; Ministerio de Agricultura: Santiago, Chile, 2013; Available online: https://www.dipres.gob.cl/597/articles-139791_informe_final.pdf (accessed on 24 April 2023).
  28. DIPRES. Resumen Ejecutivo e Informe de Comentarios a los Resultados de la Evaluación a Programas Gubernamentales Programa Ley del Bosque Nativo. Dirección de Presupuestos, Gobierno de Chile. 2013. Available online: https://www.dipres.gob.cl/597/articles-139791_r_ejecutivo_institucional.pdf (accessed on 25 April 2023).
  29. Lapola, D.; Pinho, P.; Barlow, J.; Aragao, L.; Berenguer, E.; Carmenta, R.; Liddy, H.M.; Seixas, H.; Silva, C.V.J.; Silva-Junior, C.H.L.; et al. The drivers and impacts of Amazon Forest degradation. Science 2023, 379, 6630. [Google Scholar] [CrossRef]
  30. Wu, W.; Zhu, Y.; Wang, Y. Spatio-Temporal Pattern, Evolution and Influencing Factors of Forest Carbon Sinks in Zhejiang Province, China. Forests 2023, 14, 445. [Google Scholar] [CrossRef]
  31. Sarricolea, P.; Herrera-Ossandon, M.; Meseguer-Ruíz, O. Climatic regionalization of continental Chile. J. Maps 2017, 13, 66–73. [Google Scholar] [CrossRef]
  32. Rull, V.; Vegas-Vilarrúbia, T. Resilience of Pyrenean Forests after Recurrent Historical Deforestations. Forests 2023, 14, 567. [Google Scholar] [CrossRef]
  33. Falk, D.A.; van Mantgem, P.J.; Keeley, J.E.; Gregg, R.M.; Guiterman, C.H.; Tepley, A.J.; Young, D.J.N.; Marshall, L.A. Mechanisms of forest resilience. For. Ecol. Manag. 2022, 512, 120–129. [Google Scholar] [CrossRef]
  34. CONAF. Monitoreo de Cambios, Corrección Cartográfica y Actualización del Catastro de los Recursos Vegetacionales Nativos de la Región del Maule. Resumen Ejecutivo. 2018; 50p. Available online: http://biblioteca.digital.gob.cl/handle/123456789/2341 (accessed on 24 April 2023).
  35. Gujarati, D.N.; Porter, D.C.; Gunasekart, S. Basic Econometrics; Tata McGraw-Hill Education: New York, NY, USA, 2012. [Google Scholar]
  36. Ekanayake, E.M.B.P.; Xie, Y.; Ahmad, S. Rural Residents’ Participation Intention in Community Forestry-Challenge and Prospect of Community Forestry in Sri Lanka. Forests 2021, 12, 1050. [Google Scholar] [CrossRef]
  37. Garcia, S.; Petucco, C.; Thorsen, B.J.; Vedel, S.E. Modelling the Choice Between Multiple-Use vs. Specialized Forest Management and its Impact on Forest Management Costs. Environ. Model. Assess. 2021, 26, 591–608. [Google Scholar] [CrossRef]
  38. Li, M.; Yu, B.; Zheng, B.; Gao, L. Collection of Non-Timber Forest Products in Chinese Giant Panda Reserves: The Effect of Religious Beliefs. Forests 2021, 12, 46. [Google Scholar] [CrossRef]
  39. Bashir, A.; Sjølie, H.K.; Solberg, B. Determinants of Nonindustrial Private Forest Owners’ Willingness to Harvest Timber in Norway. Forests 2020, 11, 60. [Google Scholar] [CrossRef]
  40. Tschopp, M.; Ceddia, M.G.; Inguiggiato, C.; Bardsley, N.O.; Hernández, H. Understanding the adoption of sustainable silvopastoral practices in Northern Argentina: What is the role of land tenure? Land Use Policy 2020, 99, 105092. [Google Scholar] [CrossRef]
  41. Zhunusova, E.; Sen, L.T.; Schröder, J.M.; Ziegler, S.; Dieter, M.; Günter, S. Smallholder decision-making on sawlog production: The case of Acacia plantation owners in central Vietnam. Forests 2019, 10, 969. [Google Scholar] [CrossRef]
  42. Min, S.; Bai, J.; Huang, J.; Waibel, H. Willingness of smallholder rubber farmers to participate in ecosystem protection: Effects of household wealth and environmental awareness. For. Policy Econ. 2018, 87, 70–84. [Google Scholar] [CrossRef]
  43. Long, J.S. Regression Models for Categorical and Limited Dependent Variables; Sage: Southend Oaks, CA, USA, 1997; Volume 7. [Google Scholar]
  44. Miranda, A.; Lara, A.; Altamirano, A.; Zamorano-Elgueta, C.; Hernández, H.J.; González, M.E.; Pauchard, A.; Promis, A. Monitoreo de la superficie de los bosques nativos de Chile: Un desafío pendiente. Bosque Valdivia 2018, 39, 265–275. [Google Scholar] [CrossRef]
  45. Guereña, A. Unearthed: Land, Power, and Inequality in Latin America. Oxfam International. 2016; 21p. Available online: https://oi-files-d8-prod.s3.eu-west-2.amazonaws.com/s3fs-public/file_attachments/bp-land-power-inequality-latin-america-301116-en.pdf (accessed on 25 April 2023).
  46. Alaniz, A.J.; Smith-Ramírez, C.; Rendón-Funes, A.; Hidalgo-Corrotea, C.; Carvajal, M.A.; Vergara, P.M.; Fuentes, N. Multiscale spatial analysis of headwater vulnerability in South-Central Chile reveals a high threat due to deforestation and climate change. Sci. Total Environ. 2022, 849, 157930. [Google Scholar] [CrossRef] [PubMed]
  47. Peña-Cortés, F.; Pincheira-Ulbrich, J.; Bertrán, C.; Tapia, J.; Hauenstein, E.; Fernández, E.; Rozas, D. A study of the geographic distribution of swamp forest in the coastal zone of the Araucanía Region, Chile. Appl. Geogr. 2011, 31, 545–555. [Google Scholar] [CrossRef]
  48. Reyes, R. Promotores Socioeconómicos de la Pérdida y Degradación del Bosque Nativo. Informe de Avance. Sistema Integrado de Monitoreo de Ecosistemas Forestales. 2018. Available online: https://simef.minagri.gob.cl/bibliotecadigital/handle/20.500.12978/12920 (accessed on 25 April 2023).
  49. DIPRES. Evaluación de Resultados del Decreto Ley N° 701 de 1974. Dirección de Presupuestos, Gobierno de Chile. 2014. Available online: https://www.dipres.gob.cl/597/articles-141195_informe_final.pdf (accessed on 24 April 2023).
  50. Bottaro, G.; Roco, L.; Pettenella, D.; Micheletti, S.; Vanhulst, J. Forest Plantations’ Externalities: An Application of the Analytic Hierarchy Process to Non-Industrial Forest Owners in Central Chile. Forests 2018, 9, 141. [Google Scholar] [CrossRef]
  51. CoatarPeter, P.; Gareau, P.J. Combining world-system and world polity approaches to analyze international environmental governance: A case study of forest governance in Chile. Environ. Sociol. 2023, 9, 67–79. [Google Scholar] [CrossRef]
  52. Skewes, J.C.; Guerra, D.; Rebolledo, S.; Palma, L. The forest recovery: Landscape, practices and ontologies in southern Chile. Estud. Atacameños 2020, 65, 385–405. [Google Scholar] [CrossRef]
  53. Manuschevich, D.; Sarricolea, P.; Galleguillos, M. Integrating socio-ecological dynamics into land use policy outcomes: A spatial scenario approach for native forest conservation in south-central Chile. Land Use Policy 2019, 84, 31–42. [Google Scholar] [CrossRef]
  54. Reid, N.; Dickinson, Y.; Smith, R.; Taylor, M.; Norton, D. Temperate Forest Restoration. In Ecological Restoration; Florentine, S., Gibson-Roy, P., Dixon, K.W., Broadhurst, L., Eds.; Springer: Cham, Switzerland, 2023. [Google Scholar] [CrossRef]
  55. Donoso, P.J.; Promis, A.; Loguercio, G.A.; Beltrán, H.A.; Caselli, M.; Chauchard, L.M.; Cruz, G.; González, M.; Martínez, G.; Navarro, C.; et al. Silviculture of South American temperate native forests. N. Z. J. For. Sci. 2022, 52, 2. [Google Scholar] [CrossRef]
  56. Auffret, A.G.; Thomas, A.D. Synergistic and antagonistic effects of land use and non-native species on community responses to climate change. Glob. Chang. Biol. 2019, 25, 4303–4314. [Google Scholar] [CrossRef]
  57. Emanuelli, P.; Milla, F. Alternativas de Productos Madereros del Bosque Nativo Chileno. Corporación Nacional Forestal. Sociedad Alemana de Cooperación Técnica (GTZ). 2006. Available online: http://dspace.utalca.cl/bitstream/1950/10408/1/42300.pdf (accessed on 25 April 2023).
Figure 1. Location of surveyed application points in the study area.
Forests 14 01926 g001
Figure 2. Selection process of points to analyze.
Forests 14 01926 g002
Figure 3. Properties in the northern zone of the Los Lagos region that include surveyed points (left) and surface area of native and mixed forest in these properties (right).
Forests 14 01926 g003
Table 1. Years of the layers used and period covered for the quantification of the change in native and mixed forest in the study area.
RegionYear of the Properties LayerYear of the First Layer of the CadastreYear of the Second Layer of the CadastreTimeframe of Analysis
(Years)
Araucanía20001997201417
Los Ríos20001997201417
Los Lagos20161997201316
Table 2. Sociodemographic and farm variables considered in the model and their expected effect on the increase in native forest.
Variable NameDescriptionMeanS. D.Expected Effect
Continuous
AgeAge of the owner or decision maker in years57.713.4(−)
SchoolingNumber of years of formal education of the owner10.04.2(+)
Animal unitsNumber of animal units (AU) in the farm112.8437.6(−)
Native forests shareProportion of native forest area in relation to the total farm size (%)60.127.7(+)
Scrub shareProportion of scrub area in relation to the total farm size (%)3.49.2(+)
Forest plantations shareProportion of forest plantations area in relation to the total farm size (%)5.012.0(−)
Binary
Farm size Q1Equals 1 if the farm size is in the first quartile (farm size > 30 ha), 0 otherwise0.25-(−)
Farm size Q2Equals 1 if the farm size is in the second quartile (30 ha ≤ farm size > 99.5 ha), 0 otherwise0.25-(−)
Farm size Q3Equals 1 if the farm size is in the third quartile (99.5 ha ≤ farm size > 565 ha), 0 otherwise0.25-(+)
Farm size Q4Equals 1 if the farm size is in the fourth quartile (farm size ≥ 565 ha), 0 otherwise0.25-(+)
AraucaníaEquals 1 if the farm is located in La Araucanía region, 0 otherwise0.15-(+,−)
Los RíosEquals 1 if the farm is located in Los Ríos region, 0 otherwise0.40-(+,−)
Los LagosEquals 1 if the farm is located in Los Lagos region, 0 otherwise, omitted variable0.45-(+,−)
GenderEquals 1 if the owner indicates belonging to the male gender, 0 otherwise0.83-(+,−)
Forest management planEquals 1 if the owner indicates to have a forest management plan, 0 otherwise0.21-(+)
Technical advisoryEquals 1 if the owner indicates to have technical advisory for forest management, 0 otherwise0.50-(+)
Note: Animal Units (AU) are calculated using a factor which converts animals of different species or sizes into equivalent units (One AU is equivalent to a 400 kg cow approximately). An example is available at: https://www.iowadnr.gov/Portals/idnr/uploads/forms/5420020.pdf (accessed on 20 June 2023).
Table 3. Classification of cases in the three regions of study.
Situation RegionChange in Native Forest Area Calculated in QGIS
DecreaseNo ChangesIncrease
Araucanía21012
Los Ríos9945
Los Lagos182328
Total294283
Table 4. Estimation of the Probit regression model.
VariableCoefficientRobust Standard ErrorMarginal Effects
Age−0.00600.0088−0.0023792
Schooling0.00910.03130.0035906
Animal units−0.00010.0002−0.0000482
Native forests share0.00020.00460.0000717
Scrub share0.0408 **0.01900.0160993 **
Forest plantations share−0.0201 **0.0100−0.0079353 **
Farm size Q20.8089 ***0.31740.2954345 ***
Farm size Q30.38870.33750.1493749
Farm size Q40.50680.40710.1924921
Araucanía0.47340.35550.1778919
Los Ríos0.7262 ***0.27390.2766469 ***
Gender0.26960.28680.1062543
Forest management plan0.25030.29690.0970840
Technical advisory−0.29960.2514−0.1176826
constant−0.63240.8134-
Log pseudolikelihood−89.28
Pseudo R215.99%
N154
Notes: **: p < 0.05; ***: p < 0.01. command probit of STATA 15.
Table 5. Prediction of the econometric model.
Classified by the ModelOriginal Data
IncreaseOther
Classified positive62 (74.7%)25 (35.2%)
Classified negative21 (25.3%)46 (64.8%)
Mean70.13%
Disclaimer/Publisher’s Note: The statements, opinions and data contained in all publications are solely those of the individual author(s) and contributor(s) and not of MDPI and/or the editor(s). MDPI and/or the editor(s) disclaim responsibility for any injury to people or property resulting from any ideas, methods, instructions or products referred to in the content.

