
Water-Related Properties of Wood after Thermal Modification in Closed Process under Pressure in Nitrogen

1
Latvian State Institute of Wood Chemistry, 27 Dzerbenes Street, LV-1006 Riga, Latvia
2
Institute of Polymer Materials, Faculty of Materials Science and Applied Chemistry, Riga Technical University, 3/7 Paula Valdena Street, LV-1048 Riga, Latvia
*
Author to whom correspondence should be addressed.
Forests 2024, 15(1), 140; https://doi.org/10.3390/f15010140
Submission received: 21 December 2023
/
Revised: 4 January 2024
/
Accepted: 8 January 2024
/
Published: 9 January 2024
(This article belongs to the Special Issue Recent Advances in Wood Modification and Wood Functionalization Research)
Abstract
:Silver birch (Betula pendula) and Scots pine (Pinus sylvestris) wood boards (1000 × 100 × 25 mm) were thermally modified in a 340 L pilot-scale device in nitrogen with a special focus on increasing dimensional stability and reducing hydrophilicity. The research expands our understanding of the TM process in a closed system under pressure of nitrogen and its impact on the water absorption capabilities of wood. Several thermal modification (TM) parameters were tested, including temperature (160–180 °C), maximum temperature duration (30–180 min), and TM chamber initial pressure (3–6 bar). TM wood dimensional changes, mass loss (ML), equilibrium moisture content (EMC), and anti-swelling efficiency (ASE) were determined to characterize the TM process intensity and evaluate the hydrophilicity. Birch wood exhibited a higher ML (5.9%–12%) than pine wood (2.6%–9%) after TM. TM caused a shrinkage in the tangential, radial, and total volume of both wood species. The TM birch wood ASE values varied from 22% to 69%, while the pine wood ASE was 27% to 58%. The cell wall total water capacity (CWTWC) of TM wood was greatly reduced. The EMC and volumetric swelling (VS) of TM birch and pine wood were 29% to 67% lower, respectively, at all relative humidities (65, 75, and 95%).
Keywords:
birch; pine; thermal modification; nitrogen; pressure; dimensional stability; moisture content1. Introduction
Wood has many appealing characteristics, including a beautiful appearance, good strength, low density, and excellent insulating qualities. It readily absorbs moisture from its surroundings, creating swelling, and subsequent desorption causes shrinkage. Unfortunately, once the forces exceed the wood’s fracture strength, it will creep and break in reaction to these wetting–drying loads. Furthermore, it tends to develop longer and deeper cracks at later stages. These defects also contribute to increased water uptake, thus producing optimal moisture conditions for wood-decay fungi to attack. Wood modification can overcome various drawbacks of wood, including poor dimensional stability, poor biological durability, low surface hardness and wear, fire retardancy, high equilibrium moisture content, and poor weathering stability.
According to statistics collected, thermal modification (TM) processes dominate the global commercial production of treated wood, producing 1.11 million m3/year. Acetylation accounts for 120 thousand m3/year of commercialized processes, while furfurylation accounts for 45 thousand m3/year. Another 330 thousand m3/year of global production is predicted for various methods, primarily based on resin-based systems (e.g., Impreg- and Compreg-based processes) [1,2]. Oy Lunawood Ltd. (Thermowood process) is the largest TM manufacturer, with an annual manufacturing capacity of 155 thousand m3. The Estonian company Thermory AS (Wood treatment technology process) also has a high capacity of approximately 90 thousand m3 per year spread across five production facilities in Estonia, Finland, and Belarus [3]. TM in nitrogen has not grown much in terms of market share, and data on current production volumes are unavailable. Overall, the commercial amount of modified wood is still dwarfed by that of preservative-treated wood (about 21 million m3 in the United States alone each year and 6.5 million m3 in Europe) [1,4].
Numerous wood-based TM processes have entered the European market, mostly varying in terms of pressure conditions and oxygen exclusion. Table 1 provides a summary of the most popular commercialized processes [1,3,5,6] and treatment conditions.
There are two types of TM technologies: open-system and closed-system technologies. The majority of open systems are upgraded classic drying ovens. A pyrolysis technique at high temperature and normal atmospheric pressure is used to perform TM on wood. The world’s largest TM wood factories, including the International ThermoWood Association, treat wood in a water steam environment at atmospheric pressure. Closed systems hydrolyze wood materials at high pressure but at a lower temperature, so the pressure serves as a temperature substitute. The fundamental advantage of TM in steam at higher pressure over atmospheric pressure treatment is lower maximum treatment temperatures and, as a result, cheaper energy costs. Another advantage is that the entire TM time from heating, incineration, and cooling to room temperature is reduced. The total processing time in a closed-system process is 22–30 h until the material has completely cooled. ThermoWood requires up to 70 h to complete the process.
The Rétification process is distinguished from other thermal modification procedures by the use of nitrogen as the modification medium. In specific equipment, pre-dried (Wrel = 12%) wood is slowly heated to 210–240 °C in a nitrogen environment with an oxygen content below 2%. The maximum pressure in the system during the TM period is questionable. There is no mention of it in the literature. Wood Treatment Technology recently launched a new closed-system TM procedure in a nitrogen atmosphere. The TM process under pressure in nitrogen has a higher heat transfer capacity and requires no energy to convert water to steam. The procedure is carried out at higher pressures (up to 18 bar), with the elevated pressure acting as a temperature replacement. As a result, the maximum modification temperature and processing cycle time can be reduced to 8–12 h. In terms of manufacturing costs and productivity, the closed-type process in nitrogen appears to be a superior technology that necessitates more extensive scientific research. The scientific literature contains a wealth of information about the TM of several wood species in a nitrogen environment at atmospheric pressure. However, insufficient information on the TM process in a nitrogen environment at elevated pressure and the qualities of the TM wood is known dating back to the 1970s and 1980s. The dimensional stabilization of wood by the Feuchte–Wärme–Druck process was evaluated in a 1.8 m3 volume pilot-scale reactor at 180–200 °C in an inert gas environment of 8–10 bar. Heat/pressure treatment of beech, birch, poplar, pine, and spruce wood, fibre, particle board, and plywood is demonstrated. After treatment, there is a 50%–80% reduction in swelling and shrinkage, an improvement in resistance to fungi and insects, and an improvement in the remaining physical and mechanical wood qualities [7]. When the maximum temperature is held, it appears that the pressure in the reactor remains constant. However, the entire process time (5–15 h) is ambiguous and not specified in the temperature and time plan, and the heating/cooling speed is suspect.
Weathering stability, equilibrium moisture content (EMC), and swelling of European spruce (Picea abies) and beech (Fagus sylvatica) wood were investigated after TM in nitrogen at 175 °C for 2 h and 185 °C for 3 h at 10 bar pressure. The data are difficult to compare because EMC (at relative humidity (RH) 30, 65, 80, and 100%) and swelling are presented as percentage reductions. According to the data provided, the approximate EMC values for TM spruce are 6%–8% (65% of RH) and 17%–20% (100% of RH). The untreated control EMC values were 12%–13% and 30%, respectively. TM beech wood EMC was 5%–7% (65% RH) and 13%–23% (100% RH), whereas untreated control EMC was 10% and 30%, respectively [8]. In comparison to other specimens, the EMC of TM beech wood at 185 °C was the lowest.
TM in a nitrogen environment was generally conducted in small-sized laboratory reactors for 1 to 8 h, with a total processing period of 20 to 50 h, over a wide maximum temperature range of 130 to 260 °C in a variety of experiments [9,10,11,12,13,14,15,16]. Larch (Larix gmelinii) and red oak (Quecus rubra) were heated in a tub furnace in a nitrogen environment, with the ambient temperature of wood samples set at 200, 250, 300, and 400 °C. Wood’s water absorption (WU) dropped as the TM temperature increased, and it reduced drastically over 300 °C [17]. The pressure in the system during the modification phase is not mentioned in the publications; however, based on the maximum pressure listed in the equipment characteristics, it did not exceed 2 bar.
The effects of TM parameters on the mechanical characteristics, color, chemical composition, and dimension stability of black poplar (Populous nigra L.) wood in a nitrogen environment have been widely researched in the temperature range of 160–220 °C [15,18,19]. Mass loss (ML) occurs after TM in nitrogen; the chemical composition changes; the density, compressive strength, modulus of rupture, modulus of elasticity, and EMC decrease; while dimensional stability improves. The characteristics of black poplar wood are more affected by an increase in TM temperature. There is no indication of pressure throughout the TM process. However, the operating pressures of the TM chamber (0.25 m3) are mentioned differently in the experimental sections (−1 to 1 atm and −1 to 5 atm). It is unclear whether the TM is operating in a nitrogen flow or whether the system is filled with nitrogen and closed during the modification phase. It is mentioned that the TM chamber has forced air circulation [15].
We investigated the TM of silver birch (Betula pendula) and Scots pine (Pinus sylvestris) wood in this study, with a particular focus on enhancing the dimensional stability and minimizing the hydrophilicity. Birch and pine wood were chosen as the most frequent deciduous and coniferous wood species in the Republic of Latvia, as they offer a wide range of applications in the national economy. The study’s goal was to examine the correlations between TM parameters in a closed nitrogen atmosphere under pressure and TM wood water and humidity uptake. The information available on the process parameters is insufficient. As a result, a thorough analysis of this TM approach is an obvious next phase to confirm, supplement, or update the existing knowledge.
2. Materials and Methods
2.1. Materials
For each TM, silver birch (Betula pendula) and Scots pine (Pinus sylvestris) wood boards with dimensions of 1000 × 100 × 25 mm (longitudinal × tangential × radial) were used (20 for each treatment). The boards used were of the finest grade, with no evident material faults (knots, grain slop, resin pocked, bark pocked, reaction wood, wanes, blue stains, decays, bug holes, shakes, distortions, and so on). All boards were conditioned in a standard climate (temperature 20 ± 2 °C, relative humidity 65 ± 5%) prior to TM. Sapwood and heartwood were not removed from the Scots pine wood, and randomly selected boards within specified density limitations were utilized for TM. The wood moisture content was evaluated using ISO 13061-1:2014 [20] and the density was determined using ISO 13061-2:2014 [21]. Before TM, the average densities of silver birch and Scots pine were 627 ± 14 kg × m−3 and 581 ± 10 kg × m−3, respectively.
2.2. Thermal Modification Process
TM was performed in a 340 L stainless steel pilot-scale chamber constructed by Wood Treatment Technology (Grinsted, Denmark). The jacket’s temperature was maintained stable with circulating hot mineral oil. The modification chamber is designed to operate at pressures ranging from 0.1 bar to 20 bar, with temperatures reaching 190 °C. A program controls the equipment automatically, allowing it to switch between manual and automatic modes during the TM process. Prior to heating, the samples were stored in the autoclave for 30 min under a 0.2 bar vacuum to remove oxygen. Nitrogen was fed into the autoclave from a nitrogen gas cylinder after the vacuum step to create the required initial pressure (3–6 bar). At the start, a small amount of water (1–1.5 L) was pumped into the autoclave to generate a small amount of steam to catalyze the hydrolysis of hemicelluloses. Until the pressure-release stage, the TM system remained sealed and static (no mixing was used). Table 2 shows the TM parameters for silver birch. Tmax, time at Tmax, and initial nitrogen pressure were varied from 160 to 170 °C, 30 to 120 min, and 3 to 6 bar, respectively.
Table 3 shows the TM parameters for Scots pine. Tmax, time at Tmax, and initial nitro-gen pressure were varied from 160 to 180 °C, 30 to 180 min, and 4 to 6 bar, respectively.
From ambient temperature to 100 °C, the heating rate of the modification chamber was 0.36–0.42 °C/min, and from 100 °C to Tmax, it was 0.24–0.32 °C/min. The temperature was maintained after heating (30–180 min). The pressure in the autoclave grew during the TM process, reaching a maximum in the Tmax stage. The chamber was then cooled by pumping out a mixture of nitrogen and wood thermal destruction products until atmospheric pressure was reached. The modification chamber door was partially opened to allow for additional cooling. The modification chamber was cooled at a rate of 0.30–0.35 °C/min. Figure 1 shows an example of theoretical TM diagrams used in this research. Tmax was reached after 7–10 h. The overall time for the TM process, including heating, holding temperature, and cooling, ranged from 16 to 19 h, depending on the maximum TM temperature.
2.3. Physical Parameters
The mass loss (ML) was calculated by weighing wood boards (20 for each treatment) before and after the TM in a nitrogen atmosphere. The ML was calculated for each treatment as a percentage of the original mass of the fully dry wood using Equation (1):
where:
- is the mass loss after TM in nitrogen [%];
- is the oven-dried mass of the boards before treatment [g];
- is the oven-dried mass of the boards after TM in nitrogen [g].
Volumetric changes following each treatment were calculated using Equation (2):
where:
- is the in-wood volume changes after TM [%];
- is the conditioned wood board volume before TM [cm3];
- is the conditioned wood board volume after TM [cm3].
The volume of the wood board before TM was calculated using Equation (3):
where:
- is the length of the untreated wood’s longitudinal direction [cm];
- is the length of the untreated wood’s tangential direction [cm];
- is the length of the untreated wood’s radial direction [cm].
The volume of wood board after TM was calculated using Equation (4):
where:
- is the length of the TM wood’s longitudinal direction [cm];
- is the length of the TM wood’s tangential direction [cm];
- is the length of the TM wood’s radial direction [cm].
2.4. Dimensional Stability
The anti-swelling efficiency (ASE) of 15 specimens with dimensions of 20 × 20 × 20 mm3 (L × T × R) was examined under cyclic conditions. Before each cycle, specimens were conditioned in a normal climate (temperature 20 ± 2 °C, relative humidity 65 ± 5%). Five full-cell saturation and oven-drying cycles were performed. The ASE was calculated using the volumetric swelling (VS) coefficients of the treated specimens (St) in comparison to the untreated controls (Su). The soaking phase consisted of vacuum water impregnation (0.2 bar, 120 min) followed by 24 h of water storage at 22 °C. The drying phase included a 72 h step at 20 °C, followed by 8 h at 45 °C, 8 h at 60 °C, 8 h at 80 °C, and lastly, 8 h at 103 °C. The ASE estimate was based on the average measurements of radial, tangential, and axial swelling. The ASE was determined for each treatment using Equation (5):
where:
- is the anti-swelling efficiency [%];
- is the untreated specimens’ volumetric swelling coefficient;
- is the TM specimens’ volumetric swelling coefficient.
The volumetric swelling coefficients for each treatment were calculated using Equation (6):
where:
- is the volumetric swelling coefficient [%];
- is the wood volume after soaking with water [cm3];
- is the oven-dried wood volume before soaking with water [cm3].
The changes in cell wall total water capacity for each treatment were determined using Equation (7):
where:
- is the cell wall total water capacity [%];
- is the wood volume after soaking with water [cm3];
- is the volume of oven-dried wood [cm3];
- is the oven-dried mass of the specimens before each soaking cycle [g].
2.5. Moisture Uptake
Moisture uptake from the environment with constant humidity was measured for 15 TM wood specimens (dimensions 20 × 20 × 20 mm3) at relative humidity (RH) of 65, 75, and 98% at 20 ± 2 °C. After being completely dried, the wood specimens were placed in a conditioning room with an RH of 65%. Wood conditioning at higher RH conditions was performed in desiccators by placing specimens over a saturated NaCl salt solution (RH of 75%) and CuSO4 × 5H2O salt solution (RH of 98%). Specimens were stored at successively increasing RHs of 65, 75, and 98%. When the mass of the wood samples remained constant across three weightings at 48 h intervals (up to 30 days), the equilibrium moisture content (EMC) and dimensional changes were determined. For each treatment, the EMC was calculated using Equation (8):
where:
- is the equilibrium moisture content [%];
- is the is the oven-dried mass of the specimen;
- is the equilibrium mass of the specimen after conditioning at a given RH.
For each treatment, the volumetric swelling (VS) of conditioned specimens at a particular RH was calculated using Equation (9):
where:
- is the volumetric swelling [%];
- is the equilibrium volume of the specimen after conditioning at a given RH [cm3];
- is the oven-dried volume of the specimens before conditioning [cm3].
and were determined in the same manner as in Equations (3) and (4).
3. Results
3.1. Mass Loss and Physical Parameter Changes
ML is used as a criterion to characterize the TM process’s intensity and the degree of wood degradation. ML is typically created due to changes in the chemical structure of wood. The degradation of hemicelluloses, which are extremely vulnerable to thermal destruction, is responsible for the majority of the ML. A higher ML after TM often correlates with better biological durability and dimensional stability of wood. However, it has a disadvantage in terms of mechanical strength. The ML after TM for birch wood ranged from 5.9% to 12% (Table 4). These results are related to the initial birch wood densities of 627 ± 14 kg × m−3. The maximum average ML (10.1%–12.0%) was obtained for birch wood after TM at 160 °C for 120 min and 170 °C (regimes B/160/120/4, B/160/120/6, and B/170/60/4). The lowest average ML was obtained after TM at 160 °C for 60–90 min (regimes B/160/60/4, B/160/90/3, and B/160/90/4). When all other process parameters were held constant, a rise in initial pressure resulted in a higher ML after TM. It should be emphasized, however, that the ML values produced using TM had large error margins. Only the regime B/160/90/4 had statistically significant ML differences compared to B/160/120/4, B/160/120/6, and B/170/60/4.
The birch wood board dimensions were substantially reduced after TM in both the radial and tangential axes. The tangential direction of TM birch wood showed a greater reduction (4.4%–6.4%) than the radial (2.9%–4.7%). The most significant changes in both the tangential and radial directions of birch wood were observed after TM at 170 °C and a time at Tmax of 120 min (regimes B/160/120/4, B/160/120/6, and B/170/60/4), while the least change occurred after TM at 160 °C and shorter treatment times (regimes B/160/60/4, B/160/90/3, and B/160/90/4). This could be explained by the fact that the wood structure varies in different directions, which affects the swelling capability of the wood cell wall. After TM, radial and tangential direction reduction resulted in total birch board volumetric changes ranging from 7.1 to 10.2%.
The ML after TM for pine wood was 2.6%–9% (Table 5). These results are related to the initial pine wood densities of 581 ± 10 kg × m−3. After TM, pine wood had a lower ML (2.6%–9.0%) than birch wood (5.9%–12.0%). The maximum ML of pine wood (7.6%–9.0%) was obtained at 180 °C (regimes P/180/30/5 and P/180/60/5) and 170 °C with a duration at Tmax of 120 min (P/170/120/4, P/170/120/6). For all exposition times at Tmax, the lowest ML was obtained at 160 °C (regimes P/160/60/5, P/160/120/5, and P/160/180/5). An increase in the initial pressure from 4 to 6 bar at 170 °C had no noticeable effect on ML after TM. In comparison to the radial direction (1.5%–2.5%), TM pine wood also showed a larger reduction in the tangential direction (2.9%–4.5%). Following TM, the pine wood showed the greatest tangential and radial direction changes at 170 °C with an initial pressure of 4 bar (P/170/90/4 and P/170/120/4) and at 180 °C (P/180/30/5 and P/180/60/5). All TM at 160 °C resulted in the lowest dimensional changes (P/160/60/5, P/160/120/5, and P/160/180/5). After TM, the volumetric changes in pine wood were 4.4%–6.9%.
After 1.5–3.5 h of TM at 185 °C in a nitrogen flow at 10 bar pressure, the ML of beech wood was 11%–17% and 8% for pine wood [7]. These results are consistent with our study that ML of hardwoods after TM is higher than that of softwoods. However, in our case, hardwood ML was substantially lower, whereas softwood ML was very similar.
After TM in an oven at 220 °C for 20 h under a nitrogen environment, the ML of short- and long-rotation teak (Tectona grandis L.f) was 13.4 and 9.2%, respectively [9]. Mimosa scabrella and Pinus oocarpa wood samples were TM in a nitrogen atmosphere at 180, 200, and 220 °C for one hour. After TM, the ML for Mimosa scarabella wood was 4.3, 7.0, and 8.9%, and for Pinus oocarpa it was 4.5, 4.9, and 6.3%, respectively [12]. After being exposed to nitrogen for 2, 4, 6, and 8 h, black poplar (Populus nigra L.) TM yielded 0.9% ML at 160 °C, 0.8%–1.1% at 170 °C, 0.8%–3.0% at 180 °C, 0.8%–3.5% at 190 °C, 4.0%–7.1% at 200 °C, and 6.8%–14.0% at 220 °C. Temperature had a higher impact on ML than treatment time [18]. Our findings reveal that TM in a closed system under pressure in a nitrogen flow induces a similar ML at lower Tmax (170–180 °C) as TM in an open system in a nitrogen flow at Tmax above 200 °C.
3.2. Anti-Swelling Efficiency and Cell Wall Water Capacity
ASE is one of the most important indicators of modified wood materials. It demonstrates the material’s resistance to dimensional change under simulated, cyclic conditions of complete soaking and drying. Almost all TM wood is used to make cladding and decking. Dimensional stability is critical in such applications due to the influence of cyclic weather conditions (moistening and drying, heating and cooling, etc.). As a result, many cycling tests were carried out in which wood was subjected to several soaking and drying cycles. Birch wood after TM had ASE values ranging from 22% to 69% (Figure 2). ASE decreased after the second and third soaking–drying cycles, but did not change significantly after the fourth and fifth cycles. After the first cycle, ASE was 40%–69%, while after the fifth cycle, it was down to 22%–63%. This decrease is caused by the leaching of thermal destruction products from TM wood, which makes its structure more accessible to water (Figure 3). The sample ML after each cycle also supports this statement (data not shown). The soaking water was light brown after each cycle, suggesting the absence of degradation products. The primary ML can be attributed to the degradation of hemicellulose and extractives, which are very vulnerable to thermal destruction [22]. Birch wood had the lowest ASE values (22%–23% after the fifth cycle) after TM in regimes B/160/90/3 and B/170/30/6. Increasing the initial pressure from 3 to 4 bar (regimes B/160/90/3 and B/160/90/4, respectively) at 160 °C raised ASE from 24% to 33%. Simultaneously, changing the initial pressure from 4 to 5 bar (regimes B/160/60/4 and B/160/60/5, respectively) significantly reduced the ASE values after the fifth cycle from 42% to 26%. At the maximum TM time of 120 min, an increase in initial pressure from 4 to 6 bar (regimes B/160/120/4 and B/160/120/6, respectively) reduced ASE values after the fifth cycle from 45% to 41%. At 170 °C, raising the initial pressure from 3 to 4 bar (regimes B/170/30/3 and B/170/30/4, respectively) enhanced ASE from 38% to 47%. However, initial pressure increase from 4 to 6 bar (regimes B/170/30/4 and B/170/30/6, respectively) reduced the ASE values from 47% to 23% after the fifth cycle.
Surprisingly, the B/170/30/6 treatment resulted in the lowest ASE, while the B/170/60/4 treatment resulted in the highest ASE of 63% after the fifth cycle. This leads to the conclusion that 60 min at 170 °C for birch wood contributes to more severe chemical structure degradation (higher ML in Table 4), resulting in a more hydrophobic structure. Probably, the initial pressure of 6 bar at 170 °C is too high, creating internal cracking and facilitating water penetration into the structure. The maximum pressure during TM at 170 °C (6 bar initial pressure) was 16.9 bar; however, at 4 bar the maximum was 13.2 bar (Table 2). An initial pressure of 4 bar was most appropriate for birch wood, as TM created the fewest defects and the greatest ASE values.
Previous studies showed that after aspen (Populus tremula), grey alder (Alnus incana), and birch (Betula pendula) wood TM in steam in a closed, pressurized process, the ASE after the fifth cycle was 25%–40% at 160 °C, 40%–50% at 170 °C, and 55%–65% at 180 °C [22]. Teak (Tectona grandis L.f) samples were heated in an oven at 220 °C for 20 h under a nitrogen atmosphere. The dimensional stability improved significantly, as evidenced by ASE values of 64.9% and 58.9% for short- and long-rotation teak, respectively [9].
TM birch wood’s cell wall total water capacity (CWTWC) was reduced to 10%–29% (Figure 3) compared to untreated birch wood (32%–35%). The CWTWC for all specimens increased slightly during five soaking–drying cycles. This can be explained by the leaching of natural extractives from untreated wood and thermal destruction products from the TM wood. The majority of the extractives were soaked out within the first, second, and third cycles, resulting in minor CWTWC variations after the fourth cycle. After TM at 160–180 °C in saturated steam in a closed system under pressure, a similar trend was found with aspen (Populus tremula), birch (Betula pendula), and grey alder (Alnus incana) wood [22]. Birch wood had the lowest CWTWC (10%–14%) after TM in regime B/170/60/4, which had the highest ASE (63%). The CWTWC for the other treatments ranged from 13% to 20% after the first cycle to 21%–29% after the fifth cycle. The maximum CWTWC was observed after TM in regime B/170/30/6, having the lowest ASE (22% after the fifth cycle). Our findings revealed a clear link between ASE and CWTWC alterations after TM.
After TM, pine wood’s ASE was 27%–58% and it also decreased over five cycles (Figure 4). The regimes with the lowest ASE after the fifth cycle were P/160/60/5 (27%) and P/170/60/4 (32%). Treatments at 160 °C with 5 bar initial pressure produced a distinct tendency. The increase in Tmax time from 60 to 180 min led to ASE improvements of 27, 38, and 40%, respectively. After TM at 170 °C with 4 bar initial pressure and a time at Tmax of 60–120 min, the same trend was seen, as ASE values climbed from 32%–48%. ASE values were also improved from 41%–47% after TM at 170 °C with 6 bar initial pressure and Tmax of 60–120 min. If all other TM parameters were similar, a higher initial pressure contributed to improved ASE of pine wood. The maximum ASE (51%) was observed after TM at 180 °C and a time at Tmax of 60 min, while ASE was slightly lower (47%) after a 30 min treatment.
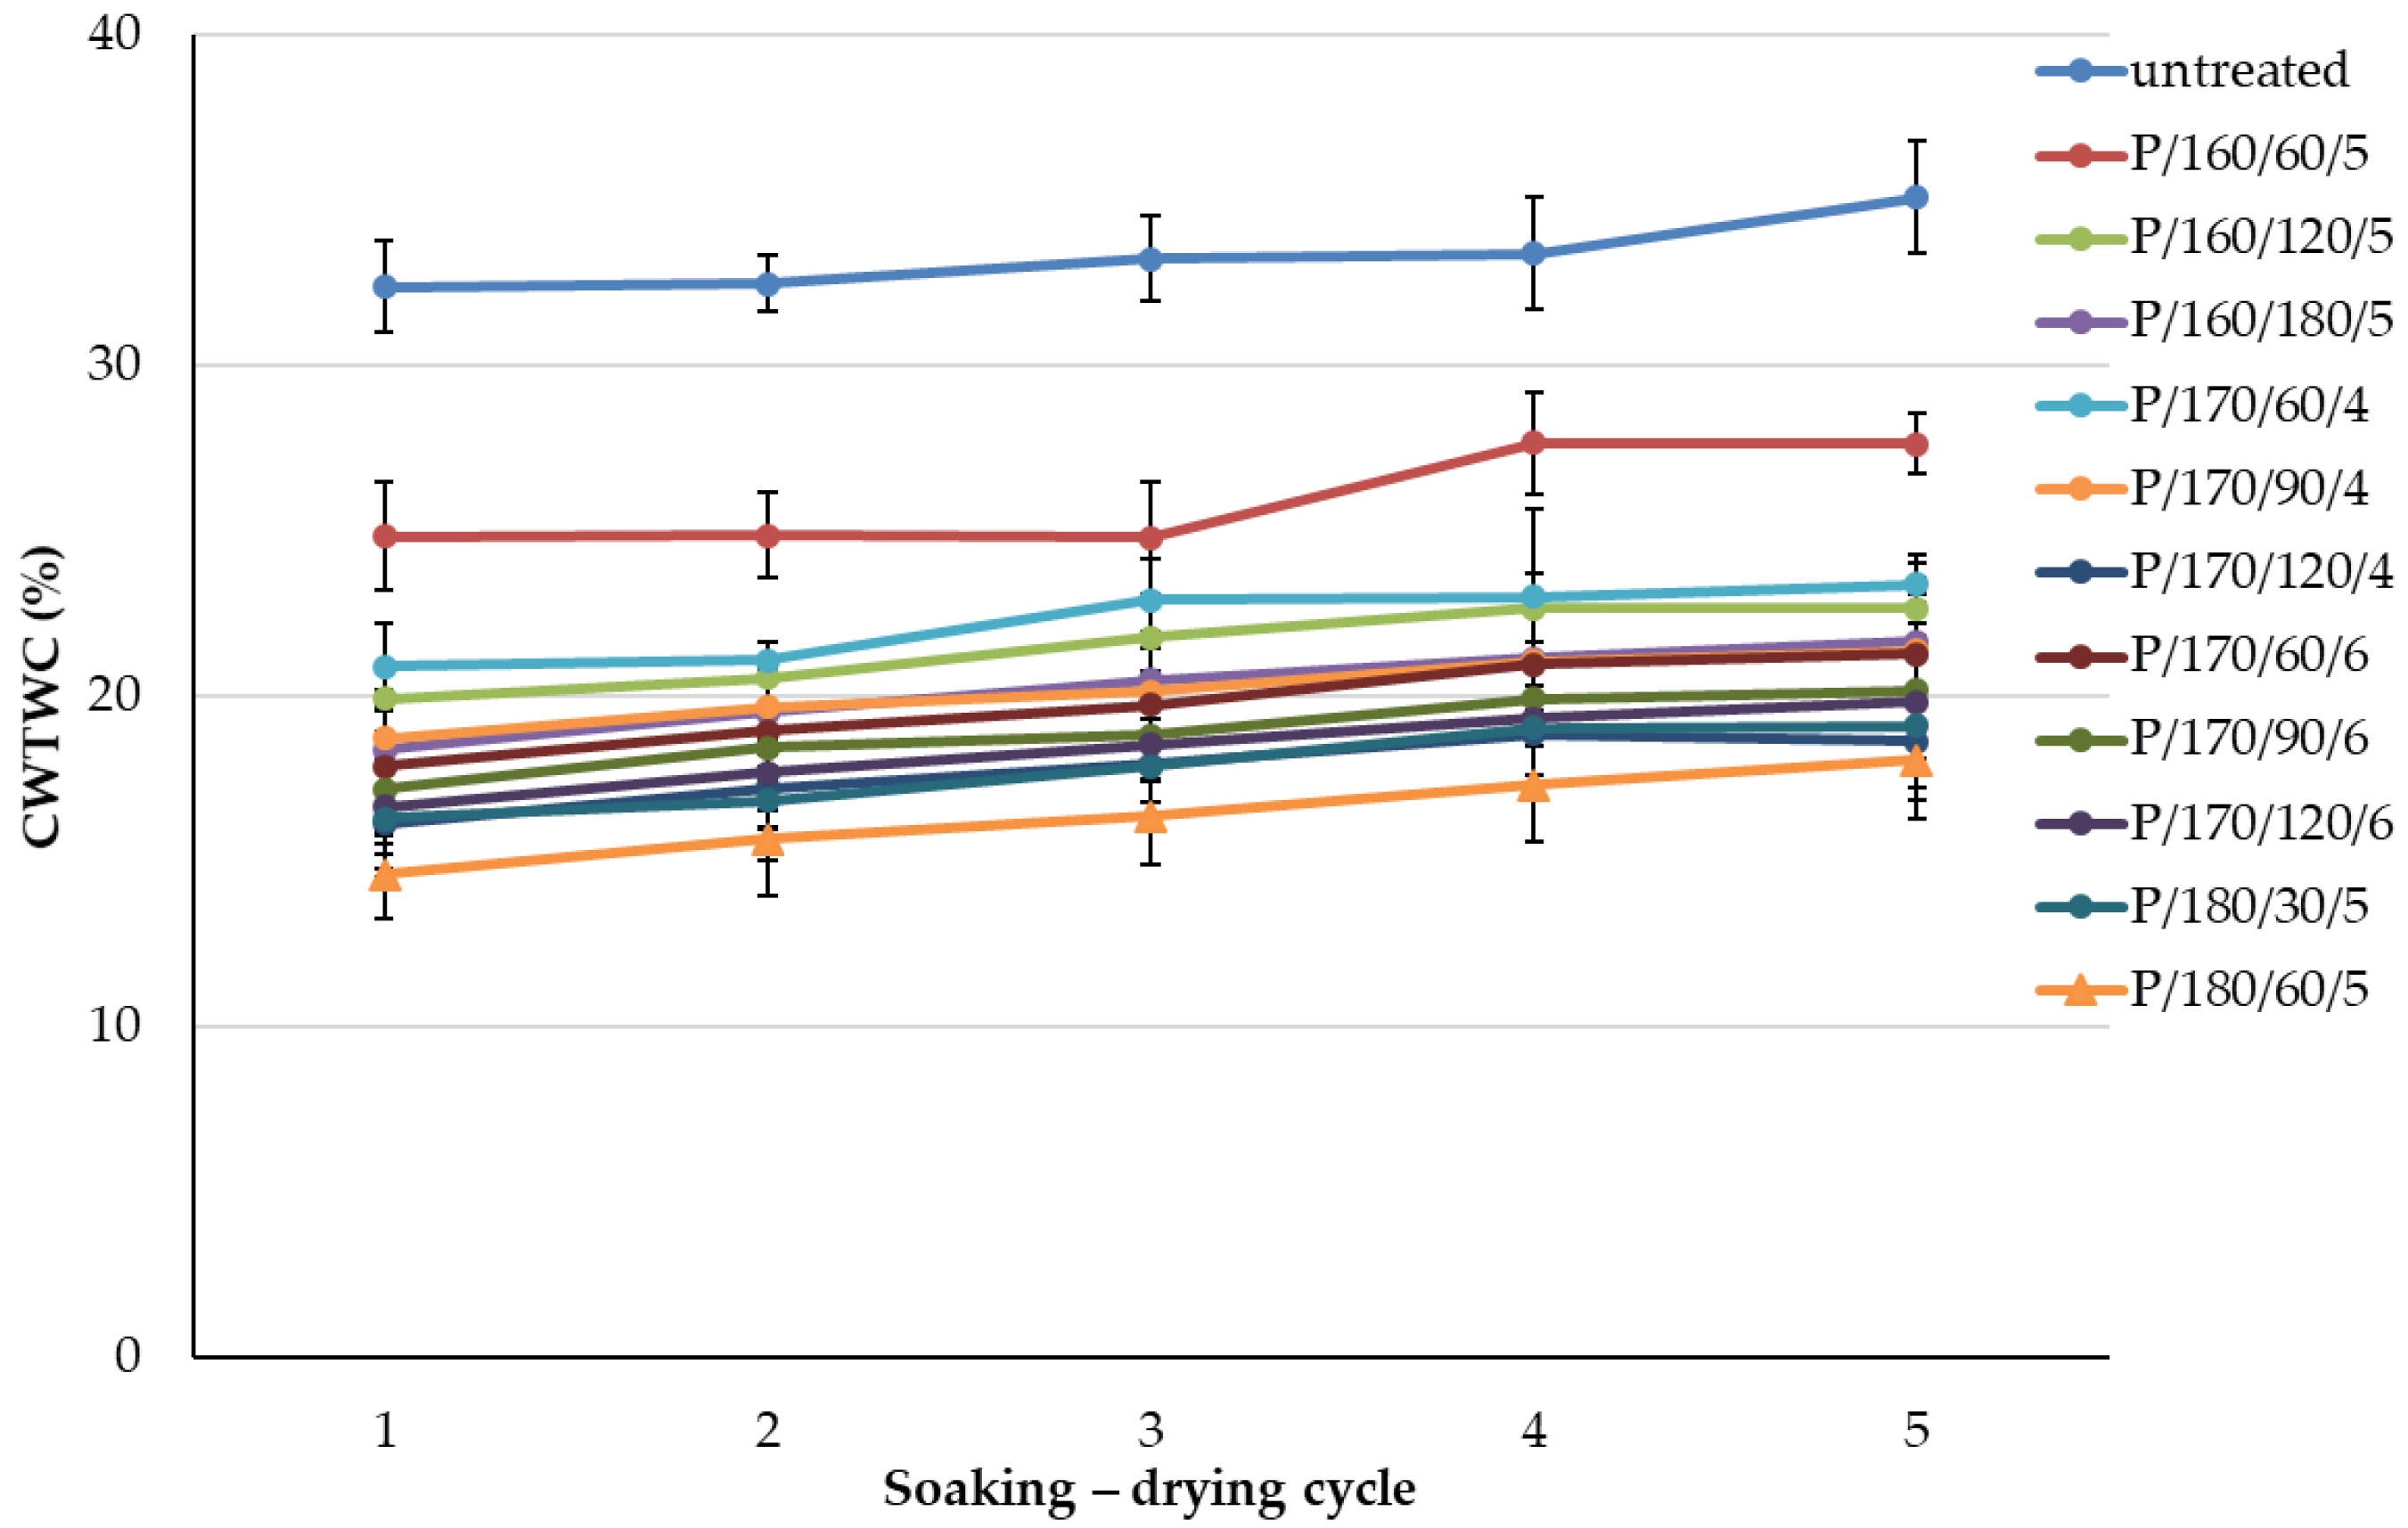
During all soaking–drying cycles, the CWTWC of untreated pine wood (32%–35%) was similar to that of untreated birch wood (Figure 5). TM pine wood’s CWTWC was reduced to 14%–27% and was slightly increasing within soaking–drying cycles. This can be explained by the leaching of natural extractives from untreated wood and thermal destruction products from TM wood. The regime with the highest CWTWC of TM pine wood was P/160/60/5 (27%), which also had the lowest ASE (27% after the fifth cycle). For other treatment regimes, CWTWC was in a narrow range of 18%–23%. Pine wood had the lowest CWTWC (14%–19%) after both TM at 180 °C and followed the same pattern as birch wood.
3.3. Equilibrium Moisture Content and Dimensional Changes
EMC is an indicator of a material’s theoretical ability to absorb moisture from the air. Prolonged EMC exceeding 20% is regarded as the threshold above which a favourable environment for the development of microorganisms (rot fungus, blue stain, mould) in wood products has been produced. All wood modification techniques, in general, attempt to limit water and moisture absorption.
When compared to untreated wood, TM birch wood’s EMC was 51%–64% lower and VS was 48%–67% lower, with substantial reductions in all RHs (Table 6). The EMC of untreated birch wood at 65, 75, and 98% RH was 9.6, 12.9, and 17.4%, respectively. At 65, 75, and 98% RH, the EMC of TM birch wood dropped to 3.7%–4.7%, 4.6%–5.6%, and 6.6%–7.9%, respectively. TM wood absorbs much less moisture in high-humidity conditions (RH of 98%). As a result, TM wood has a substantially lower theoretical probability of infection and microbial growth than untreated wood. The VS of untreated birch wood at 65, 75, and 98% RH was 4.8, 6.5, and 9.6%, respectively. TM birch wood’s VS at 65, 75, and 98% RH was reduced to 1.6%–2.5%, 2.1%–3.1%, and 3.3%–4.6%, respectively. The lowest EMC and VS values at all RH levels were obtained after TM in regime B/170/60/4. Differences in EMC and VS between the other TM regimes were not statistically significant, because the error limits overlapped.
After TM in a nitrogen atmosphere at 180, 200, and 220 °C for one hour, the EMC (65% RH) of Mimosa scabrella and Pinus oocarpa wood was 12.0, 11.6, and 11.3% and 12.7, 12.9, and 11.4%, respectively. The EMC values for untreated wood were 13.5 and 14.7%, respectively. The EMC reduction was only 1.5%–3.3% [12]. The EMC (98% of RH) of black poplar (Populus nigra L.) was reduced from 27% for untreated wood to 26, 23, and 16% for wood TM in nitrogen at 160, 190 and 220 °C, respectively [15].
The EMC of beech wood (Fagus sylvatica) after TM in nitrogen at 175 °C for 2 h and 185 °C for 3 h at 10 bar pressure was 5%–7% (65% of RH) and 13%–23% (100% of RH), respectively, whereas the untreated wood’s EMC was 10% and 30%, respectively. TM beech wood had the lowest EMC when heated to 185 °C compared to other specimens [8]. After TM at 190 °C for 2.5 h in a nitrogen environment at a constant 10 bar pressure, the EMC of beech wood was 13% (90% RH), while that of untreated wood was 26%. Swelling in the tangential, radial, and axial directions of TM beech was 4.3, 2.1, and 0.15%, respectively, whereas in untreated beech it was 12, 6, and 0.3%, respectively [7]. This is consistent with our findings that EMC and swelling of TM wood in nitrogen under pressure can be reduced more than twice compared to untreated wood. We were able to attain considerably lower EMC results for our specified parameters after TM in nitrogen.
After TM, pine wood’s EMC was 29%–56% lower and its VS was 29%–61% lower compared to untreated wood at all RH levels (Table 7). Overall, pine wood had a higher EMC and VS than birch wood at all RHs. The EMC of untreated pine wood at 65, 75, and 98% RH was 10.3, 13.1, and 17.6%, respectively. At 65, 75, and 98% RH, TM pine wood’s EMC dropped to 4.5%–7.3%, 5.3%–8.3%, and 7.3%–11.7%, respectively. At 65, 75, and 98% RH, TM pine wood’s VS was reduced to 2.2%–3.8%, 2.5%–4.3%, and 3.8%–6.4%, respectively.
The EMC of TM spruce (Picea abies) after TM in nitrogen at 175 °C for 2 h and 185 °C for 3 h at 10 bar pressure was 6%–8% (65% of RH) and 17%–20% (100% of RH), while the untreated wood’s EMC was 12%–13% and ~30%, respectively [8]. TM in nitrogen according to the process used in our study resulted in significantly lower EMC values compared to data in the literature. If Tmax, time at Tmax, and initial pressures were promoted, the EMC of TM pine at all RHs tended to drop.
4. Discussion
EMC and ASE are well-known methods for comparing and characterizing wood materials after different modifications. According to our research, ASE is a better method for detecting variations between different TM regimes in TM wood. Overall, birch wood made it more difficult to express the influence of TM process parameters on physical parameter changes and EMC. TM wood absorbs much less moisture in high-humidity conditions (RH of 98%) and has a substantially reduced theoretical probability of infection and microbial growth. However, EMC provided fairly similar results for TM birch, while a clearer trend was observed for pine. According to our findings, EMC is ineffective for determining a substantial difference between the TM parameters used for birch wood. TM birch wood’s ASE values also revealed some contradicting tendencies. Obviously, the chemical structure of birch wood is transformed differently during the TM process than that of pine wood. To validate or disprove this idea, we will conduct chemical analyses of TM wood and test its mechanical strength in future research.
5. Conclusions
The results clearly revealed that TM in nitrogen in closed, pressurized process can improve the dimensional stability of birch and pine wood, as well as reduce moisture and water absorption. Birch wood was less resistant to TM because its ML (5.9%–12%) was higher than that of pine wood (2.6%–9%). Our findings reveal that TM in a closed system under pressure in nitrogen induces similar ML at 170–180 °C to TM in an open system in a nitrogen flow at Tmax above 200 °C. TM caused a shrinkage in the tangential, radial, and total volume of birch and pine wood. Birch wood after TM had ASE values ranging from 22% to 69%, while pine wood’s ASE was 27% to 58%. The ASE values for both wood species tended to decrease within five soaking–drying cycles. Because of the leaching of thermal degradation products from TM wood, the CWTWC increased and the wood structure became more susceptible to water. According to the ASE data, birch wood TM in nitrogen with an initial pressure of 4 bar appeared to be more suitable for achieving improved dimensional stability than 3, 5, or 6 bar. For pine wood, the difference between 4 and 6 bar initial nitrogen pressure at 170 °C was minimal. As a consequence, the optimal option for TM at 160 and 180 °C was determined to be 5 bar initial pressure. When compared to untreated wood, TM birch wood’s EMC was 51%–64% lower and its VS was 48%–67% lower, but TM pine wood’s EMC was 29%–56% and its VS was 29%–61% lower. EMC and VS were greatly reduced at all RHs (65, 75, and 98%). When compared to the data available in the literature, the EMC values for birch and pine wood were significantly lower, suggesting the efficiency of the TM process. Increases in TM process parameters (Tmax, time at Tmax, and initial pressure) resulted in decreased EMC for pine wood. Because the EMC differences across the TM regimes were not statistically significant, such a link was not detected for birch wood.
Author Contributions
Conceptualization, G.S. and J.G.; methodology, J.G. and P.B.; formal analysis, P.B. and J.Z.; investigation, G.S. and J.G.; resources, J.G. and P.B.; data curation, G.S.; writing—original draft preparation, G.S. and J.G.; writing—review and editing, P.B. and J.Z.; visualization, G.S. and J.G.; supervision, J.G. and J.Z.; project administration, J.G.; funding acquisition, J.G. All authors have read and agreed to the published version of the manuscript.
Funding
This research was funded by a Latvian State Institute of Wood Chemistry Bio-economy Grant: “Investigation of more efficient thermal modification process in nitrogen environment”, project No. 09-23.
Data Availability Statement
The raw data supporting the conclusions of this article will be made available by the authors on request.
Conflicts of Interest
The authors declare no conflicts of interest.
References
- Jones, D.; Sandberg, D. A Review of Wood Modification Globally–Updated Findings from COST FP1407. Interdiscip. Perspect. Built Environ. 2020, 1, 1–31. [Google Scholar] [CrossRef]
- Jones, D.; Sandberg, D.; Goli, G.; Todaro, L. Wood Modification in Europe: A State-of-the-Art about Processes, Products and Applications, 1st ed.; Firenze University Press: Florence, Italy, 2020; Volume 124, ISBN 978-88-6453-970-6. [Google Scholar]
- Scheiding, W.; Ala-Viikari, J.; Tetri, T. Thermal Wood Modification after 20 Years of Commercialization: An Overview and the ThermoWood® Story. In Proceedings of the 10th European Conference on Wood Modification, Nancy, France, 25 April 2022; pp. 11–21. [Google Scholar]
- Zelinka, S.L.; Altgen, M.; Emmerich, L.; Guigo, N.; Keplinger, T.; Kymäläinen, M.; Thybring, E.E.; Thygesen, L.G. Review of Wood Modification and Wood Functionalization Technologies. Forests 2022, 13, 1004. [Google Scholar] [CrossRef]
- Sandberg, D.; Kutnar, A.; Mantanis, G. Wood Modification Technologies—A Review. iForest 2017, 10, 895–908. [Google Scholar] [CrossRef]
- Godinho, D.; Araújo, S.D.O.; Quilhó, T.; Diamantino, T.; Gominho, J. Thermally Modified Wood Exposed to Different Weathering Conditions: A Review. Forests 2021, 12, 1400. [Google Scholar] [CrossRef]
- Giebeler, E. Dimensional Stabilization of Wood by Moisture-Heat-Pressure Treatment. Holz Roh Werkst. 1983, 41, 87–94. [Google Scholar] [CrossRef]
- Feist, W.C.; Sell, J. Weathering Behavior of Dimensionally Stabilized Wood Treated by Heating under Pressure of Nitrogen Gas. Wood Fiber Sci. 1987, 19, 183–195. [Google Scholar]
- Pratiwi, L.A.; Darmawan, W.; Priadi, T.; George, B.; Merlin, A.; Gérardin, C.; Dumarçay, S.; Gérardin, P. Characterization of Thermally Modified Short and Long Rotation Teaks and the Effects on Coatings Performance. Maderas Cienc. Tecnol. 2019, 21, 209–222. [Google Scholar] [CrossRef]
- Chien, Y.-C.; Yang, T.-C.; Hung, K.-C.; Li, C.-C.; Xu, J.-W.; Wu, J.-H. Effects of Heat Treatment on the Chemical Compositions and Thermal Decomposition Kinetics of Japanese Cedar and Beech Wood. Polym. Degrad. Stab. 2018, 158, 220–227. [Google Scholar] [CrossRef]
- Tuong, V.M.; Li, J. Changes Caused by Heat Treatment in Chemical Composition and Some Physical Properties of Acacia Hybrid Sapwood. Holzforschung 2011, 65, 67–72. [Google Scholar] [CrossRef]
- Guimarães Carvalho, A.; Geike De Andrade, B.; Barros Donato, D.; Simões Da Silva, C.M.; De Cassia Oliveira Carneiro, A.; Resende De Castro, V.; Zanuncio, A.J.V. Bonding Perfomance of Structural Adhesives on Heat-Treated Mimosa Scabrella Andpinus Oocarpa Wood. Cellul. Chem. Technol. 2020, 54, 663–668. [Google Scholar] [CrossRef]
- Paes, J.; Brocco, V.; Loiola, P.; Segundinho, P.; Silva, M.; Juizo, C. Effect of Thermal Modification on Decay Resitance of Corymbia Citriodora and Pinus Taeda Wood. JTFS 2021, 33, 185–190. [Google Scholar] [CrossRef]
- Inari, G.N.; Pétrissans, M.; Pétrissans, A.; Gérardin, P. Elemental Composition of Wood as a Potential Marker to Evaluate Heat Treatment Intensity. Polym. Degrad. Stab. 2009, 94, 365–368. [Google Scholar] [CrossRef]
- Bytner, O.; Laskowska, A.; Drożdżek, M.; Kozakiewicz, P.; Zawadzki, J. Evaluation of the Dimensional Stability of Black Poplar Wood Modified Thermally in Nitrogen Atmosphere. Materials 2021, 14, 1491. [Google Scholar] [CrossRef] [PubMed]
- Nguyen, C.T.; Wagenführ, A.; Phuong, L.X.; Dai, V.H.; Bremer, M.; Fischer, S. The Effects of Thermal Modification on the Properties of Two Vietnamese Bamboo Species, Part I: Effects on Physical Properties. BioResources 2012, 7, 5355–5366. [Google Scholar] [CrossRef]
- Zhang, Y.; Xu, D.; Ma, L.; Wang, S.; Liu, X. Influence of Heat Treatment on the Water Uptake Behavior of Wood. BioResources 2017, 12, 1697–1705. [Google Scholar] [CrossRef]
- Bytner, O.; Drożdżek, M.; Laskowska, A.; Zawadzki, J. Temperature, Time, and Interactions between Them in Relation to Colour Parameters of Black Poplar (Populus Nigra L.) Thermally Modified in Nitrogen Atmosphere. Materials 2022, 15, 824. [Google Scholar] [CrossRef] [PubMed]
- Bytner, O.; Drożdżek, M.; Laskowska, A.; Zawadzki, J. Influence of Thermal Modification in Nitrogen Atmosphere on the Selected Mechanical Properties of Black Poplar Wood (Populus Nigra L.). Materials 2022, 15, 7949. [Google Scholar] [CrossRef] [PubMed]
- ISO 13061-1:2014; Physical and Mechanical Properties of Wood—Test Methods for Small ClearWood Specimens—Part 1: Determination of Moisture Content for Physical and Mechanical Tests. International Organization for Standardization: London, UK, 2014.
- ISO 13061-2:2014; Physical and Mechanical Properties of Wood—Test Methods for Small ClearWood Specimens—Part 2: Determination of Density for Physical and Mechanical Tests. International Organization for Standardization: London, UK, 2014.
- Biziks, V.; Andersons, B.; Sansonetti, E.; Andersone, I.; Militz, H.; Grinins, J. One-Stage Thermo-Hydro Treatment (THT) of Hardwoods: An Analysis of Form Stability after Five Soaking-Drying Cycles. Holzforschung 2015, 69, 563–571. [Google Scholar] [CrossRef]
Figure 1.
Diagrams of the TM regime at various Tmax.
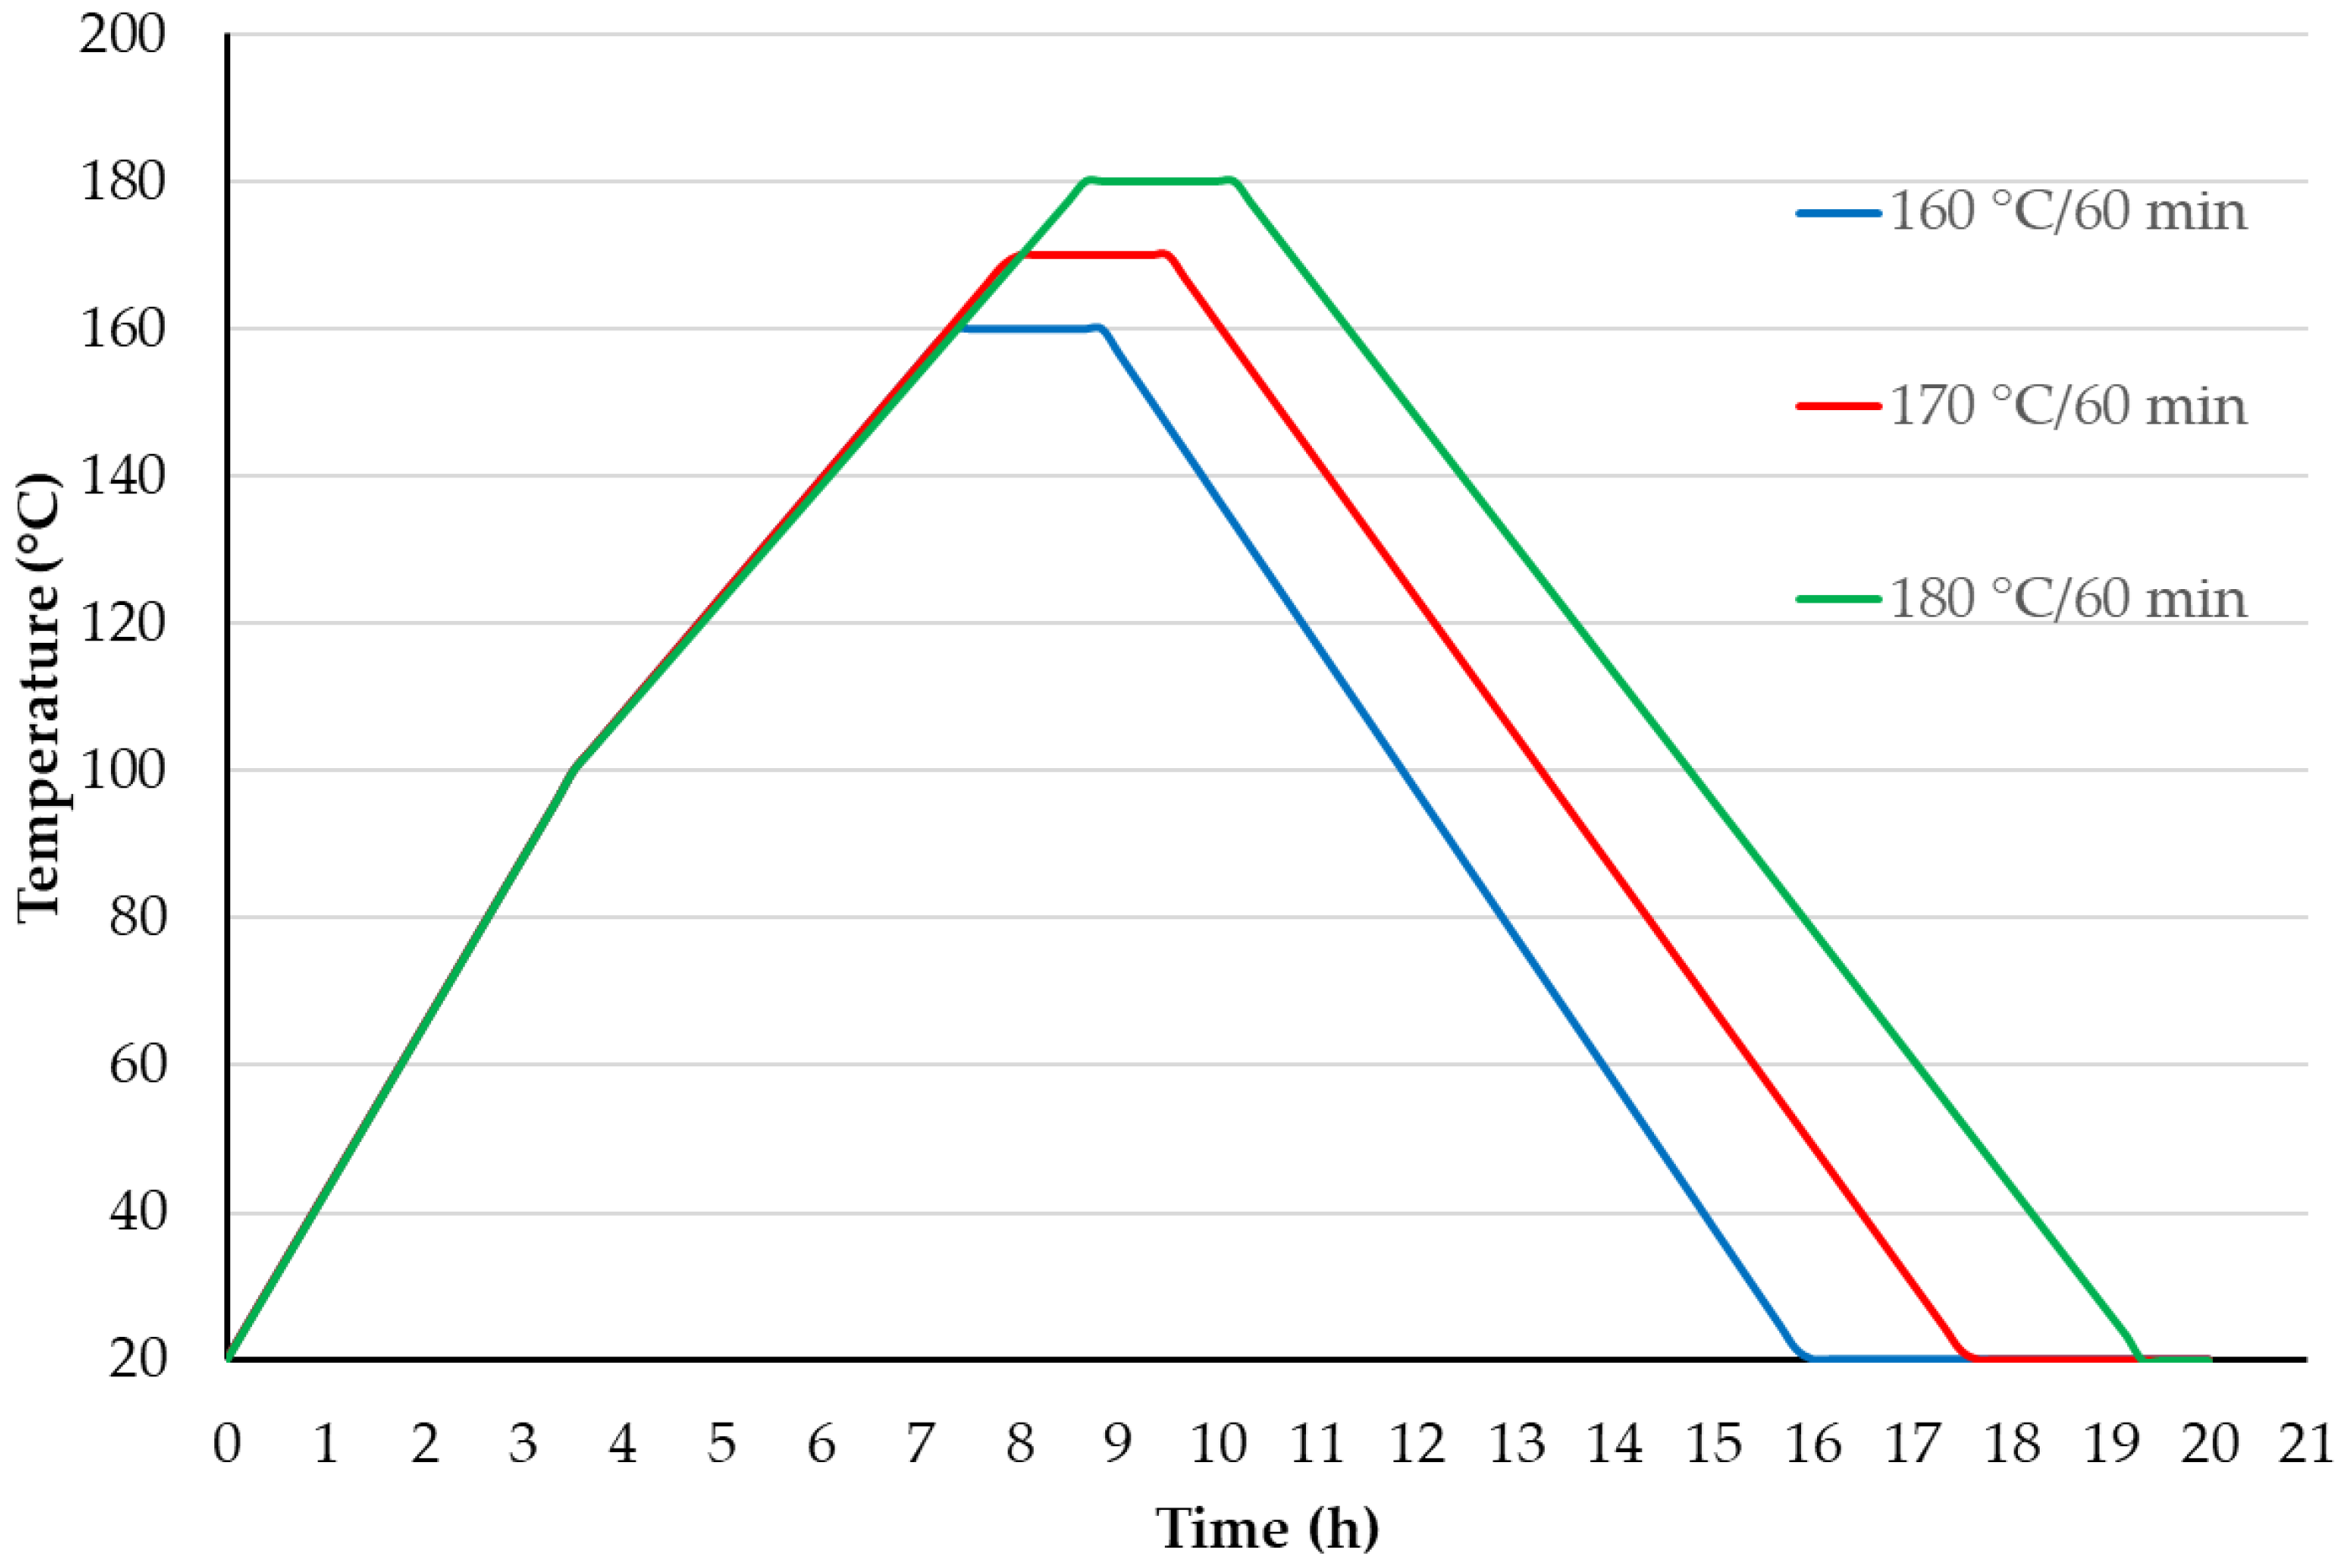
Figure 2.
Anti-swelling efficiency of TM birch wood during 5 soaking–drying cycles.

Figure 3.
Cell wall total water capacity of TM birch wood during 5 soaking–drying cycles.
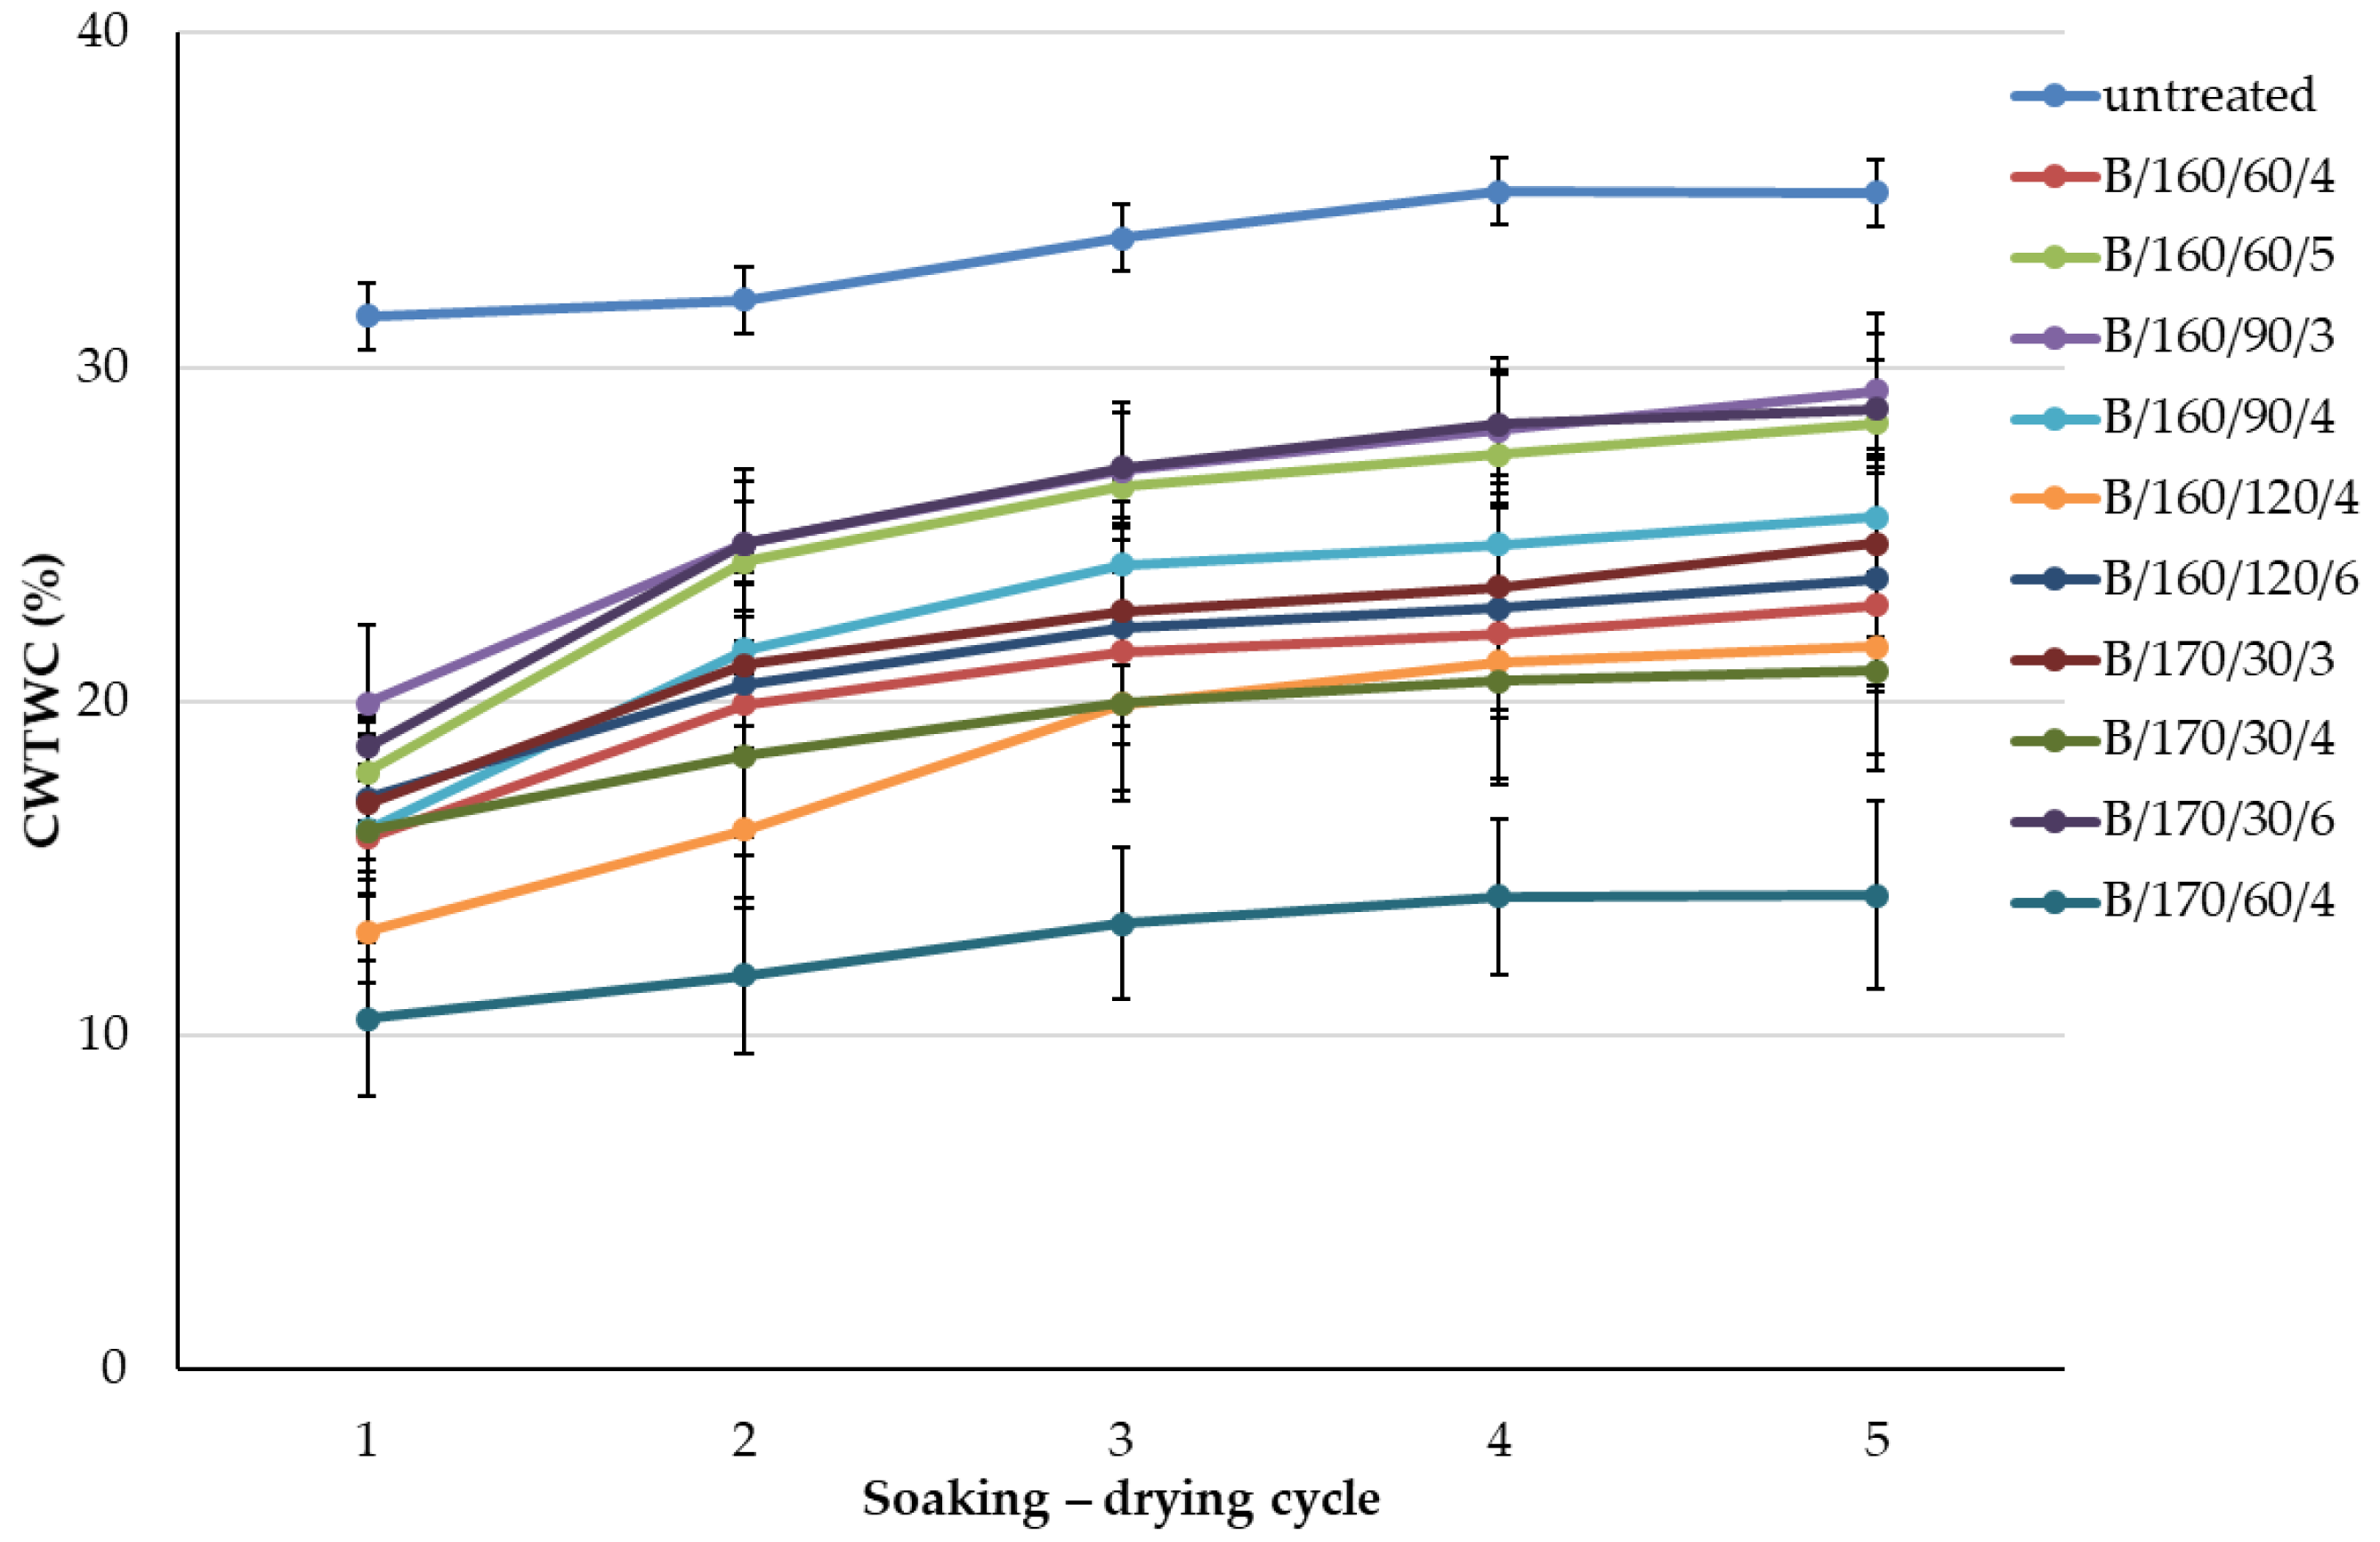
Figure 4.
Anti-swelling efficiency of TM pine wood during 5 soaking–drying cycles.
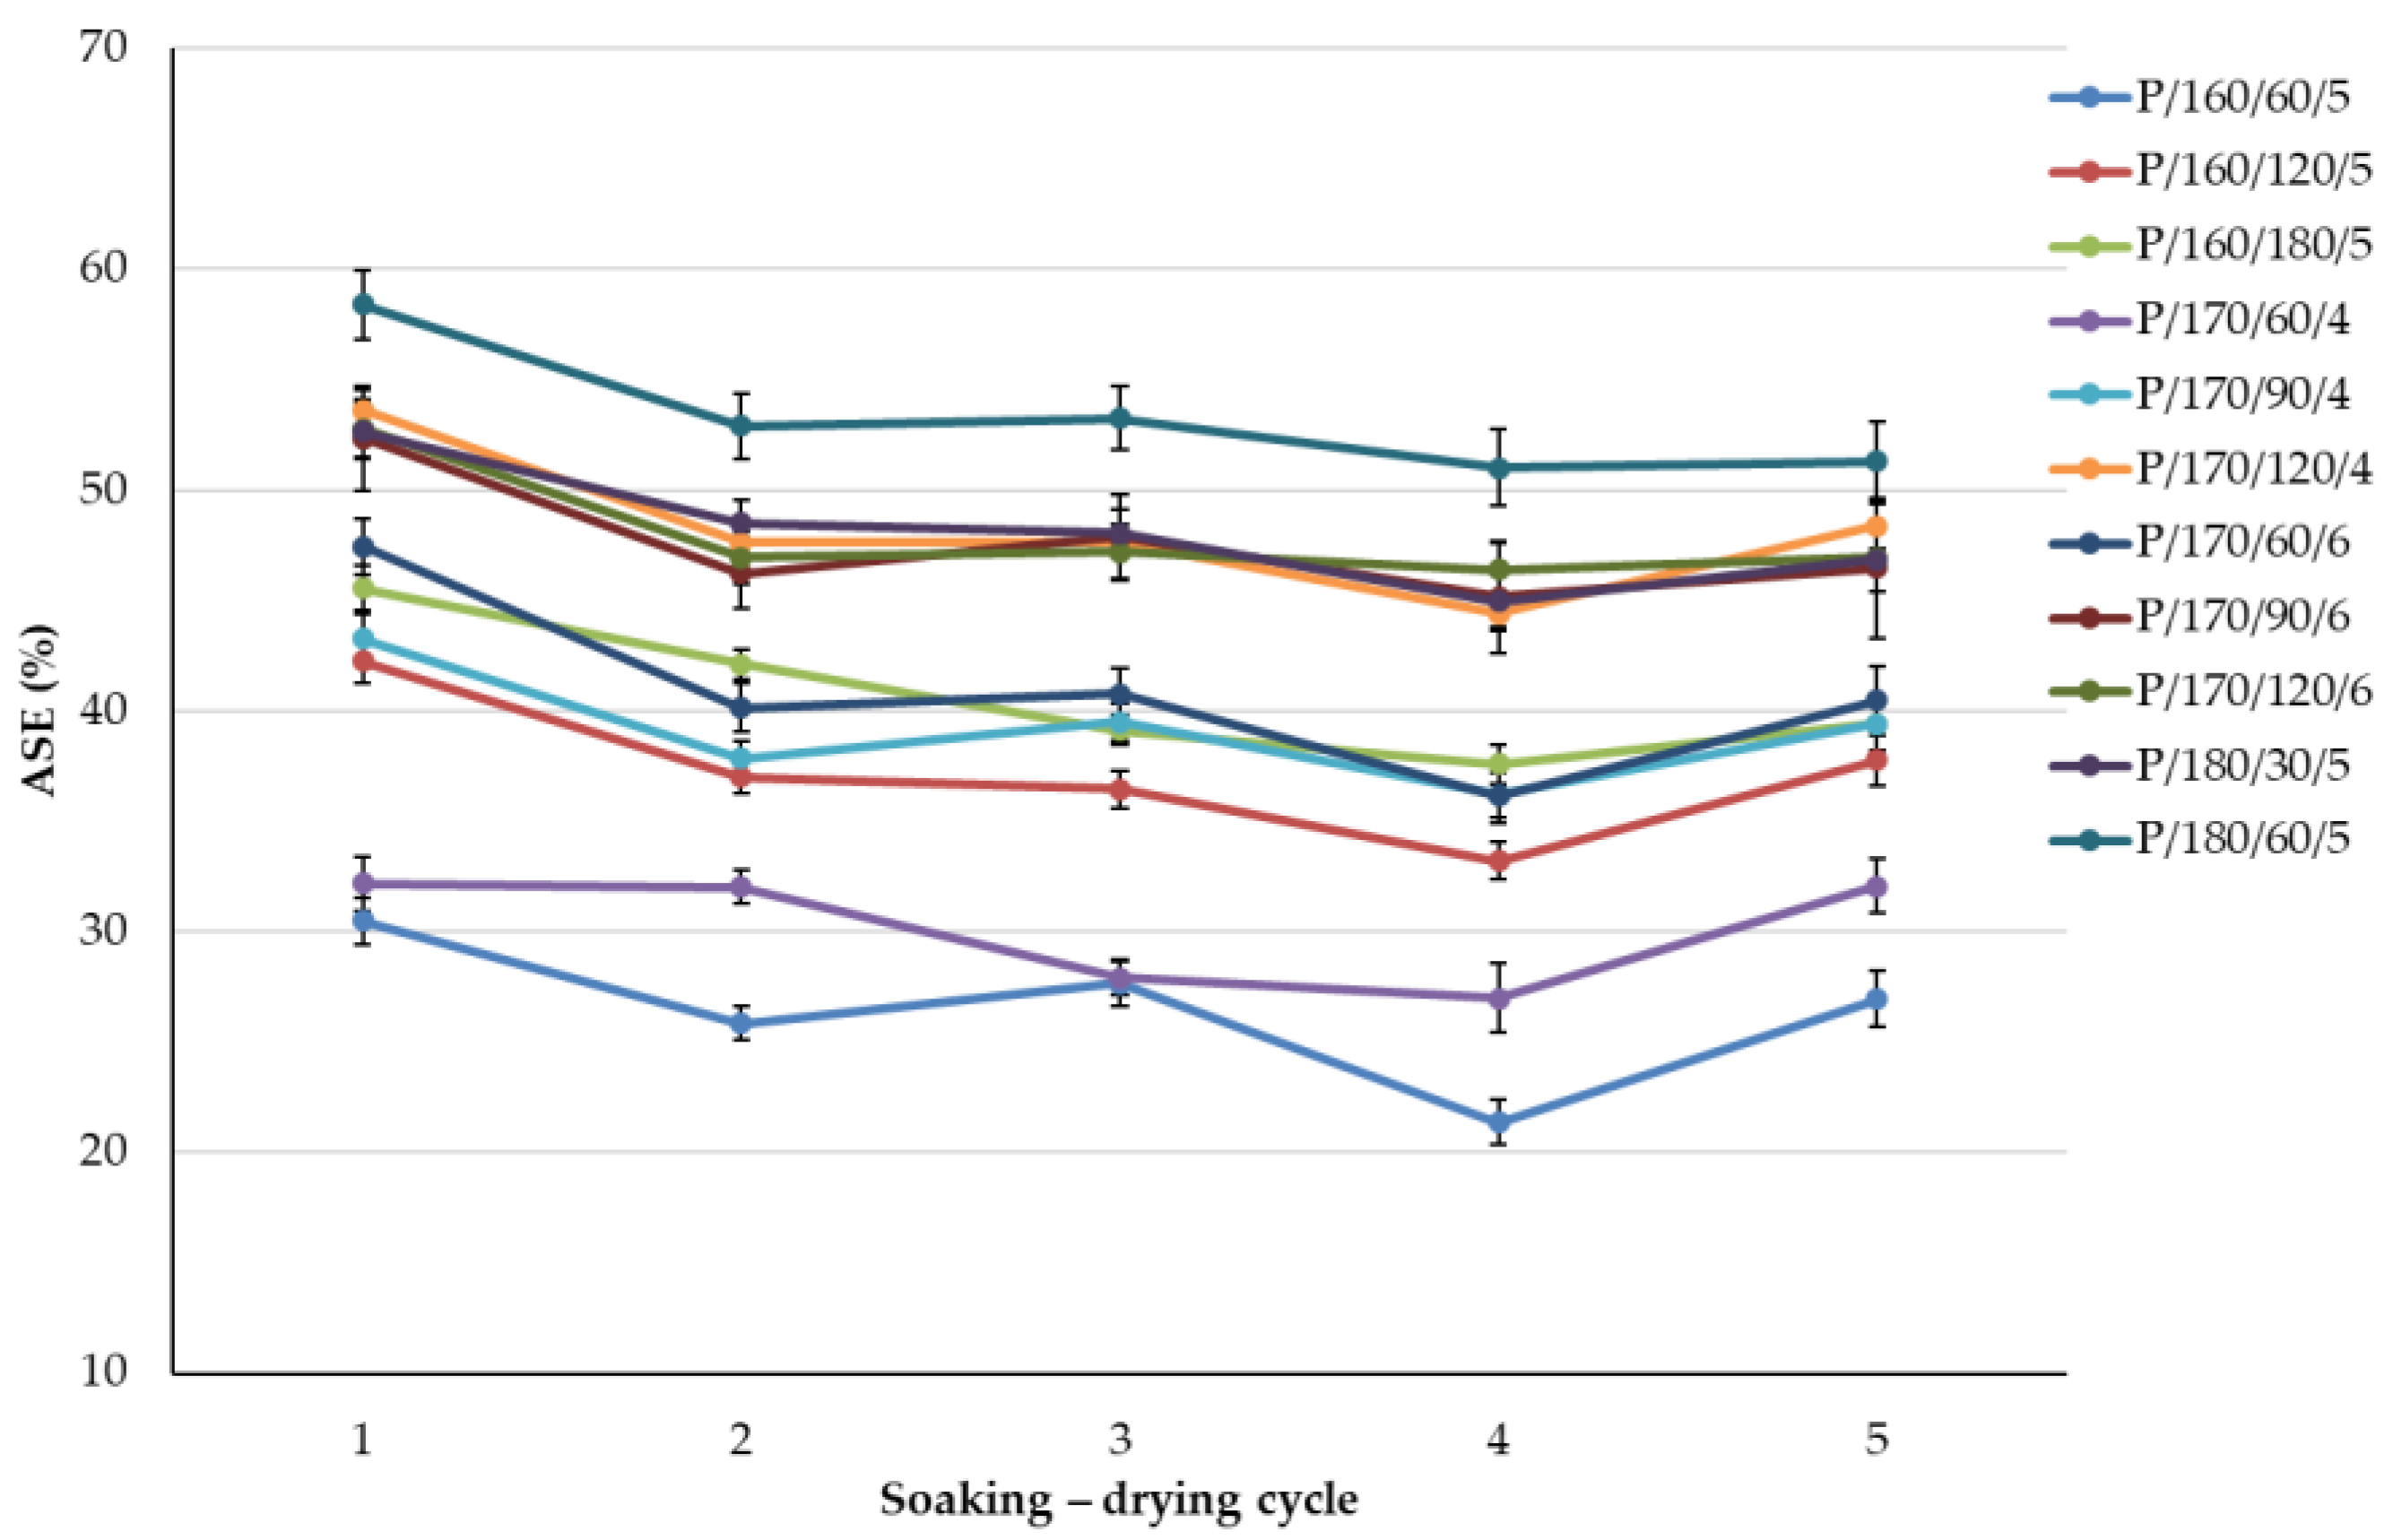
Figure 5.
Cell wall total water capacity of TM pine wood during 5 soaking–drying cycles.

Table 1.
Commercialized TM processes.
| TM Process | Temperature (°C) | Process Duration (h) | Pressure (bar) | Atmosphere |
|---|---|---|---|---|
| Thermowood | 180–230 | 30–70 | Atmospheric | Steam |
| Feuchte–Wärme–Druck | 120–200 | 5–15 | 5–10 | Nitrogen |
| Plato | 150–190 | 70–120 up to 2 weeks | Super atmospheric pressure (partly) | Saturated steam/heated air |
| Wood treatment technology | 140–180 | 22–30 | 4–12 | Saturated steam |
| Le bois Perdure | 200–230 | 12–36 | Atmospheric | Steam |
| Firmolin | 160–180 | No data available | 4–7 | Saturated steam |
| Opel Therm Vacuum press dewatering method | 180–240 | 24–120 | 0.08 | Vacuum |
| Termovuoto | 160–220 | Up to 25 | 0.15–0.35 | Vacuum |
| Rétification process | 160–240 | 8–24 | No data available | Nitrogen |
| Oil–heat treatment | 180–220 | 24–36 | - | Vegetable oils |
| Wood treatment technology | 140–180 | 8–12 | 12–18 | Nitrogen |
Table 2.
Thermal modification parameters of silver birch wood.
| Treatment Regime | Tmax (°C) | Time at Tmax (min) | Initial Pressure (bar) | Max Pressure (bar) |
|---|---|---|---|---|
| B/160/60/4 | 160 | 60 | 4 | 11.8 |
| B/160/60/5 | 160 | 60 | 5 | 14.2 |
| B/160/90/3 | 160 | 90 | 3 | 10.0 |
| B/160/90/4 | 160 | 90 | 4 | 12.0 |
| B/160/120/4 | 160 | 120 | 4 | 12.6 |
| B/160/120/6 | 160 | 120 | 6 | 16.2 |
| B/170/30/3 | 170 | 30 | 3 | 12.7 |
| B/170/30/4 | 170 | 30 | 4 | 13.0 |
| B/170/30/6 | 170 | 30 | 6 | 16.9 |
| B/170/60/4 | 170 | 60 | 4 | 13.2 |
Table 3.
Thermal modification parameters of Scots pine wood.
| Treatment Regime | Tmax (°C) | Time at Tmax (min) | Initial Pressure (bar) | Max Pressure (bar) |
|---|---|---|---|---|
| P/160/60/5 | 160 | 60 | 5 | 11.5 |
| P/160/120/5 | 160 | 120 | 5 | 12.7 |
| P/160/180/5 | 160 | 180 | 5 | 13.2 |
| P/170/60/4 | 170 | 60 | 4 | 12.5 |
| P/170/90/4 | 170 | 90 | 4 | 12.7 |
| P/170/120/4 | 170 | 120 | 4 | 12.9 |
| P/170/60/6 | 170 | 60 | 6 | 15.4 |
| P/170/90/6 | 170 | 90 | 6 | 15.8 |
| P/170/120/6 | 170 | 120 | 6 | 16.2 |
| P/180/30/5 | 180 | 30 | 5 | 16.4 |
| P/180/60/5 | 180 | 60 | 5 | 16.8 |
Table 4.
Silver birch wood physical parameter changes after TM.
| Treatment Regime | Mass Loss (%) | Tangential Changes (%) | Radial Changes (%) | Volumetric Changes (%) |
|---|---|---|---|---|
| B/160/60/4 | 7.7 ± 2.7 | 4.4 ± 1.1 | 2.9 ± 1.2 | 7.1 ± 2.0 |
| B/160/60/5 | 9.5 ± 3.1 | 5.0 ± 1.3 | 3.8 ± 1.4 | 8.6 ± 2.4 |
| B/160/90/3 | 5.9 ± 2.2 | 4.4 ± 0.9 | 3.3 ± 0.8 | 7.5 ± 1.5 |
| B/160/90/4 | 7.3 ± 2.9 | 5.1 ± 1.4 | 4.2 ± 1.0 | 9.0 ± 2.1 |
| B/160/120/4 | 10.1 ± 1.7 | 5.9 ± 1.5 | 3.5 ± 1.1 | 9.1 ± 2.4 |
| B/160/120/6 | 12.0 ± 2.8 | 5.7 ± 1.6 | 4.7 ± 1.4 | 10.2 ± 2.6 |
| B/170/30/3 | 8.6 ± 2.6 | 5.5 ± 1.4 | 4.4 ± 1.2 | 9.6 ± 2.1 |
| B/170/30/4 | 9.6 ± 2.8 | 5.7 ± 1.3 | 3.6 ± 1.1 | 9.1 ± 2.2 |
| B/170/30/6 | 9.3 ± 2.9 | 5.3 ± 1.0 | 3.5 ± 1.0 | 8.7 ± 1.8 |
| B/170/60/4 | 12.0 ± 2.2 | 6.4 ± 1.0 | 4.1 ± 1.2 | 10.2 ± 2.0 |
Table 5.
Scots pine wood physical parameter changes after TM.
| Treatment Regime | Mass Loss (%) | Tangential Changes (%) | Radial Changes (%) | Volumetric Changes (%) |
|---|---|---|---|---|
| P/160/60/5 | 2.6 ± 0.7 | 2.9 ± 0.3 | 1.5 ± 0.2 | 4.4 ± 0.4 |
| P/160/120/5 | 3.9 ± 0.9 | 3.6 ± 0.4 | 1.9 ± 0.3 | 5.4 ± 0.6 |
| P/160/180/5 | 4.7 ± 1.3 | 3.7 ± 0.5 | 2.1 ± 0.4 | 5.6 ± 0.7 |
| P/170/60/4 | 4.9 ± 1.0 | 3.5 ± 0.3 | 2.2 ± 0.3 | 5.6 ± 0.4 |
| P/170/90/4 | 6.6 ± 1.5 | 3.9 ± 0.5 | 2.2 ± 0.4 | 6.0 ± 0.7 |
| P/170/120/4 | 7.9 ± 1.3 | 4.2 ± 0.4 | 2.5 ± 0.3 | 6.6 ± 0.6 |
| P/170/60/6 | 6.3 ± 1.2 | 3.6 ± 0.5 | 2.0 ± 0.4 | 5.5 ± 0.7 |
| P/170/90/6 | 6.0 ± 1.3 | 3.2 ± 0.4 | 1.7 ± 0.3 | 4.9 ± 0.6 |
| P/170/120/6 | 7.8 ± 1.2 | 3.9 ± 0.5 | 2.3 ± 0.5 | 6.1 ± 0.8 |
| P/180/30/5 | 7.6 ± 1.6 | 3.9 ± 0.7 | 2.2 ± 0.4 | 6.0 ± 1.0 |
| P/180/60/5 | 9.0 ± 1.6 | 4.5 ± 0.5 | 2.5 ± 0.5 | 6.9 ± 0.8 |
Table 6.
Silver birch EMC and volumetric swelling (VS) at different relative humidities.
| Treatment Regime | Relative Humidity (%) | |||||
|---|---|---|---|---|---|---|
| 65 | 75 | 98 | ||||
| EMC | VS | EMC | VS | EMC | VS | |
| Untreated | 9.6 ± 0.1 | 4.8 ± 0.3 | 12.9 ± 0.1 | 6.5 ± 0.4 | 17.4 ± 0.1 | 9.6 ± 0.6 |
| B/160/60/4 | 4.7 ± 0.9 | 2.1 ± 0.6 | 5.5 ± 1.0 | 2.4 ± 0.7 | 7.5 ± 1.0 | 3.3 ± 1.0 |
| B/160/60/5 | 4.6 ± 0.6 | 2.2 ± 0.4 | 5.4 ± 0.7 | 2.5 ± 0.5 | 7.4 ± 0.4 | 3.6 ± 0.7 |
| B/160/90/3 | 4.7 ± 0.5 | 2.5 ± 0.6 | 5.5 ± 0.8 | 2.9 ± 0.7 | 7.6 ± 0.8 | 4.6 ± 0.7 |
| B/160/90/4 | 4.5 ± 0.5 | 2.3 ± 0.4 | 5.3 ± 0.5 | 2.6 ± 0.5 | 7.2 ± 0.3 | 3.8 ± 0.7 |
| B/160/120/4 | 4.0 ± 0.5 | 1.7 ± 0.2 | 5.3 ± 0.5 | 2.4 ± 0.5 | 7.4 ± 1.0 | 3.2 ± 0.6 |
| B/160/120/6 | 4.3 ± 0.6 | 2.2 ± 0.3 | 5.6 ± 0.8 | 3.1 ± 0.5 | 7.5 ± 0.8 | 4.2 ± 0.8 |
| B/170/30/3 | 3.9 ± 0.3 | 1.9 ± 0.3 | 4.9 ± 0.4 | 2.8 ± 0.4 | 7.0 ± 0.6 | 3.9 ± 0.5 |
| B/170/30/4 | 4.0 ± 0.4 | 1.7 ± 0.2 | 5.1 ± 0.5 | 2.4 ± 0.4 | 7.4 ± 1.0 | 3.7 ± 0.5 |
| B/170/30/6 | 4.7 ± 0.5 | 2.5 ± 0.4 | 5.4 ± 0.8 | 2.9 ± 0.5 | 7.9 ± 0.7 | 4.4 ± 0.6 |
| B/170/60/4 | 3.7 ± 0.1 | 1.6 ± 0.2 | 4.6 ± 0.1 | 2.1 ± 0.3 | 6.6 ± 0.3 | 3.3 ± 0.5 |
Table 7.
Scots pine EMC and volumetric swelling (VS) at different relative humidities.
| Treatment Regime | Relative Humidity (%) | |||||
|---|---|---|---|---|---|---|
| 65 | 75 | 98 | ||||
| EMC | VS | EMC | VS | EMC | VS | |
| Untreated | 10.3 ± 0.1 | 5.4 ± 0.2 | 13.1 ± 0.1 | 6.9 ± 0.3 | 17.6 ± 0.1 | 9.7 ± 0.5 |
| P/160/60/5 | 7.3 ± 0.3 | 3.8 ± 0.4 | 8.3 ± 0.3 | 4.3 ± 0.3 | 11.7 ± 0.5 | 6.4 ± 0.4 |
| P/160/120/5 | 6.3 ± 0.3 | 3.0 ± 0.2 | 7.8 ± 0.4 | 3.8 ± 0.2 | 10.6 ± 0.3 | 5.5 ± 0.4 |
| P/160/180/5 | 5.7 ± 0.4 | 2.7 ± 0.2 | 6.7 ± 0.5 | 3.2 ± 0.2 | 8.8 ± 0.5 | 4.6 ± 0.3 |
| P/170/60/4 | 6.1 ± 0.5 | 3.2 ± 0.4 | 7.1 ± 0.5 | 3.8 ± 0.5 | 9.8 ± 0.7 | 5.5 ± 0.6 |
| P/170/90/4 | 5.4 ± 0.4 | 2.9 ± 0.2 | 7.1 ± 0.5 | 3.9 ± 0.3 | 9.1 ± 0.4 | 5.3 ± 0.4 |
| P/170/120/4 | 4.9 ± 0.2 | 2.2 ± 0.4 | 6.2 ± 0.3 | 3.0 ± 0.4 | 8.4 ± 0.5 | 4.3 ± 0.7 |
| P/170/60/6 | 5.3 ± 0.4 | 2.6 ± 0.4 | 6.4 ± 0.5 | 3.1 ± 0.3 | 8.7 ± 0.6 | 4.6 ± 0.4 |
| P/170/90/6 | 5.0 ± 0.5 | 2.2 ± 0.5 | 6.0 ± 0.5 | 2.7 ± 0.5 | 8.0 ± 0.6 | 3.9 ± 0.8 |
| P/170/120/6 | 4.9 ± 0.4 | 2.2 ± 0.4 | 5.8 ± 0.5 | 2.7 ± 0.5 | 7.6 ± 0.8 | 3.7 ± 0.9 |
| P/180/30/5 | 4.8 ± 0.4 | 2.4 ± 0.3 | 5.6 ± 0.4 | 2.8 ± 0.3 | 7.5 ± 0.4 | 3.9 ± 0.4 |
| P/180/60/5 | 4.5 ± 0.2 | 2.2 ± 0.3 | 5.3 ± 0.2 | 2.5 ± 0.4 | 7.3 ± 0.6 | 3.8 ± 0.6 |
Disclaimer/Publisher’s Note: The statements, opinions and data contained in all publications are solely those of the individual author(s) and contributor(s) and not of MDPI and/or the editor(s). MDPI and/or the editor(s) disclaim responsibility for any injury to people or property resulting from any ideas, methods, instructions or products referred to in the content. |
© 2024 by the authors. Licensee MDPI, Basel, Switzerland. This article is an open access article distributed under the terms and conditions of the Creative Commons Attribution (CC BY) license (https://creativecommons.org/licenses/by/4.0/).
Share and Cite
MDPI and ACS Style
Sosins, G.; Grinins, J.; Brazdausks, P.; Zicans, J. Water-Related Properties of Wood after Thermal Modification in Closed Process under Pressure in Nitrogen. Forests 2024, 15, 140. https://doi.org/10.3390/f15010140
AMA Style
Sosins G, Grinins J, Brazdausks P, Zicans J. Water-Related Properties of Wood after Thermal Modification in Closed Process under Pressure in Nitrogen. Forests. 2024; 15(1):140. https://doi.org/10.3390/f15010140
Chicago/Turabian StyleSosins, Guntis, Juris Grinins, Prans Brazdausks, and Janis Zicans. 2024. "Water-Related Properties of Wood after Thermal Modification in Closed Process under Pressure in Nitrogen" Forests 15, no. 1: 140. https://doi.org/10.3390/f15010140
Note that from the first issue of 2016, this journal uses article numbers instead of page numbers. See further details here.