Article

How Much Visual Greenery Can Street Trees Generate from a Humanistic Perspective? An Attempt to Quantify the Canopy Green View Index Based on Tree Morphology

1
School of Architecture, Tsinghua University, Beijing 100084, China
2
College of Landscape and Architecture, Zhejiang A&F University, Hangzhou 311300, China
*
Author to whom correspondence should be addressed.
Forests 2024, 15(1), 88; https://doi.org/10.3390/f15010088
Submission received: 21 November 2023 / Revised: 16 December 2023 / Accepted: 26 December 2023 / Published: 1 January 2024
(This article belongs to the Special Issue Urban Forestry and Sustainable Cities)

Abstract

:
Street trees are essential to urban ecological benefits and human well-being. The canopy morphology relates to the green view index (GVI), which needs to be calculated based on specific tree species. This study conducts a field study on 760 street trees of 3 species from the pedestrian perspective, and explores the differences in canopy GVI and its factors of different specifications of street trees using DBH grading. The results indicate that (1) street trees can provide 20% of the GVI in unilateral streets, with 13% of the GVI in a single canopy. (2) A flat oval crown with a wider canopy width is more effective in providing GVI than a long oval crown, and a CW with a higher canopy GVI highlights this advantage. (3) DBHs of 30 and 40 can be used as grading indicators for Cinnamomum camphora, and the specification requirements can be reduced for Southern magnolia and Chinese privet. (4) The concept of DE is introduced, and new parameters related to the central crown have significant impacts on GVI. The conclusions can improve the GVI application in urban greenery planning as well as have certain implications for the cost management of future seedling cultivation.

1. Introduction

1.1. Overview of the Significance of Street Trees in Cities

Street trees provide environmental, economic, and social benefits to urban communities [1,2]. With the emergence of an increasing number of negative impacts caused by urban diseases, such as urban heat islands and air pollution, street trees can also provide many ecosystem services as well as ecological benefits that cannot be neglected, such as purifying the air discharged by vehicles [3], improving the urban microclimate [4,5,6,7] to promote human thermal comfort [8,9,10,11,12], forming a biological corridor [13] to increase urban biodiversity [14,15], and improving air quality to improve public health [16].
Street trees are increasingly recognized as part of green infrastructure and can be used to provide heat mitigation effects [17,18,19], as well as to manage and reduce stormwater runoff, which is also an ecosystem service [20]. In addition, street trees can also drive street design and even green infrastructure planning [21] to improve urban management practices, which in turn enhance the overall ecosystem service provision by urban forests [22]. Planting street trees and the cover area of tree canopies also involve environmental justice [23,24]; for example, the canopy coverage rate has been indicated to reflect the relationship between residents’ income and living environment and can serve as a basis for urban policy and management decisions [25].
In environmental psychology, street trees play an important role in human restorative benefits and the sense of tension [26,27], and even play an important role in transportation; for example, the density of tree canopy coverage is related to the speed of human pressure recovery [28]; it is also related to some human behaviors, such as driving performance [29] and speed control [30].

1.2. Quantifying the Visible Greenery from Street Tree Canopies Can Promote GVI Application in Urban Planning

The green view index (GVI) is the ratio of the vegetation area in the human view to the total human view area [31,32]. The research area of the GVI is widely used in evaluating the greening effect of cities [33,34,35,36,37,38] as well as landscape justice and equity [39,40,41,42,43] and in combining environmental psychology with human well-being and landscape preferences to provide feedback on environmental benefits [44,45,46]. However, most studies about GVI use street view images as the calculation methods, which are shot in the roadway, but there is a serious lack of GVI data from the pedestrian perspective, which directly affects residents’ perception of green volume in the city. The academic community has also suggested that GVI lacks data reference in the early stages of urban construction and planning [38]; that is, how can we obtain and evaluate the greening levels at the beginning? Which plants and how many plants in specific cities should be planted to obtain what amount of GVI? Therefore, what enters our research field of vision is the application of street trees in research on GVI—it is necessary and urgent to calculate the GVI of specific plant species in urban application scenarios as well as to establish a GVI database in the future; this is essential for urban planning and construction in some postwar reconstruction areas of the world as well as in most underdeveloped countries and regions.

1.3. The Inspiration from Tree Morphology to Quantify the GVI of Street Trees

Studies of tree morphology are focusing more on tree communities such as forests and on the statistical construction of tree growth models [47,48,49], such as evaluating different planting patterns of trees by comparing and evaluating structural variables of tree canopy morphology [49] or studying the influences of different environmental factors on the tree growth mode [50,51]. In addition, there are also studies that innovate the calculation methods of the structural properties of trees by remote sensing, unmanned aerial vehicles, or lidar [51,52,53,54].
Inferred from the definition, the GVI provided by street trees comes entirely from the amount of canopy greenery covered with green leaves. From the perspective of tree morphology, the canopy morphology and related attributes of a specific arbor species should be closely related to the GVI value of urban streetscapes. However, currently, studies on GVI and three-dimensional green quantity of trees mostly calculate the greenery volume through three-dimensional canopy volume [37,55] or obtain a two-dimensional plane by drones and remote sensing [56] for estimation. Therefore, the study of the GVI also urgently needs supplementary research on the quantification of the green volume of specific canopies from human vision.
As known to all, urban environments can impose stress on street trees [1], which may affect the growth mode of tree species. Therefore, there are also some studies that turn the research perspectives to urban areas, focusing on the growth mode of urban trees, and consider it to be good for tree species selection and the cost prediction of greening maintenance management of urban planning and construction as well as the quantification of the benefits [57] or the prediction of the growth rate of trees [58]. This method of measurement, tracking, and evaluation of street trees in specific cities suggests that each city should conduct its own investigation and research on street trees [47,57]. For GVI, the different climate and geography of each city determine the types of street trees used for each city, which may greatly affect the green volume of different cities from the pedestrian perspective. Therefore, it is necessary to calculate the corresponding canopy GVI based on different street trees, which is related to the specific urban greening construction and planning.

1.4. Study Aims

Accordingly, the research gaps above are summarized as below:
  • There is a difference between three-dimensional greenery volume and visible greenery quantity.
  • The canopy GVI of each street tree species needed to be quantified from the pedestrian perspective.
  • The tree morphology studies may need to extend the measurable aspects.
  • The practical application of evaluable GVI is needed in future urban planning and construction.
To solve these gaps to some extent, this study attempts to use tree morphology related to canopy parameters, as an entry point, to measure the visible greenery volume provided by the tree canopy of specific street tree species from a pedestrian perspective. It is also an attempt to establish the GVI database for different cities. Therefore, we will focus on the problems as follows:
(1)
The GVI level provided by a single canopy and unilateral street trees from a pedestrian perspective.
(2)
Intergroup differences in the GVI among the three tree species and their morphological factors.
(3)
The canopy morphology characteristics that can produce a higher GVI and the degree of influence and interpretability of morphological factors on GVI.
(4)
The impact of specifications on the GVI of different street tree species.

2. Materials and Methods

2.1. Sample Selection of Street Tree Species

As the first attempt to establish the GVI database from the perspective of human vision, this study strictly controls the selection and comparison criteria of sample tree species. First, we hope to select representative and widely used street trees as the research object. Second, since all the GVIs provided by the trees come from the tree canopy, the canopy shape, leaf shape, and evergreen attributes are also seen as important factors to be considered. Third, considering the practical factors of the field study, we also referred to the climate conditions of Hangzhou, the research site, and excluded the tree species in the nonsubtropical monsoon climate zone.
Based on the above screening criteria and the city tree selection of existing cities in China, the Camphor tree (Cinnamomum camphora) is set as the city tree in 49 cities, which is the highest ranking, and it is also the city tree in Hangzhou, Zhejiang Province, where this study is located, and the street tree with the highest proportion of usage, accounting for 53.9% [59]. In addition, we also selected similar evergreen broad-leaved trees with ovoid canopies [60]: Chinese privet (Ligustrum lucidum, 9th in terms of evergreen tree usage in China’s city, 3rd in terms of evergreen tree usage in Hangzhou) and Southern magnolia (Magnolia grandiflora, 7th in terms of evergreen tree usage in China’s city) as control groups. The number of street trees was obtained from the newest survey data provided by the planning department of Hangzhou.
The study used G*power (version 3.1.9.6, Heinrich Heine University, Düsseldorf, Germany) to calculate the sample size based on the number of groups and variables, which shows that the sample size of each species is 75. The total number of measured samples was 760, of which 490 were from Camphor trees, 113 from Chinese privet, and 157 from Southern magnolia, and defective trees with poor growth or abnormal canopy shapes were eliminated.

2.2. Contents and Methods of Measurement

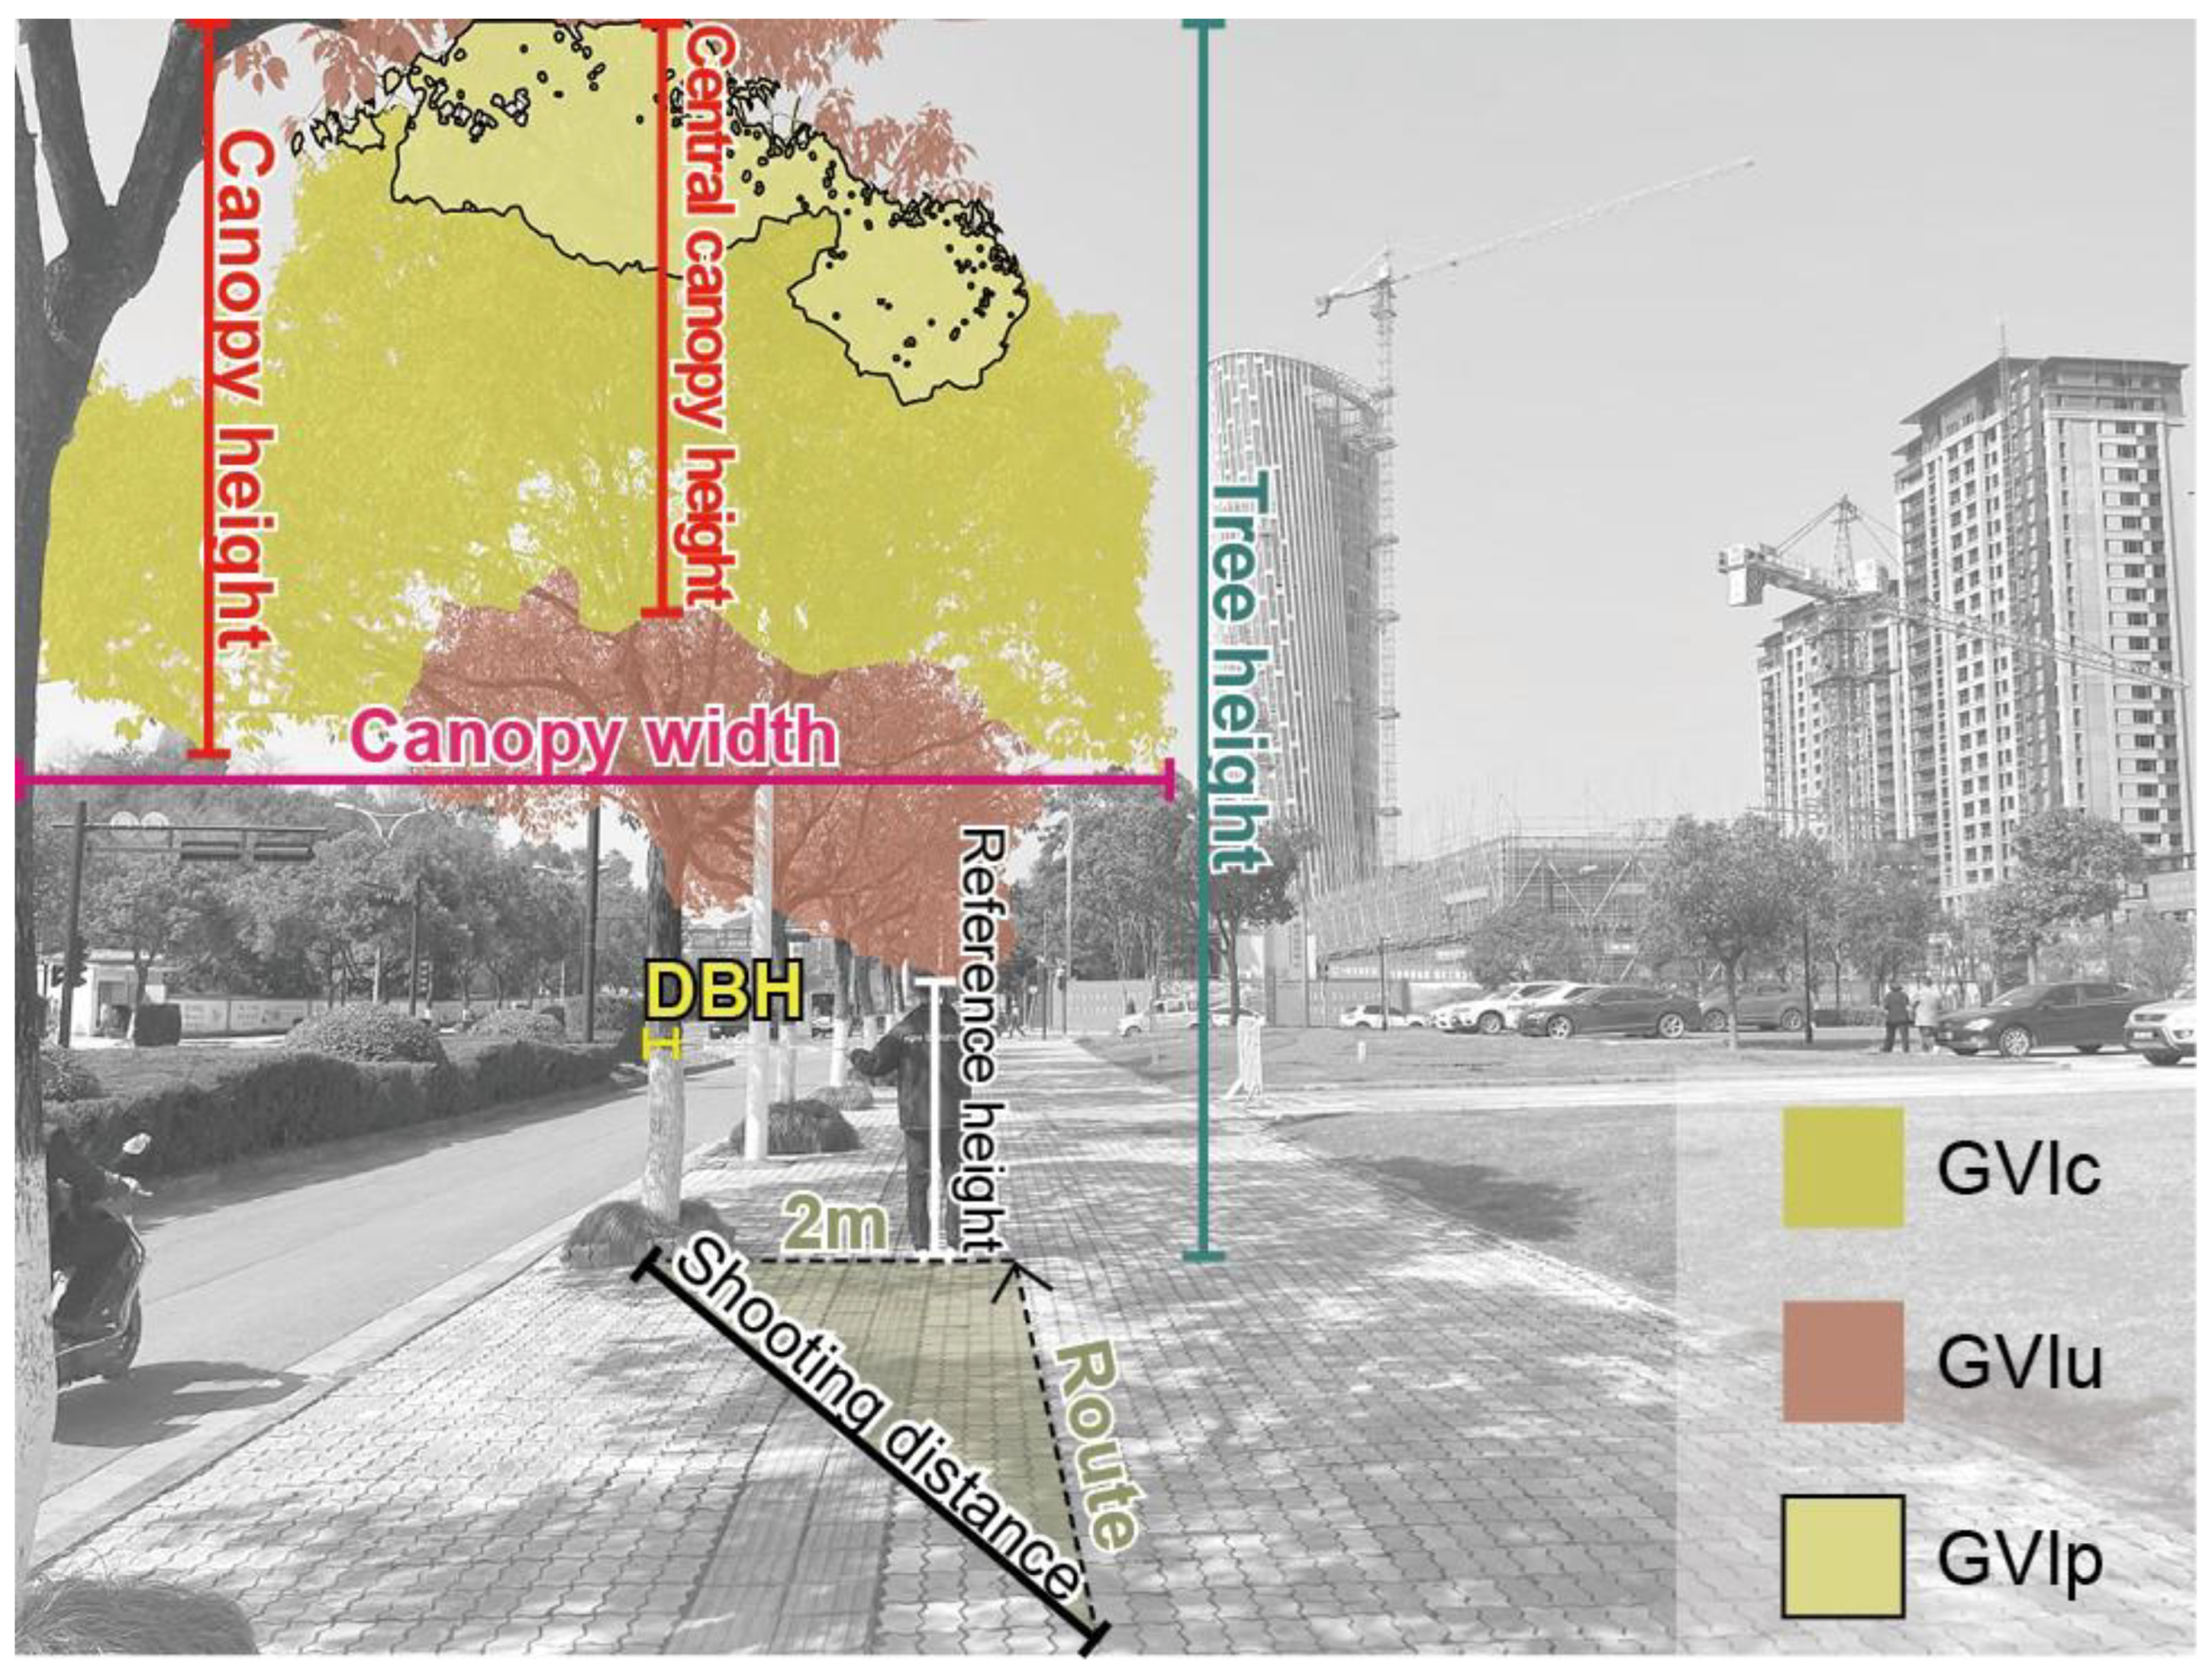
2.2.1. Factors and Parameters of Street Trees

In previous studies, canopy height (CH) and canopy width (CW) have been widely used indicators to describe canopy morphology, and they can also replace the leaf area index in tree growth models [61]. To better manifest the canopy parameters, as the canopy shapes are not always regular geometries to a large extent, this study uses average data of each CW and CH from multidirections to describe. We record the CW measured parallel and perpendicular to the direction of travel as well as the CW in the captured image; for CH, we record the CH value of the canopy on the facade and the centerline of the trunk (Central Canopy Height, CHc), of which the usage of CHc is an innovative attempt that has never appeared in this type of research as far as we know. In addition to the canopy data, this study also records the tree height (TH) and diameter at breast height (DBH) values that relate to the tree ages and species specifications; DBH is classified as 10 cm, so individuals with a DBH below 10 cm are excluded, as they are too young to have normal growth (Figure 1). In addition, to avoid the impact of minor differences in the planting spacing of street trees on the GVI value, only the sidewalks with a planting spacing of 6 to 8 m will be selected.

2.2.2. Calculation of GVI

Currently, there are already mature methods of calculating GVI, such as processing bunches of street images through semantic segmentation for machine learning [62,63]. However, for a single street tree in streetscapes, the extract of the GVI cannot be obtained through semantic segmentation since the visual interface of the pedestrian perspective cannot be obtained through online street view maps, and the extraction of greenery volume by semantic segmentation always aims at the overall layout, so the most detailed level can only reach the GVI division of the structures of trees, shrubs, and grasses [36,64]. Therefore, this study manually calculates the GVI data by Photoshop, which is a more accurate method. In addition, we acquired the images through a field study and set the parameters to fit human vision better in a one-way and level-view pedestrian walkway: The shooting height was 1.64 m, the angle was horizontal, and the camera focal length was 24 mm [65]. What needs to be clarified is that the shooting height is based on Chinese height data released by the Chinese Health Commission in 2020: 169.7 cm for men and 158 cm for women [66]. To eliminate the impact of the shooting position on the visual interface, the shooting route was fixed on the sidewalk 2 m parallel to the planting point of the street tree. At the same time, the canopy of a single tree was photographed only when it was fully exposed at the field-of-view interface, and the researcher recorded the distance from the shooting point to the planting point of the street tree (Shooting Distance, SD).
Unlike previous studies of the GVI, this study calculated the GVI of the unilateral street tree (GVIu), the canopy GVI of a single tree (GVIc), and the GVI covered by the previous trees (GVIp). In the meantime, we excluded the GVI from other vegetation, such as shrubs, grass, and trees in other greenery areas. Therefore, distinguished from automated GVI calculation methods such as semantic segmentation, which cannot extract a single canopy from street trees well (most trees can be covered by previous trees), this study adopted manual selection of relevant canopy areas to calculate the pixel scale by Photoshop (version 23.4.2; Adobe Inc., San Jose, CA, USA).

2.3. Data Analysis

After normal testing, the data distribution of the above factors did not exhibit normality. Therefore, this study used Spearman correlation analysis and nonparametric testing for intergroup difference comparisons. In the nonparametric test, we selected Kruskal–Wallis, which is for groups to test whether the samples come from the same probability distribution when comparing two or more continuous or discrete variables, for multiple comparisons across all samples and adjusted significance values for multiple tests using Bonferroni correction. In addition, this study conducted a multiple linear regression analysis on the tree canopy GVI. The result shows that the adjusted R2 is 0.803, the DW value is 1.561, and the VIFs are basically less than 10 (except for the VIF value of 11.24 for tree height), so the explanatory power of the model is high, and it basically satisfies sample independence, noncollinearity, and homogeneity of variance.

3. Results

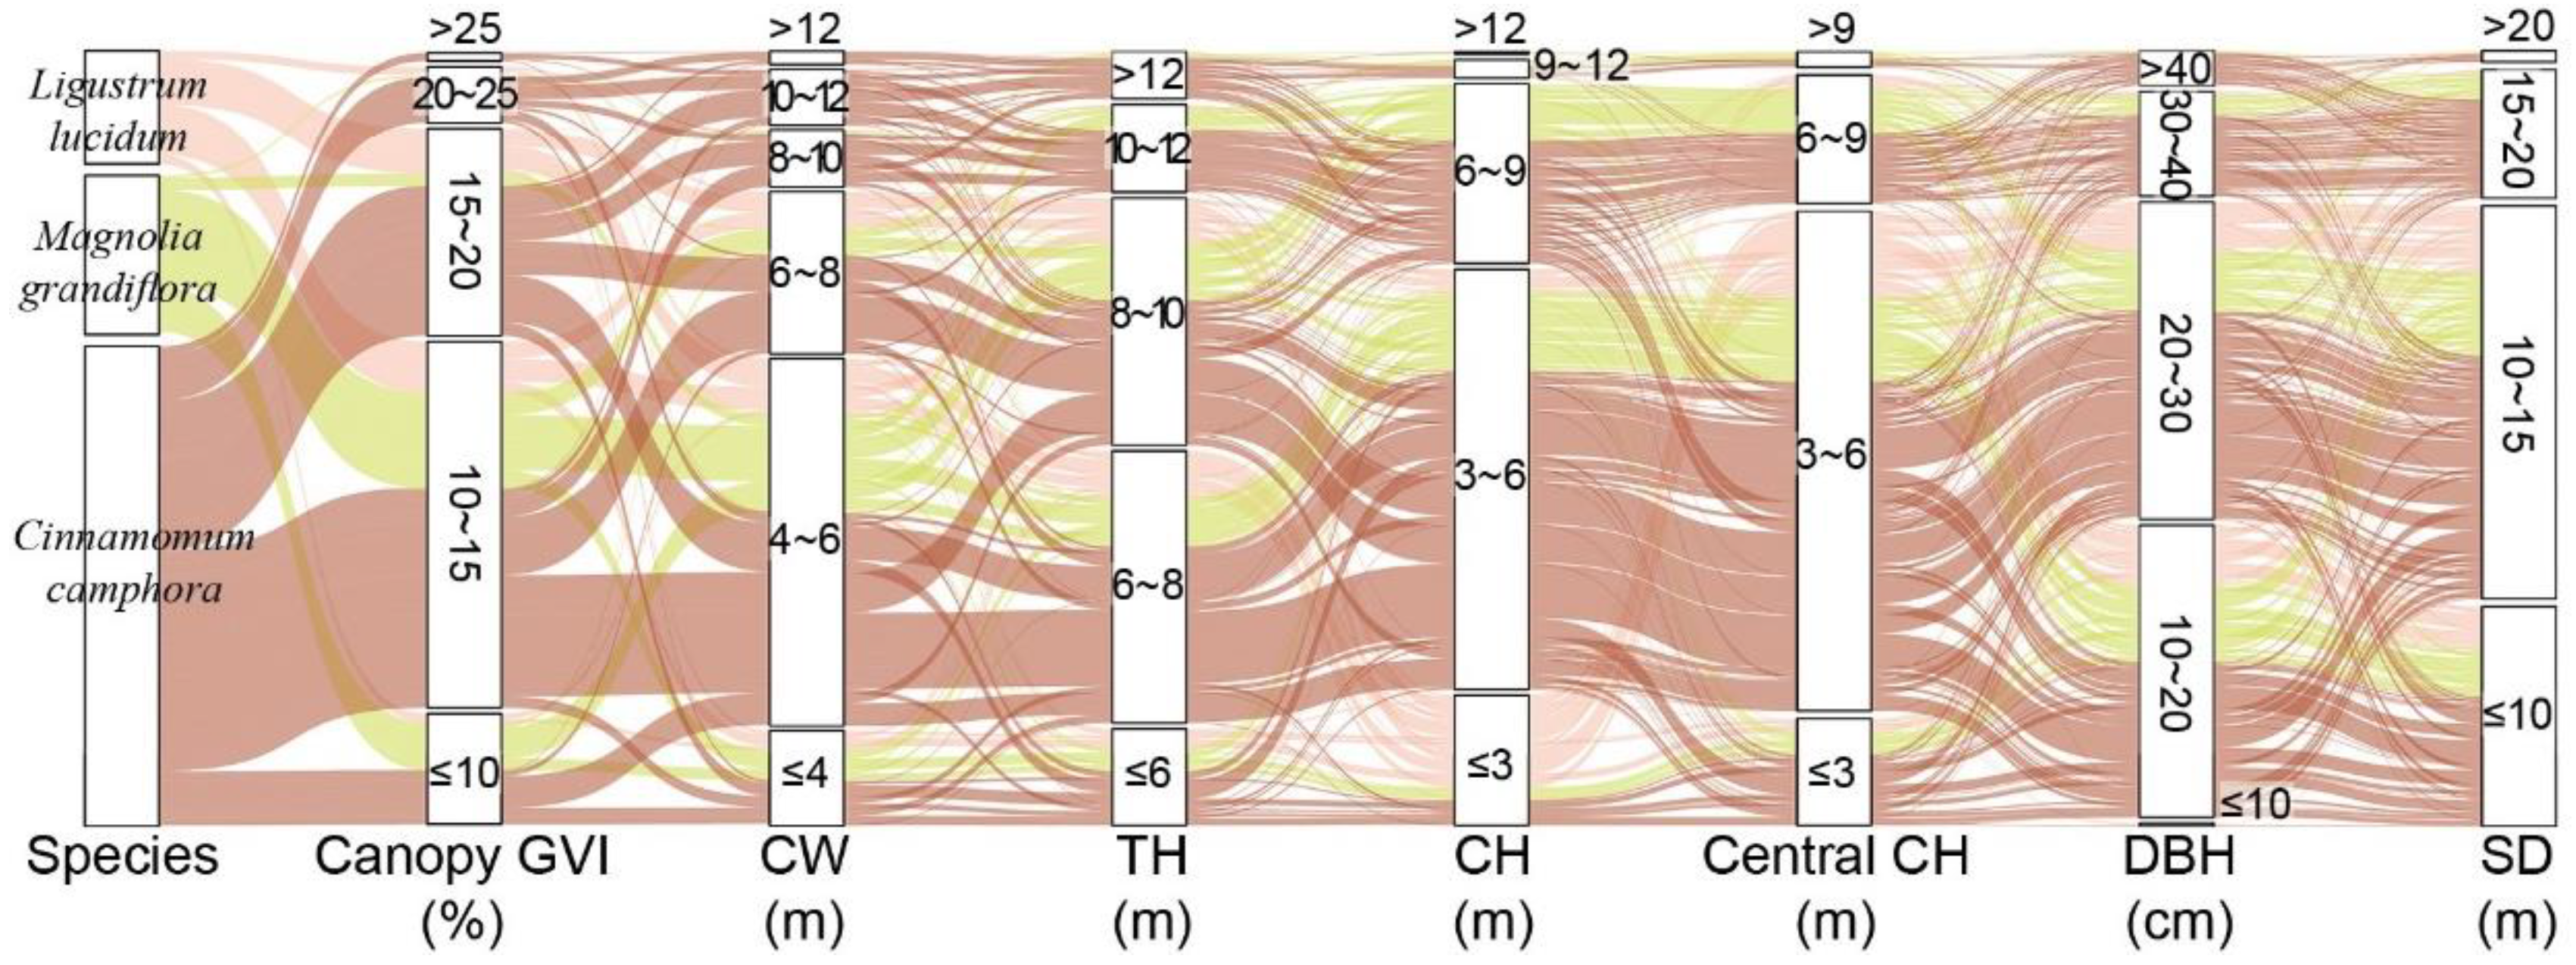
3.1. The Effect of Tree Morphology Factors on Canopy GVI

This study calculates, counts, and classifies the relevant morphological factors (Figure 2). The correlation analysis indicates the relationship between these factors and that with the GVIc (Figure 3).
The factors related to tree growth (CW, CH, CHc, TH, and DBH) are all positively correlated with each other. The taller the trees are, the longer of an SD is needed to meet the requirement for the complete canopy to enter the field-of-view interface. Therefore, there is a positive correlation between SD and the above factors. In addition, there are also positive correlations between GVIc and these factors, corresponding to the common sense that better tree canopy growth can provide more visual green coverage.
This study calculates the ratio of CH to CW (R1) and the ratio of CHc to CW (R2) to quantify the proportion of canopy morphology more precisely. In addition to three factors related to the ratios, we found no correlation between R2 and TH or R2 and CH, which means that R2 is not significantly affected by the growth of the trees themselves and can be viewed independently as a factor to some extent. In fact, in our field research, we find that the shape of the tree canopies can show a certain indentation in the center of the trunk, resulting in a crescent-shaped canopy with green leaves covering it. This is also the reason why CHc is introduced in this study, since the CH value only manifests the height from the top to the end of the canopy but neglects the phenomenon that the lack of leaves at the center of the trunks makes it difficult to provide a greening view.
It is noteworthy that there are negative correlations between GVIc and the two ratios, which can be inferred that the value of canopy diameter plays a more important role in the GVI. It can be easily understood that street trees that have advantages in height often lose part of their greenery due to their inability to fully enter human vision. Even if the tree canopy can be fully displayed at a sufficient distance, it will be obstructed by the front trees, resulting in a decrease in displaying greenery efficiency to a certain extent. In addition, GVIc is not related to SD. The reason for this situation is that this study captured the field-of-view interface only when the tree canopy was fully exposed, which may also indicate that the difference in the green field of view provided by a complete individual tree canopy is not significant.
This study builds a multiple regression model to better clarify the interpretability of tree morphology factors on GVIc. The result shows that the adjusted R2 is 0.58, DW is 1.577, VIFs are basically less than 10, and the standardized residual conforms to a normal distribution. Therefore, the model is well established and has relatively good explanatory power for GVIc (Table 1). From the results, we can clearly see that CHc has a better interpretability than CH on GVIc, which corresponds to the result of the correlation above. In addition, TH and SD have negative interpretability for GVIc, and DBH does not have significant interpretability for GVIc. However, we should clarify that the negative interpretability of SD from the regression model is in line with the perspective law, which should be distinguished from the result from the correlation, and DBH is still an important factor of tree morphology as a selective standard of street trees to be applied in daily urban construction.
We also conducted data visualization of all morphology factors of the three tree species (Figure 4), among which there were many differences in these factors, even though the traditional classification of the canopy morphology of the three tree species was very similar, each having a shape based on an oblate ovoid.
Significant differences in the pairwise interaction between the three species on CH and CW cause there are significant differences in pairwise interaction of the three in R1, among which the CH of Southern magnolia is the highest with the lowest CW, leading to the R1 being the highest so that the canopy shape is more inclined toward a long oval shape, while the R1 of the other two are less than 1 indicating that the canopies of Camphor trees and Chinese privet are more inclined toward flat oval shapes. Similar reasons also occur in CHc, CW, and R2. The R2 values of Camphor trees and Chinese privet are also less than 1. However, the CHc of Chinese privet increased to a level that is not significantly different from that of the other two species, indicating that the central canopy of Chinese privet is fuller and has more greenery volume. In addition, the TH and SD of Chinese privet are the lowest of the three, which are significantly less than those of Camphor trees, while there is no obvious difference between Camphor trees and Southern magnolia in SD. The DBH of Camphor trees is significantly higher than that of the other two, while there is no obvious difference between Southern magnolia and Chinese privet. Overall, Camphor trees are more similar to Chinese privet in canopy morphology, with canopies that are larger, and more inclined toward a flat oval shape, while the canopies of Chinese privet appear slightly shorter but more rounded; however, the canopy morphology of Southern magnolia appears more vertically oviform.

3.2. Quantification of the GVI Provided by Three Street Tree Species

Figure 5A shows that there is no obvious difference in the GVIu level between the three species, which can indicate that in human vision, the GVI provided by continuously planted street trees is approximately 20%, corresponding to the result above that there is no correlation between GVIc and SD.
Figure 5B shows the proportion of the GVIu to the total GVI, manifesting that there are significant differences between the three tree species, among which the proportion of the GVI in roadside trees planted with Chinese privet is the highest (55.05%), while Southern magnolia has the lowest (34.72%). This means that in all greenery areas, the row of Chinese privet can provide more intuitive and effective visible greenery.
However, it should be noted that the compositions of the GVI from the pedestrian perspective are not only street trees but also other vegetation such as shrubs and herbs in central or roadside greenbelts. If the GVIc proportion of a certain canopy completely displayed in human vision is higher, it can reflect that the tree species is spatially closer to human vision to some extent, which means that the use of small specifications of this arbor type can achieve good three-dimensional greening effects.
From the data presented by all samples, the GVIc of a single tree is approximately 13.22% (10.94%~16.51%). Compared with the GVI of 20% provided by a row of street trees mentioned above, the proportion of the GVIc of a single canopy to one row of street trees can achieve 72.08% (61.33%~82.23%), and overall, GVI can achieve 27.83% (19.35%~44.21%), which is a high ratio for a single canopy, indicating that urban greenery construction should pay more attention to arbor application.
Among the three tree species, there is no significant difference in the GVIc between Camphor trees and Chinese privet, while the GVIc of Southern magnolia is significantly lower than the two. In the GVIu to overall trees of the GVI, the smallest proportion still came up with Southern magnolia, while Chinese privet is still the highest (Figure 6). Compared to the analysis results of canopy morphology in Section 3.1, this situation can explain the difference in the GVIc provided by these three types of roadside trees, namely, the flat oval canopy is more effective in providing GVI than the vertical oval canopy, and the canopy with a higher CHc can highlight this advantage.

3.3. Street Tree Specifications and GVIc of Individual Trees

In today’s urban construction, the classification of tree species specifications is often based on DBH, which is related to the economic investment and management of urban greening construction, as well as the selection and application of specific tree species. Therefore, analyzing and comparing the GVIc of tree species and their DBH is of great significance for the planning and application of urban three-dimensional visible green volume, which is also the most important and fundamental work in establishing a GVI database.
Of the three tree species, only Camphor trees had significant differences between DBH and the GVIc, while this difference is not obvious between Southern magnolia and Chinese privet. This result supports that it is more meaningful to cultivate Camphor trees with different specifications. Therefore, this result can enlighten the perspective of saving the cost of future seeding cultivation (Figure 7A). There is no significant difference in the GVIc between a DBH of less than 30 and greater than 40 for Camphor trees, indicating that the DBH of 30 cm and 40 cm can be used as grading indicators for Camphor trees in specification classification.
In the comparison of the same DBH level (Figure 7B), there are significant differences between tree species at a DBH of less than 30, and the sequence of different tree species is the same, with the DBH of Chinese privet being the highest, followed by Camphor trees, and that of Southern magnolia being the lowest. When the DBH is greater than 30, the significant differences between Chinese privet and the other two disappear, possibly because Chinese privet is not as large as the others and does not have a larger canopy, resulting in limited greening supply. However, it is certain that Southern magnolia has significantly lower GVIc ability than the other two species.
This study also shows the comparison of morphology factors at different DBH levels of the three tree species (Figure 8). In the same tree species, the sequences exhibited positive correlation under different DBHs in CH, CHc, CW, and TH.
When the DBH of Camphor trees is greater than 40, these differences among factors are not obvious. When the DBH is greater than 30, there is also no difference in R1, but this difference disappears in R2 when the DBH is greater than 40, and the trends of R1 and R2 are all downward, which means that the ratio of canopy height to canopy width of Camphor trees may be unified until the DBH is greater than 30, and the canopy will continue sagging toward the center until the DBH is approximately 40, which also echoes the conclusion mentioned earlier that the DBH of 30 cm and 40 cm can be used as DBH grading indicators.
The differences In CH and CHc of Southern magnolia disappear at DBHs greater than 30, while significant differences in DBH are observed between CW and TH within 40. However, these characteristics do not affect the canopy ratio of height to width, and there is no significant difference in R1 and R2 between different specifications. Based on the previous conclusion, it can be concluded that there is no significant difference between the canopy shape and the GVIc provided by Southern magnolia and the specifications of individual trees. Therefore, in urban planning and construction, the pursuit of tree specifications for Southern magnolia can be reduced. For healthy and shaped Southern magnolia, when the DBH reaches 10 cm, it can be considered for urban greening use.
Similar to Southern magnolia, the differences in various morphological factors of Chinese privet also disappear at DBHs greater than 30 and do not affect its overall canopy morphology (in addition to a certain decrease in R1 when the DBH is under 30, which also indicates that the canopy of Chinese privet, similar to Camphor trees, forms at approximately 30), so the demand can also be reduced for the specifications of Chinese privet. However, the difference is the GVIc level of Chinese privet and its ability to provide a better proportion of green field of view than Southern magnolia and a similar proportion of green field of view as Camphor trees. Compared to Camphor trees, Chinese privet has a stable R2 at a level of greater than 0.8, indicating that the canopy of Chinese privet is fuller and that its application in urban greening can demonstrate a certain degree of economy and efficiency.
Based on the comparison of morphology factors of different tree species at the same DBH level (Figure 9), the canopies of the three species have their own distinct and uniform characteristics. Taking DBH as the boundary of 30, there is a significant difference in CH, with Southern magnolia being the highest and Chinese privet being the shortest, but when DBH is greater than 30, the difference between Camphor trees and Southern magnolia disappears. The intergroup differences in CHc are less than those in CH, which is more reflected in Camphor trees and Southern magnolia. When the DBH is greater than 30, the difference in CHc between tree species disappears. In CW, Camphor trees always show differences from the other two, which means that Camphor trees take the longest time to grow in CW. However, the CW of Southern magnolia is the lowest, and when the DBH is greater than 30, the difference between Southern magnolia and Chinese privet disappears. In addition, the difference in TH between tree species of the same specification is basically not significant. Notably, under these specifications, the differences in R1 and R2 among tree species are very significant and have the same sequence; that is, the R1 and R2 of Southern magnolia are the highest, and the canopy is more elongated and ovoid, while Camphor trees and Chinese privet are flat and ovoid, but the central canopy of Chinese privet is plumper.

3.4. Display Efficiency of Single-Street-Tree GVI

This study has drawn some conclusions about GVIc and tree morphological factors, which further raises the question considered in this study: are street trees efficient at GVI display?
To fully measure the canopy data, this study only took photos when the canopy of a single tree was fully exposed in view. In reality, when people walk, excessively tall tree canopies often cannot enter the human visual interface, and there is an upper limit to the visual angle of a person [65]. In addition, due to perspective reasons, even if a certain tree canopy fully enters the field-of-view interface, it will be largely obscured by the front trees to some extent. Therefore, we believe that there is a way to evaluate the display efficiency (DE) of visible greenery quantity for different street tree species, and we suppose that some trees with smaller dimensions, but more rounded canopies can better fill the unobstructed human vision, resulting in higher DE. From the results of this study, Camphor trees and Chinese privet are typical examples: Compared to Camphor trees, although Chinese privet has less three-dimensional green space, people do not need to walk far to see the complete canopy, and the SD when the complete canopy is exposed is shorter to have a higher GVIc.
This study attempts to calculate the DE. We think it should be a ratio related to the GVIc, the GVIp, and the SD. First, it should calculate the ratio of the value of the unobstructed GVIc to the GVIc, and the SD may be inversely proportional to the DE, referred from the results of correlation and the multiple regression model:
D E = G V I c G V I p G V I c × S D
In the comparison of the same tree species (Figure 10A), the DE of Camphor trees is significantly lower than the other two, which is in line with the characteristic of whose canopy is more extended in width; however, the reason why there is no difference between DE of Southern magnolia and Chinese privet may be due to the obstructed proportion less than the other two in width of the canopy of Southern magnolia, which is a higher oval canopy, under perspective. In the comparison of specifications of the same tree species (Figure 10B), the descending trend of DBH as DBH increases is obvious, corresponding to the speculation above. In addition, the insignificant intergroups of the three tree species are also in line with the results of the specification grading of the three in Section 3.3.

4. Discussion

4.1. New Parameters of Tree Morphology Used in This Study

Based on the initial impression that the first factor affecting the amount of green canopy is tree growth, this study first focuses on the growth factors of roadside trees (TH, DBH, CH, and CW). Second, as GVIc is entirely derived from green leaves, this study further focuses on the morphology of the canopy, which is also related to the growth of the tree, to conduct preliminary tree species selection. However, we find that as trees compete for growth, the canopy of roadside trees often reduces the growth of green leaves in the central canopy, thereby expanding the extension of the canopy top and forming a concave canopy. Although the canopy of the street tree can still present a relatively complete shape from a pure façade perspective, the concave center of the canopy is obvious from a pedestrian perspective, and this situation is most prominent in Camphor trees.
Due to the consideration of the concave phenomenon in the canopy mentioned above, this study introduces factors such as CHc, R1, and R2, which are related to the central canopy parameters, to describe the canopy shape more accurately. These indicators also demonstrate some important significance. First, the explanatory power of CHc in the multiple linear regression model for GVIc is higher than that of CH. Compared with R1, R2 has higher independence and interpretability for GVIc, highlighting the importance of central green content in canopies. Second, R1 and R2 indicate that CW is more important for GVIc, which lays the foundation for the conclusion that flat oval tree canopies can provide more GVIc in this study. From the sequences of the R1, R2, and GVIc levels among the three tree species, R1 indicates the morphological differences among the three tree species, namely, whether the canopy shape is higher or flatter, and R2 obtains the difference in canopy concavity among the three tree species.
In addition, the conception and calculation of DE are the preliminary ideas proposed in this article, and further research is needed to increase the accuracy. We believe that the concept of DE can be used to calculate the current utilization efficiency of the GVIc of street trees and can be used as one of the greening evaluation parameters for urban streetscapes with certain application value in the future.

4.2. GVI Application from the Perspectives of Pedestrians

The visual interface of previous research on street GVI has come from street view images downloaded online, which are all perspectives of roadways. In the quantified results, existing studies focusing on GVI in streetscapes manifest that a GVI of 30% can be regarded as a good greenery level to be applied in urban planning and evaluation [32,38], but this can serve as a reference only for the perspective of the roadway. From the pedestrian perspective, this standard may not be 30%, since the roadside greenbelt is closer to human vision, and tree canopy coverage can also increase a higher proportion of the GVI; therefore, these grading standards should be reevaluated and determined based on the pedestrian scene and even evaluated for different modes of travel. In addition, a previous study in residential areas indicated that a 20% difference can be used as a grading indicator for GVI [44]. Therefore, we suggest that a ratio of 1/5 is a high level for greenery volume in human vision for unilateral street trees, and it is also a high proportion of the GVIc from single trees to provide approximately 13%.

4.3. Keep a Balance between Visible Greenery Quantity and Ecoservices of Urban Street Greening

This study takes three species of street trees as an example to show that each city can establish its GVI database based on the vegetation they plant in their streets, even in community or other scenarios. Considering the GVIc provided by the tree species mentioned in this study and the GVI display efficiency, we believe that the GVI provided by street trees is only a numerical reference for urban visible greenery volume planning. The application of street trees in real scenarios also needs to consider the ecological benefits of specific tree species, such as improving thermal comfort for residents, dust retention, and air purification for urban ecology. In addition, other factors such as the green coverage provided by the size of the tree canopy also need to be considered.
For streetscapes, the ecosystem services provided by urban greening are also the ultimate goals of street trees. The visible greenery quantity, studied as canopy GVI in this paper, can be one of the factors to weigh whether a street tree is suitable to be planted or not; it also can become the weight of an eco-efficiency model of a specific tree.
As we know, large trees often provide more three-dimensional green volume resulting in greater ecological benefits, but the visible greenery quantity as this paper studied may provide another state and topic that large trees may not offer sufficient visible greenery quantity for residents, since the ergonomics and environmental psychology under the influence of human vision is becoming increasingly important.
But for biodiversity that relates to improving ecoservices, a multi-planting method definitely can be a good way to increase the eco-benefits and GVI levels to some extent. However, there may not be a positive relationship among biodiversity, ecoservices, and GVI levels in streetscapes. In previous studies, it is the tree–shrub vegetation structure but not a complete structural layer in urban streets that can provide more eco-benefits [67] and GVI levels [38]. In addition, a street environment can be really serious for vegetation to survive, especially for grasses. Therefore, we also should keep a balance among the streetscapes’ management cost, the survival rate of roadside vegetation, and street biodiversity, rather than focusing on the visual greenery or idealized eco-benefits.
For this paper, as a preliminary attempt to establish a GVI database for street trees, we think quantification is the first step. The research gap shows that fulfilling ecoservices and visible greenery of urban greening can be a noteworthy innovation. Therefore, it is an inspiration for a balance between street trees’ ecoservices and pedestrian visual experience for further research.

4.4. How GVIc Can Improve the Planning and Management of Urban Street Greening

  • It is different between three-dimensional greenery volume and visible greenery quantity.
There are some previous studies that have measured specific trees’ three-dimensional greenery volume by three-dimensional point-cloud or statistical models [44,45,46,47,48,49,50]. However, we found visible greenery quantity could vary in the same tree since the pedestrian is moving, and larger tree species may have taller canopies, thus leading to a strict method of field study. Both reasons can result in the canopies not displaying fully in human vision. Therefore, we cannot equal the two together. Since 3D greenery volume can stand for ecosystem services to some extent, therefore, this study can inspire urban regulators to balance the visible greenery and urban ecology from different perspectives.
  • Inspirations of urban greening management cost from the perspective of tree selection.
In urban greening construction, plant size with reference to DBH is a common criterion for urban plant selection. Therefore, urban planners also need to know the canopy GVI levels generated by a certain DBH of a specific tree.
This study has shown the relationship between street tree specifications and the GVIc of individual trees. Under these results we can focus the specification more on specific species, such as the Camphor tree in this paper, to reduce the cost of certain tree species in seedling selection, which will provide inspiration for urban construction management.
  • The establishment of the GVI database for each city.
Previous studies have revealed that the GVI standard can vary along with the urban greening scenarios [38,44]. To establish a GVI database of various urban trees for reference in future urban visual greenness planning, each city needs to quantify the planted vegetation in different urban areas, such as roadsides, parks, communities, and so on. In this paper, we focus on the tree structure; however, in the future, the studied vegetation should be incorporated with sub-arbors and shrubs, or even grasses to enlarge the GVI database of different cities all over the world to offer a quantification reference for urban planners’ urban visible greenery planning and constructions.
  • Utilizing the canopy GVI to improve the GVI application in the urban planning stage.
The existing urban greening index system focuses on two-dimensional indicators, such as green space rate and green coverage rate, which cannot fully reflect the level of urban greening, so there is an urgent need for three-dimensional greening indexes to be supplemented and perfected [38]. GVI, as a three-dimensional greening indicator that is closely related to human vision, is a new indicator with the most potential to be incorporated into the urban greening index system in the future. However, GVI is a post-use evaluation indicator, and if we want to use it in the planning stage, we have to quantify the visual greening brought by vegetation planting.
Therefore, GVIc is an index extended from the GVI, which is used to measure the canopy visual greenness of individual trees. In the future, the GVIc of a specific tree species should be combined with the ecoservices and the environmental psychological benefits as an evaluation standard to judge a species whether it should be used in urban greening construction or not.

4.5. Strengths and Prospects

This article is the first study to focus on specific tree species and their canopies in the GVI, and it is the first attempt to establish the GVI database. This article introduces new parameters related to the central canopy and provides new insights into the relationship between canopy morphology and the GVIc. In addition, this study also proposed the concept of DE and proposed preliminary calculation methods. The conclusions of this study can provide a reference for the application of tree species in urban three-dimensional green quantity planning and have certain implications for the cost management of future seedling cultivation.
We have also considered work that can be continued in the future. We believe that specific types of the GVI can be further supplemented for different tree species to expand the GVI database, such as other canopy shapes, plants with other structural layers, and differences in the same tree species in different cities or climatic regions. However, due to research on the current application status of street trees in Hangzhou, apart from Camphor trees, there are very few other evergreen street trees that can meet the screening criteria in this article. We have tried our best to meet the diversity of specifications and sample size requirements, and we hope to collect data on the three street trees of this article in other cities. Moreover, we believe that the planting spacing should have an impact on canopy growth and shape shaping, as well as the GVI of a single tree, which should be taken seriously by other studies. However, for current urban sidewalks, planting spacing is relatively fixed, so it is not discussed in this article, but it is a controlled variable. Additionally, the grading indicators or policy formulation of the GVI can be studied in more detail based on different modes of travel or road types.

5. Conclusions

From the pedestrian perspective, a multiple regression model is established between canopy shape factors and GVIc. The correlation and interpretability between GVIc and these factors are analyzed, and the impact of each factor on GVIc is explored. The study quantifies, compares, and analyzes the GVIc values and green volume ratios of three tree species with oval-based shapes under a single tree and unilateral street trees and explores the differences in the GVIc and its form factors of different specifications of street trees using DBH grading as the entry point. The conclusion is as follows:
(1)
Visible greenery quantification of three species of street trees
(a)
Street trees can provide a large amount of visible green volume:
  • Unilateral street trees can provide approximately 20% of the GVI.
  • A single tree canopy can provide approximately 13% of the GVI.
(b)
The proportion sequence of visible greenery in the overall GVI in three species of street trees’ canopies:
  • Camphor trees and Chinese privet can produce similar levels of the GVI.
  • Chinese privet has the highest proportion of global GVI, while Southern magnolia provides the lowest levels and proportions of the GVI.
(2)
Factors of canopy morphology relate to the GVI
(a)
A flat oval crown with a wider CW is more effective in providing GVI than a long oval crown with a higher CW, and a CW with a higher CHc highlights this advantage.
(b)
The new parameters related to the central crown (CHc and R2) have a significant impact on GVI and can be applied to tree morphology research.
(3)
Significance of DBH for tree specification and visible greenness
(a)
DBHs of 30 and 40 can be used as grading indicators for Camphor trees.
(b)
DBH of 30 can be used as a grading indicator for Southern magnolia and Chinese privet in the specification division.
(c)
The relationship between GVIc and tree specifications of Southern magnolia and Chinese privet is not obvious, which can reduce the specification requirements for both, thereby saving the cost of future seedling cultivation.
(4)
The new concept of GVI display efficiency
This article introduces the concept of DE and establishes a preliminary calculation formula. It is found that it can match the sequence of relevant GVIc under three street tree species and has future research value.
This study innovatively incorporates the GVIc of individual trees into the research field, which is the first attempt to establish a GVI database based on specific tree species applications. It can provide quantitative reference for urban three-dimensional green volume construction in the planning stage, and provide urban management and economic construction significance for street trees from the perspective of seedling cultivation.

Author Contributions

Conceptualization, H.Z. and X.N.; methodology, H.Z. and X.N.; software, H.Z.; validation, H.Z., X.N., N.K. and S.L.; formal analysis, H.Z.; investigation, H.Z. and X.N.; data curation, H.Z.; writing—original draft preparation, H.Z.; writing—review and editing, H.Z., X.N., N.K. and S.L.; visualization, H.Z.; supervision, S.L.; project administration, N.K. and S.L.; funding acquisition, S.L. All authors have read and agreed to the published version of the manuscript.

Funding

This work was supported by the National Natural Science Foundation of China [grant numbers 51978364].

Data Availability Statement

The data presented in this study are available on request from the corresponding author.

Conflicts of Interest

The authors declare no conflicts of interest.

References

  1. Mullaney, J.; Lucke, T.; Trueman, S.J. A review of benefits and challenges in growing street trees in paved urban environments. Landsc. Urban Plan. 2015, 134, 157–166. [Google Scholar] [CrossRef]
  2. Im, J. Green streets to serve urban sustainability: Benefits and typology. Sustainability 2019, 11, 22. [Google Scholar] [CrossRef]
  3. Wu, D.; Gong, J.H.; Liang, J.M.; Sun, J.; Zhang, G.Y. Analyzing the influence of urban street greening and street buildings on summertime air pollution based on street view image data. ISPRS Int. J. Geo-Inf. 2020, 9, 16. [Google Scholar] [CrossRef]
  4. Vailshery, L.S.; Jaganmohan, M.; Nagendra, H. Effect of street trees on microclimate and air pollution in a tropical city. Urban For. Urban Green. 2013, 12, 408–415. [Google Scholar] [CrossRef]
  5. Gillner, S.; Vogt, J.; Tharang, A.; Dettmann, S.; Roloff, A. Role of street trees in mitigating effects of heat and drought at highly sealed urban sites. Landsc. Urban Plan. 2015, 143, 33–42. [Google Scholar] [CrossRef]
  6. Sanusi, R.; Johnstone, D.; May, P.; Livesley, S.J. Microclimate benefits that different street tree species provide to sidewalk pedestrians relate to differences in Plant Area Index. Landsc. Urban Plan. 2017, 157, 502–511. [Google Scholar] [CrossRef]
  7. Tan, Z.; Lau, K.K.L.; Ng, E. Urban tree design approaches for mitigating daytime urban heat island effects in a high-density urban environment. Energy Build. 2016, 114, 265–274. [Google Scholar] [CrossRef]
  8. Emmanuel, R.; Rosenlund, H.; Johansson, E. Urban shading—A design option for the tropics? A study in Colombo, Sri Lanka. Int. J. Climatol. 2007, 27, 1995–2004. [Google Scholar] [CrossRef]
  9. Klemm, W.; Heusinkveld, B.G.; Lenzholzer, S.; van Hove, B. Street greenery and its physical and psychological impact on thermal comfort. Landsc. Urban Plan. 2015, 138, 87–98. [Google Scholar] [CrossRef]
  10. Yoshida, A.; Hisabayashi, T.; Kashihara, K.; Kinoshita, S.; Hashida, S. Evaluation of effect of tree canopy on thermal environment, thermal sensation, and mental state. Urban Clim. 2015, 14, 240–250. [Google Scholar] [CrossRef]
  11. Jia, S.; Wang, Y. Effect of heat mitigation strategies on thermal environment, thermal comfort, and walkability: A case study in Hong Kong. Build. Environ. 2021, 201, 107988. [Google Scholar] [CrossRef]
  12. Hendra, S.; Imam, B.; Anang, W. Green infrastructure modelling for UHI control to urban thermal comfort: A case study of Temanggung urban area. Int. J. Urban Sci. 2023. [Google Scholar] [CrossRef]
  13. Omar, M.; Schneider-Maunoury, L.; Barr, K.; Sayed, N.A.; Halwani, J.; Machon, N. Colonization and extinction dynamics among the plant species at tree bases in Paris (France). Ecol. Evol. 2019, 9, 8414–8428. [Google Scholar] [CrossRef] [PubMed]
  14. Geary, M.; Brailsford, C.J.; Hough, L.I.; Baker, F.; Guerrero, S.; Leon, Y.M.; Collar, N.J.; Marsden, S.J. Street-level green spaces support a key urban population of the threatened Hispaniolan parakeet Psittacara chloropterus. Urban Ecosyst. 2021, 24, 1371–1378. [Google Scholar] [CrossRef]
  15. Gomes, I.N.; Bosenbecker, C.; Silva, V.H.; Cardoso, J.C.; Pena, J.C.; Maruyama, P.K. Spatiotemporal availability of pollinator attractive trees in a tropical streetscape: Unequal distribution for pollinators and people. Urban For. Urban Green. 2023, 83, 127900. [Google Scholar] [CrossRef]
  16. Seok, Y.; Yim, H.; Moon, T.; Chon, J. Street tree planning to improve public health and ecosystem resilience in urban areas: A scenario analysis using a system dynamics model. Int. J. Environ. Res. Public Health 2022, 19, 1625. [Google Scholar] [CrossRef] [PubMed]
  17. Chen, T.; Meili, N.; Fatichi, S.; Hang, J.; Tan, P.Y.; Yuan, C. Effects of tree plantings with varying street aspect ratios on the thermal environment using a mechanistic urban canopy model. Build. Environ. 2023, 246, 111006. [Google Scholar] [CrossRef]
  18. de Quadros, B.M.; Mizgier, M.G.O. Urban green infrastructures to improve pedestrian thermal comfort: A systematic review. Urban For. Urban Green. 2023, 88, 128091. [Google Scholar] [CrossRef]
  19. Peluso, P.; Persichetti, G.; Moretti, L. Effectiveness of Road Cool Pavements, Greenery, and Canopies to Reduce the Urban Heat Island Effects. Sustainability 2022, 14, 16027. [Google Scholar] [CrossRef]
  20. Selbig, W.R.; Loheide, S.P.; Shuster, W.; Scharenbroch, B.C.; Coville, R.C.; Kruegler, J.; Avery, W.; Haefner, R.; Nowak, D. Quantifying the stormwater runoff volume reduction benefits of urban street tree canopy. Sci. Total Environ. 2022, 806, 151296. [Google Scholar] [CrossRef]
  21. Fernandes, C.O.; da Silva, I.M.; Teixeira, C.P.; Costa, L. Between tree lovers and tree haters. Drivers of public perception regarding street trees and its implications on the urban green infrastructure planning. Urban For. Urban Green. 2019, 37, 97–108. [Google Scholar] [CrossRef]
  22. Shah, A.M.; Liu, G.; Huo, Z.; Yang, Q.; Zhang, W.; Meng, F.; Yao, L.; Ulgiati, S. Assessing environmental services and disservices of urban street trees. an application of the emergy accounting. Resour. Conserv. Recycl. 2022, 186, 106563. [Google Scholar] [CrossRef]
  23. Baró, F.; Calderón-Argelich, A.; Langemeyer, J.; Connolly, J.J. Under one canopy? Assessing the distributional environmental justice implications of street tree benefits in Barcelona. Environ. Sci. Policy 2019, 102, 54–64. [Google Scholar] [CrossRef] [PubMed]
  24. Pistón, N.; Silva Filho, D.S.; Dias, A.T. Social inequality deeply affects people’s perception of ecosystem services and disservices provided by street trees. Ecosyst. Serv. 2022, 58, 101480. [Google Scholar] [CrossRef]
  25. Greene, C.S.; Robinson, P.J.; Millward, A.A. Canopy of advantage: Who benefits most from city trees? J. Environ. Manag. 2018, 208, 24–35. [Google Scholar] [CrossRef] [PubMed]
  26. Calvi, A. Does roadside vegetation affect driving performance?: Driving simulator study on the effects of trees on drivers’ speed and lateral position. Transp. Res. Rec. 2015, 2518, 1–8. [Google Scholar] [CrossRef]
  27. Fitzpatrick, C.D.; Samuel, S.; Knodler, M.A., Jr. Evaluating the effect of vegetation and clear zone width on driver behavior using a driving simulator. Transp. Res. Part F Traffic Psychol. Behav. 2016, 42, 80–89. [Google Scholar] [CrossRef]
  28. Jiang, B.; Chang, C.Y.; Sullivan, W.C. A dose of nature: Tree cover, stress reduction, and gender differences. Landsc. Urban Plan. 2014, 132, 26–36. [Google Scholar] [CrossRef]
  29. Jiang, B.; He, J.; Chen, J.; Larsen, L. Moderate is optimal: A simulated driving experiment reveals freeway landscape matters for driving performance. Urban For. Urban Green. 2021, 58, 126976. [Google Scholar] [CrossRef]
  30. Antonson, H.; Mårdh, S.; Wiklund, M.; Blomqvist, G. Effect of surrounding landscape on driving behaviour: A driving simulator study. J. Environ. Psychol. 2009, 29, 493–502. [Google Scholar] [CrossRef]
  31. Aoki, Y. Relationship between percieved greenery and width of visual fields. J. Jpn. Inst. Landsc. Archit. 1987, 51, 1–10. [Google Scholar] [CrossRef]
  32. Aoki, Y. Evaluation methods for landscapes with greenery. Landsc. Res. 1991, 16, 3–6. [Google Scholar] [CrossRef]
  33. Yu, S.; Yu, B.; Song, W.; Wu, B.; Zhou, J.; Huang, Y.; Wu, J.; Zhao, F.; Mao, W. View-based greenery: A three-dimensional assessment of city buildings’ green visibility using Floor Green View Index. Landsc. Urban Plan. 2016, 152, 13–26. [Google Scholar] [CrossRef]
  34. Labib, S.M.; Huck, J.J.; Lindley, S. Modelling and mapping eye-level greenness visibility exposure using multi-source data at high spatial resolutions. Sci. Total Environ. 2021, 755, 143050. [Google Scholar] [CrossRef]
  35. Li, T.; Zheng, X.; Wu, J.; Zhang, Y.; Fu, X.; Deng, H. Spatial relationship between green view index and normalized differential vegetation index within the Sixth Ring Road of Beijing. Urban For. Urban Green. 2021, 62, 127153. [Google Scholar] [CrossRef]
  36. Xiao, L.; Wang, W.; Ren, Z.; Fu, Y.; Lv, H.; He, X. Two-city street-view greenery variations and association with forest attributes and landscape metrics in NE China. Landsc. Ecol. 2021, 36, 1261–1280. [Google Scholar] [CrossRef]
  37. Hu, T.; Wei, D.; Su, Y.; Wang, X.; Zhang, J.; Sun, X.; Liu, Y.; Guo, Q. Quantifying the shape of urban street trees and evaluating its influence on their aesthetic functions based on mobile lidar data. ISPRS J. Photogramm. Remote Sens. 2022, 184, 203–214. [Google Scholar] [CrossRef]
  38. Zhu, H.; Nan, X.; Yang, F.; Bao, Z. Utilizing the green view index to improve the urban street greenery index system: A statistical study using road patterns and vegetation structures as entry points. Landsc. Urban Plan. 2023, 237, 104780. [Google Scholar] [CrossRef]
  39. Gu, W.; Chen, Y.; Dai, M. Measuring community greening merging multi-source geo-data. Sustainability 2019, 11, 1104. [Google Scholar] [CrossRef]
  40. Cui, Q.; Huang, Y.; Yang, G.; Chen, Y. Measuring green exposure levels in communities of different economic levels at different completion periods: Through the lens of social equity. Int. J. Environ. Res. Public Health 2022, 19, 9611. [Google Scholar] [CrossRef]
  41. Luo, J.; Zhai, S.; Song, G.; He, X.; Song, H.; Chen, J.; Liu, H.; Feng, Y. Assessing inequity in green space exposure toward a “15-minute city” in Zhengzhou, China: Using deep learning and urban big data. Int. J. Environ. Res. Public Health 2022, 19, 5798. [Google Scholar] [CrossRef] [PubMed]
  42. Xue, C.; Jin, C.; Xu, J. Inequality in urban green space benefits: Combining street greenery and park greenery. PLoS ONE 2022, 17, e0273191. [Google Scholar] [CrossRef] [PubMed]
  43. Liu, C.; Wang, Y.T.; Guo, X.H.; Wang, L.F. Equity evaluation of urban green space in the main urban area of Wuhan based on green view index. J. Appl. Ecol. 2023, 34, 1083–1090. [Google Scholar] [CrossRef]
  44. Zhu, H.; Yang, F.; Bao, Z.; Nan, X. A study on the impact of Visible Green Index and vegetation structures on brain wave change in residential landscape. Urban For. Urban Green. 2021, 64, 127299. [Google Scholar] [CrossRef]
  45. Huang, S.; Zhu, J.; Zhai, K.; Wang, Y.; Wei, H.; Xu, Z.; Gu, X. Do emotional perceptions of visible greeneries rely on the largeness of green space? A verification in Nanchang, China. Forests 2022, 13, 1192. [Google Scholar] [CrossRef]
  46. Lu, S.; Oh, W.; Ooka, R.; Wang, L. Effects of environmental features in small public urban green spaces on older adults’ mental restoration: Evidence from Tokyo. Int. J. Environ. Res. Public Health 2022, 19, 5477. [Google Scholar] [CrossRef] [PubMed]
  47. Llaguno-Munitxa, M.; Edwards, M.; Grade, S.; Meulen, M.V.; Letesson, C.; Sierra, E.A.; Altomonte, S.; Lacroix, E.; Bogosian, B.; Kris, M.; et al. Quantifying stress level reduction induced by urban greenery perception. In IOP Conference Series: Earth and Environmental Science; IOP Publishing: Bristol, UK, 2022; Volume 1122, p. 012021. [Google Scholar] [CrossRef]
  48. Peng, F.; Zheng, H.; Lu, S.; Shi, Z.; Liu, X.; Li, L. Growth model and visualization of a virtual jujube tree. Comput. Electron. Agric. 2019, 157, 146–153. [Google Scholar] [CrossRef]
  49. Shoda, T.; Imanishi, J.; Shibata, S. Growth characteristics and growth equations of the diameter at breast height using tree ring measurements of street trees in Kyoto City, Japan. Urban For. Urban Green. 2020, 49, 126627. [Google Scholar] [CrossRef]
  50. Laubhann, D.; Sterba, H.; Reinds, G.J.; De Vries, W. The impact of atmospheric deposition and climate on forest growth in European monitoring plots: An individual tree growth model. For. Ecol. Manag. 2009, 258, 1751–1761. [Google Scholar] [CrossRef]
  51. Wang, H.; Hua, J.; Kang, M.; Wang, X.; Fan, X.R.; Fourcaud, T.; De Reffye, P. Stronger wind, smaller tree: Testing tree growth plasticity through a modeling approach. Front. Plant Sci. 2022, 13, 971690. [Google Scholar] [CrossRef]
  52. Hu, X.; Chen, W.; Xu, W. Adaptive mean shift-based identification of individual trees using airborne LiDAR data. Remote Sens. 2017, 9, 148. [Google Scholar] [CrossRef]
  53. Lin, Y.; Jiang, M.; Pellikka, P.; Heiskanen, J. Recruiting conventional tree architecture models into state-of-the-art LiDAR mapping for investigating tree growth habits in structure. Front. Plant Sci. 2018, 9, 220. [Google Scholar] [CrossRef] [PubMed]
  54. Kobal, M.; Hladnik, D. Tree height growth modelling using LiDAR-derived topography information. ISPRS Int. J. Geo-Inf. 2021, 10, 419. [Google Scholar] [CrossRef]
  55. Tang, L.; He, J.; Peng, W.; Huang, H.; Chen, C.; Yu, C. Assessing the visibility of urban greenery using MLS LiDAR data. Landsc. Urban Plan. 2023, 232, 104662. [Google Scholar] [CrossRef]
  56. Liu, Y.; Pan, X.; Liu, Q.; Li, G. Establishing a Reliable Assessment of the Green View Index Based on Image Classification Techniques, Estimation, and a Hypothesis Testing Route. Land 2023, 12, 1030. [Google Scholar] [CrossRef]
  57. Berland, A. Urban tree growth models for two nearby cities show notable differences. Urban Ecosyst. 2020, 23, 1253–1261. [Google Scholar] [CrossRef]
  58. Vogt, J.M.; Watkins, S.L.; Mincey, S.K.; Patterson, M.S.; Fischer, B.C. Explaining planted-tree survival and growth in urban neighborhoods: A social–ecological approach to studying recently-planted trees in Indianapolis. Landsc. Urban Plan. 2015, 136, 130–143. [Google Scholar] [CrossRef]
  59. Qie, G.; Cao, L.; Liu, H.; Fan, X. The current situation and regional distribution characteristics of tree selection in urban areas of China. Sci. Silvae Sin. 2019, 55, 76–87. [Google Scholar]
  60. China Architectural Standards Design and Research Institute. Environmental Landscape Greening Planting Design; China Planning Press: Beijing, China, 2014. [Google Scholar]
  61. Weiskittel, A.R.; Hann, D.W.; Kershaw, J.A., Jr.; Vanclay, J.K. Forest Growth and Yield Modeling; Wiley: Hoboken, NJ, USA, 2011. [Google Scholar]
  62. Ki, D.; Lee, S. Analyzing the effects of Green View Index of neighborhood streets on walking time using Google Street View and deep learning. Landsc. Urban Plan. 2021, 205, 11. [Google Scholar] [CrossRef]
  63. Xia, Y.X.; Yabuki, N.; Fukuda, T. Development of a system for assessing the quality of urban street-level greenery using street view images and deep learning. Urban For. Urban Green. 2021, 59, 126995. [Google Scholar] [CrossRef]
  64. Zhou, B.; Zhao, H.; Puig, X.; Xiao, T.; Fidler, S.; Barriuso, A.; Torralba, A. Semantic understanding of scenes through the ade20k dataset. Int. J. Comput. Vis. 2019, 127, 302–321. [Google Scholar] [CrossRef]
  65. Osaka Prefecture. Survey Guideline of Green View Index. 2013. Available online: http://www.pref.osaka.lg.jp/attach/17426/00000000/guideline.pdf (accessed on 24 October 2023).
  66. National Health Commission of the People’s Republic of China. Text Transcript of the Press Conference of the National Health Commission on 27 June 2022. 2022. Available online: http://www.nhc.gov.cn/xcs/s3574/202206/f675fc2d35cd45968b9651a3bbff8950.shtml (accessed on 24 October 2023).
  67. Wang, A.; Guo, Y.; Fang, Y.; Lu, K. Research on the horizontal reduction effect of urban roadside green belt on atmospheric particulate matter in a semi-arid area. Urban For. Urban Green. 2022, 68, 127449. [Google Scholar] [CrossRef]
Figure 1. Measurement schematic.
Forests 15 00088 g001
Figure 2. Data distribution of all morphological factors of 3 species of street trees.
Forests 15 00088 g002
Figure 3. Correlation among morphological factors and GVIc.
Forests 15 00088 g003
Figure 4. Differences of morphology factors between 3 street trees.
Forests 15 00088 g004
Figure 5. GVI differences provided by 3 species of street trees in a unilateral street: (A) there is no differences among GVI levels; (B) the canopy proportion in overall greenery area manifests clearly differences.
Forests 15 00088 g005
Figure 6. Intergroup differences in GVIc and its proportion among three tree species.
Forests 15 00088 g006
Figure 7. Differences of GVIc among specifications of street trees: (A) Intergroup comparisons of variability in 4 specifications of the same species; (B) Intergroup comparisons of variability in 3 species of the same specification.
Forests 15 00088 g007
Figure 8. Comparisons of morphology factors with different DBH levels in the same species.
Forests 15 00088 g008
Figure 9. Comparisons of morphology factors with different species in the same DBH level.
Forests 15 00088 g009
Figure 10. Differences of DE among specifications of street trees: (A) Differences among 3 species; (B) Differences among specifications in the same species.
Forests 15 00088 g010
Table 1. The result of multiple regression model.
FactorStandard BetaSignificanceVIFDWANOVA
Constant 0.000 *** 1.5770.000 ***
CW1.2030.000 ***5.579
CH0.0930.040 *3.625
CHc0.5420.000 ***3.353
TH−0.5170.000 ***10.366
DBH0.0870.1235.605
SD−0.9550.000 ***7.719
*** p < 0.001, * p < 0.05.
Disclaimer/Publisher’s Note: The statements, opinions and data contained in all publications are solely those of the individual author(s) and contributor(s) and not of MDPI and/or the editor(s). MDPI and/or the editor(s) disclaim responsibility for any injury to people or property resulting from any ideas, methods, instructions or products referred to in the content.

