
Aspen and Spruce Densities Affect Tree Size, Future Stand Volume, and Aboveground Carbon Following Precommercial Thinning

Department of Renewable Resources, University of Alberta, Edmonton, AB T6G 2R3, Canada
*
Author to whom correspondence should be addressed.
Forests 2024, 15(2), 223; https://doi.org/10.3390/f15020223
Submission received: 15 December 2023
/
Revised: 11 January 2024
/
Accepted: 16 January 2024
/
Published: 23 January 2024
(This article belongs to the Section Forest Ecology and Management)
Abstract
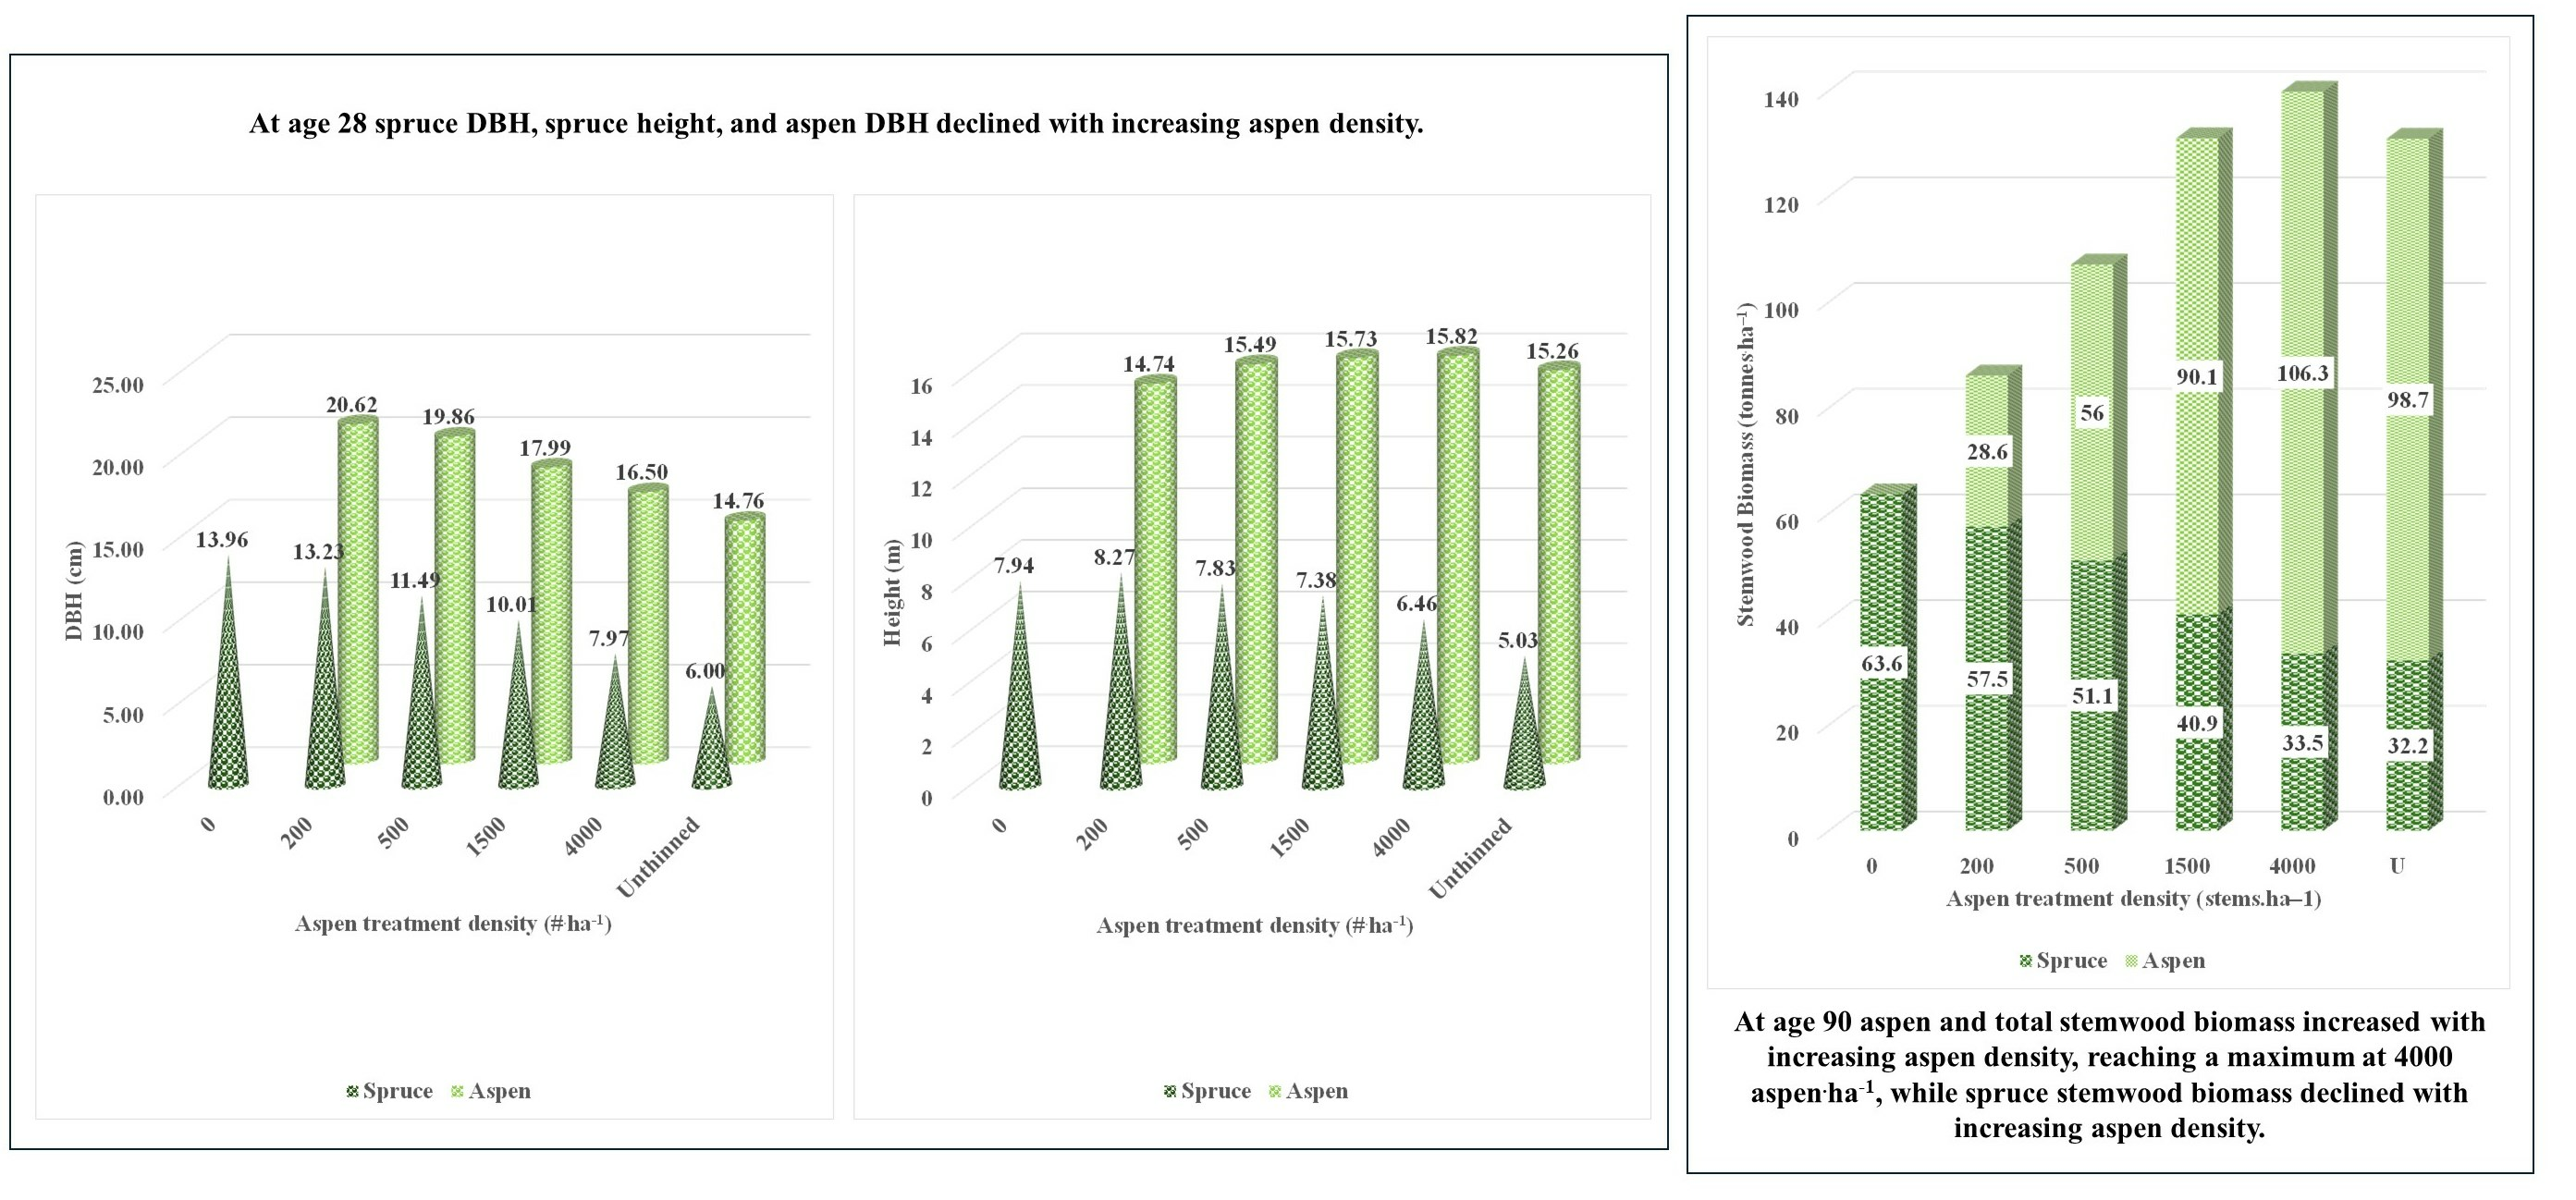
:Data collected over a 30-year period from an experiment replicated across 21 locations in western Canada are used to explore the effects of precommercial thinning of trembling aspen to a range of densities in combination with three initial white spruce densities on tree growth and stand dynamics. Increasing differentiation amongst the 15 treatments was observed with age after thinning for both spruce and aspen responses. Spruce height and diameter declined with increasing aspen density. At age 10 spruce diameter with no aspen was 1.5× that of spruce in unthinned while it was 2.6× that of spruce in unthinned at age 28. Following thinning aspen DBH and crown width declined with increasing density of retained aspen while slenderness and height to crown base of aspen increased. Thinning to 1500 aspen·ha−1 resulted in aspen DBH that was 22% larger relative to the unthinned at age 28. Spruce volume and stemwood biomass at age 90, estimated using the Mixedwood Growth Model (MGM21), declined with increasing initial aspen density, with the complete removal of aspen resulting in nearly double the spruce volume of unthinned plots. However, total stand volume, total stand biomass, and stemwood carbon at age 90 are predicted to be largest in mixed stands with aspen densities of 1500 stems·ha−1 or higher.

1. Introduction
Mixed stands of trembling aspen (Populus tremuloides Michx.) and white spruce (Picea glauca (Moench) Voss) are a prominent component in the boreal forest of western Canada and occur across a range of successional stages [1,2]. During the early stages of succession following disturbances (i.e., wildfire or harvesting) aspen grows more rapidly than spruce and forms an overstory above spruce. After 50 to 80 years white spruce begins to grow through the canopy and aspen decreases in dominance and basal area [2].
Mixed-species stands such as these boreal mixtures are ecologically important as they typically have greater species and structural diversity [3] and provide better habitat for many species of wildlife than aspen or spruce monocultures [4,5,6]. Long-term site productivity may also be enhanced by the presence of aspen [7,8]. Physical, phenological, and successional differences in the growth of shade-intolerant aspen and moderately shade-tolerant white spruce can result in higher yields (overyielding) from mixed than from single-species stands [9,10,11]. The risk of white pine weevil (Pissodes strobi Peck) damage is lower in mixedwood than in pure spruce stands [12,13] as is damage by root disease [14,15]. Mixed species stands may also be more resilient to drought and other climate-related stresses [16,17] with thinning potentially leading to further increases in resilience of these stands [11,18]. In addition, overstory aspen can serve as a nurse crop for small understory spruce by reducing the impact of frost [19] and reducing the vigor of understory competitors such as bluejoint reedgrass (Calamagrostis canadensis (Michx.) Beauv.) [20]. Mixedwoods may also produce higher quality spruce stems than result from the open conditions experienced during the first 20 years in pure spruce plantations [21,22].
Early precommercial thinning of aspen is known to accelerate the growth of residual aspen [9,23,24,25,26] while reducing aspen densities also increases white spruce growth in mixed stands [9,11,26,27].
In response to an identified need for information on the effects of aspen density on spruce and aspen growth, the Western Boreal Growth and Yield Association (WESBOGY) initiated the Long-Term Study in 1990 to advance our understanding of the dynamics of mixedwood stands following tending. The major objectives of this study were to (a) provide quantitative information on the effects of aspen and spruce densities on tree growth, yield, and wood quality; and (b) demonstrate the effects of aspen and spruce densities and pre-commercial thinning in mixedwood stands. Data collected over the 30-year-period of this study from 21 locations distributed across the boreal plains of western Canada provide a unique opportunity to examine medium-term effects of precommercial thinning and effects of aspen and spruce densities on growth and size of the component species across a broad geographical region. These results build on other shorter-term studies in this region. In addition, these data provide an opportunity to examine whether results change with stand age.
In this paper, we examine the effects of aspen and spruce density on the growth of both spruce and aspen over the first 30 years after regeneration as a follow-up to the age 9 results for four installations presented by Bokalo et al. [26]. We also use the Mixedwood Growth Model (MGM21; https://mgm.ucalberta.ca, accessed on 10 December 2023) to explore the potential effects of aspen and spruce densities on stand dynamics, yield, and stemwood carbon storage.
2. Materials and Methods
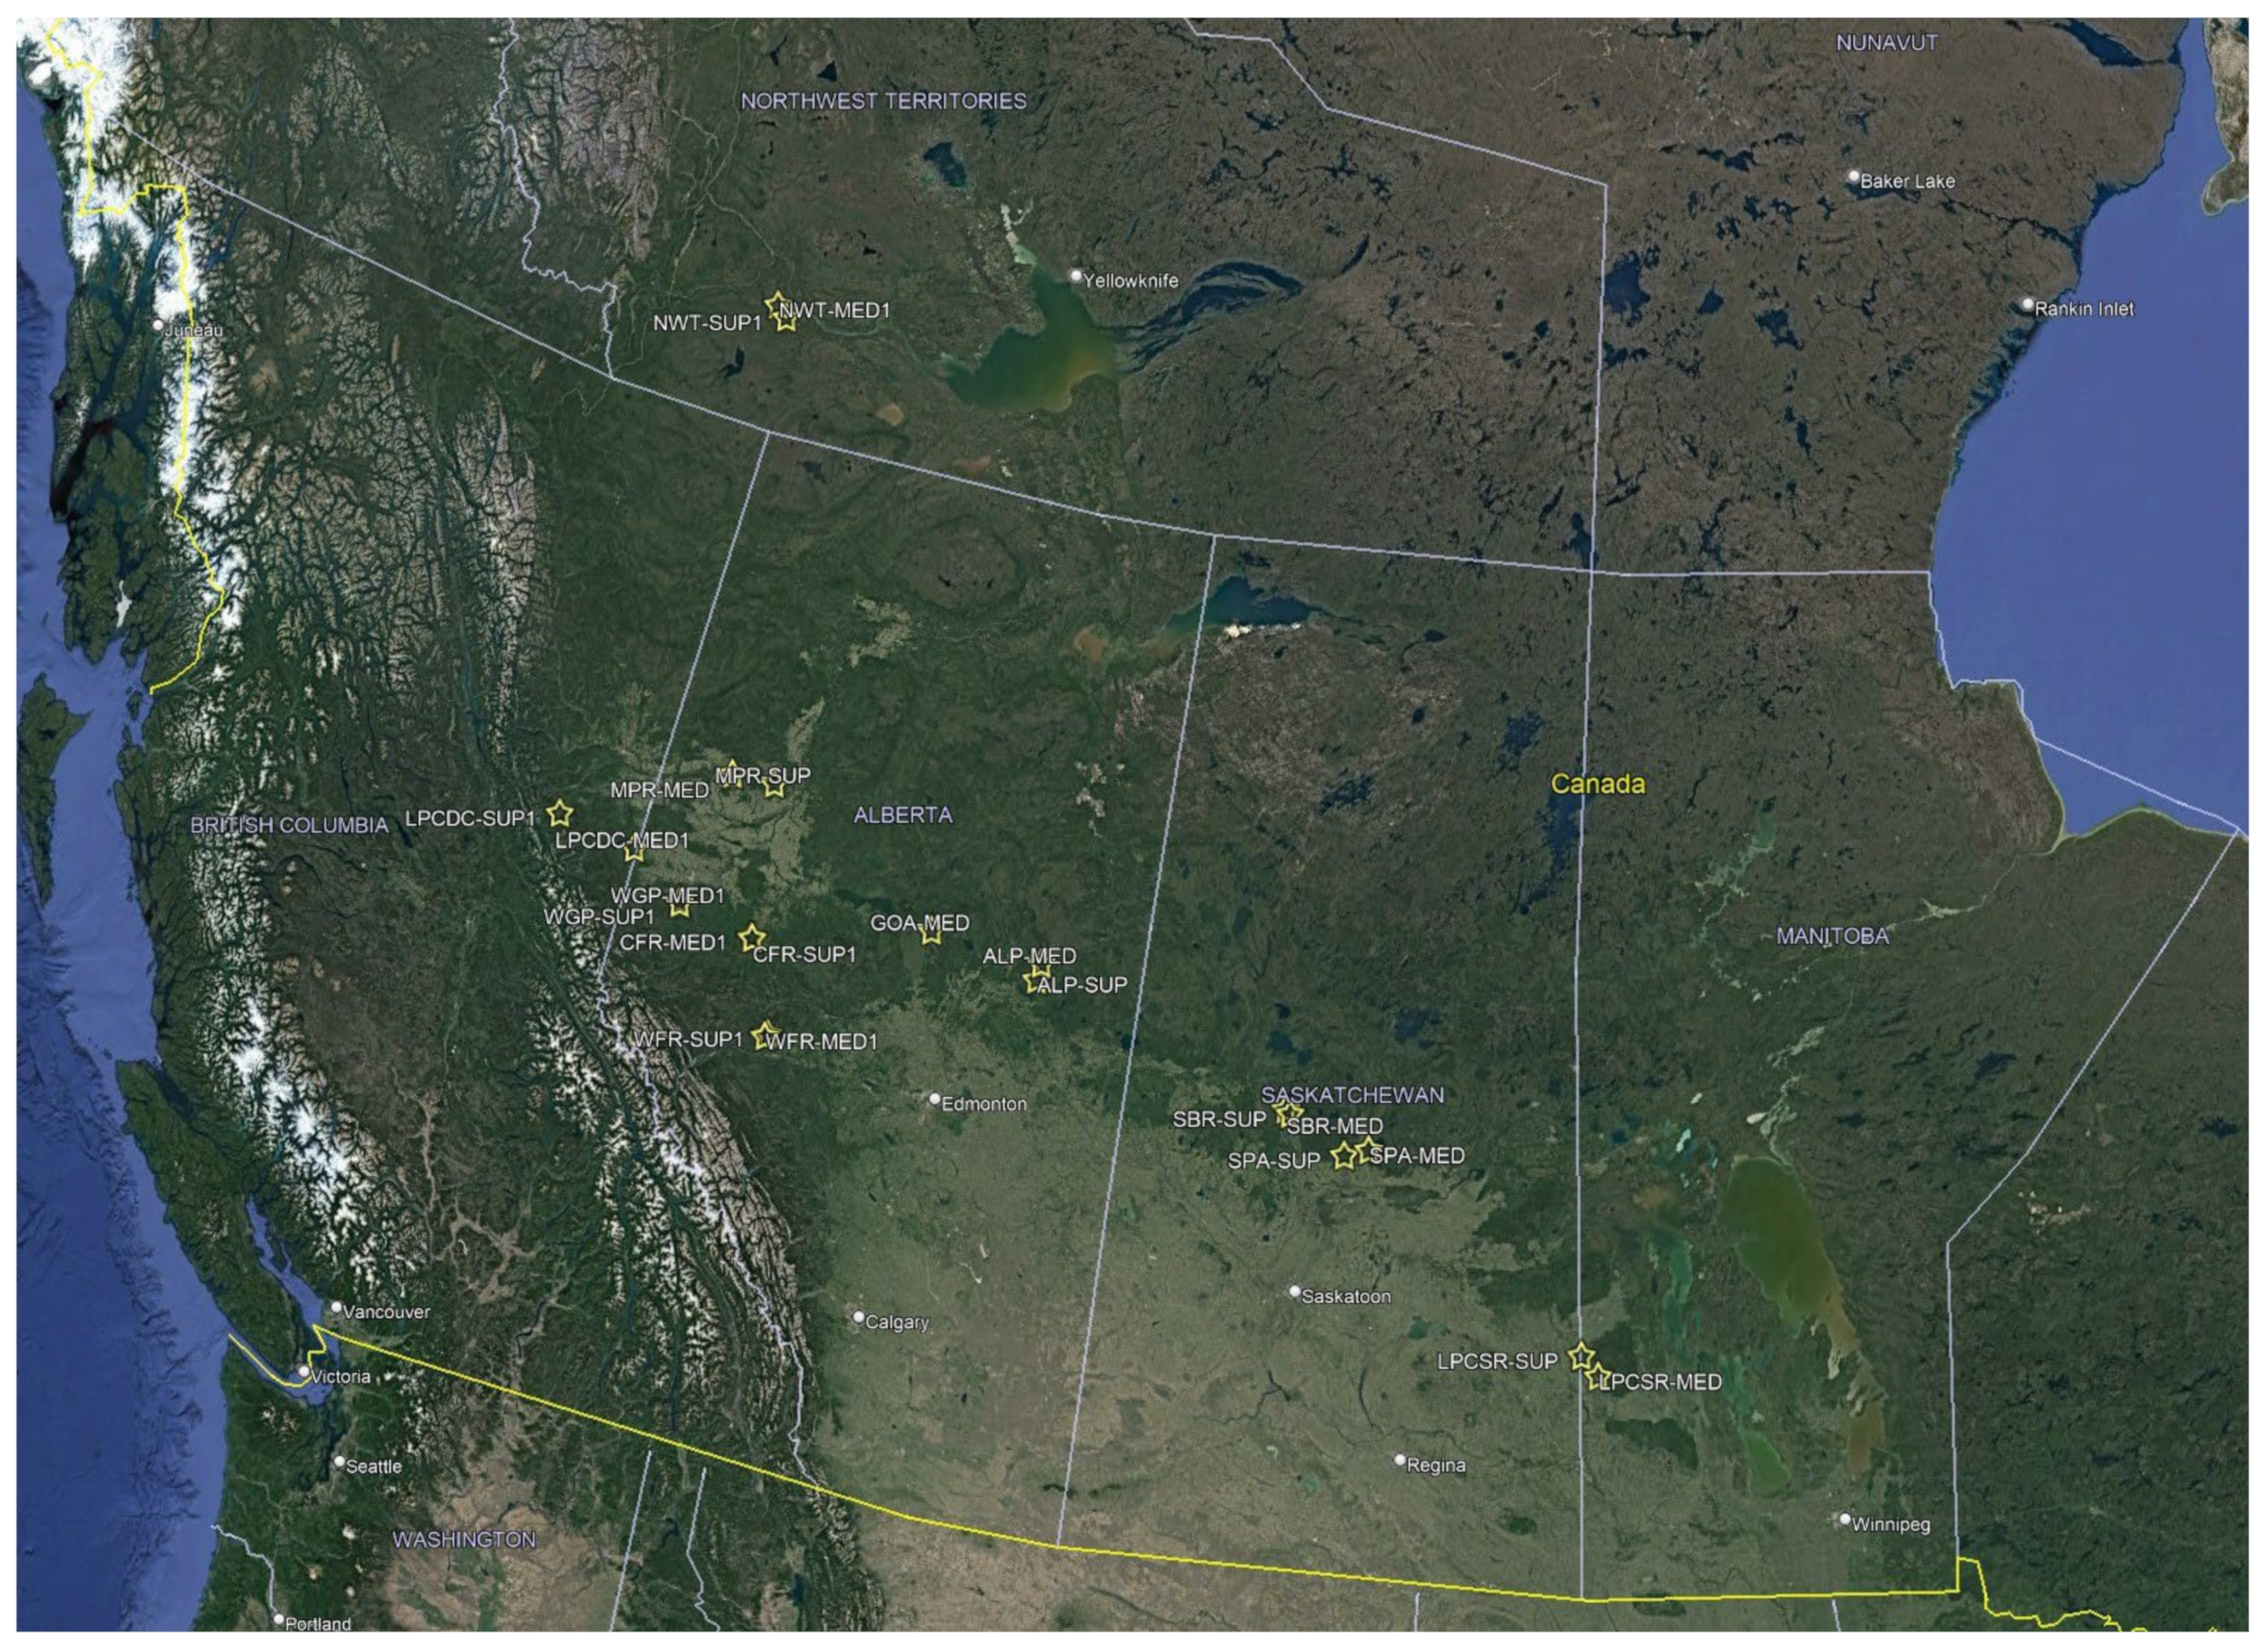
The WESBOGY Long-Term Study used a randomized block design with each agency being responsible for establishing and maintaining one block of two installations, with one installation established on a superior site and one established on a median site. Each installation consists of two replications of 15 treatments. After the loss of one replicate in the Weyerhaeuser Grande Prairie Superior installation due to a fire in 2016, the study currently includes a total of 615 plots in 21 installations distributed across Alberta, British Columbia, Manitoba, Saskatchewan, and the Northwest Territories. Installations cover a broad geographic range (Figure 1), with mean annual temperature ranging between −2.3 and 3.1 °C, mean annual precipitation ranging between 388 and 555 mm, and climatic moisture index ranging between −3.08 and 13.33 mm (Table 1).
Treatments (Table 2) were based on a matrix of six aspen (0, 200, 500, 1500, and 4000 stems∙ha−1 plus an unthinned control) and three spruce (0, 500, and 1000 stems∙ha−1) densities which created pure spruce, aspen-spruce mixtures, and pure aspen stands of differing densities. Initial planting of spruce was at twice the target density (1000 stems∙ha−1 and 2000 stems∙ha−1) with spruce densities reduced to target densities at the time of thinning of the aspen. Within each installation, the same spruce stock type grown in the nursery from seed that was local to the planting site was used. For the first 5 years, vegetation was controlled within a 40- to 50-cm radius of the spruce using plastic mulch mats or by hand clipping to minimize early spruce mortality.
Both replications in each installation were located on a common soil type. Each replication required a minimum area of 1.35 ha, which was relatively uniform in physical (slope and aspect) conditions. Study sites had been cutover within less than 24 months of the establishment date and had uniform natural aspen regeneration of greater than 4000 stems∙ha−1. The height of aspen regeneration was less than 1.5 m to ensure that competition would not become a serious factor for the initial survival of the planted spruce.
Measurement plots are 20 m by 20 m (0.04 ha) with the centers and corners permanently marked. A 5- or 10-m treated buffer surrounds each measurement plot. All spruce were measured in a 20 m by 20 m fixed area plot. Due to extremely high initial aspen densities, (upwards to 300,000 stems∙ha−1), aspen was measured in four 1 m by 1 m (0.0001 ha) subplots located in the southwest quarter of the main plot. Within this southwest quarter, the 1 m by 1 m subplots were located at the center of the midpoints of each side of the quadrant. At year 5, the 1 m by 1 m subplots were expanded to 2 m by 2 m subplots in the unthinned aspen treatment. At age 20 or 21 subplot size in the unthinned plots was further increased to 5 m × 5 m resulting in the four 2 m × 2 m subplots being combined into a single 5 m × 5 m subplot. The purpose of subplot expansion was to ensure the measurement of an adequate sample of aspen following high natural mortality.
At year 5, both aspen and spruce were thinned to target treatment densities (Table 2). Before thinning, the spruce and aspen trees that were designated as leave trees were tagged and measured. Following thinning aspen and spruce in the thinned plots were measured in the full 20 m × 20 m plots. Aspen and spruce densities were maintained through the removal of ingress and through the transplanting of spruce being grown on each site to replace the mortality of tagged trees during the first 10 years.
2.1. Statistical Analysis
Data analysis was completed using SAS v9.4 (SAS Institute, Cary, NC, USA). Repeated measures analysis of aspen height and diameter trends used a random coefficient third-degree polynomial model (Equation (1)) run with Proc Mixed. Spruce was analyzed using a second-degree polynomial model based on preliminary analysis of age trends which indicated that this model provided a better fit to the data.
where: age = stand age, Aw = aspen treatment (target) density, Sw = spruce treatment (target) density, and In = installation.
y = a + b × Age + c × Age2 + d × Age3 + e × Aw + f × Sw + g × Aw × Sw + h × Age × Aw + i × Age × Sw + j × Age × Aw × Sw + k × In
The analysis assumed an unstructured covariance matrix with numerator degrees of freedom calculated using the Kenward–Roger method and with age and installation treated as random effects. For ages 10, 20, and 28 effects of aspen and spruce treatment densities were analyzed as linear models using Proc Mixed, with numerator degrees of freedom calculated using the Kenward–Roger method, and agency, agency × installation, and replication nested within agency × installation treated as random effects. The least-square means were compared using Tukey’s LSD test with alpha = 0.05. Data were available for all 21 installations for analysis at ages 10 and 20 and from 11 installations for analysis at age 28 (ages 26–30).
2.2. Growth Projections Using MGM21
The Mixedwood Growth Model (MGM21; https://mgm.ucalberta.ca) was used to project stem volume growth of the 615 plots and to provide data for analysis of the potential effects of treatment on future yields. Full tree lists, which included the height and diameter of all trees present in each plot at age 12 and the site index for each species, were developed for each plot from collected data. The tree list for each plot included species, tree factor (TRF, number of trees per hectare represented by each tree), DBH, and height. Tree factor was calculated for live trees based on plot size (TRF = 10,000/plot area in m2). Site index (at age 50) was calculated for each installation using the GYPSY Site Index equations [28], with the aspen site index determined from unthinned plots (plots 6, 12, and 15) and the spruce site index determined from plots with zero aspen density (plots 1 and 7). Gross total stand volume was reported for all simulations. Stemwood biomass was also calculated by MGM21 based on the application of biomass equations [29]. MGM21 simulations assume constant climatic conditions reflecting 30-year climate normals (1981–2010) for each location.
3. Results
3.1. Height and Diameter Trends for Aspen and Spruce
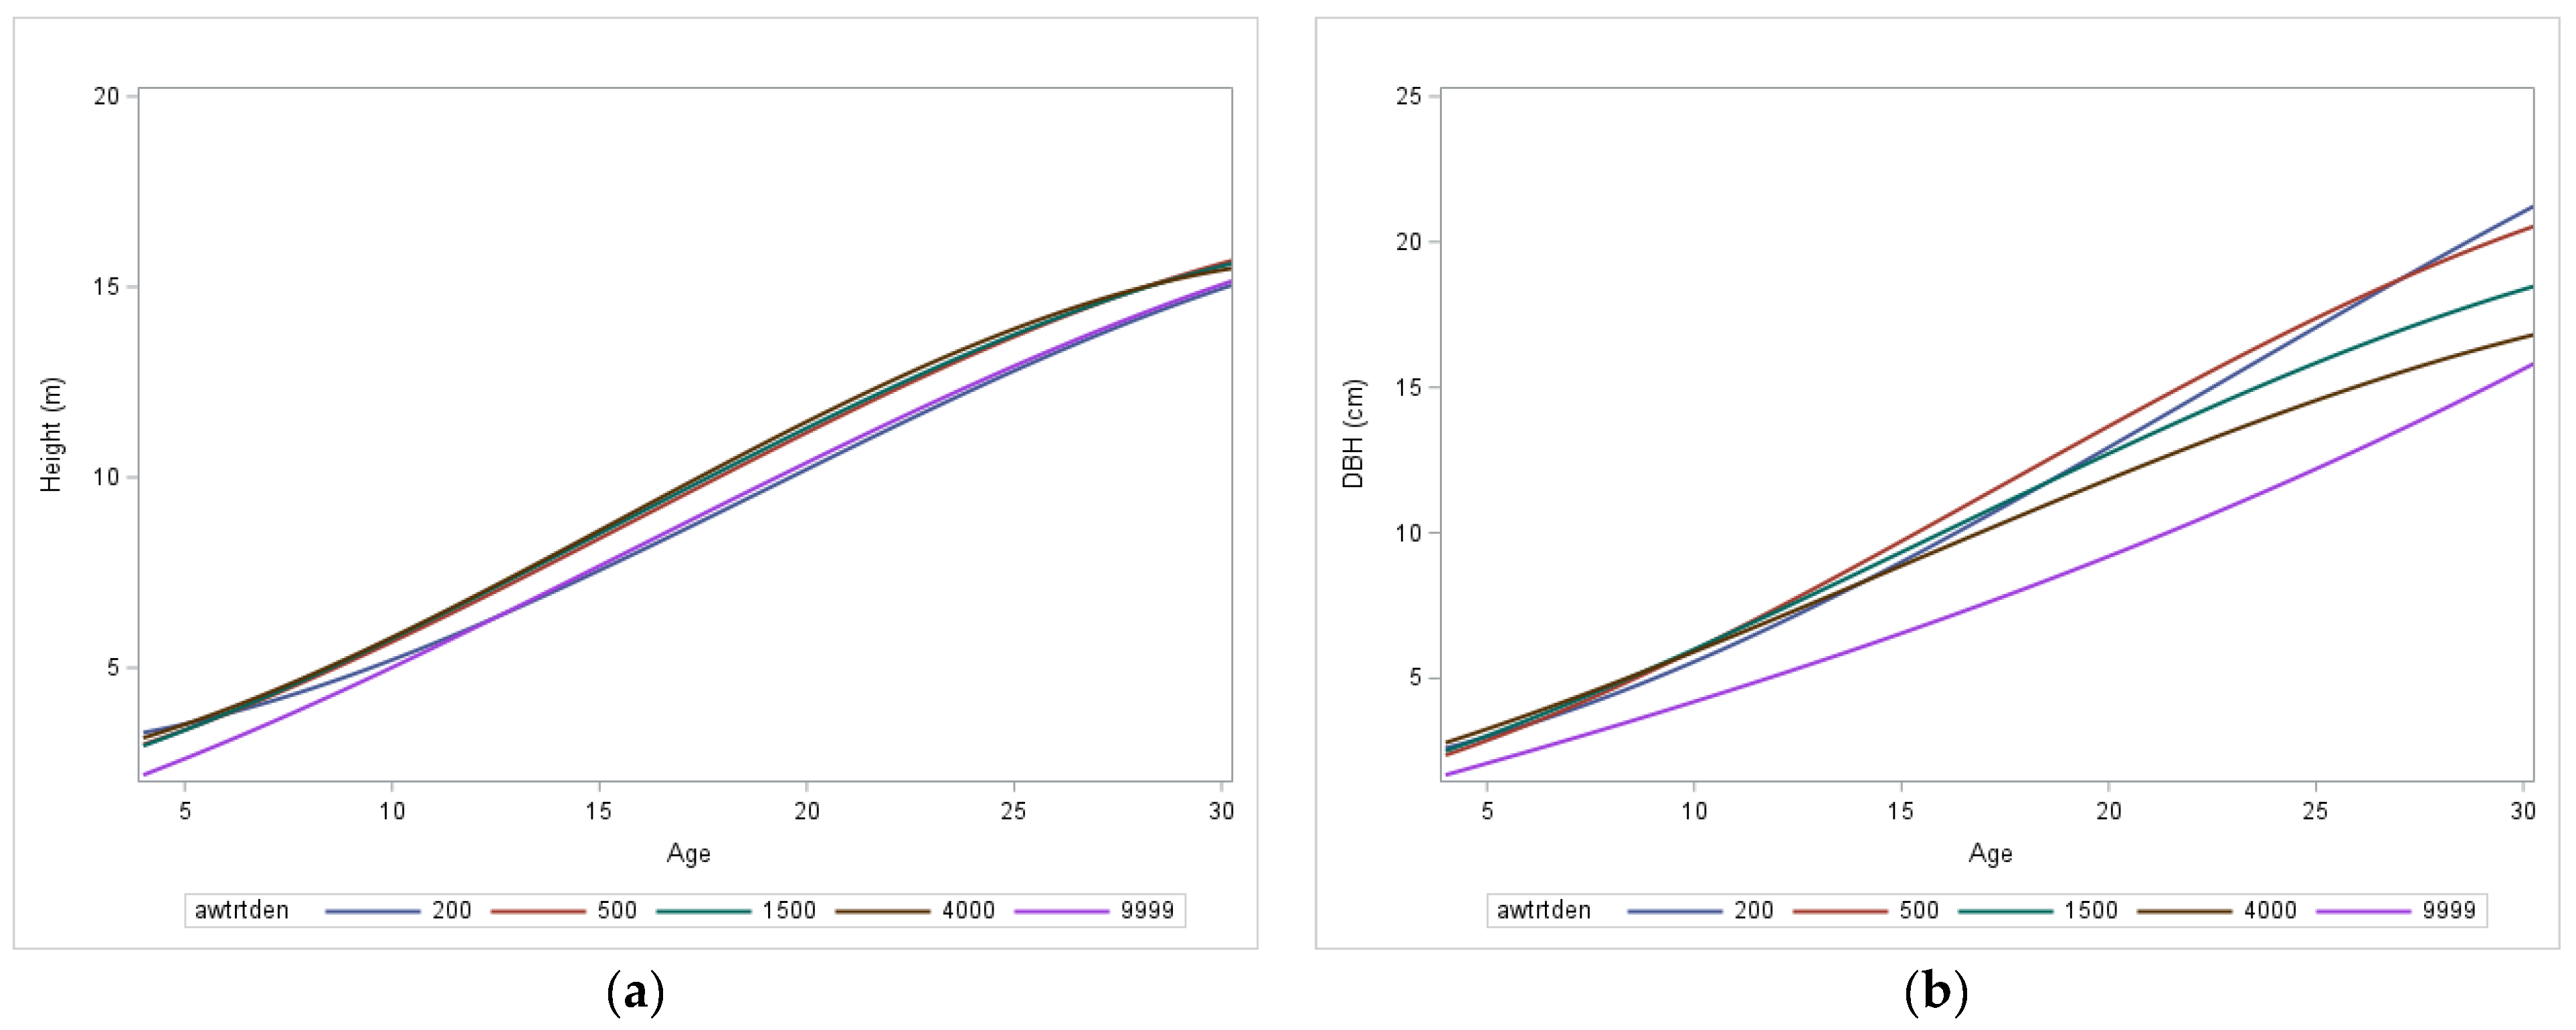
Table 3 summarizes results from the non-linear mixed models for aspen and spruce height and DBH. Figure 2 shows observed age-related trends in aspen height and DBH for the top 200 aspen stems·ha−1. The top 200 aspen were selected for comparison as 200 stems·ha−1 is the lowest density of aspen retained in plots with aspen in this study and this provides a useful standard for comparison of treatment effects. Repeated measures analysis indicated a significant trend with age, but no significant (p > 0.2020) effects of thinning or spruce density on aspen top height.
DBH of the top aspen (Figure 2b) shows a sigmoid trend with age, significant effects of aspen density (p = 0.0491), and significant interactions between age and aspen density (p = 0.0003) and between age and spruce density (p = 0.0353). These interactions indicate that influences of aspen and spruce densities on aspen DBH changed with age, with shifts in treatment ranking occurring over time as indicated in Figure 2b.
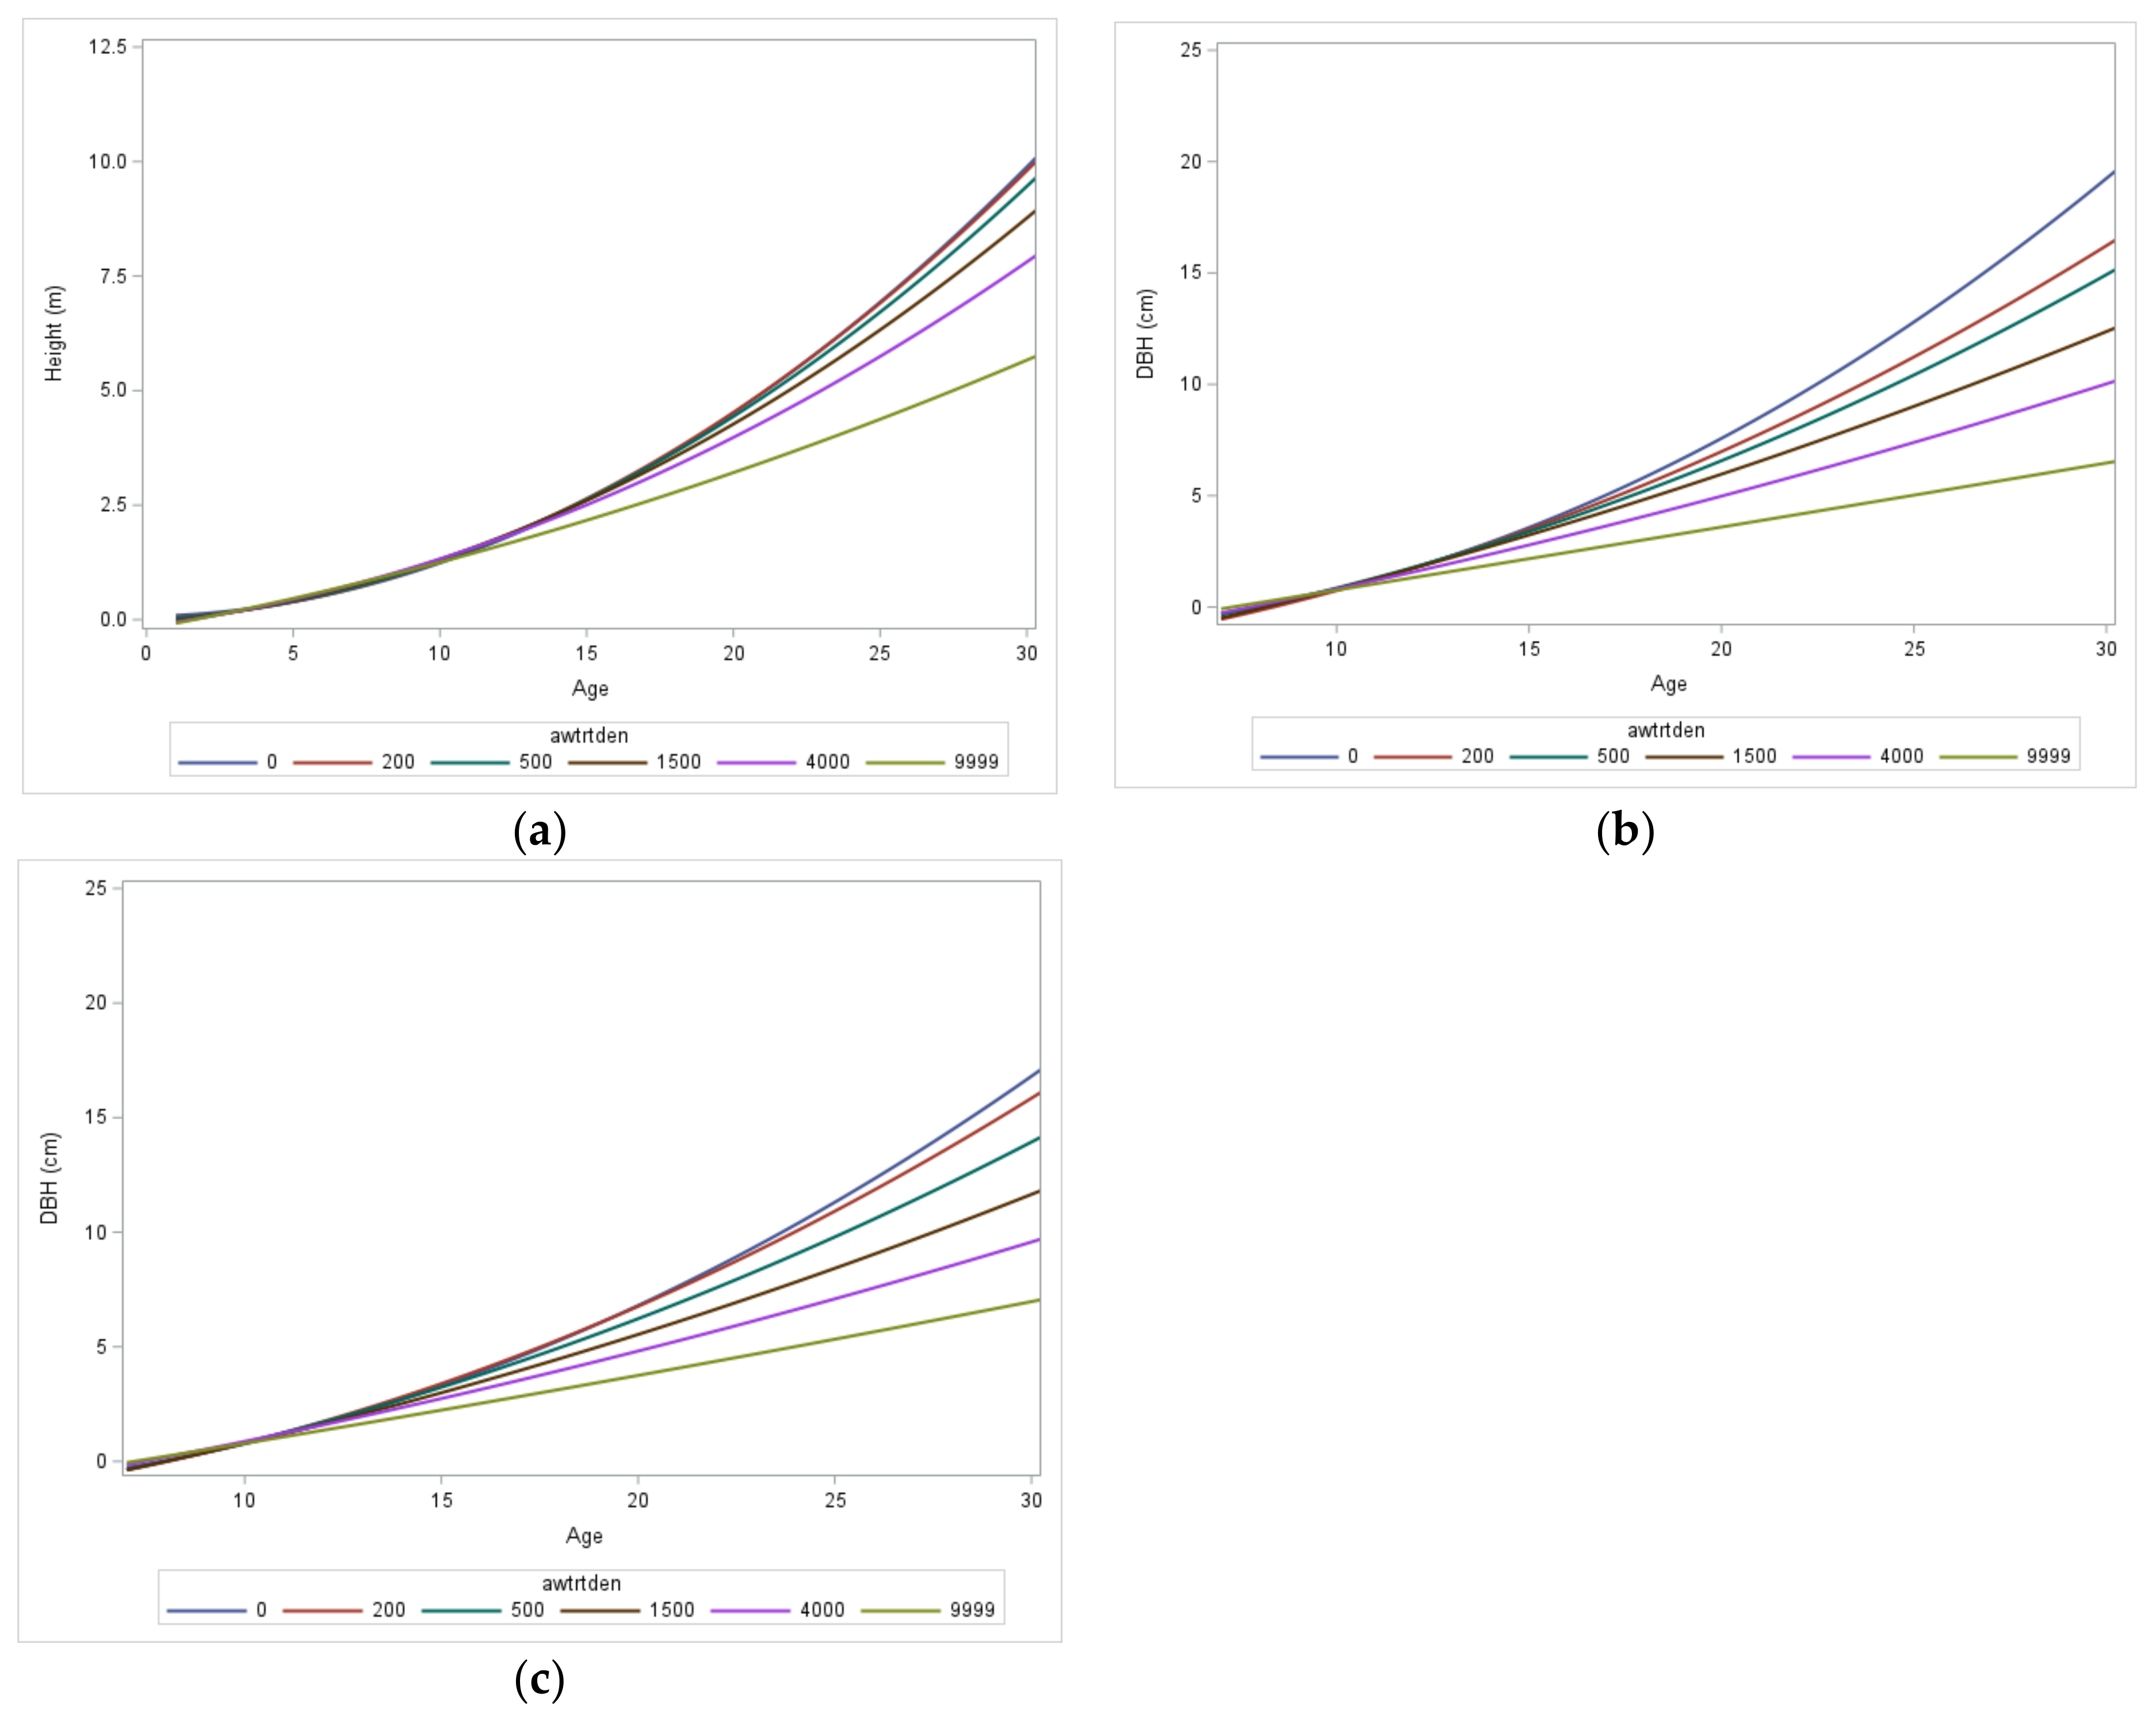
Repeated measures analysis of spruce height (Table 3, Figure 3a) showed significant (p < 0.0001) effects of age (linear and quadratic terms) and aspen density (p < 0.0001). The quadratic term for age was positive, indicating increasing spruce height growth rates with age. A significant interaction between age and aspen density (p < 0.0001) for spruce height reflects the cumulative effects of aspen density with age and some changes in treatment rank with age. The model for spruce DBH showed significant effects of age (linear and quadratic terms, p < 0.0001), aspen density (p < 0.0001), and spruce density (p = 0.0026) with the positive quadratic term for age reflecting increasing diameter growth rates with age. Significant interactions between age and aspen density (p < 0.0001) and age and spruce density (p = 0.0121) for spruce DBH (Figure 3b,c) indicate cumulative effects of aspen and spruce density with age and reductions in spruce DBH due to intraspecific competition at the higher spruce densities for the lowest aspen densities. Figure 3 shows little difference between 0 and 200 stems·ha−1 of aspen on spruce height, but with spruce height and DBH decreasing noticeably after age 15 with increasing aspen density.
3.2. Effects of Thinning on Aspen Growth
Analysis of results at selected ages provides a better understanding of the effects of precommercial thinning on aspen sizes than does the repeated measures analysis. Table 4, Table 5 and Table 6 provide results for the analysis of treatment effects on aspen at ages 10, 20, and 28, respectively. Table 7 summarizes the least-square means for each treatment. At all ages, aspen density had significant effects on mean top height, DBH, slenderness, height to live crown (HTLC), aspen stems·ha−1, and aspen basal area while spruce density was not significant. At age 10 aspen crown width (CW) did not differ between treatments. Differences in responses amongst the 11 installations measured at age 28 result in significant interactions between installations and aspen density for DBH and slenderness, and a significant 3-way interaction between installations, aspen density, and spruce density for aspen mean top height.
Aspen top height was smaller in the 200 aspen·ha−1 treatment than in the 1500 or 4000 but did not differ from unthinned at all 3 ages, and was larger in the 1500 and 4000 than the unthinned at ages 10 and 20 but not at age 28 (Table 7). Aspen DBH increased significantly with thinning at all ages, with a clear trend of decreasing DBH at age 28 with increasing initial aspen density, but with differences between 200 and 500 stems·ha−1 not being significant. Aspen slenderness was significantly larger in the unthinned than the other treatments with slenderness at age 28 declining with decreasing aspen density. Thinning resulted in increased CW at all ages (although differences were not significant at age 10), with all but the 200 and 500 stems·ha−1 treatments differing at age 28. HTLC declined with thinning intensity, but with poor differentiation between the unthinned and 4000 stems·ha−1 treatments. Aspen density and basal area in the unthinned differed between all other treatments at each age, with a small decline in aspen density between ages 10 (17,775 stems·ha−1) and age 28 (16,490 stems·ha−1) and a small increase in aspen basal area over these 8 years (12.01 m2·ha−1 at age 10, 12.94 m2·ha−1 at age 28).
In general, treatment effects on aspen were evident at age 10, were more pronounced at age 20, and became even more pronounced at age 28. Differences in height, DBH, slenderness, and HTLC of aspen were evident at age 10, while treatment effects on aspen crown width were not evident at age 10 but were detected at age 20. Differentiation of aspen DBH and slenderness amongst treatments increased with age of measurement (Table 7). Significant I × Aw (Installation × aspen density) interactions at age 28 for DBH and slenderness indicate the existence of variation in the effects of aspen density amongst the installations which reflects differences in aspen growth amongst the installations. Significant I × Aw × Sw (Installation × aspen density × spruce density) interactions reflect differences in the growth of both aspen and spruce due to the installation and densities of both tree species.
3.3. Effects of Thinning on Spruce Growth
At age 10 aspen density had significant effects on spruce height, root collar diameter, and height: diameter ratio (HDR) but not on crown width (CW) or height to live crown (HTLC) (Table 8). At ages 20 (Table 9) and 28 (Table 10), spruce density had significant effects on spruce DBH and CW but not on other variables. Significant interaction terms (Aw × Sw) for slenderness at age 20 and DBH, CW, and HTLC at age 28 indicate a need for separate analysis of aspen density effects for each spruce density.
Table 11 summarizes treatment means (least squares means) for spruce at ages 10, 20, and 28. Spruce height declined with increasing initial aspen density at all ages, with differences being most apparent and significant between the lowest and highest densities and with the magnitude of these differences increasing with age. At age 28, spruce in the unthinned were 59% of the height of spruce without aspen while they were 70% at age 20 and 94% at age 10. DBH was reduced by both increasing spruce density and increasing aspen density at ages 20 and 28. At age 20, spruce DBH was 77% and 44% of the 0 aspen density values in the 1500 and unthinned (U) treatments, respectively, at 500 stems·ha−1 spruce and 81% and 51% of the 0 aspen density values in the 1500 and unthinned (U) treatments, respectively, at 1000 stems·ha−1 spruce. Differences amongst aspen densities were larger at age 28, spruce DBH was 66% and 34% of the 0 aspen density values in the 1500 and U treatments, respectively, at 500 stems·ha−1 spruce and 72% and 42% of the 0 aspen density values in the 1500 and U treatments, respectively, at 1000 stems·ha−1 spruce.
HDR and slenderness of spruce increased with increasing aspen density at the three ages with differences being most apparent and significant between the lowest and highest aspen densities. At age 20, slenderness was higher with 1000 spruce than with 500 spruce for an aspen density of 0 stems·ha−1. Crown width at both ages 20 and 28 was smaller for the higher (1000 stems·ha−1) spruce density and declined with increasing aspen density. For HTLC, analysis of both spruce densities combined at age 20 indicated that HTLC was significantly higher in the unthinned and 200 aspen stems·ha−1 than 0 aspen, however, the difference in HTLC between these two treatments was only 12 cm. At age 28, differences appear inconsistent, with HTLC not differing between aspen densities. This inconsistency results from more rapid growth and crown expansion of spruce in the lower aspen densities leading to crown closure and intraspecific competition, and a reversal of the effects of aspen densities.
For all reported variables differentiation amongst treatments increased with measurement age with differences being largest at age 28 (Table 11). At age 10 aspen density affected spruce height, diameter (RCD), and HDR while spruce density was not significant, and significant I × Aw (installation × aspen density) interactions (indicating different effects of aspen amongst the installations) were detected for height, diameter, and crown width. At ages 20 and 28 aspen density, but not spruce density, were significant for height and slenderness, while both aspen and spruce density (and their interaction at age 28) were significant for DBH and crown width. HTLC showed varying results, with no significant treatment effects at age 10, a significant effect of aspen density at age 20, and significant effects of spruce density and a significant Aw × Sw interaction at age 28.
3.4. Mixedwood Growth Model (MGM) Projections
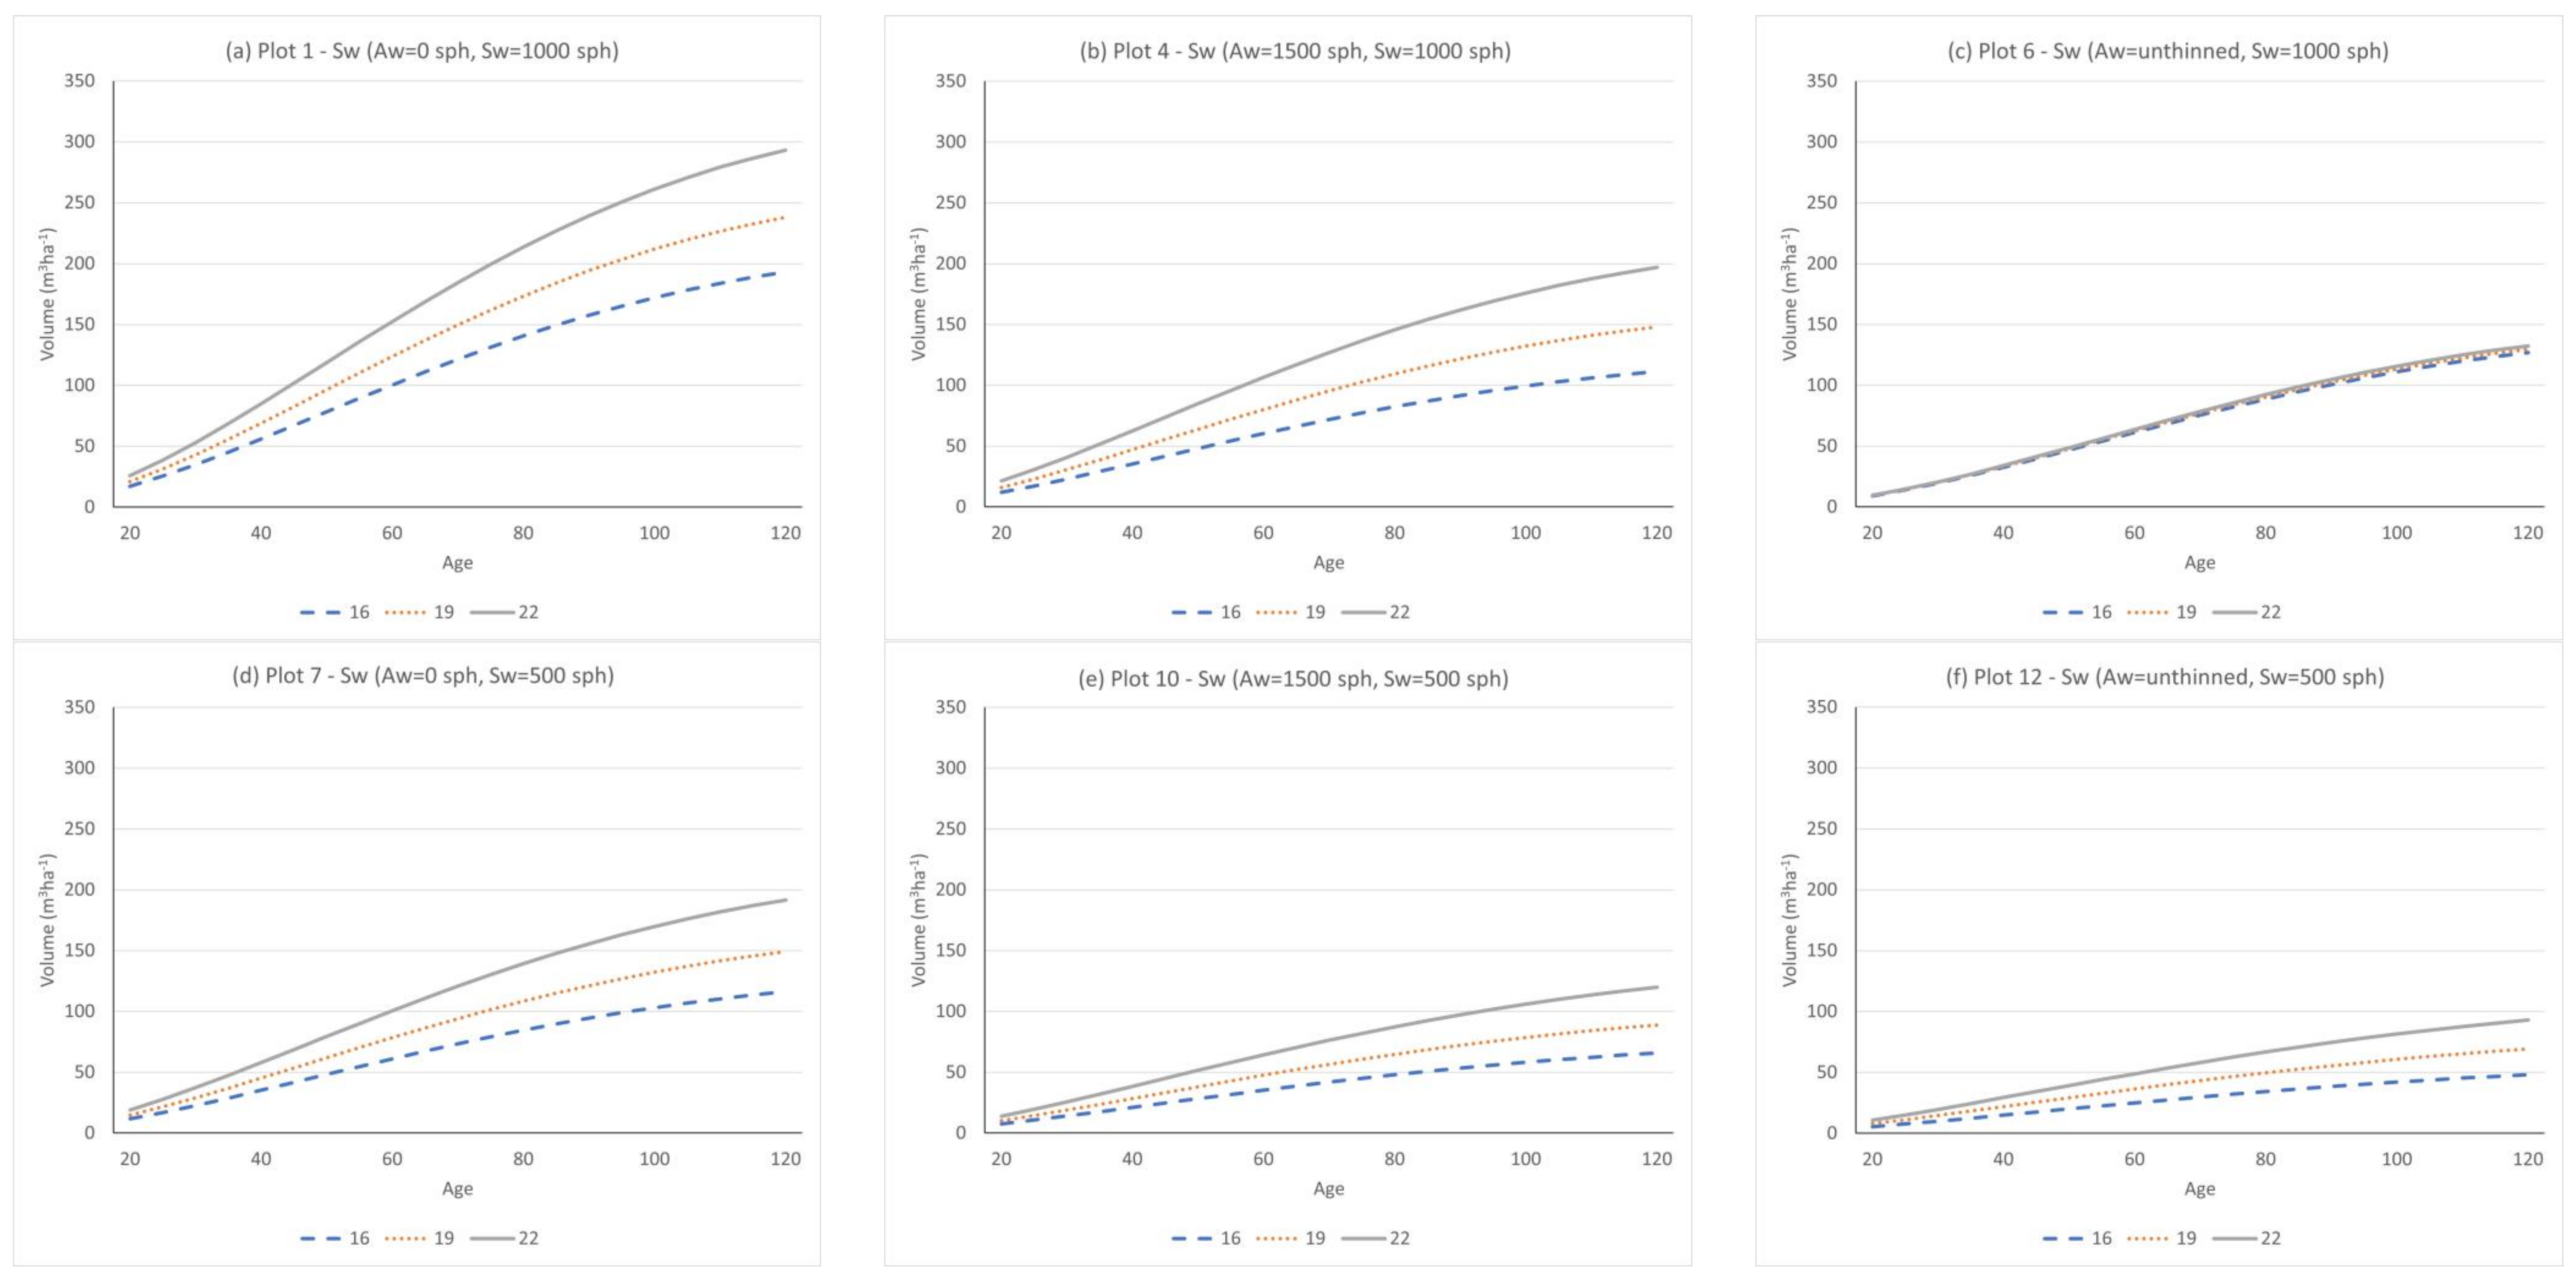
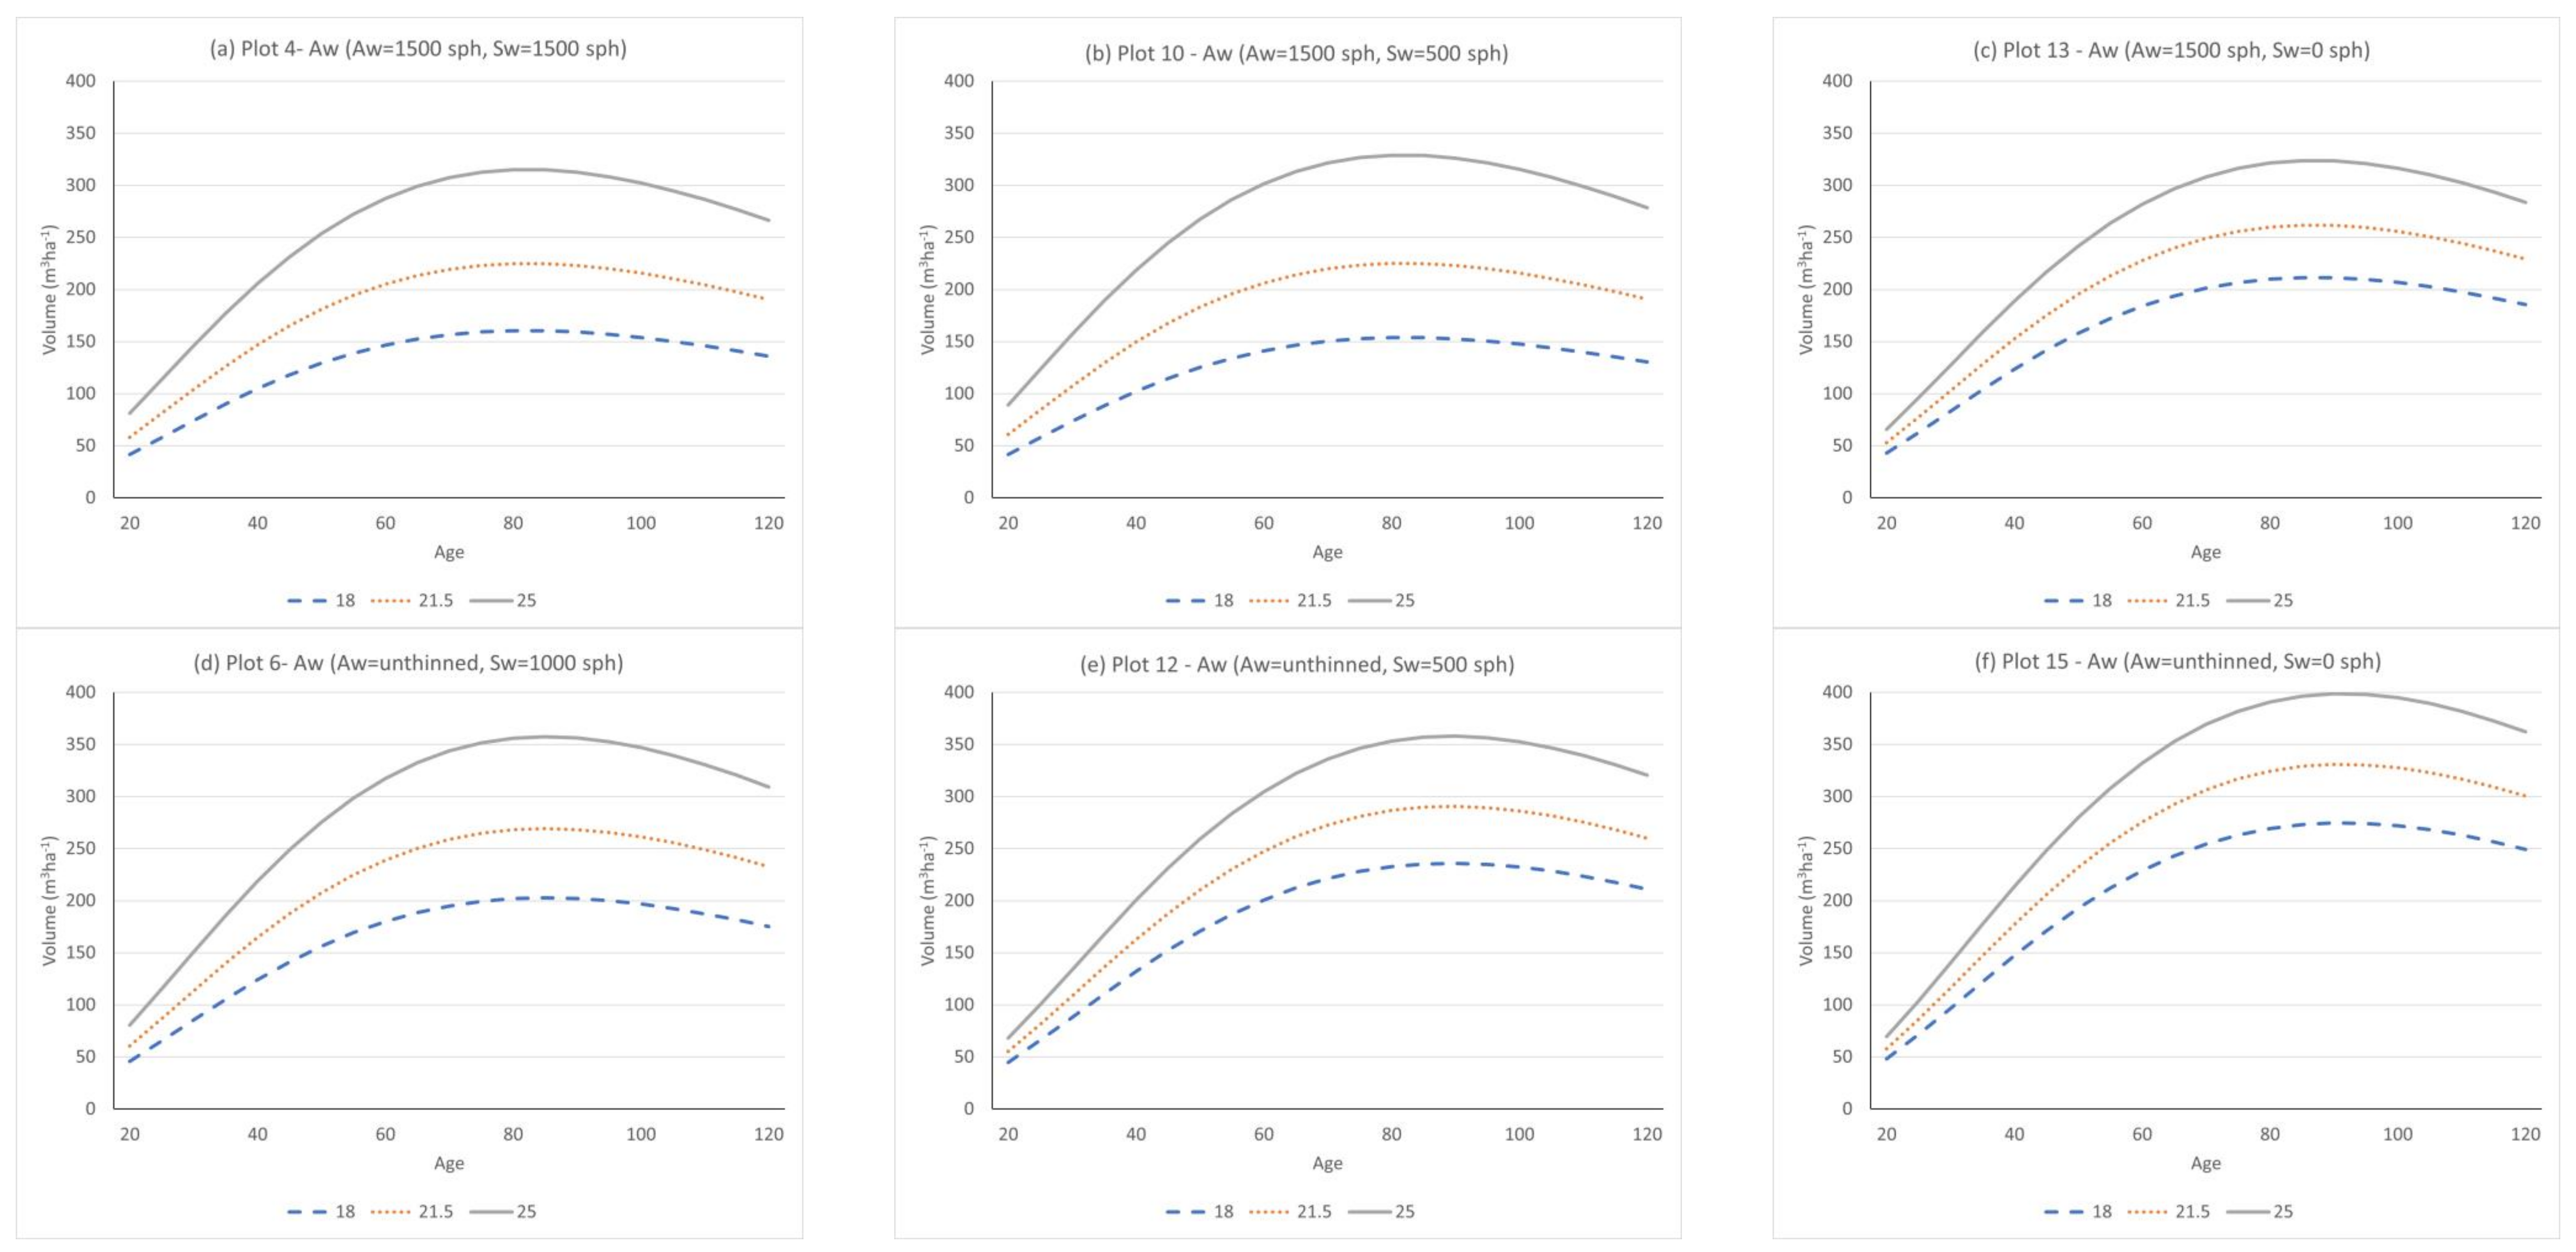
Figure 4 and Figure 5 summarize the effects of aspen density, spruce density, and site index on volume-age trends for eight selected treatments (plots 1, 4, 6, 7, 10, 12, 13, and 15) for three selected levels of site index values covering the range between minimum and maximum values observed in the 21 installations (Table 1). Table 12 provides the parameter estimates for the non-linear (modified Chapman-Richards) equations that fit the data generated from MGM simulations for all plots. Volumes of both aspen and white spruce increased with increasing site index. Trends for white spruce (Figure 4) show reductions in spruce volume with increasing aspen density and increases in spruce volume with increasing spruce density with increases in aspen density shifting the asymptote (parameter a) downwards (Table 12), changing the rate (b) and shape (c) parameter values and shifting inflection points of the volume growth curves to the right, while increases in spruce density shift the asymptote upwards. In addition, increases in aspen density result in narrowing differences between the lowest and highest site index values. Adding spruce to aspen stands resulted in decreases in aspen volume (Figure 5) with the result that reducing spruce density resulted in an increase in the asymptote (a), and rate (b) and a reduction in values of the shape (c) parameter as well as shifting the asymptote to the right.
Since spruce and mixedwood stands are typically planned for harvest at age 90, the effects of treatment of these stands on DBH, gross total volume, and MAI (mean annual increment) at age 90 were examined and are summarized in Table 13. At age 90, spruce DBH varied between 19.5 and 26.0 cm, and declined with increases in both aspen and spruce density. Aspen DBH at age 90 ranged from 24.2 to 38.7 cm and declined with increasing aspen density but was not significantly affected by spruce density (p = 0.1443).
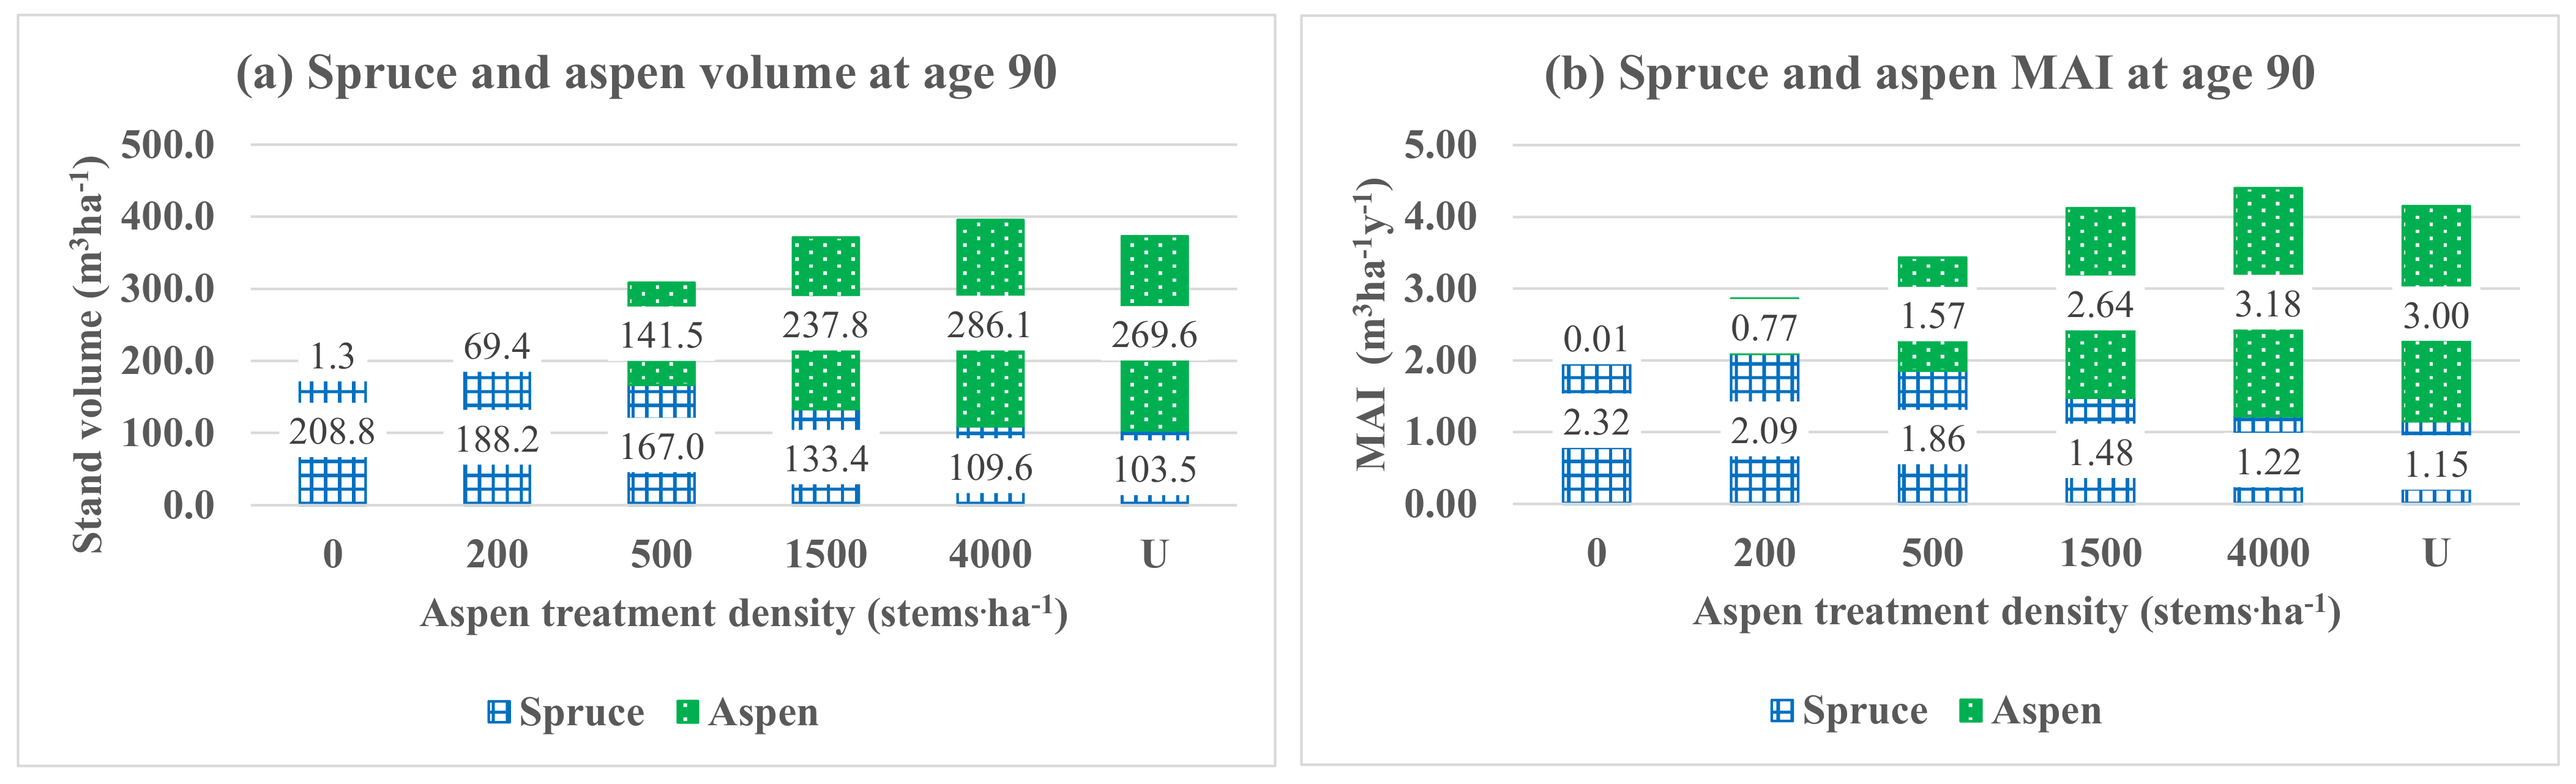
Aspen volume at age 90 increased with increasing aspen density up to 4000 stems·ha−1, with no significant difference between the 4000 and U treatments, and decreased with increasing spruce density (p < 0.001). At age 90 stand volume (total of both aspen and spruce volume) and stand MAI were largest in stands with aspen densities of 1500 stems·ha−1 or higher and with an initial spruce density of 1000 stems·ha−1, with these stands providing aspen with diameters ranging between 24.5 and 30.1 cm, spruce diameters between 19.5 and 21.3 cm, spruce volume between 103.5 and 133.4 m3·ha−1, aspen volume between 237.8 and 286.1 m3·ha−1, and stand volume between 372.8 and 397.3 m3·ha−1. MAI at age 90 ranged between 4.14 and 4.16 m3·ha−1·y−1 for mixed stands with 1000 planted spruce and 1500 or more aspen.
4. Discussion
4.1. Trembling Aspen Responses
Results from the WESBOGY long-term study indicate only small decreases in the density of unthinned aspen stands due to self-thinning between ages 10 and 28, with aspen density averaging 16,490 stems·ha−1 at age 28. While this contrasts with reports of dramatic early declines in aspen density during the first 10 to 15 years [11,26] it is consistent with reports of small but ongoing decreases in aspen density after age 10 [9,27].
Repeated measures analysis suggested that only age and not aspen density had significant effects on the height of the 200 largest diameter aspen while analysis completed separately for each of 3 selected ages (10, 20, and 28) indicated effects of aspen density on the height of the 200 largest diameter aspen, with height tending to be larger (by 1.08 m) in the 4000 stems·ha−1 treatment than in the 200 stems·ha−1 treatment at age 28. Overall, however, results are consistent with those from other studies that indicate little effect of thinning on the height of dominant aspen [9,11,26,30] while Bella and Yang [31] found that thinning increased the average height of aspen in three out of seven stands that they studied.
Age and aspen density had significant effects on DBH, slenderness, HTLC (height to crown base), and CW (crown width) of the 200 largest diameter aspen. DBH, CW, and HTLC increased with age while slenderness decreased with age for all treatments. Except for DBH at age 10, where aspen DBH was slightly (but not significantly) smaller for the 200 than the 500 stems·ha−1 treatment, DBH, and CW decreased with increasing aspen density while slenderness and HTLC increased with increasing aspen density. Differentiation amongst treatments increased with measurement age for all variables. Reductions in aspen DBH with increasing aspen density and increases in DBH following thinning are consistent with results from many other studies [9,11,23,24,25,26,27,32,33,34,35].
Increases in aspen density are generally observed to result in increases in slenderness [9,11,26,36] while environmental (climate and soil) factors may interact with competition and result in further adjustments to slenderness [37]. Decreases in aspen slenderness with age are small and consistent with generally observed decreases in slenderness of trees with age [38].
4.2. White Spruce Responses
As observed in this study, other studies also demonstrate increases in spruce height and DBH following reductions in aspen density [9,11,26,27,35]. However, increases in spruce height growth may be delayed for a few years following thinning. Bokalo et al. [26] observed no effect of thinning on spruce height growth 3 to 4 years after treatment. Bjelanovic et al. [27] observed a reduction in spruce height growth for about 3 years after the complete removal of aspen and found that spruce in this treatment had the largest height growth in the 8th year following aspen removal. Our data indicate significant differences in spruce height between unthinned and thinned plots at age 10, with differences amongst aspen densities becoming larger and increasingly significant with age. In some LTS installations observations did indicate reductions in spruce heights in the pure spruce plots during the first 10 to 15 years associated with top damage by white pine weevil and frost, with this changing with age to result in spruce being tallest in the pure spruce plots at age 20. These results highlight a need to wait until age 20 or later in these stands before making decisions regarding the possible benefits of treatments.
Competition has an immediate effect on the diameter growth of conifers, while impacts on height growth may not appear until severe competition levels are reached or competition remains at sufficient intensity for several years. As a result, the ratio of height to root collar diameter (HDR) or height to DBH (slenderness) increases in response to increases in intensity and duration of competition [36]. In addition to the competition, the ratio of height to diameter is influenced by a range of environmental factors, including variations in spring, summer, and fall growing conditions, soil resource availability, stem sway, stem bending [36], and climate [37].
While spruce CW was not significantly affected by aspen density at age 10, significant decreases in spruce CW with increasing aspen density were evident at ages 20 and 28. Decreases in spruce crown width with increases in aspen density are also reported by Groot and Schneider [39], Kabzems et al. [9], and Comeau [11,22].
At both ages 20 and 28, spruce HTLC was only influenced by aspen density with 1000 spruce while HTLC was not affected by aspen density for the 500 spruce. Consistent with results from previous studies [9,11,22,39], HTLC at age 20 increased with increasing aspen density. At age 28, differences appear inconsistent due to rapid growth of spruce in the lower aspen densities leading to crown closure and intraspecific competition, and a reversal of the more direct effects of aspen densities which resulted in HTLC in the 0 aspen not differing from that in the unthinned. Declines in branch size and live crown ratio with increasing aspen density are expected to result in improved quality of lumber and veneer due to reductions in knot size and the size of the knot-free core [21,22]. Slower diameter growth of spruce with increasing aspen density may also result in reductions in the diameter of the juvenile core inside the stem. The onset of spruce crown lift between ages 20 and 28 is believed to be resulting from increased intensity of intraspecific competition associated with stands approaching crown closure of the spruce canopy. Going forward, timing of spruce crown lift will likely continue to be influenced by both aspen and spruce densities and merits ongoing monitoring.
4.3. Effects of Aspen and Spruce Densities on Growth and Yield
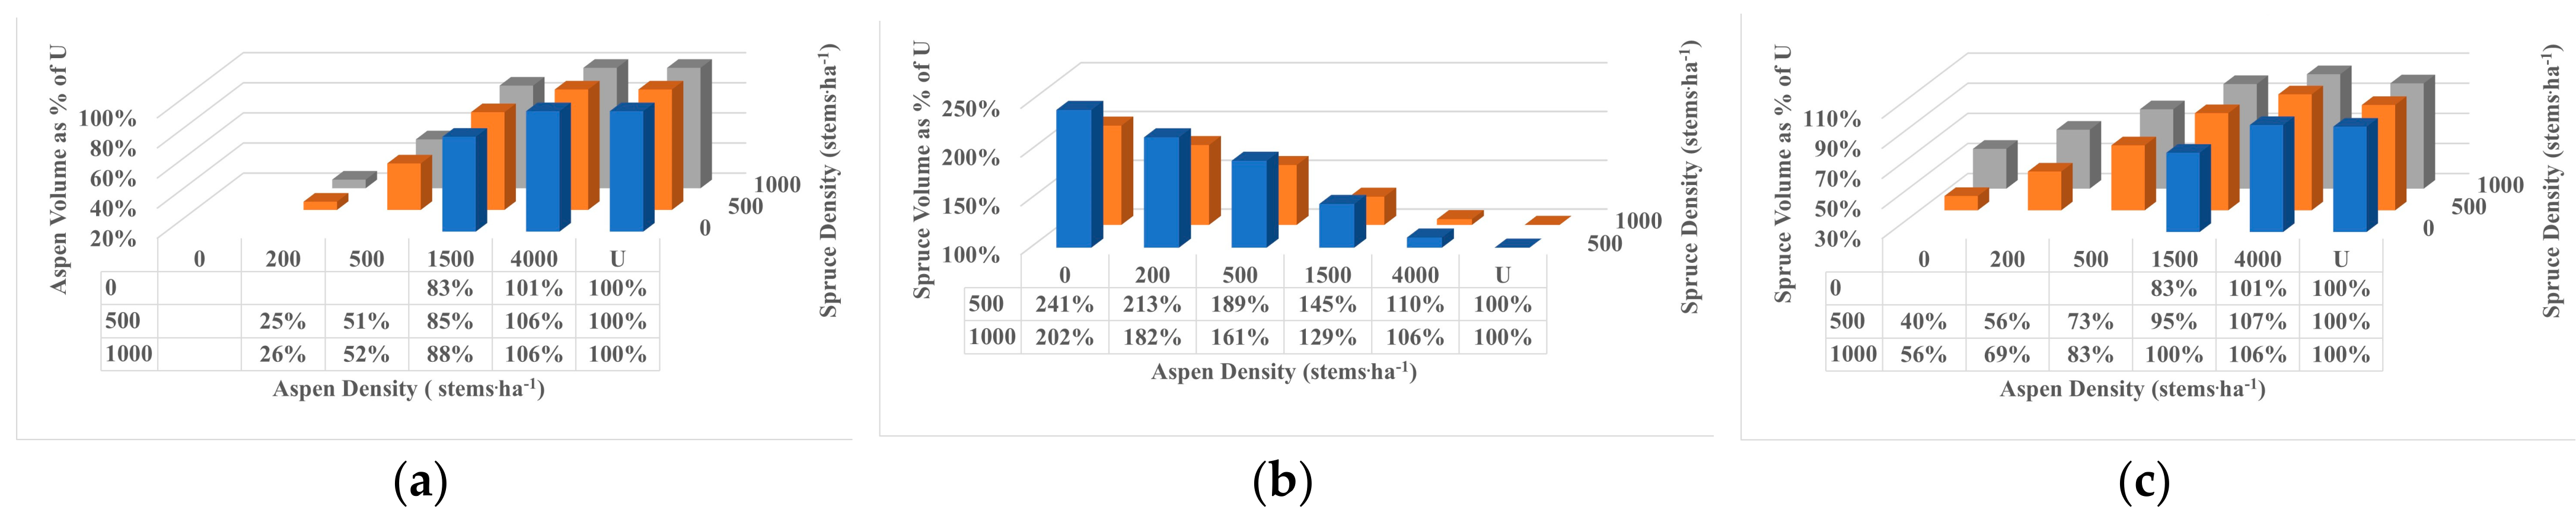
Figure 6 illustrates the effects of aspen and spruce densities on aspen and spruce volumes predicted by MGM at age 90 expressed as a % of volumes in the unthinned. Thinning aspen to 4000 stems·ha−1 at age 5 maintained a nearly full stocking of aspen but released retained trees resulted in a sustained increase in aspen growth and survival. Lower aspen volume in the unthinned is likely resulting from loss of volume to self-thinning. Aspen volume at age 90 was 101 to 106% of unthinned values at 4000 stems·ha−1. Spruce volume at age 90 declined with increasing aspen density with the volume of pure spruce stands being about double that of stands where aspen was unthinned, in agreement with other studies [9,11,27]. In addition, stand volume (the total of both aspen and spruce) at age 90 is the largest with 4000 aspen and 1000 spruce stems·ha−1.
Contributions of spruce and aspen to stand volume and MAI are highlighted in Figure 7. Spruce volume and spruce MAI at age 90 declined with increasing aspen density while aspen volume and MAI at age 90 and stand volume and MAI increased with aspen density up to 4000 stems·ha−1. It is also notable that thinning to 1500 stems·ha−1 resulted in a small reduction in aspen volume and MAI compared to the unthinned, but resulted in increased spruce volume and MAI and a similar stand volume and stand MAI. For stands with the 3 highest aspen densities stand MAI exceeded 4.14 m3 ha−1 y−1.
Growing mixtures of shade-intolerant (e.g., trembling aspen) and shade-tolerant (e.g., white spruce) species as stratified mixtures with the intolerant species in the overstory for much of the rotation results in stratification which in combination with increased stocking can lead to increases in light capture and biomass production [40]. While adding aspen to spruce stands in our study resulted in reductions in spruce volumes at age 90 and adding spruce to aspen stands resulted in reductions in aspen volumes at age 90, overyielding is indicated by increased total (aspen + spruce) stand volumes in some mixtures. The combination of 1000 spruce with 4000 aspen stems·ha−1 resulted in an estimated increase in merchantable stand volume of 71.7 m3 ha−1 over that of the unthinned, representing a 22% increase. In contrast, the combination of 500 spruce with 4000 aspen stems·ha−1 resulted in a 12% increase in merchantable stand volume at age 90 over that of the unthinned. Consistent with these results Kweon and Comeau [10] also report overyielding in aspen-spruce mixtures at ages 15–28 for seven LTS installations in Alberta and Saskatchewan, with thinning of the aspen to densities between 1500 and 4000 stems·ha−1 providing the highest total volumes.
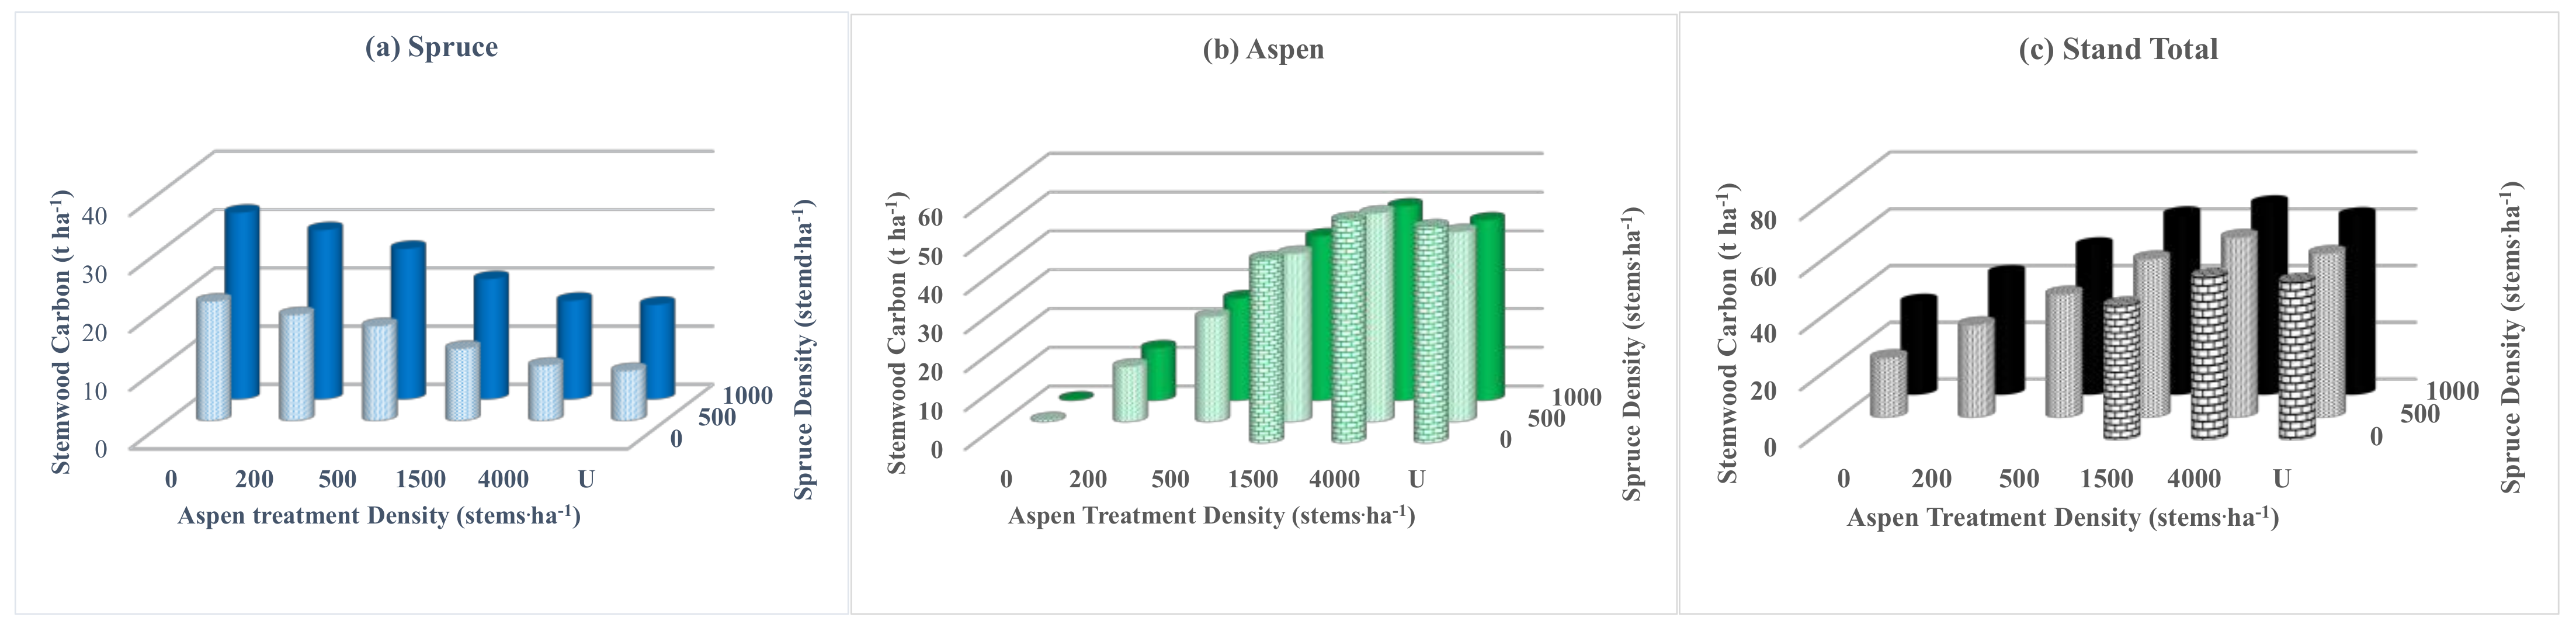
4.4. Effects of Aspen and Spruce Densities on Stemwood Biomass and Carbon
The potential for carbon sequestration is being increasingly recognized as an important ecological service provided by forests. Mixed stands of aspen and spruce with aspen densities of 1500 or more stems·ha−1 carries the largest total stand volume (Figure 7) and stem biomass, and contains the most stemwood carbon at age 90 (Table 14, Figure 8). This finding, that mixed stands have higher above-ground carbon content than monocultures is consistent with results from a meta-analysis by Warner et al. [41]. However, our results contrast with Laganiere et al. [42] who found higher aboveground carbon in aspen than in mixtures of aspen and jack pine or aspen and black spruce and likely reflect the higher productivity of white spruce on our study sites in western Canada and the fact that many factors influence overyielding [10]. While 4000 aspen stems·ha−1 has higher stemwood carbon, values do not differ significantly amongst the three highest aspen densities (1500 stems·ha−1, 4000 stems·ha−1, and unthinned). Implications of these results to the global carbon budget depend on the utilization and conversion of both aspen and spruce to long-lived wood products as well as treatment effects on carbon stored in soils and deadwood. Long-term carbon storage in harvested wood products for these two species will vary as a function of how much of the harvested carbon is placed in long-term storage in construction materials (e.g., lumber, panelboard) as opposed to short-lived products such as paper [43].
4.5. Practical Implications to Forest Management
This study demonstrates improvements in the growth of white spruce following the reduction in aspen densities and consistently shows the best growth of white spruce at ages 20 or later following the complete removal of aspen at age 5. Aspen diameter at age 20 was increased by thinning while aspen volume at age 90 is slightly, but not statistically, higher following thinning to 4000 aspen·ha−1 than in unthinned. Where the objective is to grow mixtures of spruce and aspen to maintain or enhance biodiversity and other ecological services, results suggest that thinning aspen to densities between 1500 and 4000 stems·ha−1 could be effective and would likely serve to suppress understory vegetation and aspen stump sprouting while providing good growing conditions for the moderate shade-tolerant white spruce. While the ideal timing of precommercial thinning in mixed stands is not currently known, thinning before age 15 is recommended for aspen [24]. Since mitigation of frost by aspen is probably most critical to spruce during the first 4 or 5 years, thinning between ages 5 and 15 is recommended, with thinning at ages 4 or 5 likely to provide the greatest benefit to spruce growth.
Detailed economic analysis of treatment options is beyond the scope of this paper. However, expenditures on planting and thinning can make spruce-focused management costly [45] and expenditures on thinning do not significantly increase aspen volume. Tending of spruce monocultures using an aerial application of glyphosate herbicide also costs much less than thinning. Consequently, growing monocultures are likely to provide the highest net present value at the cost of reductions in ecological services.
4.6. Study Limitations and Research Needs
Removal of ingress and fill planting to replace spruce mortality was done to maintain treatment densities during the first 10 years and differs from operational treatments that would be used in these stands. Operational practices would typically involve a single precommercial thinning treatment to control costs. Consequently, results from this study may differ from those obtained from operational treatments, particularly where thinning of aspen to densities below 1000 stems·ha−1 results in substantial resprouting.
The use of subplots, rather than full 20 m × 20 m plots for measurement of aspen in unthinned treatments potentially introduced some error in the estimation of aspen densities and average dimensions. However, as the number of aspen in the measured subplots generally exceeded that in treated full plots, it likely had little effect on the results. While a detailed measurement protocol has been in place since the start of this study, data have been collected by several different individuals, which introduced some uncontrolled variation in the data.
MGM21 is an empirical model that represents the effects of intra- and interspecific competition amongst trees and site quality (Site Index) on stand dynamics. While MGM21 has validated well against historical data [46] MGM21 is unable to represent the effects of climate change.
Analysis of the effects of climate on tree growth and stand dynamics for these sites is underway and will be reported in future papers. Research is needed to determine the ideal timing of precommercial thinning in aspen-spruce mixtures and how various factors influence timing. Supplementary studies that differentiate the effects of facilitation and competition on tree survival and growth including examination of the effects of treatments on soil nutrient availability on these sites would contribute to our understanding of the benefits of mixed stands over monocultures. Further studies of the influence of aspen-spruce mixtures and effects of precommercial thinning and other management practices on plant, insect, and wildlife diversity, soil nutrient availability, ecosystem carbon storage, and other ecological services are needed to provide a more complete picture of the role of mixedwood stands and the potential influence of alternative management practices. Effects of aspen and spruce densities and other factors on crown dynamics and associated wood quality merit future examination as these factors will influence the value of resulting timber from these stands.
Continuing measurement of these installations, which cover a broad range of climatic conditions in the western boreal region, could provide valuable insights into the effects of climate change on stand dynamics including information on the potential influence of the aspen canopy on spruce survival and growth under temperature and moisture stress. Preliminary analysis of potential effects of climate change using a version of MGM modified to model climate change effects [47] indicates that installations currently experiencing drought, as evidenced by negative historical CMI values (e.g., NWT, Mercer Peace River Pulp Superior, and Weyerhaeuser Superior), are likely to experience survival and growth declines sooner and under less intense levels of future climate change than installations with more positive water balances (e.g., Westfraser, Canadian Forest Products). In addition, increased growth of aspen and spruce from 2050 to 2100 was predicted for the Westfraser installation under climate change scenarios SSP2-2.6 and SSP2-2.45, while a decrease in aspen and spruce growth was forecast for this installation after 2080. In this region spruce survival and growth are more sensitive to drought than aspen.
5. Conclusions
Thirty-one years after the establishment of the Long-Term Study by the Western Boreal Growth and Yield Association we continue to discover interesting and potentially useful outcomes. Thinning of aspen resulted in increases in aspen diameter and increases in height and diameter of white spruce with differences amongst treatments increasing over time. Spruce were the largest with no aspen with both spruce height and diameter declining with increasing aspen density.
Consistent with other studies, results indicate reductions in crown size when spruce are grown in a mixture with aspen which may improve spruce wood quality at harvest. However, results show that higher spruce planting densities also reduce crown size beginning at about age 20.
Yield predictions based on simulations with the Mixedwood Growth Model (MGM21) indicate that spruce yields at age 90 will be largest in pure spruce stands, while aspen yields and mixed stand yields will be largest in stands with aspen densities of 1500 stems·ha−1 or higher. Overyielding, by up to 22% was predicted for aspen-spruce mixtures with the highest values observed for stands with initial densities of 1000 spruce and 4000 aspen.
Carbon storage in stemwood at age 90 is likely to be higher in aspen-spruce mixtures with more than 1500 aspen ha−1 than in pure spruce stands, with this occurring in addition to the benefits of mixed stands in terms of mitigating early competition, frost, and insect issues, improving spruce wood quality, increasing resistance and resilience of stands to climate change, biodiversity, and other ecosystem services. Findings indicate a need to manage for ongoing maintenance of aspen-spruce mixtures in managed forest landscapes of western Canada.
Author Contributions
Conceptualization, P.G.C.; methodology, P.G.C. and M.B.; formal analysis, P.G.C. and M.B.; investigation, M.B.; writing—original draft, P.G.C.; writing—review & editing, M.B.; project administration, P.G.C. and M.B.; P.G.C. and M.B. shared equally in the preparation of this paper. All authors have read and agreed to the published version of the manuscript.
Funding
Funding for the study was provided by members of the Western Boreal Growth and Yield Association (1990–2015) and by the Western Boreal Growth and Yield Project Team of the Forest Growth Organization of Western Canada (FGrOW) (2016–present).
Data Availability Statement
Data from this study may be made available on application to the Forest Growth Organization of Western Canada, WESBOGY Project Team. Any request for data should include a detailed explanation of the purpose of the request and plans for the use of these data.
Acknowledgments
We gratefully acknowledge support for this study (data collection and funding for Mike Bokalo) provided by members of the Western Boreal Growth and Yield Association (1990–2015) and by the Western Boreal Growth and Yield Project Team of the Forest Growth Organization of Western Canada (FGrOW) (2016–present). The insight and inspiration of Steve Titus and WESBOGY members involved in designing and initiating this study are also gratefully acknowledged. We are also grateful to Paul LeBlanc and three anonymous reviewers for their comments on earlier drafts of this manuscript.
Conflicts of Interest
The authors declare no conflicts of interest.
References
- Chen, H.Y.H.; Popadiouk, R.V. Dynamics of North American boreal mixedwoods. Environ. Rev. 2002, 10, 137–166. [Google Scholar] [CrossRef]
- Bergeron, Y.; Chen, H.Y.H.; Kenkel, N.C.; Leduc, A.; Macdonald, S.E. Boreal mixedwood stand dynamics: Ecological processes underlying multiple pathways. For. Chron. 2014, 90, 202–213. [Google Scholar] [CrossRef]
- Chavez, V.; Macdonald, S.E. Partitioning vascular understory diversity in mixedwood boreal forests: The importance of mixed canopies for diversity conservation. For. Ecol. Manag. 2012, 271, 19–26. [Google Scholar] [CrossRef]
- Peterson, E.B.; Peterson, N.M. Aspen Managers’ Handbook for British Columbia; Rep. No. 230; BC Ministry of Forests FRDA: Victoria, BC, Canada, 1995. Available online: https://www.for.gov.bc.ca/hfd/pubs/Docs/Frr/FRR230.pdf (accessed on 22 September 2023).
- Macdonald, S.E.; Lecomte, N.; Bergeron, Y.; Brais, S.; Chen, H.; Comeau, P.; Drapeau, P.; Lieffers, V.; Quideau, S.; Spence, J.; et al. Ecological implications of changing the composition of boreal mixedwood forests. In A State of Knowledge Report; Sustainable Forest Management Network: Edmonton, AB, Canada, 2010; 48p, Available online: https://sfmn.ualberta.ca/sfmn/wp-content/uploads/sites/83/2018/09/Ecological-Implications-of-Changing-the-Composition.pdf?ver=2016-02-23-145412-847 (accessed on 22 September 2023).
- Cavard, X.; Macdonald, S.E.; Bergeron, Y.; Chen, H.Y.H. Importance of mixedwoods for biodiversity conservation: Evidence for understory plants, songbirds, soil fauna, and ectomycorrhizae in northern forests. Environ. Rev. 2011, 19, 142–161. [Google Scholar] [CrossRef]
- Pastor, J. Nutrient cycling in aspen ecosystems. In Aspen Symposium ’89: Proceedings; General Technical Report NC-140; U.S. Department of Agriculture Forest Service: St. Paul, MN, USA, 1990; pp. 21–38. Available online: https://www.nrs.fs.usda.gov/pubs/gtr/gtr_nc140.pdf (accessed on 7 December 2023).
- Man, R.; Lieffers, V.J. Are mixtures of aspen and white spruce more productive than single species stands? For. Chron. 1999, 75, 505–513. [Google Scholar] [CrossRef]
- Kabzems, R.; Bokalo, M.; Comeau, P.G.; MacIsaac, D.A. Managed mixtures of aspen and white spruce 21 to 25 years after establishment. Forests 2016, 7, 5. [Google Scholar] [CrossRef]
- Kweon, D.; Comeau, P.G. Factors influencing overyielding in young boreal mixedwood stands in western Canada. For. Ecol. Manag. 2019, 432, 546–557. [Google Scholar] [CrossRef]
- Comeau, P.G. Effects of thinning on dynamics and drought resistance of aspen-white spruce mixtures: Results from two study sites in Saskatchewan. Front. For. Glob. Chang. 2021, 3, 621752. [Google Scholar] [CrossRef]
- Stiell, W.M.; Berry, A.B. Limiting white pine weevil attacks by side shade. For. Chron. 1985, 61, 5–9. [Google Scholar] [CrossRef]
- Taylor, S.P.; Alfaro, R.I.; DeLong, C.; Rankin, L. The effects of overstory shading on white pine weevil damage to white spruce and its effect on spruce growth rates. Can. J. For. Res. 1996, 26, 306–312. [Google Scholar] [CrossRef]
- Morrison, D.; Merler, H.; Norris, D. Detection, Recognition and Management of Armillaria and Phellinus Root Diseases in the Southern Interior of British Columbia; Rep. No. 179; BC Ministry of Forests FRDA: Victoria, BC, Canada, 1991.
- Gerlach, J.P.; Reich, P.B.; Puettmann, K.; Baker, T. Species, diversity, and density affect tree seedling mortality from Armillaria root rot. Can. J. For. Res. 1997, 27, 1509–1512. [Google Scholar] [CrossRef]
- Forrester, D.I. Transpiration and water-use efficiency in mixed-species forests versus monocultures: Effects of tree size, stand density and season. Tree Physiol. 2015, 35, 289–304. [Google Scholar] [CrossRef] [PubMed]
- Ammer, C. Unraveling the importance of inter- and intraspecific competition for the adaptation of forests to climate change. In Progress in Botany; Canovas, F.M., Lüttge, U., Matyssek, R., Eds.; Springer: Berlin/Heidelberg, Germany, 2017; Volume 78, pp. 345–367. [Google Scholar] [CrossRef]
- Bell, D.M.; Bradford, J.B.; Lauenroth, W.K. Forest stand structure, productivity, and age mediate climatic effects on aspen decline. Ecology 2014, 95, 2040–2046. [Google Scholar] [CrossRef] [PubMed]
- Filipescu, C.N.; Comeau, P.G. Influence of Populus tremuloides density on air and soil temperature. Scand. J. For. Res. 2011, 26, 421–428. [Google Scholar] [CrossRef]
- Lieffers, V.J.; Stadt, K.J. Growth of understory Picea glauca, Calamagrostis canadensis and Epilobium angustifolium in relation to overstory light. Can. J. For. Res. 1994, 24, 1193–1198. [Google Scholar] [CrossRef]
- Middleton, G.R.; Munro, B.D. Wood Density of Alberta White Spruce—Implications for Silvicultural Practices; Forintek Canada Corp.: Vancouver, BC, Canada, 2002; 21p. Available online: https://library.fpinnovations.ca/en/permalink/fpipub5573 (accessed on 7 December 2023).
- Comeau, P.G. Effects of aspen and spruce density on size and number of lower branches 20 years after thinning of two boreal mixedwood stands. Forests 2021, 12, 211. [Google Scholar] [CrossRef]
- Bickerstaff, A. The Effect of Thinning upon the Growth and Yield of Aspen Stands; Silviculture Research Note. No. 80; Dominion Forest Service: Ottawa, ON, Canada, 1946. [Google Scholar]
- Steneker, G.A. Guide to the Silvicultural Management of Trembling Aspen in the Prairie Provinces; Information Report NOR X 164; Government of Canada, Canadian Forestry Service, Northern Forestry Centre: Edmonton, AB, USA, 1976; Available online: https://cfs.nrcan.gc.ca/publications/download-pdf/12097 (accessed on 7 December 2023).
- Perala, D.A. Thinning Strategies for Aspen: A Predictive Model; Paper NC-RP-161; USDA Forest Service Research: Asheville, NC, USA, 1978.
- Bokalo, M.; Comeau, P.G.; Titus, S.J. Early development of tended mixtures of aspen and spruce in western Canadian boreal forests. For. Ecol. Manag. 2007, 242, 175–184. [Google Scholar] [CrossRef]
- Bjelanovic, I.; Comeau, P.; Meredith, S.; Roth, B. Precommercial thinning increases spruce yields in boreal mixedwoods in Alberta. Forests 2021, 12, 412. [Google Scholar] [CrossRef]
- Huang, S.; Meng, S.X.; Yang, Y.A. Growth and Yield Projection System (GYPSY) for Natural and Post-Harvest Stands in Alberta; T/216; Government of Alberta: Edmonton, AB, Canada, 2009; pp. 1–22. Available online: https://www.alberta.ca/growth-and-yield-projection-system.aspx (accessed on 20 September 2023).
- Lambert, M.C.; Ung, C.H.; Raulier, F. Canadian national tree aboveground biomass equations. Can. J. For. Res. 2005, 35, 1996–2018. [Google Scholar] [CrossRef]
- Penner, M.; Robinson, C.; Woods, M. The response of good and poor aspen clones to thinning. For. Chron. 2001, 77, 874–884. [Google Scholar] [CrossRef]
- Bella, I.E.; Yang, R.C. Should we thin young aspen stands? In Aspen Management for the 21st Century. Proceedings of a Symposium; Navratil, S., Chapman, P.B., Eds.; 1991; pp. 135–139. Available online: https://cfs.nrcan.gc.ca/publications/download-pdf/19159 (accessed on 7 December 2023).
- Rice, J.A.; MacDonald, G.B.; Weingartner, D.H. Precommercial thinning of trembling aspen in northern Ontario: Part 1—Growth responses. For. Chron. 2001, 77, 893–901. [Google Scholar] [CrossRef]
- Prévost, M.; Gauthier, M.M. Precommercial thinning increases growth of overstory aspen and understory balsam fir in a boreal mixedwood stand. For. Ecol. Manag. 2012, 278, 17–26. [Google Scholar] [CrossRef]
- Diaconu, D.; Kahle, H.P.; Spiecker, H. Tree- and stand-level thinning effects on growth of European beech (Fagus sylvatica L.) on a northeast- and a southwest-facing slope in southwest Germany. Forests 2015, 6, 3256–3277. [Google Scholar] [CrossRef]
- Comeau, P.G.; Hoepting, M.K.; Mihajlovich, M. Using spot treatments to regenerate an intimate mixture of trembling aspen and white spruce in Alberta: Results at age 15. For. Chron. 2023, 99, 80–91. [Google Scholar] [CrossRef]
- Opio, C.; Jacob, N.; Coopersmith, D. Height to diameter ratio as a competition index for young conifer plantations in northern British Columbia. For. Ecol. Manag. 2000, 137, 245–252. [Google Scholar] [CrossRef]
- Wang, J.; Wang, Y.; Tian, D.; Wang, W.; Jiang, L. Modeling response of tree slenderness to climate, soil, diversity and competition in natural secondary forests. For. Ecol. Manag. 2023, 545, 121253. [Google Scholar] [CrossRef]
- Zhang, X.; Wang, H.; Chhin, S.; Zhang, J. Effects of competition, age and climate on tree slenderness of Chinese fir plantations in southern China. For. Ecol. Manag. 2020, 458, 117815. [Google Scholar] [CrossRef]
- Groot, A.; Schneider, R. Predicting maximum branch diameter from crown dimensions, stand characteristics and tree species. For. Chron. 2011, 87, 542–551. [Google Scholar] [CrossRef]
- Forrester, D.I.; Ammer, C.; Annighöfer, P.J.; Barbeito, I.; Bielak, K.; Bravo-Oviedo, A.; Coll, L.; del Río, M.; Drössler, L.; Heym, M.; et al. Effects of crown architecture and stand structure on light absorption in mixed and monospecific Fagus sylvatica and Pinus sylvestris forests along a productivity and climate gradient through Europe. J. Ecol. 2018, 106, 746–760. [Google Scholar] [CrossRef]
- Warner, E.; Cook-Patton, S.C.; Lewis, O.T.; Brown, N.; Koricheva, J.; Eisenhauer, N.; Ferlian, O.; Gravel, D.; Hall, J.S.; Jactel, H.; et al. Young mixed planted forests store more carbon than monocultures—A meta-analysis. Front. For. Glob. Chang. 2023, 6, 1226514. [Google Scholar] [CrossRef]
- Laganière, J.; Cavard, X.; Brassard, B.W.; Paré, D.; Bergeron, Y.; Chen, H.Y.H. The influence of boreal tree species mixtures on ecosystem carbon storage and fluxes. For. Ecol. Manag. 2015, 354, 119–129. [Google Scholar] [CrossRef]
- Zhao, J.; Wei, X.; Li, L. The potential for storing carbon by harvested wood products. Front. For. Glob. Chang. 2022, 5, 1055410. [Google Scholar] [CrossRef]
- Lamlon, S.H.; Savidge, R.A. A reassessment of carbon content in wood: Variation within and between 41 North American species. Biomass Bioenergy 2003, 25, 381–388. [Google Scholar] [CrossRef]
- Armstrong, G.W. Considerations for boreal mixedwood silviculture: A view from the dismal science. For. Chron. 2014, 90, 44–49. [Google Scholar] [CrossRef]
- Comeau, P.; Johnson, K.; Bokalo, M. Validation of the Mixedwood Growth Model (MGM) against tha Alberta Provincial Growth and Yield Initiative (PGYI) Dataset. Available online: https://ales-ssl.ales.ualberta.ca/mgm/MGM21_Validation_against_the_PGYI20_Dataset_April_27_2021.pdf (accessed on 17 December 2023).
- Comeau, P.G.; Johnson, K.M.; Oboite, F.O.; Bokalo, M. Modelling influences of climate change on the dynamics of western boreal forests in Canada using the Mixedwood Growth Model (MGM). 2023; unpublished work. [Google Scholar]
Figure 1.
Locations of the 21 WESBOGY Long-Term Study Installations (indicated by the stars) in Western Canada (generated using Google Earth).
Figure 1.
Locations of the 21 WESBOGY Long-Term Study Installations (indicated by the stars) in Western Canada (generated using Google Earth).

Figure 2.
Results from third-degree polynomial models summarizing trends for aspen (top 200 trees per ha): (a) height, and (b) DBH for the five aspen treatment densities (awtrtden). Aspen treatment density (awtrtden) of 9999 represents the unthinned.
Figure 2.
Results from third-degree polynomial models summarizing trends for aspen (top 200 trees per ha): (a) height, and (b) DBH for the five aspen treatment densities (awtrtden). Aspen treatment density (awtrtden) of 9999 represents the unthinned.

Figure 3.
Results from second-degree polynomial models for the five aspen treatment densities (awtrtden) summarizing trends for (a) spruce height, (b) DBH for spruce density of 500 stems·ha−1, and (c) DBH for spruce density of 1000 stems·ha−1. Aspen treatment density (awtrtden) of 9999 represents the unthinned.

Figure 4.
Yield curves showing volume-age trends for spruce in plots 1 (a), 4 (b), 6 (c), 7 (d), 10 (e), and 12 (f) for spruce site index values of 16, 19, and 22 m. sph = stems·ha−1.
Figure 4.
Yield curves showing volume-age trends for spruce in plots 1 (a), 4 (b), 6 (c), 7 (d), 10 (e), and 12 (f) for spruce site index values of 16, 19, and 22 m. sph = stems·ha−1.

Figure 5.
Yield curves showing volume-age trends for aspen in plots 4 (a), 10 (b), 13 (c), 6 (d), 12 (e), and 15 (f) for aspen site index values of 18, 21.5 and 25 m. sph = stems·ha−1.
Figure 5.
Yield curves showing volume-age trends for aspen in plots 4 (a), 10 (b), 13 (c), 6 (d), 12 (e), and 15 (f) for aspen site index values of 18, 21.5 and 25 m. sph = stems·ha−1.

Figure 6.
Effects of aspen and spruce densities on (a) aspen, (b) spruce, and (c) stand volumes at age 90 expressed as a % of volume in the unthinned (U).
Figure 6.
Effects of aspen and spruce densities on (a) aspen, (b) spruce, and (c) stand volumes at age 90 expressed as a % of volume in the unthinned (U).

Figure 7.
Treatment effects on spruce and aspen volume (a) and MAI (b) at age 90 for initial spruce densities of 1000 stems·ha−1.
Figure 7.
Treatment effects on spruce and aspen volume (a) and MAI (b) at age 90 for initial spruce densities of 1000 stems·ha−1.

Figure 8.
Effects of aspen and spruce densities on stemwood carbon at age 90.


Table 1.
Location, climate, and age of the 21 WESBOGY LTS installations. MAT = mean annual temperature (1991–2020), MAP = mean annual precipitation (1991–2020), CMI = mean climate moisture index (1991–2020). Climate values were generated using ClimateNA7.3 (climateNA.ca). Site index (height of the 100 largest diameter trees at breast height age 50) was calculated for each installation using the GYPSY Site Index equations [28], with aspen site index (SI-Aw) determined from unthinned plots (plots 6, 12, and 15) and spruce site index (SI-Sw) determined from plots with zero aspen density (plots 1 and 7) based on measurements at age 12.
| Agency | Installation | Est. Yr | Lat. | Long. | Elev. | MAT (°C) | MAP (mm) | CMI (mm) | Last Meas. | Age at Last Meas. | SI-Sw | SI-Aw |
|---|---|---|---|---|---|---|---|---|---|---|---|---|
| Government of Alberta | Median | 1992 | 55.317 | −114.070 | 622 | 1.7 | 477 | 4.38 | 2017 | 25 | 20.6 | 24.3 |
| Alberta Pacific Forest Industries | Median | 2001 | 55.216 | −111.913 | 648 | 1.4 | 478 | 3.89 | 2020 | 19 | 19.4 | 22.6 |
| Alberta Pacific Forest Industries | Superior | 1993 | 55.041 | −111.948 | 596 | 1.6 | 453 | 1.09 | 2019 | 26 | 18.8 | 24.2 |
| Canadian Forest Products | Median | 2001 | 54.760 | −117.400 | 755 | 2.5 | 530 | 7.47 | 2021 | 20 | 19.1 | 19.4 |
| Canadian Forest Products | Superior | 2001 | 54.754 | −117.369 | 800 | 2.5 | 533 | 7.83 | 2020 | 20 | 22.6 | 22.0 |
| Louisiana Pacific Canada—Dawson Creek | Median | 2000 | 53.758 | −120.051 | 900 | 2.2 | 481 | 6.08 | 2020 | 20 | 12.9 | 23.4 |
| Louisiana Pacific Canada—Dawson Creek | Superior-Rep1 | 2000 | 55.392 | −121.687 | 671 | 3.1 | 499 | 4.57 | 2020 | 20 | 11.4 | 18.2 |
| Louisiana Pacific Canada—Dawson Creek | Superior-Rep2 | 2003 | 55.222 | −121.663 | 730 | 3.0 | 511 | 7.88 | 2020 | 17 | 18.5 | 19.1 |
| Louisiana Pacific Canada—Swan River | Median | 1998 | 56.485 | −101.251 | 640 | 1.0 | 519 | 7.47 | 2021 | 23 | 23.1 | 17.4 |
| Louisiana Pacific Canada—Swan River | Superior | 1998 | 51.702 | −101.550 | 619 | 1.0 | 511 | 5.61 | 2021 | 23 | 25.9 | 20.9 |
| Mercer Peace River Pulp | Median | 1992 | 56.385 | −118.589 | 788 | 1.0 | 436 | 3.28 | 2019 | 27 | 22.1 | 20.9 |
| Mercer Peace River Pulp | Superior | 1992 | 56.414 | −117.729 | 728 | 1.1 | 423 | −0.22 | 2019 | 27 | 22.1 | 21.9 |
| NWT | Median | 1993 | 61.342 | −120.749 | 240 | −2.2 | 388 | −2.34 | 2015 | 22 | 15.5 | 20.3 |
| NWT | Superior | 1993 | 61.239 | −120.469 | 270 | −2.3 | 369 | −3.08 | 2015 | 22 | 17.9 | 23.6 |
| Saskatchewan Environment-Prince Albert | Median | 1990 | 53.759 | −105.551 | 548 | 0.7 | 483 | 4.60 | 2021 | 31 | 21.9 | 22.0 |
| Saskatchewan Environment-Prince Albert | Superior | 1990 | 53.678 | −105.937 | 535 | 1.0 | 476 | 2.68 | 2021 | 31 | 20.9 | 23.2 |
| Saskatchewan Environment-Big River | Median | 1992 | 54.092 | −107.066 | 515 | 1.1 | 433 | −1.19 | 2018 | 26 | 21.4 | 25.0 |
| Saskatchewan Environment-Big River | Superior | 1992 | 54.052 | −106.979 | 505 | 1.2 | 436 | −1.04 | 2018 | 26 | 19.6 | 25.1 |
| WestFraser | Median | 1992 | 53.760 | −116.678 | 1050 | 2.9 | 544 | 10.76 | 2019 | 27 | 19.5 | 20.3 |
| WestFraser | Superior-Rep1 | 1992 | 53.804 | −116.644 | 1100 | 2.9 | 555 | 13.33 | 2019 | 27 | 21.2 | 19.8 |
| WestFraser | Superior-Rep2 | 1994 | 53.796 | −116.610 | 1085 | 2.9 | 551 | 12.28 | 2019 | 25 | 19.0 | 18.5 |
| Weyerhaeuser Canada—Grand Prairie | Median | 1991 | 54.886 | −118.898 | 703 | 2.4 | 476 | 1.01 | 2018 | 27 | 15.7 | 19.6 |
| Weyerhaeuser Canada—Grand Prairie | Superior | 1991 | 54.913 | −118.919 | 711 | 2.35 | 466 | −0.74 | 2018 | 27 | 16.0 | 20.1 |
Table 2.
Treatment (plot) numbers associated with each of the 15 spruce and aspen density combinations created in the WESBOGY Long-Term Study.
Table 2.
Treatment (plot) numbers associated with each of the 15 spruce and aspen density combinations created in the WESBOGY Long-Term Study.
| Aspen Density (stems·ha−1) | |||||||
|---|---|---|---|---|---|---|---|
| 0 | 200 | 500 | 1500 | 4000 | Natural | ||
| Spruce Density (stems·ha−1) | 1000 | 1 | 2 | 3 | 4 | 5 | 6 |
| 500 | 7 | 8 | 9 | 10 | 11 | 12 | |
| 0 | x | x | x | 13 | 14 | 15 | |
Table 3.
Results from repeated measures analysis testing effects of age, aspen treatment density, spruce treatment density, and interaction terms on aspen and spruce height and DBH. Significant (p < 0.05) terms are indicated in bold.
Table 3.
Results from repeated measures analysis testing effects of age, aspen treatment density, spruce treatment density, and interaction terms on aspen and spruce height and DBH. Significant (p < 0.05) terms are indicated in bold.
| Species: | Aspen (Top 200 Trees ha−1) | Spruce | ||||||||||
|---|---|---|---|---|---|---|---|---|---|---|---|---|
| Variable: | Height | DBH | Height | DBH | ||||||||
| Source | Num df | Den df | p-Value | Num df | Den df | p-Value | Num df | Den df | p-Value | Num df | Den df | p-Value |
| Age | 1 | 2770 | <0.0001 | 1 | 2810 | <0.0001 | 1 | 771 | <0.0001 | 1 | 718 | <0.0001 |
| Age2 | 1 | 2701 | 0.0408 | 1 | 2537 | 0.0307 | 1 | 2855 | <0.0001 | 1 | 2521 | <0.0001 |
| Age3 | 1 | 2504 | 0.0869 | 1 | 2540 | 0.0260 | ||||||
| Aspen Treatment Density (Aw) | 4 | 371 | 0.8060 | 4 | 395 | 0.0491 | 5 | 470 | <0.0001 | 5 | 456 | <0.0001 |
| Spruce Planting Density (Sw) | 1 | 370 | 0.3683 | 1 | 396 | 0.1384 | 1 | 470 | 0.7155 | 1 | 456 | 0.0026 |
| Aw × Sw | 4 | 370 | 0.9179 | 4 | 398 | 0.8299 | 5 | 469 | 0.8771 | 5 | 456 | 0.1926 |
| Age × Aw | 4 | 343 | 0.7916 | 4 | 352 | 0.0003 | 5 | 469 | <0.0001 | 5 | 456 | <0.0001 |
| Age × Sw | 1 | 344 | 0.2011 | 1 | 353 | 0.0353 | 1 | 469 | 0.9822 | 1 | 456 | 0.0121 |
| Age × Aw × Sw | 4 | 344 | 0.9046 | 4 | 353 | 0.5848 | 5 | 469 | 0.9072 | 5 | 456 | 0.4198 |
Table 4.
Mixed model ANOVA results (α = 0.05) for aspen, testing differences in mean HT (m), DBH (cm), Slenderness, crown width (CW) (m), height to live crown base (HTLC) (m), SPH (stems·ha−1) and basal area (BA) (m2·ha−1) by treatment at year 10. Significant (p < 0.05) terms are indicated in bold.
Table 4.
Mixed model ANOVA results (α = 0.05) for aspen, testing differences in mean HT (m), DBH (cm), Slenderness, crown width (CW) (m), height to live crown base (HTLC) (m), SPH (stems·ha−1) and basal area (BA) (m2·ha−1) by treatment at year 10. Significant (p < 0.05) terms are indicated in bold.
| Source | df | HT | DBH | Slendernes | CW | HTLC | SPH | BA |
|---|---|---|---|---|---|---|---|---|
| p-Value | p-Value | p-Value | p-Value | p-Value | p-Value | p-Value | ||
| Agency (A) | 10 | - | - | - | - | - | - | - |
| Installation (I) | 1 | 0.2073 | 0.3467 | 0.5691 | 0.6068 | 0.1742 | 0.3300 | 0.6683 |
| Aspen Treatment Density (Aw) | 3 | <0.0001 | 0.0109 | <0.0001 | 0.4947 | <0.0001 | <0.0001 | <0.0001 |
| Spruce Planting Density (Sw) | 1 | 0.7137 | 0.2358 | 0.6205 | 0.4446 | 0.9486 | 0.3300 | 0.7211 |
| A × I | 9 | - | - | - | - | - | - | - |
| Replicate (A × I) | 20 | - | - | - | - | - | - | - |
| Aw × Sw | 3 | 0.2765 | 0.1504 | 0.3674 | 0.6113 | 0.4175 | 0.4190 | 0.8348 |
| I × Aw | 3 | 0.3653 | 0.6592 | 0.7982 | 0.9297 | 0.3922 | 0.0851 | 0.8719 |
| I × Sw | 1 | 0.9301 | 0.6139 | 0.5167 | 0.9994 | 0.7343 | 0.0905 | 0.8783 |
| I × Aw × Sw | 3 | 0.2199 | 0.9002 | 0.1516 | 0.6781 | 0.4960 | 0.0353 | 0.9462 |
| Residual Error | 272 | - | - | - | - | - | - | - |
| Total | 326 | - | - | - | - | - | - | - |
Table 5.
Mixed model ANOVA results (α = 0.05) for aspen, testing differences in mean HT (m), DBH (cm), Slenderness, crown width (CW) (m), height to live crown base (HTLC) (m), SPH (stems·ha−1) and basal area (BA) (m2·ha−1) by treatment at year 20. Significant (p < 0.05) terms are indicated in bold.
Table 5.
Mixed model ANOVA results (α = 0.05) for aspen, testing differences in mean HT (m), DBH (cm), Slenderness, crown width (CW) (m), height to live crown base (HTLC) (m), SPH (stems·ha−1) and basal area (BA) (m2·ha−1) by treatment at year 20. Significant (p < 0.05) terms are indicated in bold.
| Source | df | HT | DBH | Slendernes | CW | HTLC | SPH | BA |
|---|---|---|---|---|---|---|---|---|
| p-Value | p-Value | p-Value | p-Value | p-Value | p-Value | p-Value | ||
| Agency (A) | 10 | - | - | - | - | - | - | - |
| Installation (I) | 1 | 0.6718 | 0.4282 | 0.3710 | 0.9925 | 0.3438 | 0.5983 | 0.5819 |
| Aspen Treatment Density (Aw) | 4 | <0.0001 | <0.0001 | <0.0001 | <0.0001 | <0.0001 | <0.0001 | <0.0001 |
| Spruce Planting Density (Sw) | 1 | 0.8226 | 0.3320 | 0.5397 | 0.7923 | 0.2371 | 0.3899 | 0.9749 |
| A × I | 9 | - | - | - | - | - | - | - |
| Replicate (A × I) | 19 | - | - | - | - | - | - | - |
| Aw × Sw | 4 | 0.9769 | 0.3390 | 0.4685 | 0.1364 | 0.7584 | 0.5927 | 0.7405 |
| I × Aw | 4 | 0.1650 | 0.2471 | 0.5172 | 0.5511 | 0.3283 | 0.3918 | 0.9368 |
| I × Sw | 1 | 0.8730 | 0.8840 | 0.7671 | 0.8982 | 0.0625 | 0.1383 | 0.8510 |
| I × Aw × Sw | 4 | 0.7850 | 0.9976 | 0.9200 | 0.8057 | 0.9570 | 0.0782 | 0.9932 |
| Residual Error | 340 | - | - | - | - | - | - | - |
| Total | 397 | - | - | - | - | - | - | - |
Table 6.
Mixed model ANOVA results (α = 0.05) for aspen, testing differences in mean HT (m), DBH (cm), Slenderness, crown width (CW) (m), height to live crown base (HTLC) (m), SPH (stems·ha−1) and basal area (BA) (m2·ha−1) by treatment at year 28. Significant (p < 0.05) terms are indicated in bold.
Table 6.
Mixed model ANOVA results (α = 0.05) for aspen, testing differences in mean HT (m), DBH (cm), Slenderness, crown width (CW) (m), height to live crown base (HTLC) (m), SPH (stems·ha−1) and basal area (BA) (m2·ha−1) by treatment at year 28. Significant (p < 0.05) terms are indicated in bold.
| Source | df | HT | DBH | Slenderness | CW | HTLC | SPH | BA |
|---|---|---|---|---|---|---|---|---|
| p-Value | p-Value | p-Value | p-Value | p-Value | p-Value | p-Value | ||
| Agency (A) | 6 | - | - | - | - | - | - | - |
| Installation (I) | 1 | 0.2329 | 0.3441 | 0.0720 | 0.2537 | 0.4929 | 0.2103 | 0.6716 |
| Aspen Treatment Density (Aw) | 4 | 0.0010 | <0.0001 | <0.0001 | <0.0001 | <0.0001 | <0.0001 | <0.0001 |
| Spruce Planting Density (Sw) | 1 | 0.1346 | 0.1762 | 0.8035 | 0.1909 | 0.2978 | 0.2533 | 0.2227 |
| A × I | 4 | - | - | - | - | - | - | - |
| Replicate (A × I) | 10 | - | - | - | - | - | - | - |
| Aw × Sw | 4 | 0.5198 | 0.4927 | 0.1084 | 0.8385 | 0.4933 | 0.2627 | 0.5223 |
| I × Aw | 4 | 0.3651 | 0.0021 | 0.0056 | 0.7459 | 0.5860 | 0.0521 | 0.4855 |
| I × Sw | 1 | 0.6091 | 0.5043 | 0.3445 | 0.8205 | 0.2995 | 0.2823 | 0.7067 |
| I × Aw × Sw | 4 | 0.0111 | 0.7156 | 0.3293 | 0.9275 | 0.1254 | 0.4036 | 0.3505 |
| Residual Error | 178 | - | - | - | - | - | - | - |
| Total | 217 | - | - | - | - | - | - | - |
Table 7.
Summary of treatment means (least square means) for aspen height (HT), DBH, Slenderness, crown width (CW), height to live crown (HTLC) for top trees, density (SPH, stems·ha−1), and basal area (BA) by treatment and age. Values within each row with different letters were found to be significantly (α = 0.05) different using Tukey’s test. The standard deviation is indicated in parentheses.
| Treatment | ||||||
|---|---|---|---|---|---|---|
| Variable | Age | 200 | 500 | 1500 | 4000 | Unthinned |
| HT (m) | 10 | 6.18 b (1.600) | 6.79 a (1.752) | 6.88 a (1.759) | 6.95 a (1.705) | 6.04 b (1.706) |
| HT (m) | 20 | 11.09 c (2.261) | 12.08 ab (2.118) | 12.13 a (1.912) | 12.28 a (1.911) | 11.42 bc (1.967) |
| HT (m) | 28 | 14.74 b (1.465) | 15.49 ab (1.957) | 15.73 a (1.870) | 15.82 a (1.870) | 15.26 ab (1.832) |
| DBH (cm) | 10 | 6.87 a (1.908) | 7.38 a (1664) | 7.29 a (1.578) | 7.09 a (1.330) | 5.09 b (1.397) |
| DBH (cm) | 20 | 14.44 ab (3.230) | 15.14 a (2.589) | 13.93 b (1.974) | 12.95 c (1.458) | 10.96 d (2.162) |
| DBH (cm) | 28 | 20.62 a (2.244) | 19.86 a (2.527) | 17.99 b (1.651) | 16.50 c (1.779) | 14.76 d (2.115) |
| Slenderness | 10 | 0.93 c (0.176) | 0.92 c (0.135) | 0.94 bc (0.125) | 0.98 b (0.155) | 1.22 a (0.252) |
| Slenderness | 20 | 0.85 bc (0.556) | 0.80 c (0.109) | 0.88 bc (0.115) | 0.95 b (0.128) | 1.07 a (0.196) |
| Slenderness | 28 | 0.72 e (0.074) | 0.79 d (0.079) | 0.88 c(0.104) | 0.97 b (0.105) | 1.05 a (0.152) |
| CW (m) | 10 | 1.20 a (0.357) | 1.24 a (0.299) | 1.23 a (0.330) | 1.18 a (0.268) | 0.86 b (0.338) |
| CW (m) | 20 | 1.97 ab (0.541) | 2.06 a (0.619) | 1.81 bc (0.418) | 1.68 c (0.376) | 1.41 d (0.475) |
| CW (m) | 28 | 2.68 a (0.636) | 2.48 a (0.438) | 2.14 b (0.420) | 1.83 c (0.348) | 1.61 d (0.516) |
| HTLC (m) | 10 | 1.58 c (0.615) | 1.68 bc (0.587) | 1.70 bc (0.717) | 1.87 ab (0.785) | 2.02 a (0.835) |
| HTLC (m) | 20 | 2.96 e (0.986) | 3.45 d (1.393) | 3.97 c (1.435) | 4.71 b (1.412) | 5.27 a (1.546) |
| HTLC (m) | 28 | 4.97 d (1.070) | 5.75 c (1.503) | 6.91 b (1.599) | 7.41 ab (1.659) | 7.86 a (1.553) |
| SPH (stems·ha−1) | 10 | 182 c (41.5) | 492 c (91.5) | 1364 c (216.1) | 3599 b (453.5) | 17,775 a (7605.4) |
| SPH (stems·ha−1) | 20 | 160 c (41.4) | 467 c (92.1) | 1354 c (217.9) | 3590 b (458.5) | 17,466 a (7736.9) |
| SPH (stems·ha−1) | 28 | 150 c (54.0) | 464 c (122.8) | 1356 c (223.5) | 3507 b (571.6) | 16,490 a (5898.8) |
| BA (m2·ha−1) | 10 | 1.25 e (0.670) | 2.70 d (1.156) | 5.21 c (2.422) | 8.72 b (3.214) | 12.01 a (5.654) |
| BA (m2·ha−1) | 20 | 1.26 e (0.656) | 2.70 d (1.150) | 5.23 c (2.444) | 8.86 b (3.113) | 11.94 a (5.705) |
| BA (m2·ha−1) | 28 | 1.62 e (0.596) | 3.16 d (1.205) | 6.18 c (2.223) | 10.10 b (3.008) | 12.94 a (3.621) |
Table 8.
Mixed model ANOVA results (α = 0.05) for spruce, testing differences in mean height (HT) (m), root collar diameter (RCD) (cm), height: diameter ratio (HDR), crown width (CW) (m) and height to live crown base (HTLC) (m) by treatment at year 10. Significant (p < 0.05) terms are indicated in bold.
| Source | df | HT | RCD | HDR | CW | HTLC |
|---|---|---|---|---|---|---|
| p-Value | p-Value | p-Value | p-Value | p-Value | ||
| Agency (A) | 10 | - | - | - | - | - |
| Installation (I) | 1 | 0.2180 | 0.1263 | 0.2348 | 0.1662 | 0.7794 |
| Aspen Treatment Density (Aw) | 5 | 0.0064 | <0.0001 | <0.0001 | 0.0832 | 0.0852 |
| Spruce Planting Density (Sw) | 1 | 0.2822 | 0.7305 | 0.2739 | 0.0962 | 0.9316 |
| A × I | 9 | - | - | - | - | - |
| Replicate (A × I) | 20 | - | - | - | - | - |
| Aw × Sw | 5 | 0.7804 | 0.7928 | 0.8974 | 0.5788 | 0.8032 |
| I × Aw | 5 | 0.0049 | 0.0059 | 0.1714 | 0.0022 | 0.6081 |
| I × Sw | 1 | 0.3241 | 0.3296 | 0.3034 | 0.3630 | 0.4518 |
| I × Aw × Sw | 5 | 0.3074 | 0.0554 | 0.3393 | 0.4178 | 0.7897 |
| Residual Error | 429 | - | - | - | - | - |
| Total | 491 | - | - | - | - | - |
Table 9.
Mixed model ANOVA results (α = 0.05) for spruce, testing differences in mean height HT (m), DBH (cm), Slenderness, crown width (CW) (m), and height to live crown base (HTLC) (m) by treatment at year 20. Significant (p < 0.05) terms are indicated in bold.
Table 9.
Mixed model ANOVA results (α = 0.05) for spruce, testing differences in mean height HT (m), DBH (cm), Slenderness, crown width (CW) (m), and height to live crown base (HTLC) (m) by treatment at year 20. Significant (p < 0.05) terms are indicated in bold.
| Source | df | HT | DBH | Slenderness | CW | HTLC |
|---|---|---|---|---|---|---|
| p-Value | p-Value | p-Value | p-Value | p-Value | ||
| Agency (A) | 10 | - | - | - | - | - |
| Installation (I) | 1 | 0.7536 | 0.4082 | 0.6940 | 0.9849 | 0.3533 |
| Aspen Treatment Density (Aw) | 5 | <0.0001 | <0.0001 | <0.0001 | <0.0001 | <0.0001 |
| Spruce Planting Density (Sw) | 1 | 0.5258 | 0.0019 | 0.9190 | 0.0001 | 0.1422 |
| A × I | 9 | - | - | - | - | - |
| Replicate (A × I) | 19 | - | - | - | - | - |
| Aw × Sw | 5 | 0.5492 | 0.2767 | 0.0448 | 0.1009 | 0.0932 |
| I × Aw | 5 | 0.0396 | 0.5296 | 0.0196 | 0.0475 | 0.8642 |
| I × Sw | 1 | 0.2304 | 0.4760 | 0.1300 | 0.7081 | 0.0775 |
| I × Aw × Sw | 5 | 0.7703 | 0.5308 | 0.4156 | 0.9048 | 0.4306 |
| Residual Error | 418 | - | - | - | - | - |
| Total | 479 | - | - | - | - | - |
Table 10.
Mixed model ANOVA results (α = 0.05) for top spruce, testing differences in mean height (HT) (m), DBH (cm), Slenderness, crown width (CW) (m) and height to live crown base (HTLC) (m) by treatment at year 28. Significant (p < 0.05) terms are indicated in bold.
Table 10.
Mixed model ANOVA results (α = 0.05) for top spruce, testing differences in mean height (HT) (m), DBH (cm), Slenderness, crown width (CW) (m) and height to live crown base (HTLC) (m) by treatment at year 28. Significant (p < 0.05) terms are indicated in bold.
| Source | df | HT | DBH | Slenderness | CW | HTLC |
|---|---|---|---|---|---|---|
| p-Value | p-Value | p-Value | p-Value | p-Value | ||
| Agency (A) | 6 | - | - | - | - | - |
| Installation (I) | 1 | 0.0839 | 0.8733 | 0.6394 | 0.9675 | 0.5502 |
| Aspen Treatment Density (Aw) | 5 | <0.0001 | <0.0001 | <0.0001 | <0.0001 | 0.2009 |
| Spruce Planting Density (Sw) | 1 | 0.6546 | 0.0057 | 0.9711 | 0.0056 | <0.0001 |
| A × I | 4 | - | - | - | - | - |
| Replicate (A × I) | 10 | - | - | - | - | - |
| Aw × Sw | 5 | 0.1834 | 0.0415 | 0.6557 | 0.0300 | 0.0117 |
| I × Aw | 5 | 0.1018 | 0.3381 | 0.4640 | 0.0326 | 0.1337 |
| I × Sw | 1 | 0.5789 | 0.7092 | 0.2405 | 0.9036 | 0.9675 |
| I × Aw × Sw | 5 | 0.8171 | 0.9803 | 0.9884 | 0.9382 | 0.1071 |
| Residual Error | 220 | - | - | - | - | - |
| Total | 263 | - | - | - | - | - |
Table 11.
Summary of treatment means for spruce height (HT), root collar diameter (RCD), DBH, height: diameter ratio (HDR), slenderness (Slend.), crown width (CW), and height to live crown base (HTLC) by treatment at years 10, 20 and. Values within each row within each spruce density (Sw density) with different letters were found to be significantly (α = 0.05) different using Tukey’s test. The bolded values indicate cases where the two spruce densities should be examined separately due either to significant interactions between aspen and spruce densities (age 20 slenderness, age 28 DBH, CW, and HTLC) or significance of both spruce and aspen densities (age 20 DBH and CW, age 28 DBH, CW and HTLC). U represents the unthinned treatment. The standard deviation is indicated in parentheses.
| Sw Density = 500 | Sw Density = 1000 | Sw Density = Both | |||||||||||||||||
|---|---|---|---|---|---|---|---|---|---|---|---|---|---|---|---|---|---|---|---|
| Aspen Density (stems·ha−1) | Aspen Density (stems·ha−1) | Aspen Density (stems·ha−1) | |||||||||||||||||
| Var | Age | 0 | 200 | 500 | 1500 | 4000 | U | 0 | 200 | 500 | 1500 | 4000 | U | 0 | 200 | 500 | 1500 | 4000 | U |
| HT (m) | 10 | 1.49 ab (0.617) | 1.44 ab (0.550) | 1.49 ab (0.599) | 1.50 ab (0.635) | 1.53 a (0.529) | 1.34 b (0.553) | 1.41 ab (0.564) | 1.46 ab (0.575) | 1.45 ab (0.550) | 1.46 ab (0.532) | 1.48 a (0.531) | 1.37 b (0.549) | 1.45 ab (0.589) | 1.45 ab (0.559) | 1.47 ab (0.572) | 1.49 a (0.582) | 1.51 a (0.527) | 1.36 b (0.548) |
| HT (m) | 20 | 5.28 a (1.751) | 5.18 a (1.569) | 5.11 a (1.470) | 4.93 ab (1.776) | 4.57 b (1.623) | 3.54 c (1.469) | 4.97 ab (1.670) | 5.23 a (1.668) | 5.07 a (1.657) | 4.85 ab (1.593) | 4.51 ab (1.544) | 3.68 c (1.404) | 5.06 a (1.707) | 5.14 a (1.609) | 5.03 a (1.557) | 4.83 ab (1.677) | 4.48 b (1.575) | 3.54 c (1.430) |
| HT (m) | 28 | 8.41 a (2.083) | 7.91 ab (1.792) | 7.94 ab (1.728) | 7.22 bc (1.581) | 6.52 c (1.741) | 4.61 d (1.731) | 7.94 ab (1.687) | 8.27 a (1.491) | 7.83 ab (1.601) | 7.38 b (1.300) | 6.46 c (1.498) | 5.03 d (1.559) | 8.13 a (1.888) | 8.05 a (1.639) | 7.84 a (1.647) | 7.26 b (1.432) | 6.45 c (1.605) | 4.78 d (1.642) |
| RCD (cm) | 10 | 3.08 a (1.259) | 2.92 ab (1.114) | 2.78 abc (1.137) | 2.69 bc (1.153) | 2.45 c (0.902) | 2.04 d (0.827) | 2.93 a (1.146) | 2.92 a (1.078) | 2.81 a (1.092) | 2.73 a (1.023) | 2.46 b (0.987) | 1.99 c (0.771) | 3.04 a (1.199) | 2.95 ab (1.089) | 2.83 ab (1.108) | 2.74 b (1.083) | 2.48 c (0.940) | 2.05 d (0.795) |
| DBH (cm) | 20 | 8.72 a (3.540) | 8.07 ab (3.197) | 7.48 bc (2.978) | 6.75 c (3.000) | 5.60 d (2.572) | 3.83 e (1.662) | 7.76 a (3.070) | 7.76 ab (3.013) | 7.20 b (2.859) | 6.29 c (2.568) | 5.39 d (2.227) | 3.94 e (1.498) | 8.23 a (3.331) | 7.91 ab (3.093) | 7.34 b (2.905) | 6.51 c (2.788) | 5.49 d (2.301) | 3.88 e (1.572) |
| DBH (cm) | 28 | 15.68 a (3.854) | 13.53 ab (3.851) | 12.64 b (3.709) | 10.27 c (3.889) | 8.14 d (3.501) | 5.35 e (1.790) | 13.96 a (2.477) | 13.23 b (2.821) | 11.49 c (2.704) | 10.01 d (2.544) | 7.97 e (2.364) | 6.00 f (1.695) | 14.82 a (3.334) | 13.38 b (3.343) | 12.06 c (3.273) | 10.14 d (2.968) | 8.05 e (2.956) | 5.67 f (1.743) |
| HDR | 10 | 0.46 c (0.093) | 0.46 c (0.078) | 0.50 bc (0.073) | 0.52 b (0.079) | 0.58 a (0.104) | 0.62 a (0.114) | 0.45 e (0.071) | 0.47 de (0.078) | 0.48 d (0.074) | 0.52 c (0.092) | 0.57 b (0.071) | 0.62 a (0.118) | 0.45 e (0.082) | 0.46 de (0.078) | 0.49 d (0.074) | 0.52 c (0.085) | 0.57 b (0.089) | 0.62 a (0.115) |
| Slend. | 20 | 0.66 b (0.119) | 0.72 b (0.179) | 0.74 b (0.143) | 0.81 b (0.162) | 0.90 b (0.162) | 1.32 a (1.117) | 0.73 e (0.165) | 0.75 de (0.132) | 0.80 cd (0.163) | 0.92 bc (0.452) | 0.95 b (0.169) | 1.11 a (0.282) | 0.69 d (0.147) | 0.74 cd (0.157) | 0.77 bcd (0.154) | 0.86 bc (0.343) | 0.92 b (0.165) | 1.22 a (0.818) |
| Slend. | 28 | 0.55 c (0.062) | 0.65 bc (0.280) | 0.65 bc (0.097) | 0.78 ab (0.341) | 0.83 ab (0.144) | 0.97 a (0.315) | 0.58 d (0.049) | 0.65 cd (0.069) | 0.72 bc (0.102) | 0.76 b (0.095) | 0.84 ab (0.117) | 0.92 a (0.170) | 0.56 e (0.057) | 0.65 de (0.202) | 0.68 cd (0.103) | 0.77 bc (0.248) | 0.83 b (0.130) | 0.94 a (0.252) |
| CW | 10 | 0.47 (0.103) | 0.45 (0.094) | 0.47 (0.118) | 0.46 (0.117) | 0.47 (0.097) | 0.42 (0.114) | 0.45 (0.103) | 0.45 (0.106) | 0.44 (0.099) | 0.45 (0.109) | 0.45 (0.090) | 0.43 (0.098) | 0.46 (0.103) | 0.45 (0.099) | 0.46 (0.109) | 0.45 (0.112) | 0.46 (0.093) | 0.43 (0.105) |
| CW | 20 | 1.21 a (0.297) | 1.18 a (0.319) | 1.14 ab (0.279) | 1.12 ab (0.317) | 1.03 b (0.278) | 0.78 c (0.256) | 1.08 a (0.280) | 1.13 a (0.292) | 1.09 a (0.288) | 1.05 ab (0.269) | 0.98 b (0.227) | 0.81 c (0.211) | 1.15 a (0.295) | 1.15 a (0.305) | 1.12 a (0.283) | 1.09 a (0.295) | 1.00 b (0.253) | 0.80 c (0.235) |
| CW | 28 | 1.90 a (0.275) | 1.74 ab (0.320) | 1.64 b (0.248) | 1.53 b (0.323) | 1.28 c (0.307) | 1.02 d (0.315) | 1.67 a (0.247) | 1.66 ab (0.191) | 1.60 b (0.271) | 1.44 c (0.276) | 1.27 d (0.239) | 1.07 e (0.248) | 1.79 a (0.285) | 1.7 ab (0.264) | 1.62 b (0.258) | 1.48 c (0.301) | 1.28 d (0.272) | 1.04 e (0.269) |
| HTLC (m) | 10 | 0.28 (0.128) | 0.27 (0.112) | 0.27 (0.114) | 0.27 (0.131) | 0.28 (0.108) | 0.29 (0.105) | 0.28 (0.115) | 0.30 (0.156) | 0.30 (0.114) | 0.29 (0.108) | 0.31 (0.103) | 0.32 (0.100) | 0.29 (0.121) | 0.30 (0.135) | 0.30 (0.113) | 0.29 (0.119) | 0.31 (0.105) | 0.32 (0.101) |
| HTLC (m) | 20 | 0.53 (0.217) | 0.52 (0.216) | 0.51 (0.199) | 0.53 (0.217) | 0.55 (0.201) | 0.60 (0.229) | 0.49 c (0.202) | 0.52 c (0.221) | 0.56 bc (0.236) | 0.55 bc (0.257) | 0.62 ab (0.264) | 0.66 a (0.214) | 0.51 c (0.209) | 0.52 c (0.217) | 0.54 bc (0.218) | 0.54 bc (0.236) | 0.59 ab (0.235) | 0.63 a (0.221) |
| HTLC (m) | 28 | 0.96 (0.522) | 0.88 (0.332) | 0.91 (0.296) | 0.97 (0.367) | 0.95 (0.307) | 0.89 (0.342) | 1.10 ab (0.435) | 1.23 a (0.419) | 1.13 a (0.409) | 1.03 b (0.324) | 1.00 b (0.379) | 0.99 b (0.376) | 1.03 (0.481) | 1.06 (0.417) | 1.02 (0.372) | 1.00 (0.344) | 0.97 (0.342) | 0.94 (0.360) |
Table 12.
Parameter estimates for non-linear models describing MGM-based volume-age trends for the 15 treatments. The modified non-linear Chapman-Richards model fit using SAS Proc NLIN was: Vol = a × ageb × exp(−a × age + c × SI). SI was defined separately for each species. Parameters were significantly different from 0 (p < 0.01) in all cases except for spruce site index (c) in plot 6. ns indicates a non-significant parameter.
| Spruce | Aspen | |||||||
|---|---|---|---|---|---|---|---|---|
| PLOT | Aspen Density (stems·ha−1) | Spruce Density (stems·ha−1) | a | b | c | a | b | c |
| 1 | 0 | 1000 | 0.013406 | 2.103442 | 0.069621 | |||
| 2 | 200 | 1000 | 0.013013 | 2.055303 | 0.075101 | 0.024172 | 1.692271 | 0.107603 |
| 3 | 500 | 1000 | 0.012498 | 1.988504 | 0.083878 | 0.024681 | 1.925144 | 0.096546 |
| 4 | 1500 | 1000 | 0.011594 | 1.888494 | 0.094996 | 0.025084 | 2.062146 | 0.096351 |
| 5 | 4000 | 1000 | 0.010323 | 1.760039 | 0.113647 | 0.025401 | 2.106533 | 0.097945 |
| 6 | unthinned | 1000 | 0.013565 | 2.226961 | 0.006931 ns | 0.025652 | 2.182628 | 0.081048 |
| 7 | 0 | 500 | 0.011652 | 1.937034 | 0.083284 | |||
| 8 | 200 | 500 | 0.011242 | 1.909724 | 0.083304 | 0.024831 | 1.744878 | 0.099654 |
| 9 | 500 | 500 | 0.011176 | 1.908504 | 0.077902 | 0.025498 | 1.978808 | 0.08919 |
| 10 | 1500 | 500 | 0.009829 | 1.751954 | 0.100082 | 0.02438 | 1.996066 | 0.108543 |
| 11 | 4000 | 500 | 0.008973 | 1.703911 | 0.098421 | 0.027075 | 2.251298 | 0.07519 |
| 12 | unthinned | 500 | 0.008933 | 1.714591 | 0.090917 | 0.025794 | 2.304432 | 0.059599 |
| 13 | 1500 | 0 | 0.026231 | 2.280332 | 0.06079 | |||
| 14 | 4000 | 0 | 0.027682 | 2.434509 | 0.043261 | |||
| 15 | unthinned | 0 | 0.025888 | 2.364609 | 0.053273 | |||
Table 13.
Effects of aspen and spruce densities on aspen, spruce, stand volume, and MAI at age 90 estimated using MGM21. Values within each row with different letters were found to be significantly (α = 0.05) different using Tukey’s test. The standard deviation is indicated in parentheses.
Table 13.
Effects of aspen and spruce densities on aspen, spruce, stand volume, and MAI at age 90 estimated using MGM21. Values within each row with different letters were found to be significantly (α = 0.05) different using Tukey’s test. The standard deviation is indicated in parentheses.
| Species | Sw Density (stems·ha−1) | Volume (m3 ha−1) | MAI (m3 ha−1 y−1) | ||||||||||
|---|---|---|---|---|---|---|---|---|---|---|---|---|---|
| Aspen Density (stems·ha−1) | Aspen Density (stems·ha−1) | ||||||||||||
| 0 | 200 | 500 | 1500 | 4000 | U | 0 | 200 | 500 | 1500 | 4000 | U | ||
| Spruce | 0 | - | - | - | - | - | - | - | - | - | - | - | - |
| 500 | 132.4 a (59.89) | 117.0 b (52.69) | 103.8 c (47.14) | 79.5 d (45.37) | 60.6 e (38.84) | 54.9 f (36.14) | 1.47 a (0.665) | 1.30 b (0.585) | 1.15 b (0.524) | 0.88 c (0.504) | 0.67 d (0.432) | 0.61 d (0.402) | |
| 1000 | 208.8 a (80.20) | 188.2 ab (76.08) | 167.0 b (77.03) | 133.4 c (65.55) | 109.6 cd (70.91) | 103.5 d (75.63) | 2.32 a (0.891) | 2.09 ab (0.845) | 1.86 b (0.856) | 1.48 c (0.728) | 1.22 cd (0.788) | 1.15 d (0.840) | |
| All | 170.6 a (80.23) | 152.6 ab (74.33) | 135.4 b (71.05) | 106.5 c (72.03) | 85.1 d (65.00) | 79.2 d (64.48) | 1.90 a (0.891) | 1.70 ab (0.826) | 1.50 b (0.789) | 1.18 c (0.800) | 0.95 d (0.722) | 0.88 d (0.716) | |
| Aspen | 0 | - | - | - | 266.0 b (75.74) | 325.1 a (69.01) | 320.5 a (83.51) | - | - | - | 2.96 b (0.842) | 3.61 a (0.023) | 3.56 a (0.928) |
| 500 | - | 72.7 d (40.57) | 145.1 c (65.13) | 242.2 b (95.37) | 303.6 a (86.44) | 285.2 a (111.38) | - | 0.81 d (0.451) | 1.61 c (0.724) | 2.69 b (1.060) | 3.37 a (0.960) | 3.17 a (1.238) | |
| 1000 | - | 69.4 d (43.11) | 141.5 c (66.31) | 237.8 b (99.59) | 286.1 a (100.61) | 269.6 ab (115.21) | - | 0.77 d (0.479) | 1.57 c (0.737) | 2.64 b (1.107) | 3.18 a (1.118) | 3.00 ab (1.280) | |
| All | - | 70.7 d (41.62) | 142.9 c (65.33) | 249.1 b (91.10) | 305.3 a (87.48) | 290.2 a (106.12) | - | 0.79 d (0.462) | 1.59 c (0.726) | 2.77 b (1.012) | 3.39 a (0.972) | 3.22 a (1.179) | |
| Stand | 0 | - | - | - | 266.0 b (75.74) | 325.1 a (69.01) | 320.5 a (83.51) | - | - | - | 2.96 b (0.842) | 3.62 a (0.023) | 3.56 a (0.928) |
| 500 | 132.4 e (59.89) | 189.9 d (58.90) | 249.1 c (62.85) | 321.9 b (83.09) | 364.4 a (67.73) | 340.4 ab (95.28) | 1.49 e (0.665) | 2.11 d (0.654) | 2.77 c (0.698) | 3.58 b (0.923) | 4.05 a (0.752) | 3.78 ab (1.059) | |
| 1000 | 208.8.6 d (80.20) | 259.2 c (78.79) | 310.0 b (78.24) | 372.8 a (86.25) | 397.3 a (65.83) | 374.6 a (95.28) | 2.35 d (0.891) | 2.88 c (0.875) | 3.44 b (0.869) | 4.14 a (0.958) | 4.41 a (0.731) | 4.16 a (1.030) | |
| All | 170.6 e (80.23) | 224.2 d (77.33) | 279.2 c (76.81) | 320.5 b (91.77) | 362.6 a (72.55) | 344.4 a (92.67) | 1.90 e (0.891) | 2.49 d (0.859) | 3.10 c (0.853) | 3.56 b (1.020) | 4.03 a (0.806) | 3.83 a (1.030) | |
Table 14.
Effects of aspen and spruce densities on aspen and spruce stemwood biomass and stemwood carbon at age 90 estimated using MGM21 (note that values represent total aboveground stemwood biomass and do not include bark). Calculation of carbon from biomass was based on a conversion from biomass to carbon using values of 0.4709 and 0.5039 for trembling aspen and white spruce, respectively, from Lamlon and Savidge [44]. Values within each row with different letters were found to be significantly (α = 0.05) different using Tukey’s test. The standard deviation is indicated in parentheses.
| Species | Sw Density (stems·ha−1) | Stemwood Biomass (tonnes.ha−1) | Stemwood Carbon (tonnes.ha−1) | ||||||||||
|---|---|---|---|---|---|---|---|---|---|---|---|---|---|
| Aspen Density (stems·ha−1) | Aspen Density (stems·ha−1) | ||||||||||||
| 0 | 200 | 500 | 1500 | 4000 | U | 0 | 200 | 500 | 1500 | 4000 | U | ||
| Spruce | 0 | - | - | - | - | - | - | - | - | - | - | - | - |
| 500 | 40.5 a (17.11) | 36.0 bc (14.95) | 32.1 c (13.77) | 24.5 d (13.17) | 18.6 e (11.42) | 16.9 e (10.46) | 20.4 a (8.62) | 18.1 bc (7.53) | 16.2 c (6.94) | 12.3 d (6.64) | 9.4 e (5.76) | 8.5 e (5.27) | |
| 1000 | 63.6 a (22.20) | 57.5 ab (21.11) | 51.1 b (21.64) | 40.9 c (18.45) | 33.5 cd (20.54) | 32.2 d (26.07) | 32.0 an (11.18) | 29.0 ab (10.64) | 25.8 b (10.90) | 20.6 c (9.30) | 16.9 cd (10.35) | 16.2 d (13.14) | |
| Aspen | 0 | - | - | - | 100.6 b (28.78) | 122.1 a (26.67) | 118.0 a (31.41) | - | - | - | 47.4 b (13.55) | 57.5 a (12.56) | 55.6 a (14.79) |
| 500 | - | 30.1 d (16.58) | 57.3 c (25.72) | 91.9 b (36.06) | 114.1 a (33.64) | 103.9 ab (41.22) | - | 14.2 d (7.81) | 27.0 c (12.11) | 43.3 b (16.98) | 53.7 a (15.84) | 48.9 ab (19.41) | |
| 1000 | - | 28.6 d (17.78) | 56.0 c (25.94) | 90.1 b (37.92) | 106.3 a (36.94) | 98.7 ab (41.22) | 13.5 d (8.37) | 26.4 c (12.22) | 42.4 b (17.86) | 50.1 a (17.39) | 46.5 ab (19.91) | ||
| Stand Total | 0 | - | - | - | 100.6 b (28.78) | 122.1 a (26.67) | 118.0 a (31.41) | - | - | - | 47.4 b (13.55) | 57.5 a (12.56) | 55.6 a (14.79) |
| 500 | 40.5 e (17.11) | 66.2 d (19.54) | 89.5 c (23.21) | 116.4 b (31.53) | 132.8 a (27.79) | 120.8 ab (35.85) | 20.4 e (8.62) | 32.4 d (9.49) | 43.2 c (10.98) | 55.6 b (14.79) | 63.2 a (12.96) | 57.5 b (16.75) | |
| 1000 | 63.6 d (22.20) | 86.6 c (24.19) | 107.6 b (25.68) | 131.5 a (32.42) | 140.4 a (25.49) | 131.4 a (35.53) | 32.0 d (11.18) | 42.7 c (11.89) | 52.4 b (12.40) | 63.3 a (12.52) | 67.2 a (11.83) | 63.0 a (16.82) | |
Disclaimer/Publisher’s Note: The statements, opinions and data contained in all publications are solely those of the individual author(s) and contributor(s) and not of MDPI and/or the editor(s). MDPI and/or the editor(s) disclaim responsibility for any injury to people or property resulting from any ideas, methods, instructions or products referred to in the content. |
© 2024 by the authors. Licensee MDPI, Basel, Switzerland. This article is an open access article distributed under the terms and conditions of the Creative Commons Attribution (CC BY) license (https://creativecommons.org/licenses/by/4.0/).
Share and Cite
MDPI and ACS Style
Comeau, P.G.; Bokalo, M. Aspen and Spruce Densities Affect Tree Size, Future Stand Volume, and Aboveground Carbon Following Precommercial Thinning. Forests 2024, 15, 223. https://doi.org/10.3390/f15020223
AMA Style
Comeau PG, Bokalo M. Aspen and Spruce Densities Affect Tree Size, Future Stand Volume, and Aboveground Carbon Following Precommercial Thinning. Forests. 2024; 15(2):223. https://doi.org/10.3390/f15020223
Chicago/Turabian StyleComeau, Philip G., and Mike Bokalo. 2024. "Aspen and Spruce Densities Affect Tree Size, Future Stand Volume, and Aboveground Carbon Following Precommercial Thinning" Forests 15, no. 2: 223. https://doi.org/10.3390/f15020223
Note that from the first issue of 2016, this journal uses article numbers instead of page numbers. See further details here.