
Influence of BRDF Models and Solar Zenith Angles on Forest Above-Ground Biomass Derived from MODIS Multi-Angular Indices

 , ,
, ,  , , and
Abstract
:1. Introduction
2. Materials
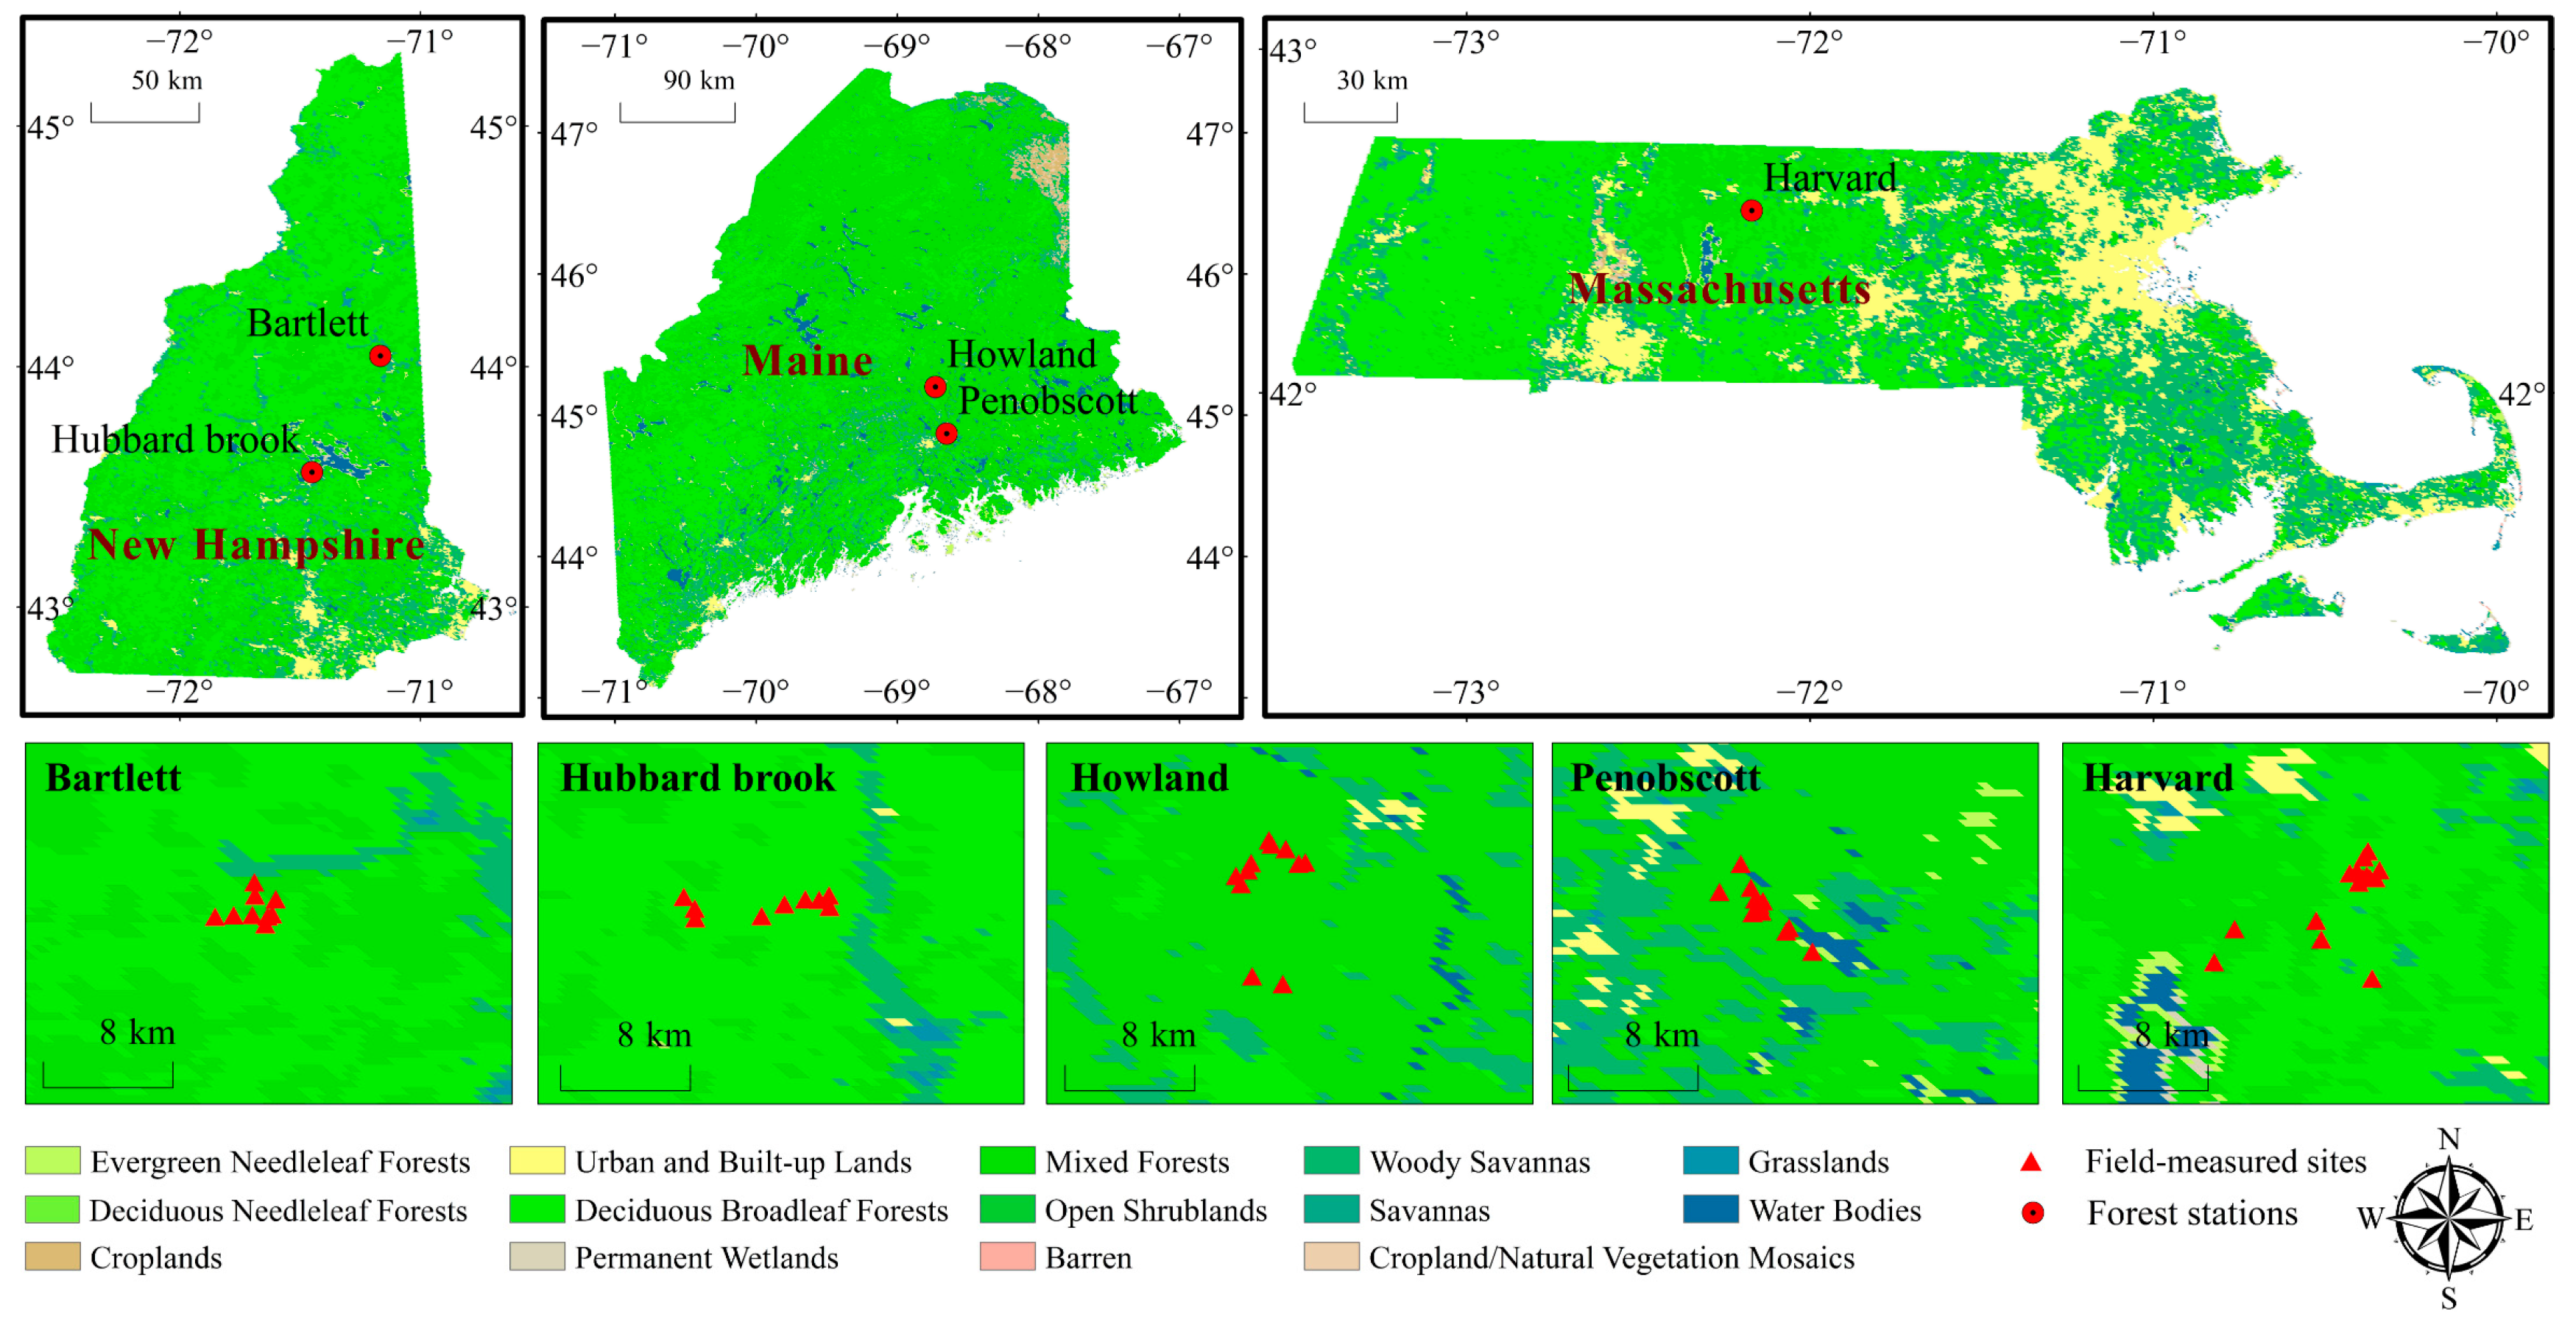
2.1. Study Sites
2.2. Field-Measured Biomass Data
2.3. MODIS BRDF Data
2.4. Landsat Surface Reflectance Data
2.5. SRTM Data
3. Methods
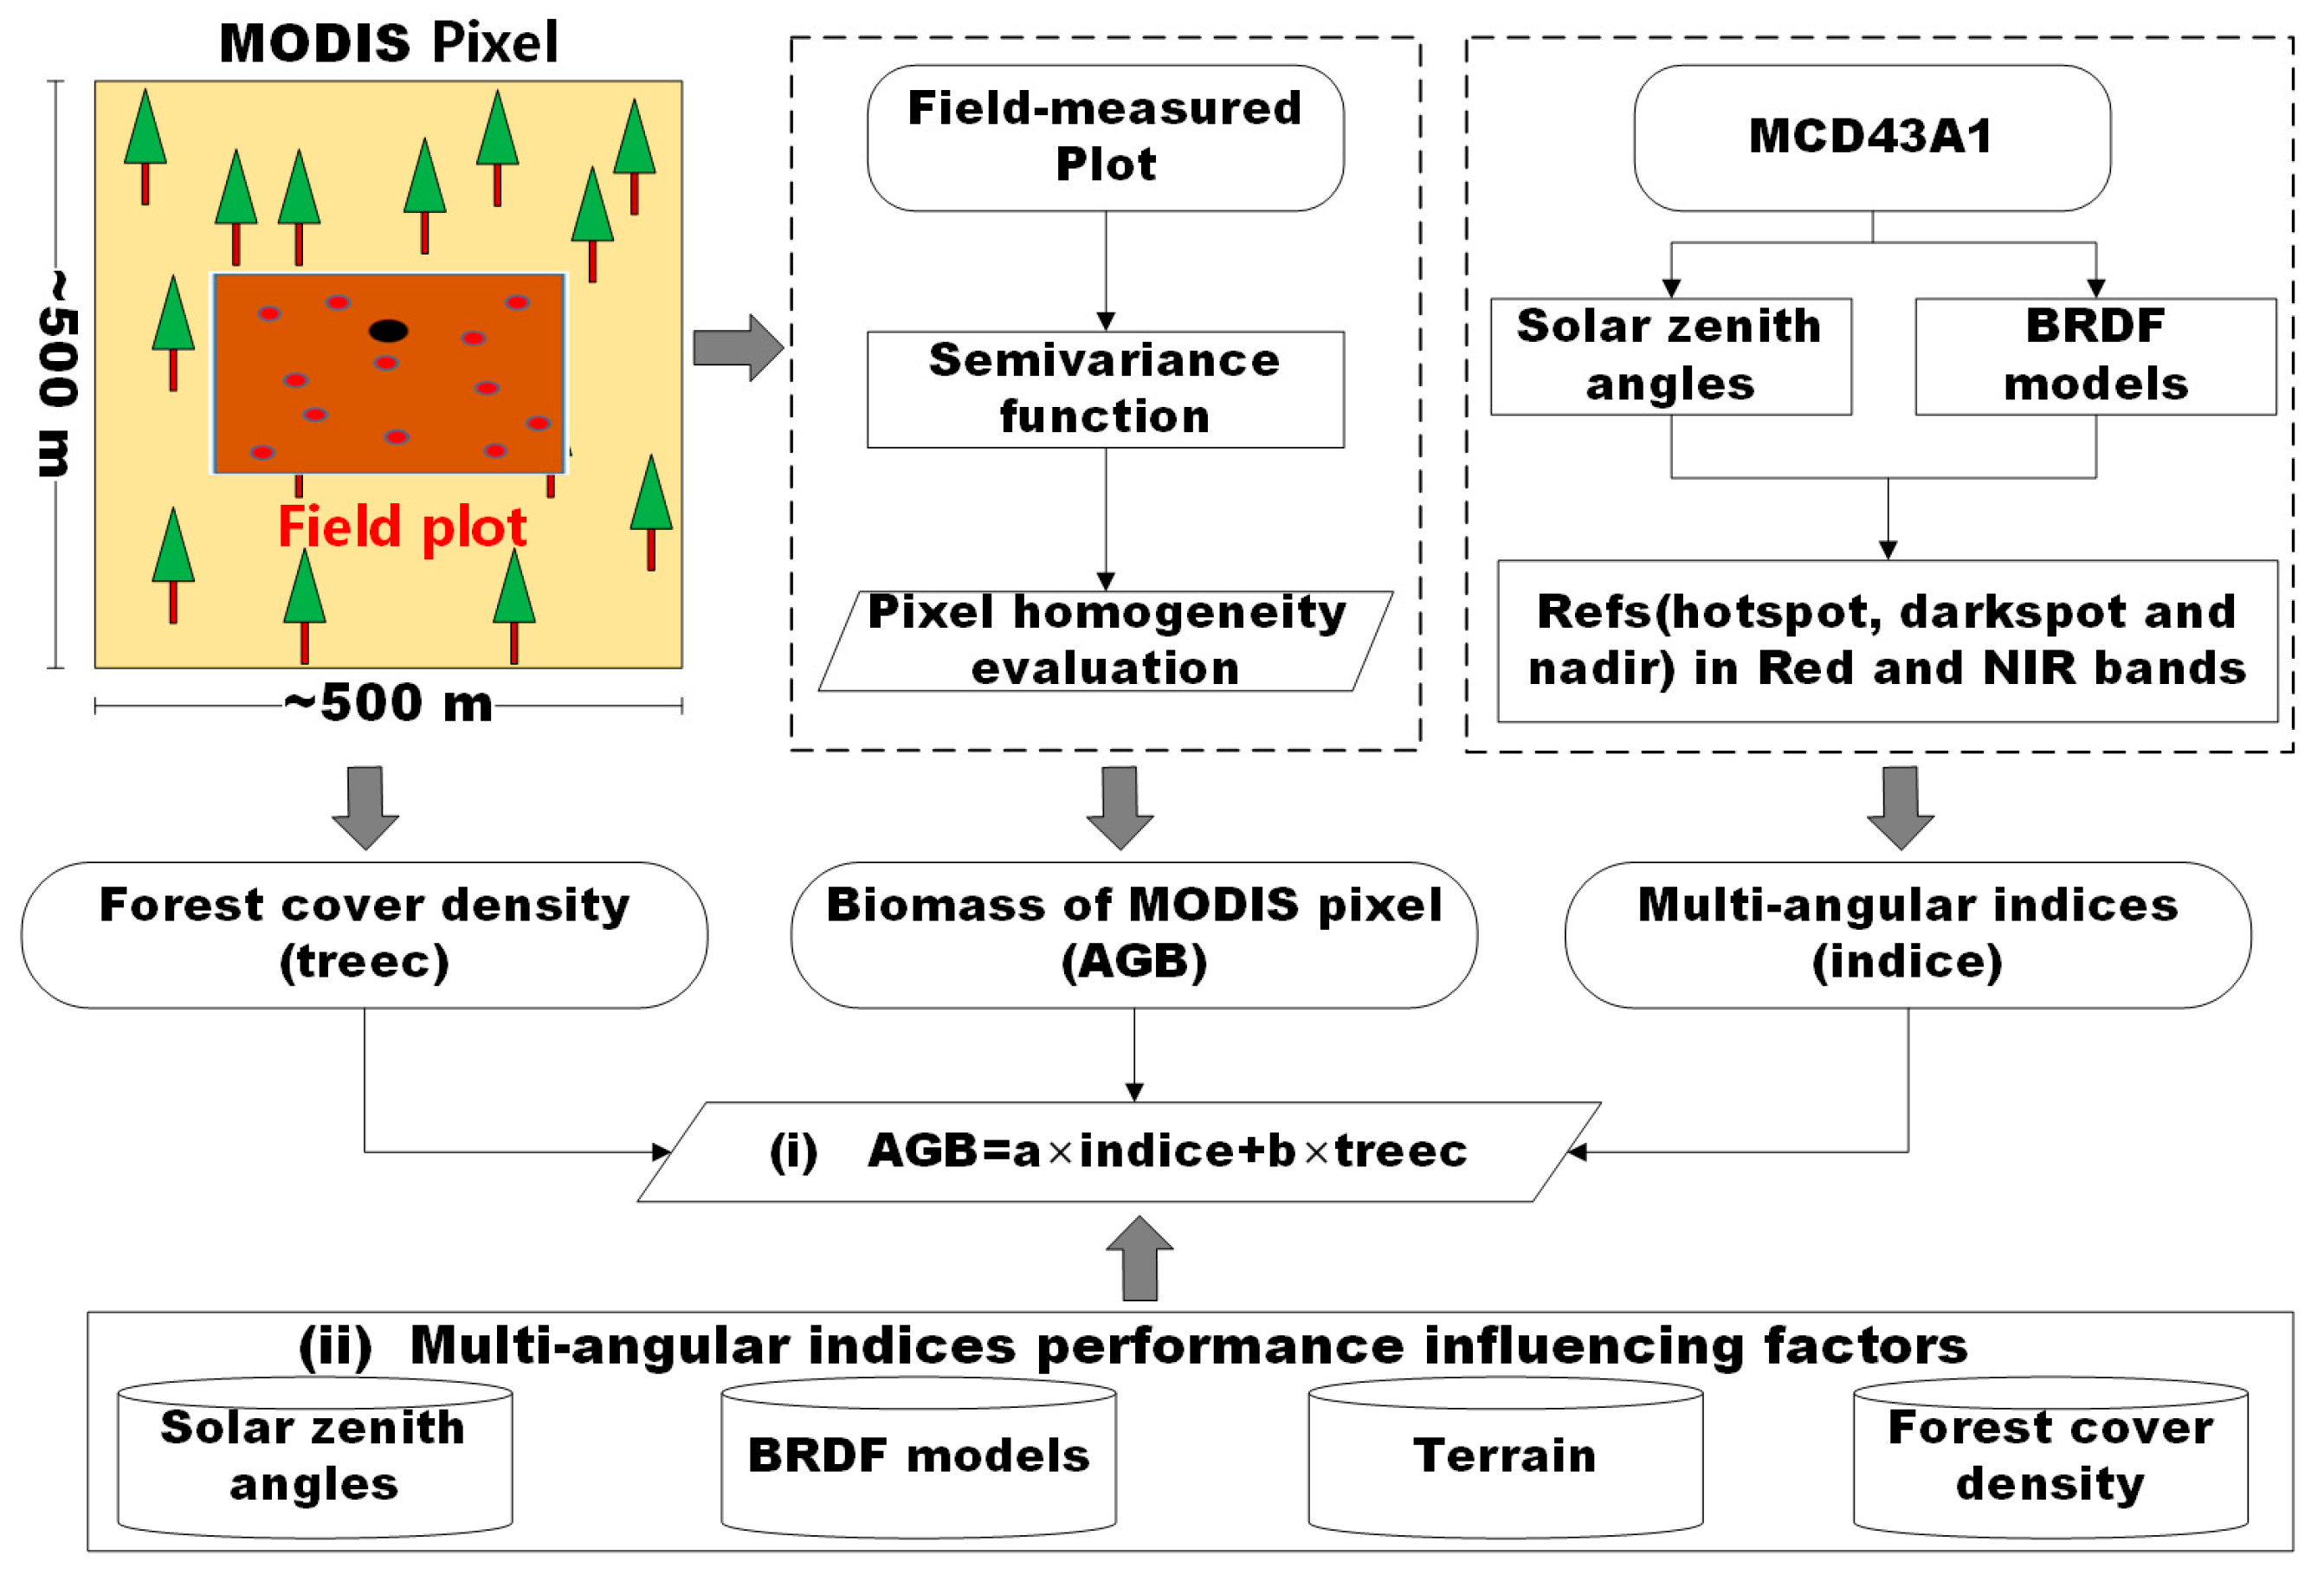
3.1. Calculation of the Typical-Angular Reflectances
3.2. Definition of Forest Cover Information of the MODIS Pixel
3.3. Accuracy Validation
4. Results
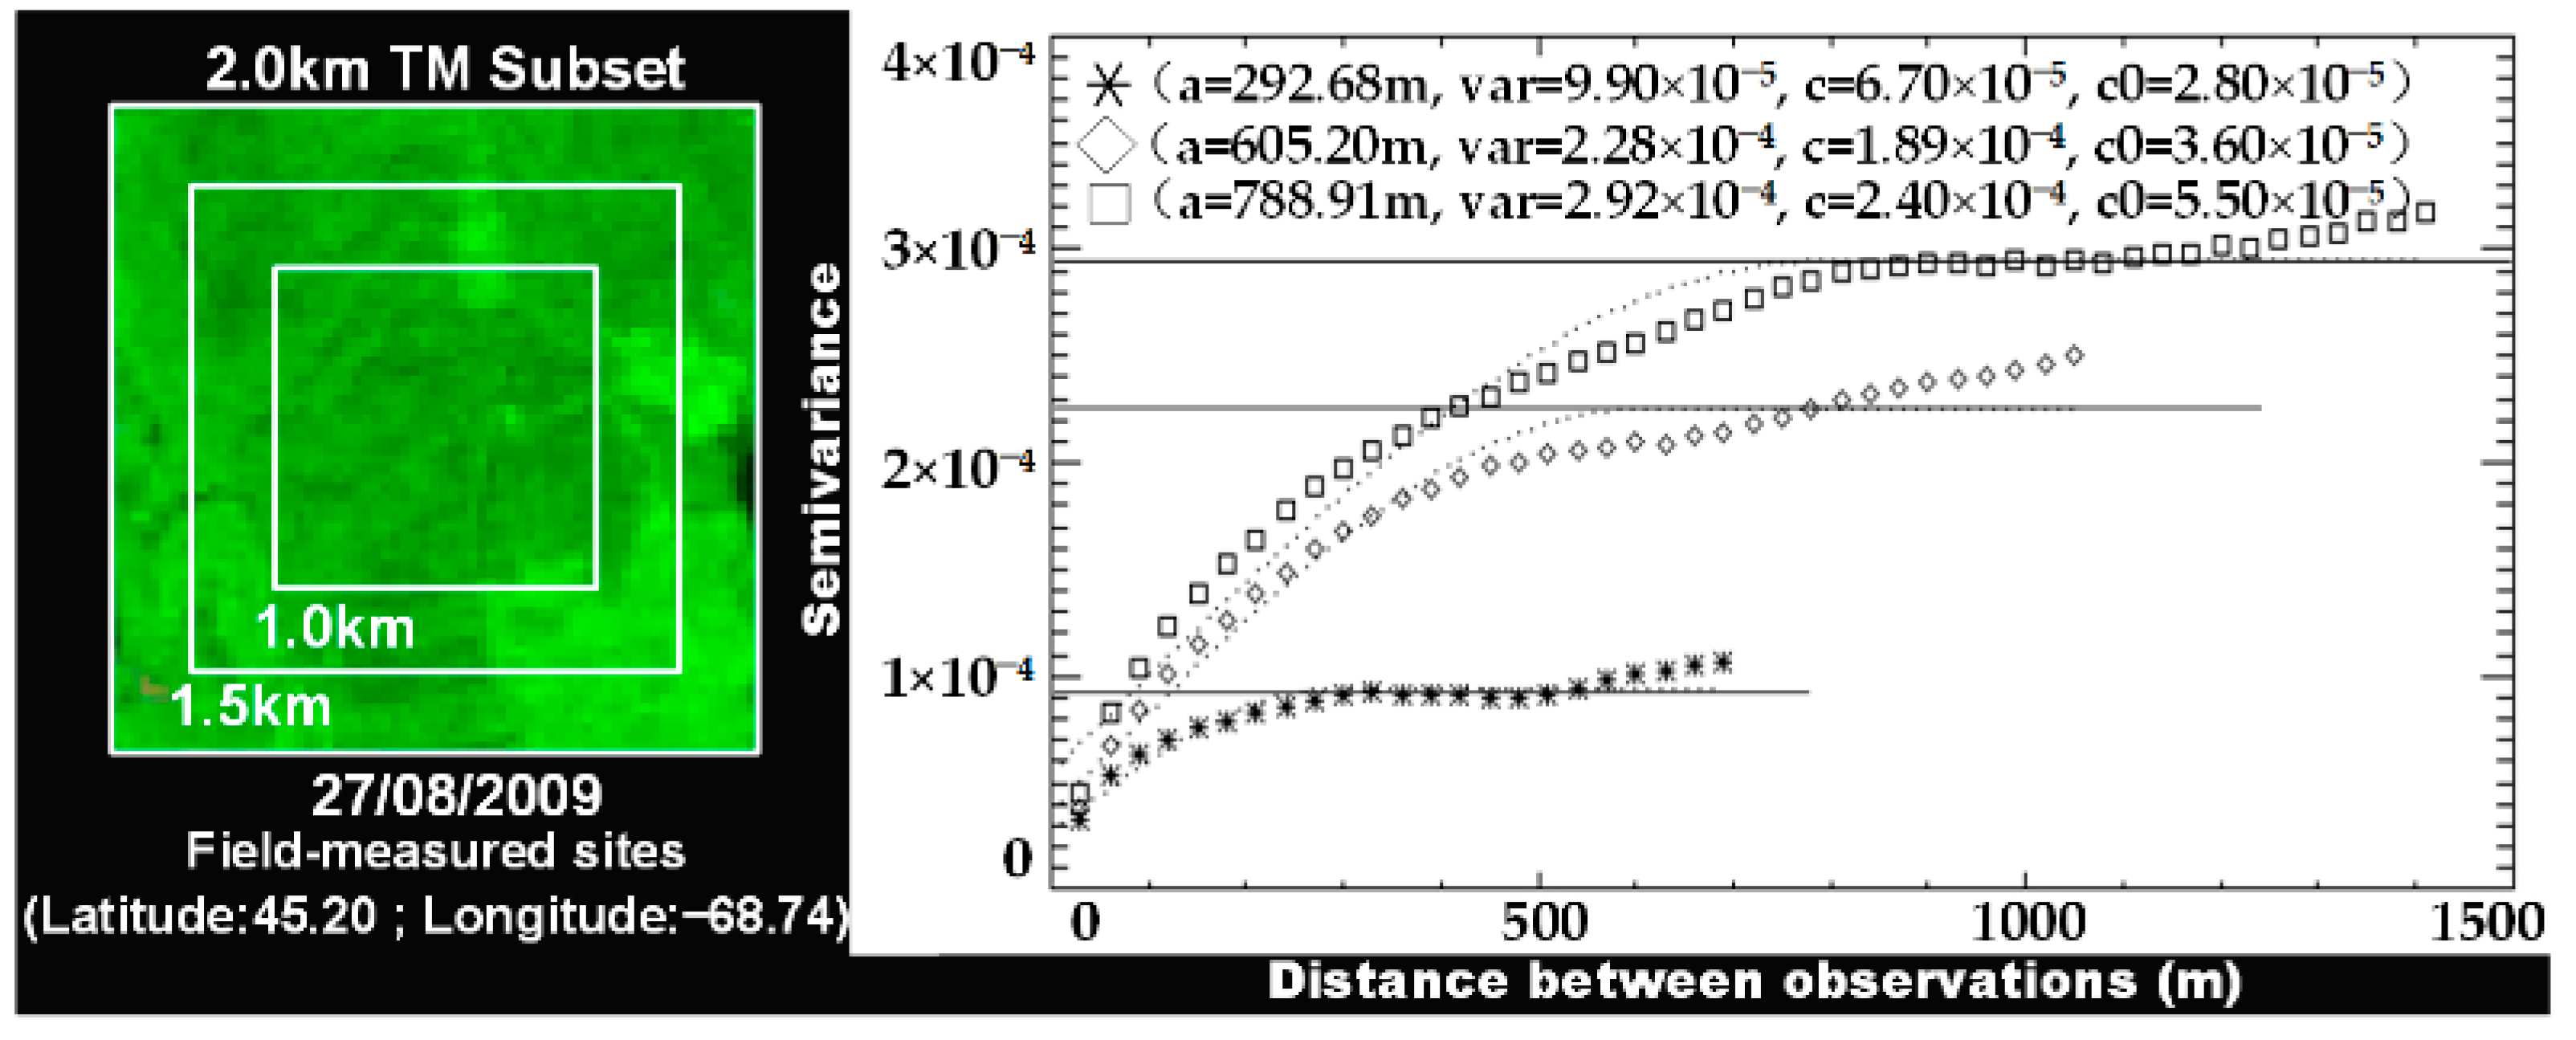
4.1. Influence of Pixel Homogeneity and Terrain on Using MODIS Multi-Angular Indices for Forest AGB Estimation
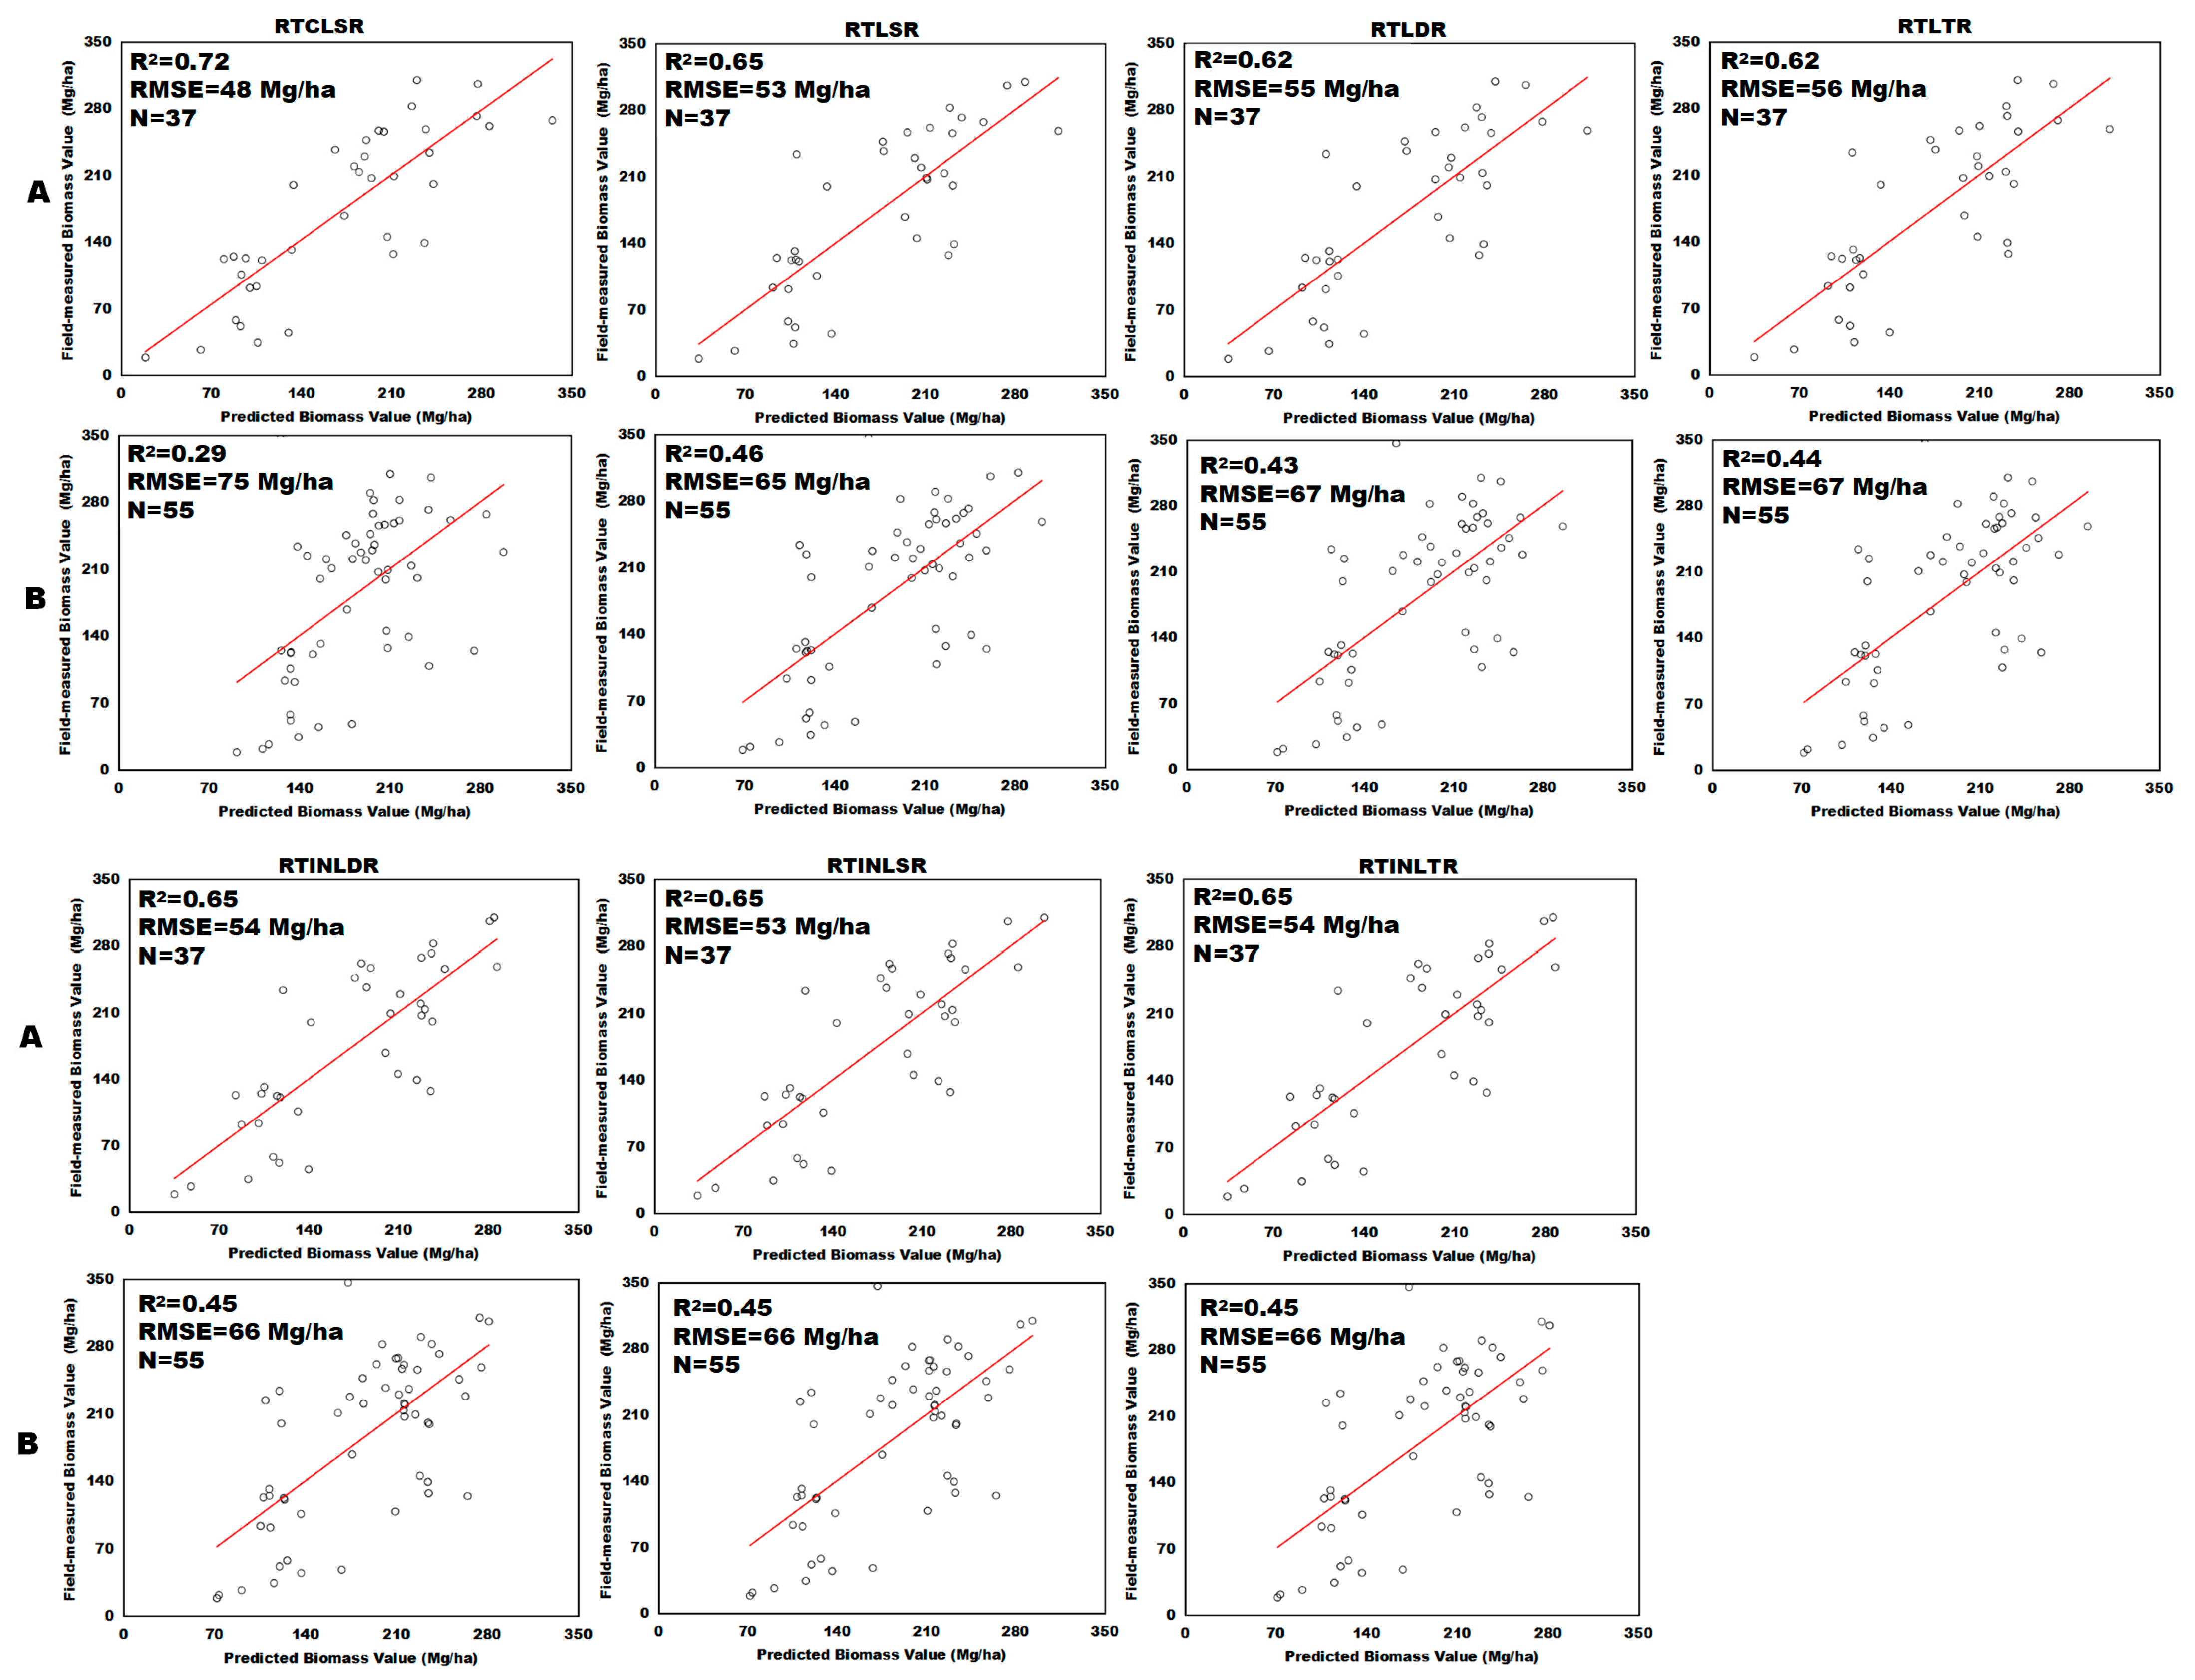
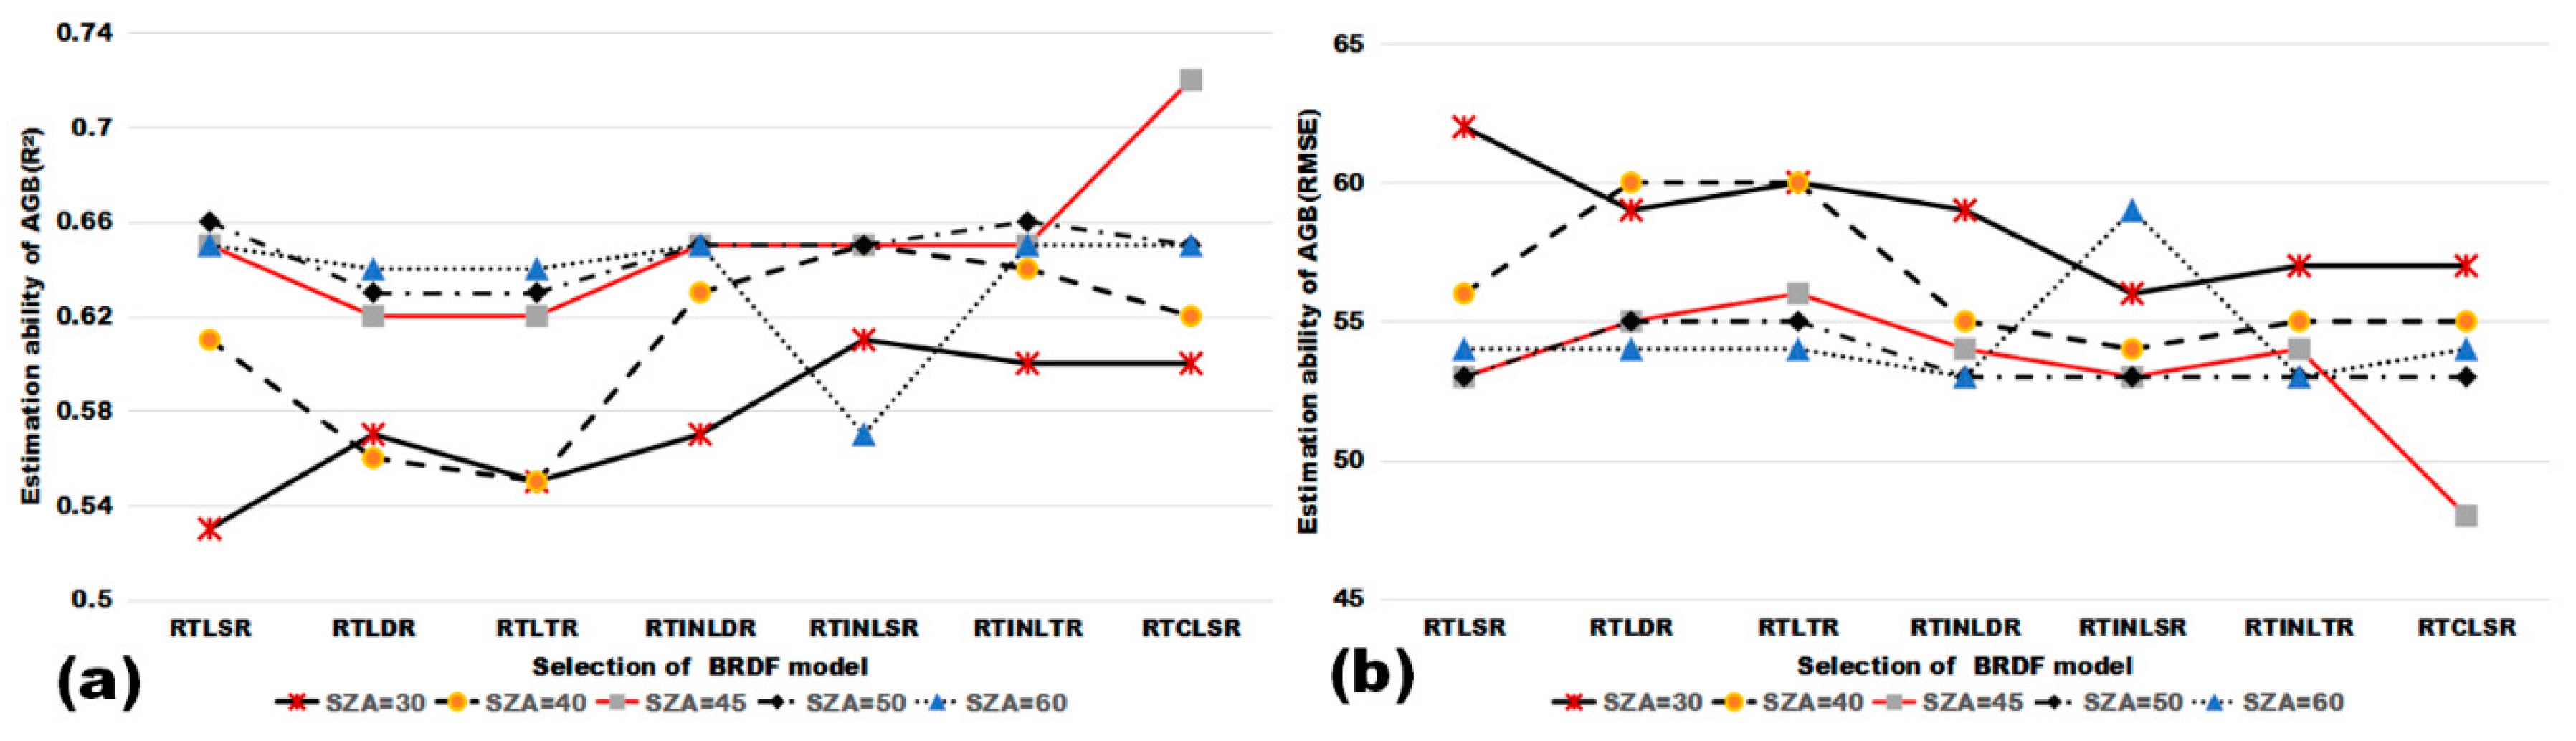
4.2. Influence of BRDF Models on Using MODIS Multi-Angular Indices for Forest AGB Estimation
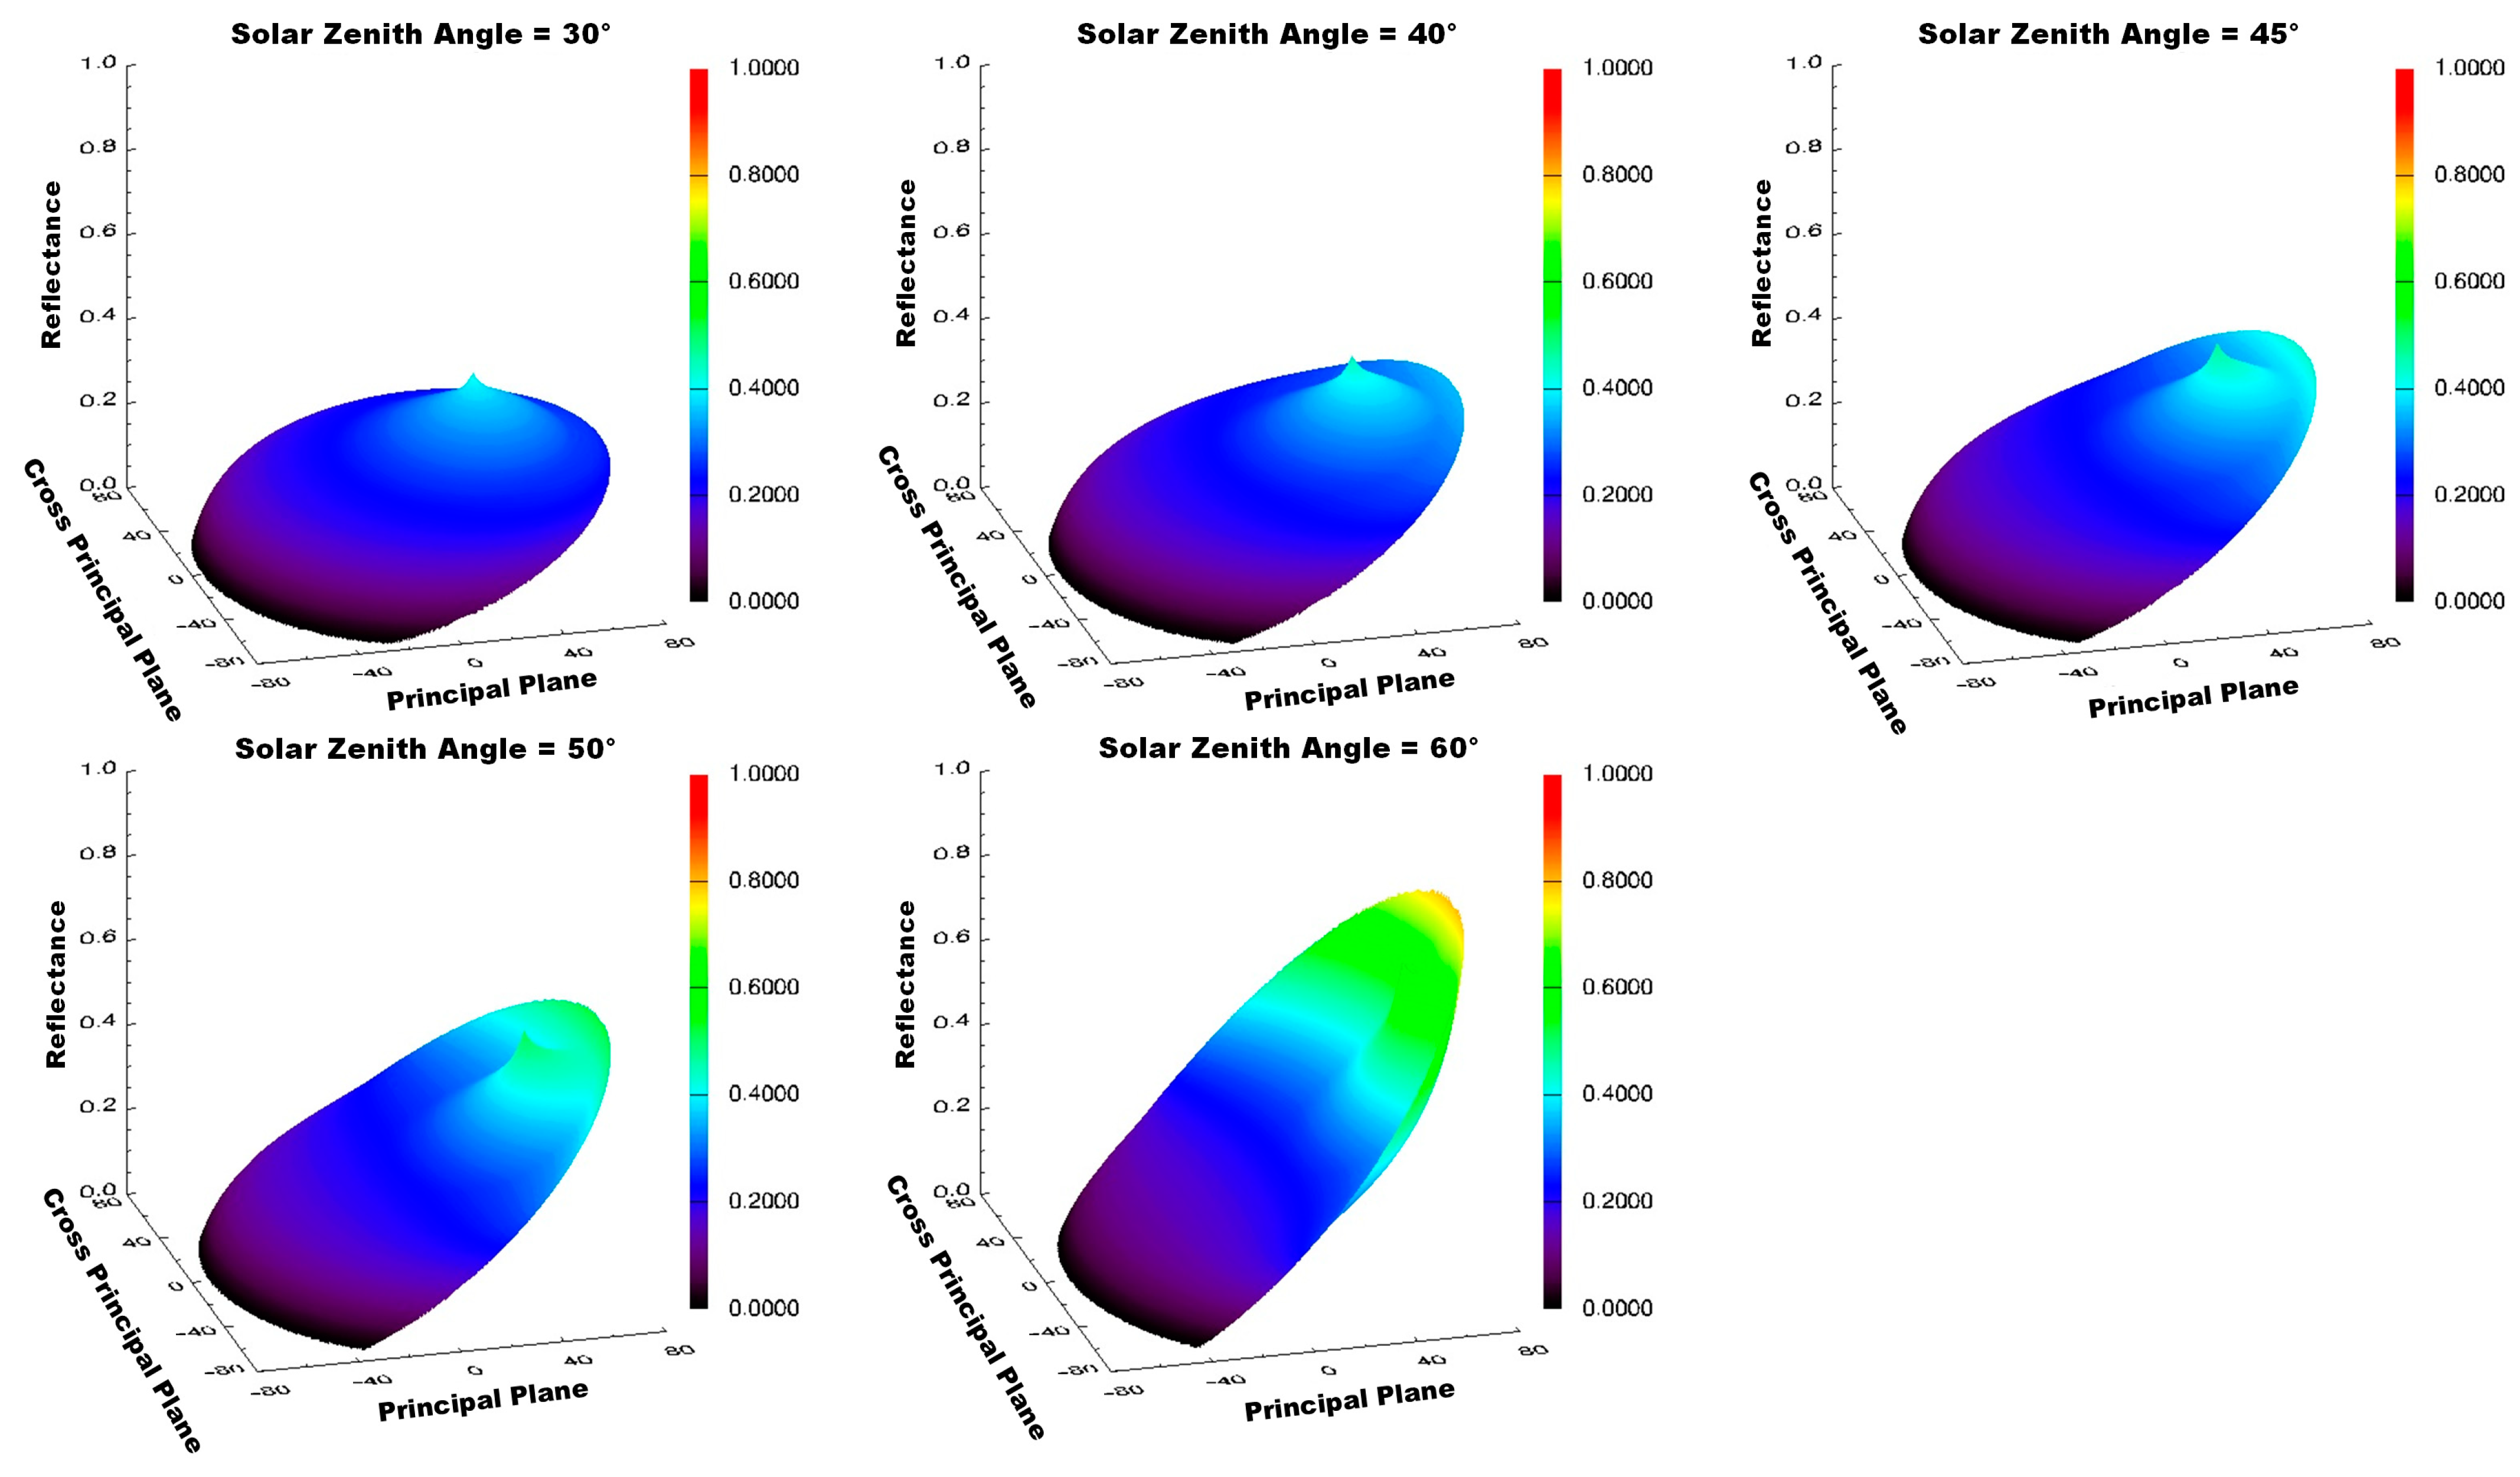
4.3. Influence of Solar Zenith Angle on Using MODIS Multi-Angular Indices for Forest AGB Estimation
5. Discussion
6. Conclusions
Author Contributions
Funding
Data Availability Statement
Acknowledgments
Conflicts of Interest
Appendix A

| Forest | Location | Time | Composition of Biomass | Biomass (Mg ha−1) | ||
|---|---|---|---|---|---|---|
| Latitude (°) | Longitude (°) | Dead Tree Counts | Live Tree Counts | |||
| Barttle | 44.053185 | −71.310543 | 11 July 2009 | 75 | 648 | 200.59 |
| Barttle | 44.054021 | −71.300303 | 13 July 2009 | 17 | 648 | 229.44 |
| Barttle | 44.054162 | −71.289812 | 12 July 2009 | 82 | 800 | 255.46 |
| Harvard | 42.534074 | −72.182013 | 25 June 2009 | 179 | 936 | 305.44 |
| Harvard | 42.536547 | −72.175841 | 24 July 2009 | 55 | 785 | 139.03 |
| Harvard | 42.538096 | −72.177597 | 27 July 2009 | 63 | 753 | 208.88 |
| Harvard | 42.536557 | −72.172724 | 23 July 2009 | 24 | 475 | 256.43 |
| Harvard | 42.536516 | −72.179817 | 14 July 2009 | 27 | 551 | 271.89 |
| Harvard | 42.540983 | −72.170486 | 28 July 2009 | 66 | 702 | 219.34 |
| Harvard | 42.540467 | −72.183034 | 16 July 2009 | 61 | 817 | 127.38 |
| Harvard | 42.539223 | −72.187066 | 17 July 2009 | 70 | 834 | 282.08 |
| Harvard | 42.551416 | −72.176897 | 26 July 2009 | 22 | 359 | 145.36 |
| Harvard | 42.480697 | −72.174601 | 25 July 2009 | 83 | 763 | 206.87 |
| Harvard | 42.508234 | −72.250973 | 27 July 2009 | 77 | 612 | 309.28 |
| Harvard | 42.512857 | −72.205741 | 25 July 2009 | 20 | 520 | 236.60 |
| Howland | 45.22755 | −68.725911 | 20 August 2009 | 12 | 242 | 26.83 |
| Howland | 45.225188 | −68.724381 | 24 August 2009 | 26 | 629 | 34.39 |
| Howland | 45.222658 | −68.716496 | 25 August 2009 | 42 | 571 | 91.87 |
| Howland | 45.214881 | −68.735791 | 24 August 2009 | 18 | 432 | 57.80 |
| Howland | 45.214646 | −68.709366 | 26 August 2009 | 0 | 148 | 18.65 |
| Howland | 45.210844 | −68.737554 | 19 August 2009 | 14 | 541 | 105.80 |
| Howland | 45.203327 | −68.741371 | 19 August 2009 | 76 | 1212 | 167.57 |
| Howland | 45.152076 | −68.735178 | 27 August 2009 | 35 | 687 | 131.73 |
| Howland | 45.147732 | −68.718229 | 27 August 2009 | 30 | 677 | 122.98 |
| Hubbard Brook | 43.936143 | −71.741518 | 22 July 2009 | 52 | 614 | 267.26 |
| Hubbard Brook | 43.940344 | −71.778636 | 20 July 2009 | 57 | 833 | 261.25 |
| Hubbard Brook | 43.945148 | −71.709622 | 27 July 2009 | 97 | 850 | 257.82 |
| Hubbard Brook | 43.941246 | −71.703841 | 18 July 2009 | 63 | 628 | 246.54 |
| Hubbard Brook | 43.947527 | −71.704189 | 24 July 2009 | 60 | 618 | 213.38 |
| Penobscot | 44.871236 | −68.626076 | 25 August 2009 | 97 | 687 | 233.43 |
| Penobscot | 44.858001 | −68.620421 | 24 August 2009 | 12 | 886 | 44.76 |
| Penobscot | 44.851611 | −68.618074 | 18 August 2009 | 17 | 484 | 124.65 |
| Penobscot | 44.850592 | −68.613788 | 19 August 2009 | 29 | 604 | 51.60 |
| Penobscot | 44.848417 | −68.615501 | 19 August 2009 | 13 | 491 | 122.27 |
| Penobscot | 44.84406 | −68.619475 | 20 August 2009 | 19 | 672 | 120.84 |
| Penobscot | 44.844779 | −68.614519 | 20 August 2009 | 10 | 549 | 93.37 |
| Penobscot | 44.835663 | −68.599269 | 26 August 2009 | 94 | 994 | 199.65 |
References
- Duncanson, L.; Armston, J.; Disney, M.; Avitabile, V.; Barbier, N.; Calders, K.; Carter, S.; Chave, J.; Herold, M.; Crowther, T.W. The Importance of Consistent Global Forest Aboveground Biomass Product Validation. Surv. Geophys. 2019, 40, 979–999. [Google Scholar] [CrossRef]
- García, M.; Riaño, D.; Chuvieco, E.; Danson, F.M. Estimating Biomass Carbon Stocks for a Mediterranean Forest in Central Spain Using LiDAR Height and Intensity Data. Remote Sens. Environ. 2010, 114, 816–830. [Google Scholar] [CrossRef]
- Chen, Y.; Feng, X.; Fu, B.; Ma, H.; Zohner, C.M.; Crowther, T.W.; Huang, Y.; Wu, X.; Wei, F. Maps with 1 km Resolution Reveal Increases in above-and Belowground Forest Biomass Carbon Pools in China over the Past 20 Years. Earth Syst. Sci. Data 2023, 15, 897–910. [Google Scholar] [CrossRef]
- Li, L.; Zhou, B.; Liu, Y.; Wu, Y.; Tang, J.; Xu, W.; Wang, L.; Ou, G. Reduction in Uncertainty in Forest Aboveground Biomass Estimation Using Sentinel-2 Images: A Case Study of Pinus densata Forests in Shangri-La City, China. Remote Sens. 2023, 15, 559. [Google Scholar] [CrossRef]
- Moghimi, A.; Darestani, A.T.; Mostofi, N.; Fathi, M.; Amani, M. Improving Forest Above-Ground Biomass Estimation Using Genetic-Based Feature Selection from Sentinel-1 and Sentinel-2 Data (Case Study of the Noor Forest Area in Iran). Kuwait J. Sci. 2023, 100159. [Google Scholar] [CrossRef]
- Chen, J.M.; Leblanc, S.G. A Four-Scale Bidirectional Reflectance Model Based on Canopy Architecture. IEEE Trans. Geosci. Remote 1997, 35, 1316–1337. [Google Scholar] [CrossRef]
- Gerard, F.F.; North, P. Analyzing the Effect of Structural Variability and Canopy Gaps on Forest BRDF Using a Geometric-Optical Model. Remote Sens. Environ. 1997, 62, 46–62. [Google Scholar] [CrossRef]
- Li, X.; Strahler, A.H. Geometric-Optical Bidirectional Reflectance Modeling of the Discrete Crown Vegetation Canopy: Effect of Crown Shape and Mutual Shadowing. IEEE Trans. Geosci. Remote 1992, 30, 276–292. [Google Scholar] [CrossRef]
- Asner, G.P. Contributions of Multi-View Angle Remote Sensing to Land-Surface and Biogeochemical Research. Remote Sens. Rev. 2000, 18, 137–162. [Google Scholar] [CrossRef]
- Liu, X.; Liu, L. Influence of the Canopy Brdf Characteristics and Illumination Conditions on the Retrieval of Solar-induced Chlorophyll Fluorescence. Int. J. Remote Sens. 2018, 39, 1782–1799. [Google Scholar] [CrossRef]
- Wang, Q.; Pang, Y.; Li, Z.; Chen, E.; Sun, G.; Tan, B. Improvement and Application of the Conifer Forest Multiangular Hybrid GORT Model MGeoSAIL. IEEE Trans. Geosci. Remote 2013, 51, 5047–5059. [Google Scholar] [CrossRef]
- Cui, L.; Jiao, Z.; Dong, Y.; Sun, M.; Zhang, X.; Yin, S.; Ding, A.; Chang, Y.; Guo, J.; Xie, R. Estimating Forest Canopy Height Using MODIS BRDF Data Emphasizing Typical-Angle Reflectances. Remote Sens. 2019, 11, 2239. [Google Scholar] [CrossRef]
- Muukkonen, P.; Heiskanen, J. Biomass Estimation over a Large Area Based on Standwise Forest Inventory Data and ASTER and MODIS Satellite Data: A Possibility to Verify Carbon Inventories. Remote Sens. Environ. 2007, 107, 617–624. [Google Scholar] [CrossRef]
- Chopping, M.; Moisen, G.G.; Su, L.; Laliberte, A.; Rango, A.; Martonchik, J.V.; Peters, D.P. Large Area Mapping of Southwestern Forest Crown Cover, Canopy Height, and Biomass Using the NASA Multiangle Imaging Spectro-Radiometer. Remote Sens. Environ. 2008, 112, 2051–2063. [Google Scholar] [CrossRef]
- Chopping, M.; Schaaf, C.B.; Zhao, F.; Wang, Z.; Nolin, A.W.; Moisen, G.G.; Martonchik, J.V.; Bull, M. Forest Structure and Aboveground Biomass in the Southwestern United States from MODIS and MISR. Remote Sens. Environ. 2011, 115, 2943–2953. [Google Scholar] [CrossRef]
- Chopping, M.; Wang, Z.; Schaaf, C.; Bull, M.A.; Duchesne, R.R. Forest Aboveground Biomass in the Southwestern United States from a MISR Multi-Angle Index, 2000–2015. Remote Sens Environ 2022, 275, 112964. [Google Scholar] [CrossRef]
- Sharma, R.C. Vegetation Structure Index (VSI): Retrieving Vegetation Structural Information from Multi-Angular Satellite Remote Sensing. J. Imaging 2021, 7, 84. [Google Scholar] [CrossRef]
- Wang, Q.; Pang, Y.; Li, Z.; Sun, G.; Chen, E.; Ni-Meister, W. The Potential of Forest Biomass Inversion Based on Vegetation Indices Using Multi-Angle CHRIS/PROBA Data. Remote Sens. 2016, 8, 891. [Google Scholar] [CrossRef]
- Cui, L.; Sun, M.; Jiao, Z.; Park, J.; Agca, M.; Zhang, H.; He, L.; Dai, Y.; Dong, Y.; Zhang, X. Effectiveness of the Reconstructed MODIS Typical-Angle Reflectances on Forest Biomass Estimation. Remote Sens. 2022, 14, 5475. [Google Scholar] [CrossRef]
- Chang, Y.; Jiao, Z.; Zhang, X.; Mei, L.; Dong, Y.; Yin, S.; Cui, L.; Ding, A.; Guo, J.; Xie, R. Assessment of Improved Ross–Li BRDF Models Emphasizing Albedo Estimates at Large Solar Angles Using POLDER Data. IEEE Trans. Geosci. Remote 2020, 59, 9968–9986. [Google Scholar] [CrossRef]
- Wei, S.; Fang, H.; Schaaf, C.B.; He, L.; Chen, J.M. Global 500 m Clumping Index Product Derived from MODIS BRDF Data (2001–2017). Remote Sens. Environ. 2019, 232, 111296. [Google Scholar] [CrossRef]
- Roujean, J.L.; Leroy, M.; Deschamps, P.Y. A Bidirectional Reflectance Model of the Earth’s Surface for the Correction of Remote Sensing Data. J. Geophys. Res. Atmos. 1992, 97, 20455–20468. [Google Scholar] [CrossRef]
- Wanner, W.; Li, X.; Strahler, A.H. On the Derivation of Kernels for Kernel-Driven Models of Bidirectional Reflectance. J. Geophys. Res. Atmos. 1995, 100, 21077–21089. [Google Scholar] [CrossRef]
- Lucht, W.; Schaaf, C.B.; Strahler, A.H. An Algorithm for the Retrieval of Albedo from Space Using Semiempirical BRDF Models. IEEE Trans. Geosci. Remote 2000, 38, 977–998. [Google Scholar] [CrossRef]
- Li, X.; Gao, F.; Chen, L.; Strahler, A.H. Derivation and Validation of a New Kernel for Kernel-Driven BRDF Models. In Remote Sensing for Earth Science, Ocean, and Sea Ice Application; SPIE: Bellingham, WA, USA, 1999; Volume 3868, pp. 368–379. [Google Scholar]
- Jiao, Z.; Schaaf, C.B.; Dong, Y.; Román, M.; Hill, M.J.; Chen, J.M.; Wang, Z.; Zhang, H.; Saenz, E.; Poudyal, R. A Method for Improving Hotspot Directional Signatures in BRDF Models Used for MODIS. Remote Sens. Environ. 2016, 186, 135–151. [Google Scholar] [CrossRef]
- Cook, B.; Dubayah, R.O.; Hall, F.G.; Nelson, R.F.; Ranson, K.J.; Strahler, A.H.; Siqueira, P.; Simard, M.; Griffith, P. NACP New England and Sierra National Forests Biophysical Measurements: 2008–2010; ORNL DAAC: Oak Ridge, TN, USA, 2011. [Google Scholar] [CrossRef]
- Young, H.E.; Ribe, J.H.; Wainwright, K. Weight Tables for Tree and Shrub Species in Maine; Life Sciences and Agriculture Experiment Station, University of Maine at Orono: Orono, ME, USA, 1980; p. 84. [Google Scholar]
- MCD43A1 v061 MODIS/Terra+Aqua BRDF/Albedo Model Parameters Daily L3 Global 500 m SIN Grid. Available online: https://lpdaac.usgs.gov/products/mcd43a1v061/ (accessed on 1 October 2023).
- Masek, J.G.; Vermote, E.F.; Saleous, N.E.; Wolfe, R.; Hall, F.G.; Huemmrich, K.F.; Gao, F.; Kutler, J.; Lim, T. A Landsat Surface Reflectance Dataset for North America, 1990–2000. IEEE Geosci. Remote Sens. Lett. 2006, 3, 68–72. [Google Scholar] [CrossRef]
- Vermote, E.; Justice, C.; Claverie, M.; Franch, B. Preliminary Analysis of the Performance of the Landsat 8/OLI Land Surface Reflectance Product. Remote Sens. Environ. 2016, 185, 46–56. [Google Scholar] [CrossRef]
- Wang, Z.; Schaaf, C.B.; Strahler, A.H.; Chopping, M.J.; Román, M.O.; Shuai, Y.; Woodcock, C.E.; Hollinger, D.Y.; Fitzjarrald, D.R. Evaluation of MODIS Albedo Product (MCD43A) over Grassland, Agriculture and Forest Surface Types during Dormant and Snow-Covered Periods. Remote Sens. Environ. 2014, 140, 60–77. [Google Scholar] [CrossRef]
- Zawadzki, J.; Cieszewski, C.J.; Zasada, M. Semivariogram Analysis of Landsat 5 TM Textural Data for Loblolly Pine Forests. J. For. Sci. 2005, 51, 47–59. [Google Scholar] [CrossRef]
- Farr, T.G.; Rosen, P.A.; Caro, E.; Crippen, R.; Duren, R.; Hensley, S.; Kobrick, M.; Paller, M.; Rodriguez, E.; Roth, L.; et al. The Shuttle Radar Topography Mission. Rev. Geophys. 2007, 45, 2005RG000183. [Google Scholar] [CrossRef]
- Du, L.; Zhou, T.; Zou, Z.; Zhao, X.; Huang, K.; Wu, H. Mapping Forest Biomass Using Remote Sensing and National Forest Inventory in China. Forests 2014, 5, 1267–1283. [Google Scholar] [CrossRef]
- Wen, J.; You, D.; Han, Y.; Lin, X.; Wu, S.; Tang, Y.; Xiao, Q.; Liu, Q. Estimating Surface BRDF/Albedo over Rugged Terrain Using an Extended Multisensor Combined BRDF Inversion (EMCBI) Model. IEEE Geosci. Remote Sens. Lett. 2022, 19, 2503505. [Google Scholar] [CrossRef]
- Wen, J.; Liu, Q.; Xiao, Q.; Liu, Q.; You, D.; Hao, D.; Wu, S.; Lin, X. Characterizing Land Surface Anisotropic Reflectance Over Rugged Terrain: A Review of Concepts and Recent Developments. Remote Sens. 2018, 10, 370. [Google Scholar] [CrossRef]
- Pellikka, P.; King, D.J.; Leblanc, S.G. Quantification and Reduction of Bidirectional Effects in Aerial CIR Imagery of Deciduous Forest Using Two Reference Land Surface Types. Remote Sens. Rev. 2000, 19, 259–291. [Google Scholar] [CrossRef]
- Fang, H. Canopy Clumping Index (CI): A Review of Methods, Characteristics, and Applications. Agric. Forest Meteorol. 2021, 303, 108374. [Google Scholar] [CrossRef]
- Wang, L.; Yang, R.; Tian, Q.; Yang, Y.; Zhou, Y.; Sun, Y.; Mi, X. Comparative Analysis of GF-1 WFV, ZY-3 MUX, and HJ-1 CCD Sensor Data for Grassland Monitoring Applications. Remote Sens. 2015, 7, 2089–2108. [Google Scholar] [CrossRef]
- Li, J.; Pei, Y.; Zhao, S.; Xiao, R.; Sang, X.; Zhang, C. A Review of Remote Sensing for Environmental Monitoring in China. Remote Sens. 2020, 12, 1130. [Google Scholar] [CrossRef]
- Wang, S.; Li, X.; Ge, Y.; Jin, R.; Ma, M.; Liu, Q.; Wen, J.; Liu, S. Validation of Regional-Scale Remote Sensing Products in China: From Site to Network. Remote Sens. 2016, 8, 980. [Google Scholar] [CrossRef]
- Coll, C.; Caselles, V.; Galve, J.M.; Valor, E.; Niclos, R.; Sánchez, J.M.; Rivas, R. Ground Measurements for the Validation of Land Surface Temperatures Derived from AATSR and MODIS Data. Remote Sens. Environ. 2005, 97, 288–300. [Google Scholar] [CrossRef]
- Fang, H.; Baret, F.; Plummer, S.; Schaepman Strub, G. An Overview of Global Leaf Area Index (LAI): Methods, Products, Validation, and Applications. Rev. Geophys. 2019, 57, 739–799. [Google Scholar] [CrossRef]
- Lévesque, J.; King, D.J. Airborne Digital Camera Image Semivariance for Evaluation of Forest Structural Damage at an Acid Mine Site. Remote Sens. Environ. 1999, 68, 112–124. [Google Scholar] [CrossRef]

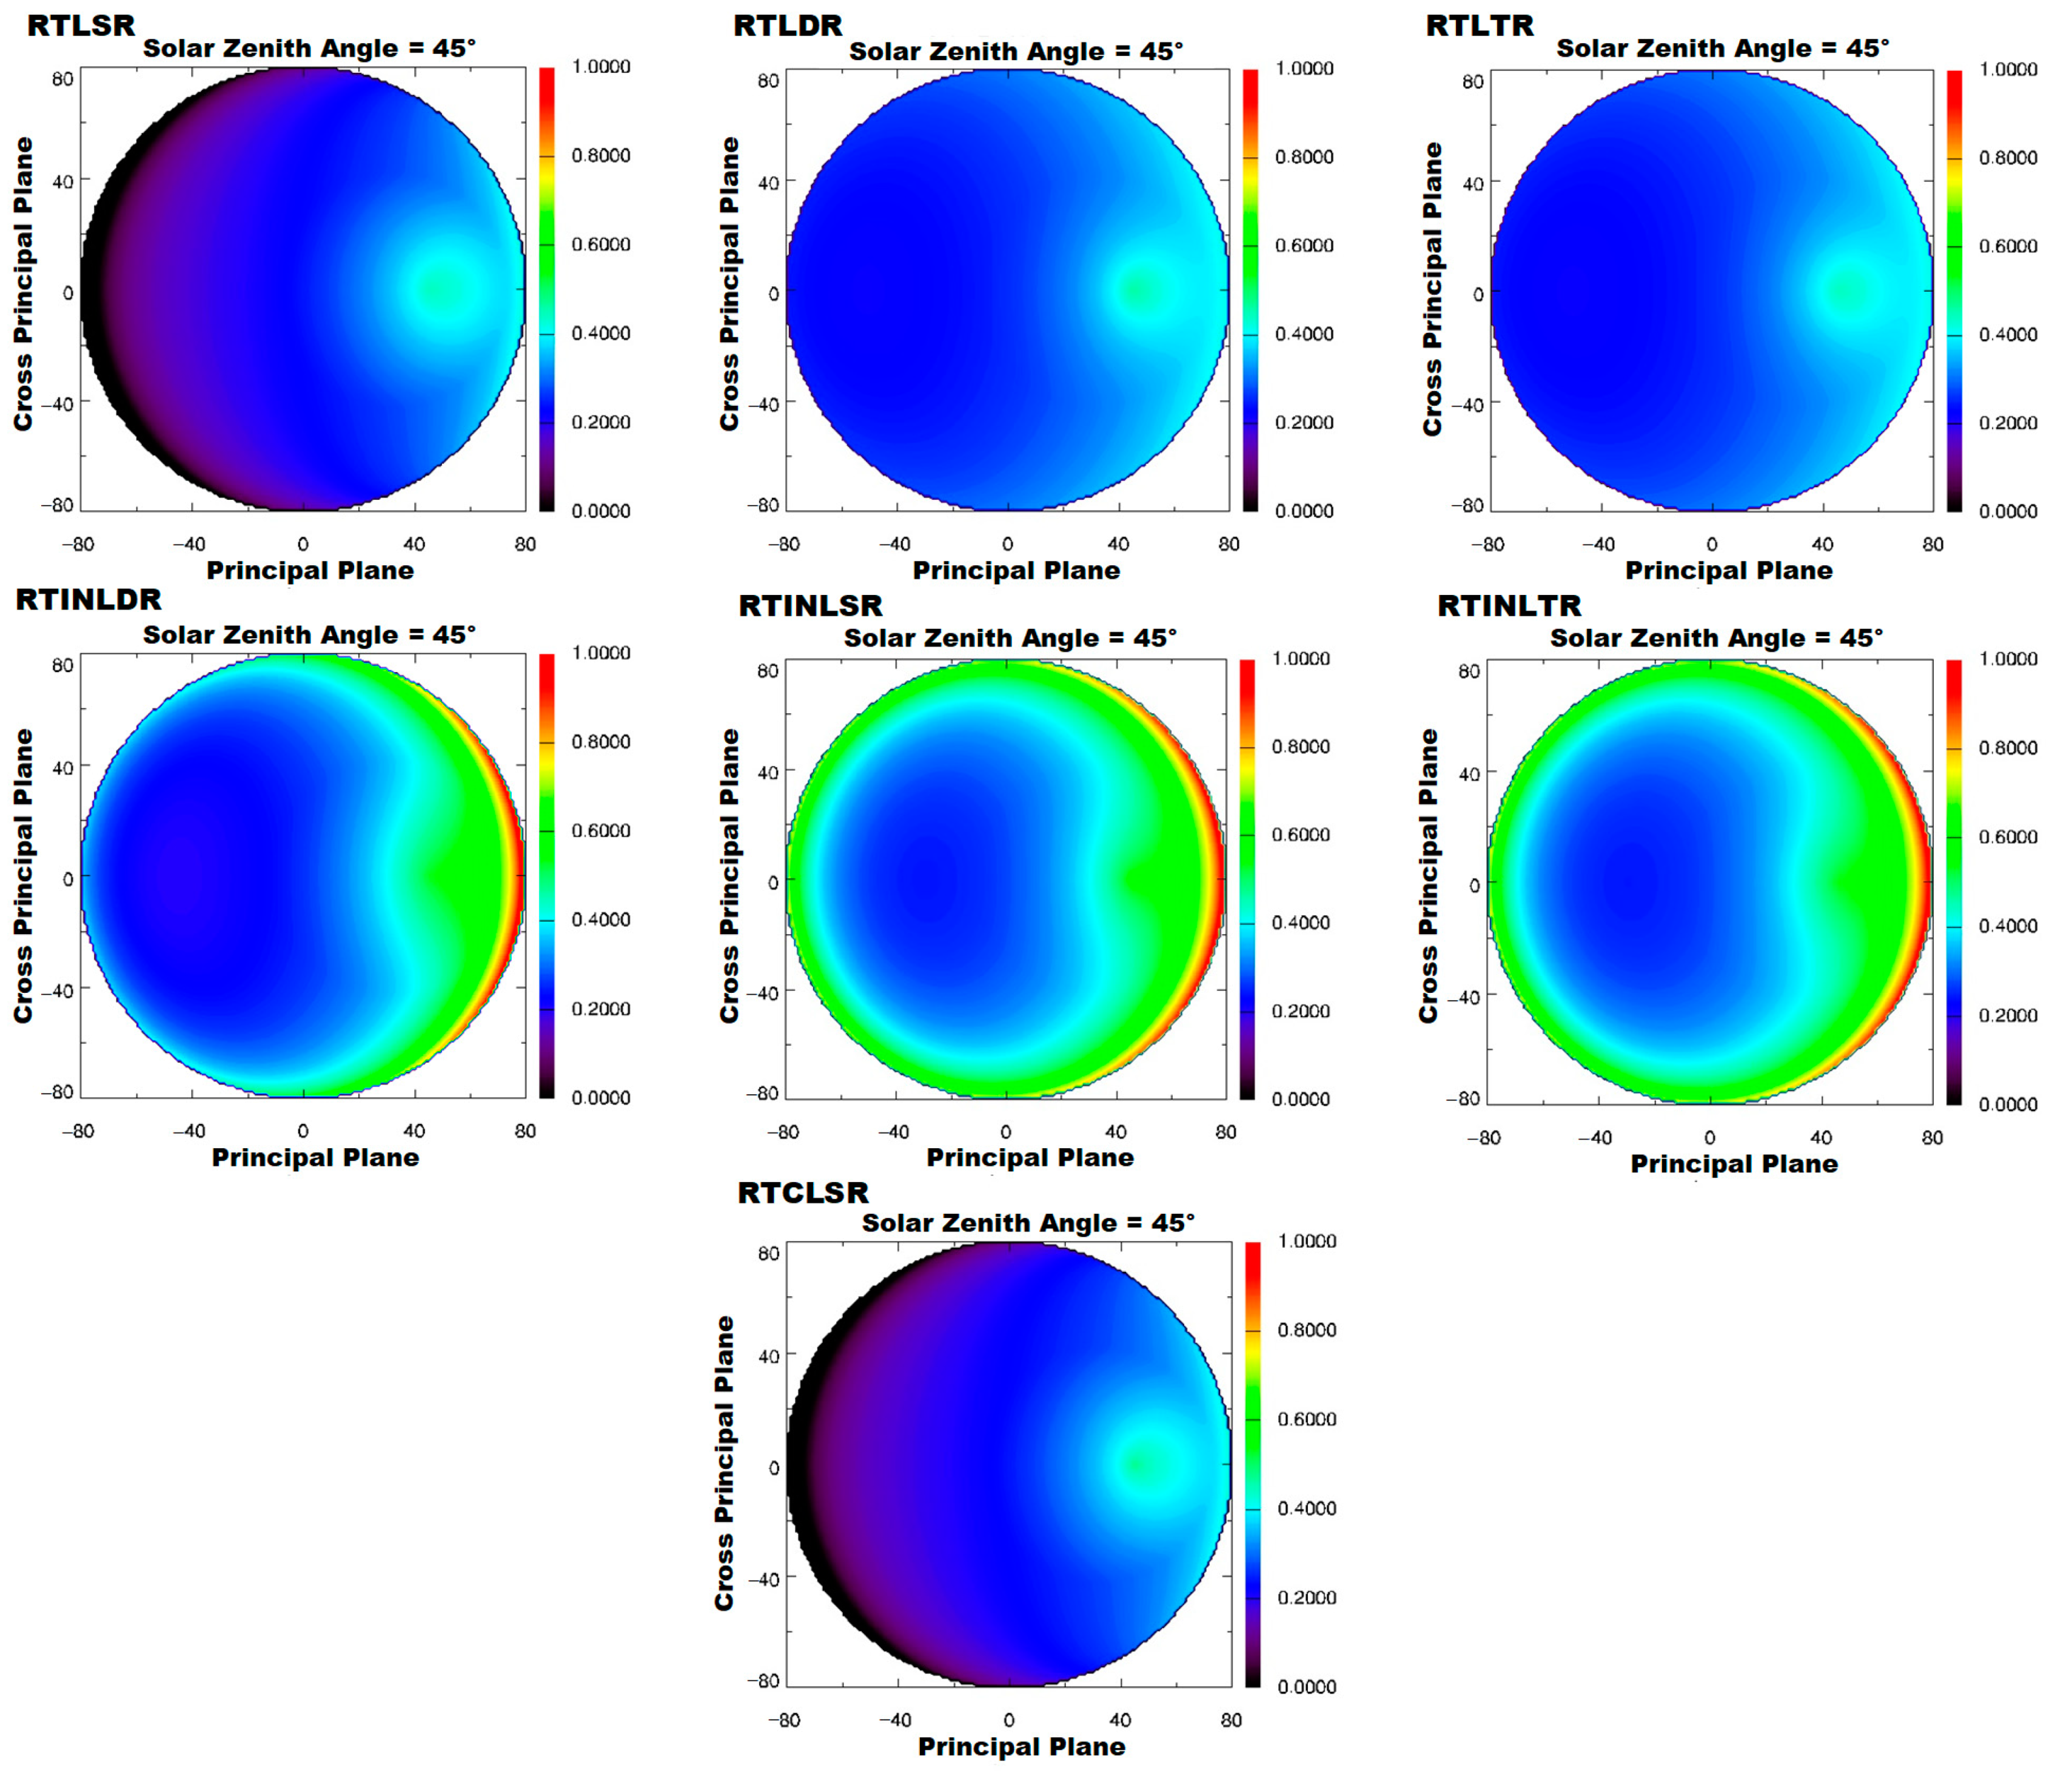

| Kgeo | LiSparseR | LiDenseR | LiTransitR | |||
|---|---|---|---|---|---|---|
| Kvol | ||||||
| RossThick | RTLSR | RTLDR | RTLTR | |||
| RossThin | RTINLDR | RTINLSR | RTINLTR | |||
| RossThickChen | RTCLSR | |||||
| BRDF Model | Regression Coefficients | F-Test | R2 | RMSE (Mg/ha) | ||||
|---|---|---|---|---|---|---|---|---|
| Hotspot Indice | Nadir Indice | Darkspot Indice | Tree Cover | Constant Term | ||||
| RTLSR | 8.31 | −6.74 | 7.14 | 0.12 | −9.73 | 0 | 0.65 | 53 |
| RTLDR | 18.44 | −52.40 | 43.18 | 0.12 | −11.36 | 0 | 0.62 | 55 |
| RTLTR | 16.93 | −44.66 | 37.17 | 0.12 | −12.05 | 0 | 0.62 | 56 |
| RTINLDR | −12.13 | 9.05 | 9.85 | 0.12 | 3.21 | 0 | 0.65 | 54 |
| RTINLSR | −9.76 | 13.55 | 2.60 | 0.12 | 4.00 | 0 | 0.65 | 53 |
| RTINLTR | −12.95 | 7.8 | 11.74 | 0.12 | 4.20 | 0 | 0.65 | 54 |
| RTCLSR | 12.24 | 4.65 | 4.56 | 0.12 | −195.61 | 0 | 0.72 | 48 |
Disclaimer/Publisher’s Note: The statements, opinions and data contained in all publications are solely those of the individual author(s) and contributor(s) and not of MDPI and/or the editor(s). MDPI and/or the editor(s) disclaim responsibility for any injury to people or property resulting from any ideas, methods, instructions or products referred to in the content. |
© 2024 by the authors. Licensee MDPI, Basel, Switzerland. This article is an open access article distributed under the terms and conditions of the Creative Commons Attribution (CC BY) license (https://creativecommons.org/licenses/by/4.0/).
Share and Cite
Cui, L.; Zhang, J.; Dai, Y.; Xie, R.; Zhu, Z.; Sun, M.; Zhang, X.; He, L.; Zhang, H.; Dong, Y.; et al. Influence of BRDF Models and Solar Zenith Angles on Forest Above-Ground Biomass Derived from MODIS Multi-Angular Indices. Forests 2024, 15, 541. https://doi.org/10.3390/f15030541
Cui L, Zhang J, Dai Y, Xie R, Zhu Z, Sun M, Zhang X, He L, Zhang H, Dong Y, et al. Influence of BRDF Models and Solar Zenith Angles on Forest Above-Ground Biomass Derived from MODIS Multi-Angular Indices. Forests. 2024; 15(3):541. https://doi.org/10.3390/f15030541
Chicago/Turabian StyleCui, Lei, Jiaying Zhang, Yiqun Dai, Rui Xie, Zhongzheng Zhu, Mei Sun, Xiaoning Zhang, Long He, Hu Zhang, Yadong Dong, and et al. 2024. "Influence of BRDF Models and Solar Zenith Angles on Forest Above-Ground Biomass Derived from MODIS Multi-Angular Indices" Forests 15, no. 3: 541. https://doi.org/10.3390/f15030541