

Multiple Dimensions of Functional Traits in Subtropical Montane Mosses
by
Zhiwei Liu
1,†,
Lingli Yi
2,†,
Xiaohang Zhou
1,
Yong Xiong
2,
Jinhui Liu
1,
Haiyan Qiu
1 and
Weiqiu Liu
1,* 1
School of Ecology, Sun Yat-sen University, Guangzhou 510275, China
2
Jiangxi Guanshan National Nature Reserve, Yichun 336300, China
*
Author to whom correspondence should be addressed.
†
These authors contributed equally to this work.
Forests 2024, 15(4), 587; https://doi.org/10.3390/f15040587
Submission received: 26 January 2024
/
Revised: 3 March 2024
/
Accepted: 22 March 2024
/
Published: 24 March 2024
(This article belongs to the Special Issue Spatio-Temporal Changes in Forest Bryophyte Diversity: Patterns, Processes and Conservation Applications)
Abstract
:The study of functional traits and their relationship to trade-offs has provided valuable insights into how plants adapt to environmental changes. Nonetheless, further research is necessary to fully comprehend the subtropical montane trade-off patterns in moss functional traits and the impact of environmental gradients on the correlation of these traits. To address this gap, we conducted a study of 11 moss species (7 families, 9 genera) in 54 patches from two subtropical mountain ranges, examining 40 functional traits related to photosynthesis, nutrients, water retention, and architecture. Through principal component analysis (PCA) and bi-variate correlation analysis, our findings reveal a strong correlation between light capture and nutrient assimilation strategies, as evidenced by the coordination between the traits of light capture and nutrient per area along a main principal component. Interestingly, we observed a trend towards smaller leaves and leaf cells in species with higher capacity for photosynthesis and metabolism, consistent with global trait spectra in vascular plants. However, we found that the trade-off between light capture and nutrient assimilation strategies was independent of water-holding capacity at shoot levels. Instead, we found that water-holding capacity was closely associated with nutrient utilization, energy metabolism, chlorophyll synthesis, and the primary process of photosynthesis. Our results highlight the multiple dimensions of functional traits in subtropical montane mosses and demonstrate that variation in these traits is driven by water availability, slope, and canopy density. Overall, our study provides valuable insights into the co-variation of moss traits and how environmental changes may impact mosses and ecosystem function.
1. Introduction
Understanding the impact of environmental changes on biological processes and the potential for mitigating or exacerbating these changes is a significant challenge in plant ecology [1]. Functional traits are key indicators that can clarify plant adaptation strategies to environmental changes [2,3]. Response traits reflect the response of plant species to environmental gradients, while effect traits mediate the impact of ecosystem processes on the environment [3]. Despite bryophytes (hornworts, liverworts, and mosses) being the second most diverse group of land plants, with about 20,000 extant species, and playing vital roles in forest ecosystems, the number of studies focused on their comparative physiological performance is much smaller than those on tracheophytes [4,5]. The ecological strategies of bryophytes cause functional trait variation and species distribution differences in microhabitats [6]. Studying the differences in functional traits of moss species across various environments can reveal how they adapt to their surroundings. This information can help us to better understand how plants in general deal with environmental changes [7,8].
Compared to tracheophytes, mosses are primitive plants with lower leaf mass per area and gas exchange. However, they exhibit similar trait coordination between nutrient investment, dry mass, and photosynthesis during ecological differentiation [9,10]. In contrast to tracheophytes, the economic spectrum in mosses has been found in the shoot- or canopy-levels of moss rather than the leaf [8,9,11], because the shoot and canopy area of mosses is an analog of the leaf area of vascular plants. Additionally, mosses are typical poikilohydric plants that can rapidly absorb and lose water depending on the water availability in their immediate environment. Different species of mosses have varying strategies for adapting their photosynthesis to water surpluses and shortages, probably through taking more time to ‘prepare’ or adjust photosynthesis quickly [12,13]. Although water-holding capacity and economic traits were both reported to have a tight connection to photosynthesis progress [5,10,13,14], the decoupling of water-holding capacity to economic traits has been reported in boreal mosses [14]. Therefore, it is necessary to conduct a more comprehensive study encompassing a broader range of species and geographic locations to understand the pattern of the economic spectrum in bryophytes.
Different factors can determine the variability of traits, such as the impact of environmental gradients, trait trade-offs (which refer to the covariation of traits among species), and interspecific trait variability [15]. Variations in the environment can influence resource allocation between different types of traits, such as architectural traits (e.g., structural support) and physiological functional traits (e.g., photosynthesis) [5,16]. These traits impose physical and energetic constraints on the use and allocation of resources in plants. Trait trade-offs in the plant trait spectrum derive from covariation between architectural traits related to plant maintenance (high allocation to large structures) and physiological traits related to their metabolism (high resource capture rate), reflecting the costs and benefits of leaf investment, not only for spermatophytes, but also found in the shoot level (measured by the area projected on the ground or transversal to the shoot, based on individuals) and the canopy level (measured by the ground area of the moss canopy in its natural station) of bryophytes [6,9,14]. Increasing the number of species in a community may broaden the trait distribution as new species are introduced. Environmental variability, trait trade-offs, and interspecies trait variability in bryophytes are intermingled in generating the large diversity observed in the economic spectrum [6,14,15].
We conducted a study to investigate the functional traits of mosses in subtropical montane regions. The study was carried out in the Chebaling and Guanshan National Nature Reserves in South China. To conduct the investigation, we analyzed the co-variation of architectural, physiological, and chemical traits in 11 dominant moss species in subtropical montane regions and explored their responses to environmental gradients. Our study aimed to achieve the following objectives: (1) to investigate the subtropical montane pattern of trade-offs in moss functional traits, and (2) to determine how environmental gradients shape the co-variation of functional traits in subtropical montane regions. Our study provides insights into the co-variation of moss traits and how environmental changes may affect mosses’ functions and ecosystem function.
2. Materials and Methods
2.1. Study Site, Focal Species, Sampling, and Pretreatment
Sampling was conducted at the Chebaling National Nature Reserve (CBL, 16,110.7 hm2, 114°07′ E–114°16′ E, 24°40′–24°46′ N) and Guanshan National Nature Reserve (GS, 11,500.5 hm2, 114°29′–114°45′ E, 28°30′–28°40′ N) of China (Figure 1), between August and September 2021. The mean annual temperature is 15.99 °C in Guanshan and 19.31 °C in Chebaling, and the mean annual precipitation is 1790.5 mm in Guanshan and 1449.9 mm in Chebaling. We selected 11 prominent species as objective species in the two regions, though only 7 of these species were present in both regions (refer to Table 1). Moss patches that form monospecific layers of our objective species were selected to collect samples for trait analysis. A total of 54 distinct moss patches in the two regions (24 patches in CBL and 30 patches in GS, Table S2) were selected (with 3 replicates for each studied species), ensuring a minimum distance of 20 m between each. To provide comprehensive documentation, we carefully recorded the environmental conditions of each patch, including its latitude, longitude, elevation, substrate, slope, and canopy density. To determine canopy density, we captured an image of the vascular plant cover above the moss surface using a smartphone camera and a wide-angle lens. The canopy density was then calculated from the captured image using ImageJ (1.54d) image analysis software. Furthermore, we developed a scoring system to assess the water availability in microhabitats based on the distance between the patch’s shade and its water source. The scoring system assigns a score of 1 if there is no significant water source within 2 m of the patch and a canopy shade of less than or equal to 0.3. A score of 2 indicates no significant water source within 2 m but with a canopy shade greater than 0.3. A score of 3 indicates a significant water source within 2 m of the patch, directly influenced by water. The higher the score, the stronger the water availability.
The mosses were collected with the underlying substrate, sealed in plastic bags, and brought to the laboratory as soon as possible. The samples were kept moist and shaded. Before the experiments, the litter, bark, and mixed-in mosses of other species were removed carefully. All the samples were washed with distilled water to clean off the dust and mud. Dead tissue was removed, and the green moss sections were collected as the final samples.
2.2. Photosynthetic Traits
The content of chlorophyll pigments per mass (Chlmass) was measured using the spectrophotometer method, which is detailed in method S1. A portable open-flow infrared gas analyzer (GFS-3000, Walz, Effeltrich, Germany) with a moss cuvette (cuvette for Lichens/Mosses 3010-V32) was used to measure photosynthetic light responses (see Methods S2 of Supplementary Materials). We determined light response parameters from plots of CO2 assimilation rate (A) vs. PAR. The assimilation rate per mass (Amass), dark respiration rate per mass (Rmass), the light compensation point (Ic), and the saturation irradiance (Is) were estimated by fitting the light response curves to a nonrectangular hyperbola photosynthetic model [17]. The fitting coefficients were all above 0.99. Assimilation rates according to nitrogen (AN), phosphorus (AP), and chlorophyll (AChl) were calculated by dividing Amass by N, P, and chlorophyll concentration per mass (Nmass, Pmass, and Chlmass), respectively.
Light-saturated assimilation rate, dark respiration rate, nitrogen, phosphorus, and chlorophyll per shoot area (Aarea, Rarea, Narea, Parea, Chlarea) by multiplying Amass, Rmass, Nmass, Pmass, and Chlmass by the shoot mass per area (SMA) will be described in Section 2.4.
A PAM fluorometer (PAM-2500, Walz, Effeltrich, Germany) was used to measure chlorophyll fluorescence. The measurement and calculation of the optimal photochemical efficiency of PSII (Fv/Fm), the actual photochemical efficiency of PSII (φPSII), photochemical quenching (qP), and photochemical quenching (NPQ) were described in Methods S3 of Supplementary Materials.
2.3. Water Retention Capacity
Water-holding capacity and the rate of water loss were determined through water loss experiments. Samples underwent the same wetting pretreatments and spatial arrangements used for measuring the photosynthetic water-response curve. Wet samples’ initial weight was recorded and they were kept under moderately cool and moist conditions (around 25 °C and 80% humidity) until dry. Sample weight was measured every 10 min for the first 60 min and at incremental intervals of 12, 15, 20, 30, 60, 120, 180, and 270 min, and then every 3 h until constant weights were obtained. After measurements, samples were dried in an oven at 70 °C for 48 h to determine the dry weight.
Water content (WC) was calculated as:
and WCmax of each sample was calculated using the maximum (initial) fresh weight.
Water content = (fresh weight − dry weight)/dry weight,
The water loss curves were fitted using exponential decay regressions [18]:
where t (min) is the evaporative time and a, DC (decaying constant), and y are coefficients. The R2 values were all above 0.98.
water content = y + a × e(−DC*t)
2.4. Architectural Traits
Architectural traits potentially linked with cell- and leaf-level structure and function were measured for five shoots of each species that were mounted and photographed at 20–400× magnification. We measured the cross-sectional area of the central strand (CAA), cross-sectional area of the shoot (CSA), leaf area (LA), leaf length (LL), leaf width at the widest part (LW), length/width ratio (L/W), perimeter2/area ratio (P2/A), costa length (CL) and costa width at the widest part (CW) using ImageJ software (National Institutes of Health, Bethesda, MD, USA), and 4–6 cells from the central area of the lamina were measured to determine cell lumen area (CLA), cell lumen length (CLL), cell lumen width (CLW), and cell wall thickness (CWT) of the leaf; cells per area (CPA) of the leaf were determined from 15 to 20 cells by circling a center area (diameter = 0.05 mm) on leaves. We determined SMA as leaf mass divided by shoot projected area [9,14].
2.5. Chemical Analysis
The amount of organic carbon (Cmass) and nitrogen (Nmass) in each unit of mass was measured using a Vario Macro Cube Elemental Analyzer (Elementar Analysensysteme GmbH, Langenselbold, Germany). The phosphorus content per unit of mass (Pmass) was determined using the Mo–Sb antispectrophotography method. By multiplying the mass-based nutrient concentrations and SMA, the C, N, and P contents based on area (Carea, Narea and Parea) were derived. Finally, the mass-based concentrations were used to calculate the stoichiometric ratios of C:N, C:P, and N:P.
2.6. Data Analysis
We used R software version 4.3.1 and the package ggplot2 for all statistical and graphical analyses [19,20]. To assess the resource use strategy of the samples, we examined trait associations using principal component analysis (PCA) through the package FactoMineR [21]. We first used a total of 42 traits (Table 2) in the PCA analysis and found that the traits mainly projected their coordination relationship in the first four axes (Figure S1A). Based on our analysis, we found that the variance in CSA and CAA projected in each of the first four axes was less than 20%. Additionally, the total variance of CSA and CAA projected in the first four axes was less than 40%. This information suggests that CSA and CCA are not closely associated with the first four axes. As a result, we decided to exclude them from our analysis. The selected variables were log-transformed as appropriate to improve linearity and scaled to unit variance before analysis. Considering the possible non-linear relationship between traits, Spearman and Pearson correlation coefficients were both computed to estimate the bi-variate relationship between functional traits (Figures S2 and S3).
To assess how trait spectra relate to environmental gradients, we used the function envfit in the vegan package to fit environment gradients onto the ordination and to test their fit through permutation tests [22]. To investigate the relationship between the environment gradients with significant influence and the four primary PCA axes, we performed additional tests using fixed-effects and mixed-effects models. In these models, we used the first four PCA axis sample scores as the response variables, with slope, canopy density, and wetness as fixed effects and species as random effects in the mixed-effects models. We achieved this by fitting fixed-effects models using the lm function and linear mixed-effects models using the lmer function in the lme4 package [23] and the expansion packages, including lmerTest [24], and sjstats [25]. To test whether regions had an effect for those species occurring in more than one region, we performed likelihood-ratio tests comparing the full model (i.e., species/habitat combination as a random effect) with a nested subset (i.e., species as a random effect). To further analyze the influence of environmental gradients on the functional traits, we evaluated the bi-variate relationship between functional traits and environmental gradients using Spearman and Pearson correlation.
3. Results
Principal Component Analysis (PCA) was performed to examine the relationship between physiological and morphological traits based on the functional characteristics screened. The analysis resulted in the identification of the first four principal component axes (PCs), which accounted for 67.91% of the total variance and effectively captured the trade-off between physiology and morphology traits, as depicted in Figure 2. Fitting environmental variables onto the ordination provided strong evidence that moss trait variation, as described by the PCA, was overall associated with slope (R2 = 0.35, p < 0.001), with canopy density (R2 = 0.21, p = 0.026), and with water availability (R2 = 0.38, p < 0.001). Upon further analysis of fixed effects models (Table 3), PC1 and PC4 exhibited moderate associations with canopy density and water availability, whereas PC2 and PC3 were moderately affected by slope. However, the mixed-effect models only support the significant relationship of PC2 to slope and PC4 to water availability. Coupled with the slight difference in the conditional R2 between the mixed-effect and random-effect models presented in Table S3, we concluded that the fixed effects (slope, canopy density, and water availability) contributed much less to the variation in PC scores intra-species than inter-species. Moreover, likelihood-ratio tests showed only PC2 with a significant difference between region/species combination and species alone across the four axes (Table S3), indicating that only a small portion of the variation in traits within species was attributed to regions. Our results provide strong evidence that the variation of functional traits was driven by the environment gradients, although mainly through interspecific differentiation other than intraspecific variation.
The present study has observed a trade-off between economic and light-capturing traits in PC1. Species situated on the negative side of PC1 exhibited larger leaves and leaf cells (CLW: −0.91, LW: −0.84, CLA: −0.77, LA: −0.71, CLL: −0.43), as well as a higher nutrient concentration based on mass (Nmass: −0.69, Pmass: −0.53). This suggests that they have adapted to shaded environments and are primarily focused on capturing light. Conversely, species located on the positive side of PC1 displayed a higher capacity for nutrient and carbon assimilation (SMA:0.91, Carea: 0.93, C/N: 0.79, CPA: 0.77, Narea: 0.68, Rdarea: 0.60, Cmass: 0.56, Aarea: 0.44, Parea: 0.43). Further bivariate correlation analysis demonstrated that several variables, including Aarea, Narea, Parea, Carea, and SMA, displayed significant correlations with CLW, LW, LA, CLA, and CPA, as illustrated in Figures S2 and S3. It is noteworthy that the traits associated with water retention (WCmax, DC) projected their negligible variance on PC1, as illustrated in Figure S1. Further bivariate correlation analysis did not support a significant relationship between water retention traits and economic traits, except for Nmass and C/N (Figures S2 and S3). Our result revealed the independence of water retention ability from the economic spectrum observed on PC1.
A trade-off between energy and nutrient utilization was observed on PCA axis 2. The nutrient utilization efficiency in photosynthesis progress (AP: 0.84, AN: 0.71) decreased along the negative direction of the axis, while dark respiration (Rd/A: −0.73, Ic: −0.57, Rdarea: −0.44) increased. A significant relationship was observed only between AP, AN, and Rd/A, and these variables were found to have an explicit relationship with water-holding capacities (WCmax), as illustrated in Figures S2 and S3.
On PCA axis 3, a trade-off between the traits related to leaf size and structure (LL: 0.74, CW: 0.72, CL: 0.69, L/W: 0.67) and photosynthesis capacity (Amass: −0.56, AN: −0.48, Aarea: −0.34) was found. However, only Amass and L/W were significantly related. On PCA axis 4, a trade-off between the absorption and utilization of light energy was observed. Species with high photosynthetic efficiency per unit of chlorophyll (AChl: 0.69) were found in the positive direction, while species with higher chlorophyll content (Chlarea: −0.66, Chlmass: −0.65) were found in the opposite direction. Chlarea and Chlmass were significantly negatively related to CW, L/W, and CLL.
Additionally, we found that the influence of water availability on moss traits related to more aspects, including photosynthesis progress (Aarea, Rdarea, Is, Chlmass), leaf and cell size (L/W, CPA, CLA, CLL, LW), and water retention capacity (DC), as shown in Figure 3. Slopes tended to relate to costa length (CL) and leaf length (LL), while canopy density showed a tight relationship to photosynthesis progress. Our results demonstrated the different mechanisms by which mosses adapt to environmental gradients.
4. Discussion
4.1. Morphological Adaptations to the Microhabitat Gradient
Morphological traits are physical characteristics that provide a clear indication of the functional strategies employed by different species [26]. A principal component analysis (PCA) of these traits, including CLW, LW, LA, CPA, CLA, and P2/A, revealed that most of their variability was projected onto PCA axis 1 (Figure S1), which was significantly related to gradients in water availability and canopy density. Our research found that as the gradient of canopy density and water availability decreased, leaves and leaf cells exhibited a trend towards miniaturization, while leaf margins (P2/A) became more complex. These adaptations served to reduce heat loading and water loss in high light and xeric conditions. Similar morphological adaptations were reported in mosses distributed across three microhabitats along a vertical gradient, where branch-dwelling species had smaller and slimmer leaves and leaf cells than those on tree trunks [4]. Conversely, larger leaves facilitated greater levels of light interception [9], demonstrating the opposite end of the adaptation spectrum.
The costae found in mosses are known to provide structural support to leaves and water transportation. In this regard, leaves with longer and wider costae (Higher LL and LW) have been found to be associated with longer leaves (Higher LL) and higher leaf length/width ratios (L/W) [9]. A positive correlation between CL, CW, LL, and L/W was found to be significant in our study (Figures S2 and S3). These traits also played an essential role in the construction of PCA axis 3 (Figure S1), which was observed to be significantly related to the slope gradient. The slope gradient was negatively correlated with CL, CW, LL, and L/W (Figure 3). This result was consistent with previous studies, such as that by Turberville et al., which reported a smaller phyllid surface area in mosses growing on vertical substrates [27]. In general, there is a negative relationship between canopy and slope in montane regions, due to the high slope effect of strong intense light, scare water resource and frequent disturbance [28]. We speculate that steeper slopes led to a more rapid drain rate, which reduced the water retention capacity of mossy carpets, thereby limiting the growth of leaves.
Our result also showed the co-variance between morphological traits and water-retention capacity. WCmax was positively correlated with CLL, CLA, and CW, and DC was positively correlated with CPA. The significance of these relationships was demonstrated by bivariate correlation (Figures S2 and S3). Previous research studies have revealed that the covariance of morphological traits in moss is adjusts and adapts to the availability of light and water, leading to variations in the synergistic photosynthetic and water-holding capacity [4,7,29]. However, water-retention capacity was not related to the economical traits generally, such as SMA, Narea, and Parea.
4.2. Photosynthetic Adaptations to the Microhabitat Gradient
The physiological traits related to photosynthesis in moss varied depending on water availability and canopy density, as shown in Figure 3A,B. Moss photosynthetic capacity and dark respiration based on area were more sensitive to changes in gradients than those based on mass. This reflects the fact that moss photosynthetic capacity is dependent on photosynthetic area [10]. In our study, we observed that under light and xeric conditions, the species had higher Aarea, Is, φPSII, Rdarea, Rdmass, and Ic, accompanied by smaller leaf size. Aarea, φPSII, and Is indicate an increased capacity to utilize greater available irradiance, while the higher Rdarea, Rdmass, and Ic indicate a greater maintenance cost. These findings reflect the optimization of mosses to irradiance, like tracheophytes in their association of morphology with irradiance [9,30]. It is worth noting that the co-variance did not include the variation of chlorophyll per mass or area and fluorescence parameters, reflecting the decoupling of photosynthesis capacity to photosynthesis primary reaction in the study.
Our research has revealed that there is a trade-off between energy and nutrient use efficiency during photosynthesis, as indicated by the negative correlation between Rd/A and AP and AN. When the utilization efficiency of nitrogen (N) and phosphorus (P) is low, mosses increase their dark respiration rate to compensate for the loss of energy and nutrients. Conversely, when the utilization efficiency of N and P is high, mosses reduce their dark respiration rate and optimize the utilization of energy and nutrients produced during photosynthesis. This adjustment is closely linked to water-holding capacities (WCmax), suggesting that water retention capacity plays a critical role in photosynthesis [13].
4.3. Multiple Dimensions of Moss Functional Traits
The presence of leaf economics and hydraulic traits plays a crucial role in determining the rate of leaf photosynthesis in vascular plants. However, researchers have debated whether these two trait sets are entirely coordinated or if they allow for independent variation [2,31]. While the economic spectrum and trade-off between water relations and photosynthetic responses have been reported in mosses [9,13], there has been limited exploration of the relationship between the sets of traits related to economic and water retention capacity. Our result showed that the water retention ability of mosses was independent of the economic spectrum observed on the primary axes (Figure 2A,C). Grau-Andrés et al. [14] reported a similar result, finding that the economic spectrum of boreal mosses was driven by trade-offs in carbon, nutrient, and water conservation strategies. The architectural traits of the moss shoots and canopy were not significantly related to this spectrum, but instead formed a secondary axis.
Studies have shown that compared to vascular plants, mosses tend to exhibit higher susceptibility to environmental gradients, resulting in stronger effects of the environment on their traits [32,33]. As a result, unlike vascular plants, which tend to exhibit single main axes of trait variation, moss species tend to exhibit more independent dimensions [14]. However, most previous studies about moss functional traits have only focused on primary axes [9,10,34]. In our study, we found that the primary axis (PC1) was associated with architectural traits, nutrients, photosynthetic capacity, and dark respiration based on area, which are considered analogous to the functional traits of vascular plants that drive the “leaf economics spectrum” [9,35]. It is important to note that the main axis accounted for only 25.50% of the total trait variation, while the other three axes explained 42.41% of the variability. Additionally, although Aarea showed a close relationship with economic traits (SMA, Carea, Narea) and water retention capacity, the correlation between economic traits and water retention capacity was weak. Our study showed functional trait combinations in more dimensions compared to previous moss studies by including as many traits as possible across a wider range of environmental gradients and species [5,11,12]. This allowed us to differentiate between architectural traits related to different functions, such as water-holding capacity and photosynthesis optimization, and assign them to different trait spectra. It is imperative to highlight that our findings require further scrutiny and evaluation across a broader range of moss species and regions in future research endeavors. This will enable us to validate our findings and establish a more comprehensive understanding of the underlying mechanisms that drive such outcomes.
5. Conclusions
Our research has revealed that subtropical montane mosses possess multifaceted functional traits. Despite sharing an economic spectrum with vascular plants, this spectrum appears to be unrelated to their water retention capacity at the shoot level and the primary process of photosynthesis. Because mosses are poikilohydric plants and can flourish in diverse global locations and microhabitats, the merging of their functions into a unified economic spectrum akin to vascular plants would be a momentous endeavor. To achieve this goal, additional research into the functional traits of mosses across a broader range of regions and species is imperative.
Supplementary Materials
The following supporting information can be downloaded at: https://www.mdpi.com/article/10.3390/f15040587/s1, Figure S1: The variance distribution of the function traits (A: 42 traits; B: 40 traits) projected on the first ten PCA axes; Figure S2: Bi-variate relationship between function traits evaluated by Spearman correlation; Figure S3: Bi-variate relationship between function traits evaluated by Pearson correlation; Table S1: Function traits data of the 11 species of mosses in the study; Table S2: Sampling time and the location of the patches in Chebaling National Nature Reserve (CBL) and Guanshan National Nature Reserve (GS); Table S3: Results of likelihood-ratio tests for the sample scores of the first four PCA axes, testing whether sample scores of the first four PCA axes by comparing the full model (i.e., region/species as a random effect) with a nested subset (i.e., specie as with a random effect).
Author Contributions
Conceptualization, Z.L., W.L. and L.Y.; methodology, W.L.; software, Z.L.; formal analysis, Z.L. and X.Z.; investigation, X.Z., Y.X., J.L. and H.Q.; resources, L.Y. and Y.X.; data curation, X.Z.; writing—original draft preparation, Z.L. and X.Z.; writing—review and editing, Z.L. and W.L.; visualization, Z.L.; project administration, L.Y. and W.L.; funding acquisition, W.L. All authors have read and agreed to the published version of the manuscript.
Funding
This research was funded by the National Natural Science Foundation of China (32271565) and Jiangxi Guanshan National Nature Reserve.
Data Availability Statement
Data are contained within the article.
Acknowledgments
We would like to express our gratitude to Jiangxi Guanshan National Nature Reserve and Guangdong Chebaling National Nature Reserve for the invaluable support and assistance during our fieldwork.
Conflicts of Interest
The authors declare no conflicts of interest.
References
- Gomarasca, U.; Migliavacca, M.; Kattge, J.; Nelson, J.A.; Niinemets, Ü.; Wirth, C.; Cescatti, A.; Bahn, M.; Nair, R.; Acosta, A.T.R.; et al. Leaf-Level Coordination Principles Propagate to the Ecosystem Scale. Nat. Commun. 2023, 14, 3948. [Google Scholar] [CrossRef]
- Wright, I.J.; Reich, P.B.; Westoby, M.; Ackerly, D.D.; Baruch, Z.; Bongers, F.; Cavender-Bares, J.; Chapin, T.; Cornelissen, J.H.C.; Diemer, M.; et al. The Worldwide Leaf Economics Spectrum. Nature 2004, 428, 821–827. [Google Scholar] [CrossRef] [PubMed]
- Osnas, J.L.D.; Lichstein, J.W.; Reich, P.B.; Pacala, S.W. Global Leaf Trait Relationships: Mass, Area, and the Leaf Economics Spectrum. Science 2013, 340, 741–744. [Google Scholar] [CrossRef]
- Fan, X.-Y.; Liu, W.-Y.; Song, L.; Liu, S.; Shi, X.-M.; Yuan, G.-D. A Combination of Morphological and Photosynthetic Functional Traits Maintains the Vertical Distribution of Bryophytes in a Subtropical Cloud Forest. Am. J. Bot. 2020, 107, 761–772. [Google Scholar] [CrossRef]
- Wang, Z.; Bader, M.Y.; Liu, X.; Zhu, Z.; Bao, W. Comparisons of Photosynthesis-Related Traits of 27 Abundant or Subordinate Bryophyte Species in a Subalpine Old-Growth Fir Forest. Ecol. Evol. 2017, 7, 7454–7461. [Google Scholar] [CrossRef]
- Löbel, S.; Mair, L.; Lönnell, N.; Schröder, B.; Snäll, T. Biological Traits Explain Bryophyte Species Distributions and Responses to Forest Fragmentation and Climatic Variation. J. Ecol. 2018, 106, 1700–1713. [Google Scholar] [CrossRef]
- Coe, K.K.; Howard, N.B.; Slate, M.L.; Bowker, M.A.; Mishler, B.D.; Butler, R.; Greenwood, J.; Stark, L.R. Morphological and Physiological Traits in Relation to Carbon Balance in a Diverse Clade of Dryland Mosses. Plant Cell Environ. 2019, 42, 3140–3151. [Google Scholar] [CrossRef] [PubMed]
- Wang, Z.; Pi, C.; Bao, W.; Bader, M.Y. Elevational Trends in Photosynthetic Capacity and Trait Relationships of Subtropical Montane Understorey Bryophytes. Ecol. Indic. 2022, 142, 109251. [Google Scholar] [CrossRef]
- Waite, M.; Sack, L. How Does Moss Photosynthesis Relate to Leaf and Canopy Structure? Trait Relationships for 10 Hawaiian Species of Contrasting Light Habitats. New Phytol. 2010, 185, 156–172. [Google Scholar] [CrossRef]
- Wang, Z.; Liu, X.; Bader, M.Y.; Feng, D.; Bao, W. The ‘Plant Economic Spectrum’ in Bryophytes, a Comparative Study in Subalpine Forest. Am. J. Bot. 2017, 104, 261–270. [Google Scholar] [CrossRef]
- Laing, C.G.; Granath, G.; Belyea, L.R.; Allton, K.E.; Rydin, H. Tradeoffs and scaling of functional traits in Sphagnum as drivers of carbon cycling in peatlands. Oikos 2014, 123, 817–828. [Google Scholar] [CrossRef]
- Bengtsson, F.; Granath, G.; Rydin, H. Photosynthesis, growth, and decay traits in Sphagnum—A multispecies comparison. Ecol. Evol. 2016, 6, 3325–3341. [Google Scholar] [CrossRef] [PubMed]
- Wang, Z.; Bader, M.Y. Associations between Shoot-Level Water Relations and Photosynthetic Responses to Water and Light in 12 Moss Species. AoB Plants 2018, 10, ply034. [Google Scholar] [CrossRef] [PubMed]
- Grau-Andrés, R.; Kardol, P.; Gundale, M.J. Trait Coordination in Boreal Mosses Reveals a Bryophyte Economics Spectrum. J. Ecol. 2022, 110, 2493–2506. [Google Scholar] [CrossRef]
- Mazziotta, A.; Granath, G.; Rydin, H.; Bengtsson, F.; Norberg, J. Scaling functional traits to ecosystem processes: Towards a mechanistic understanding in peat mosses. J. Ecol. 2019, 107, 843–859. [Google Scholar] [CrossRef]
- Carriquí, M.; Roig-Oliver, M.; Brodribb, T.J.; Coopman, R.; Gill, W.; Mark, K.; Niinemets, Ü.; Perera-Castro, A.V.; Ribas-Carbó, M.; Sack, L.; et al. Anatomical Constraints to Nonstomatal Diffusion Conductance and Photosynthesis in Lycophytes and Bryophytes. New Phytol. 2019, 222, 1256–1270. [Google Scholar] [CrossRef]
- Ye, Z.-P.; Suggett, D.J.; Robakowski, P.; Kang, H.-J. A Mechanistic Model for the Photosynthesis–Light Response Based on the Photosynthetic Electron Transport of Photosystem II in C3 and C4 Species. New Phytol. 2013, 199, 110–120. [Google Scholar] [CrossRef]
- Song, L.; Zhang, Y.-J.; Chen, X.; Li, S.; Lu, H.-Z.; Wu, C.-S.; Tan, Z.-H.; Liu, W.-Y.; Shi, X.-M. Water Relations and Gas Exchange of Fan Bryophytes and Their Adaptations to Microhabitats in an Asian Subtropical Montane Cloud Forest. J. Plant Res. 2015, 128, 573–584. [Google Scholar] [CrossRef]
- R Core Team. R: A Language and Environment for Statistical Computing; R Foundation for Statistical Computing: Vienna, Austria, 2022. [Google Scholar]
- Wickham, H. Ggplot2: Elegant Graphics for Data Analysis; Springer-Verlag: New York, USA, 2016; ISBN 978-3-319-24277-4. [Google Scholar]
- Lê, S.; Josse, J.; Husson, F. FactoMineR: AnRPackage for Multivariate Analysis. J. Stat. Softw. 2008, 25, 1–18. [Google Scholar] [CrossRef]
- Oksanen, J.; Simpson, G.L.; Blanchet, F.G.; Kindt, R.; Legendre, P.; Minchin, P.R.; O’Hara, R.B.; Solymos, P.; Stevens, M.H.H.; Szoecs, E.; et al. Vegan: Community Ecology Package. 2022. Available online: https://CRAN.R-project.org/package=vegan (accessed on 25 January 2024).
- Bates, D.; Mächler, M.; Bolker, B.; Walker, S. Fitting Linear Mixed-Effects Models Using Lme4. J. Stat. Softw. 2015, 67, 1–48. [Google Scholar] [CrossRef]
- Kuznetsova, A.; Brockhoff, P.B.; Christensen, R.H.B. lmerTest Package: Tests in Linear Mixed Effects Models. J. Stat. Softw. 2017, 82, 1–26. [Google Scholar] [CrossRef]
- Lüdecke, D. Sjstats: Statistical Functions for Regression Models (Version 0.18.2). 2022. Available online: https://CRAN.R-project.org/package=sjstats (accessed on 25 January 2024).
- Asefa, M.; Cao, M.; Zhang, G.; Ci, X.; Li, J.; Yang, J. Environmental Filtering Structures Tree Functional Traits Combination and Lineages across Space in Tropical Tree Assemblages. Sci. Rep. 2017, 7, 132. [Google Scholar] [CrossRef]
- Turberville, C.M.; Fuentes-González, J.A.; Rogers, S.; Pienaar, J. Moss Phyllid Morphology Varies Systematically with Substrate Slope. Plant Ecol. Evol. 2021, 154, 419–431. [Google Scholar] [CrossRef]
- Fleischbein, K.; Wilcke, W.; Goller, R.; Boy, J.; Valarezo, C.; Zech, W.; Knoblich, K. Rainfall Interception in a Lower Montane Forest in Ecuador: Effects of Canopy Properties. Hydrol. Process. 2005, 19, 1355–1371. [Google Scholar] [CrossRef]
- Mackelprang, R.; Vaishampayan, P.; Fisher, K. Adaptation to Environmental Extremes Structures Functional Traits in Biological Soil Crust and Hypolithic Microbial Communities. mSystems 2022, 7, e01419-21. [Google Scholar] [CrossRef]
- Zhao, Y.-T.; Ali, A.; Yan, E.-R. The Plant Economics Spectrum Is Structured by Leaf Habits and Growth Forms across Subtropical Species. Tree Physiol. 2017, 37, 173–185. [Google Scholar] [CrossRef] [PubMed]
- Li, L.; McCormack, M.L.; Ma, C.; Kong, D.; Zhang, Q.; Chen, X.; Zeng, H.; Niinemets, Ü.; Guo, D. Leaf Economics and Hydraulic Traits Are Decoupled in Five Species-rich Tropical-subtropical Forests. Ecol. Lett. 2015, 18, 899–906. [Google Scholar] [CrossRef] [PubMed]
- Hájek, T.; Ballance, S.; Limpens, J.; Zijlstra, M.; Verhoeven, J.T.A. Cell-Wall Polysaccharides Play an Important Role in Decay Resistance of Sphagnum and Actively Depressed Decomposition in Vitro. Biogeochemistry 2011, 103, 45–57. [Google Scholar] [CrossRef]
- Robinson, S.A.; Waterman, M.J. Sunsafe Bryophytes: Photoprotection from Excess and Damaging Solar Radiation. In Photosynthesis in Bryophytes and Early Land Plants; Hanson, D.T., Rice, S.K., Eds.; Advances in Photosynthesis and Respiration; Springer: Dordrecht, The Netherlands, 2014; pp. 113–130. ISBN 978-94-007-6988-5. [Google Scholar]
- Wang, Z.; Bao, W.; Feng, D.; Lin, H. Functional trait scaling relationships across 13 temperate mosses growing in wintertime. Ecol. Res. 2014, 29, 629–639. [Google Scholar] [CrossRef]
- Rice, S.K.; Neal, N.; Mango, J.; Black, K. Relationships among Shoot Tissue, Canopy and Photosynthetic Characteristics in the Feathermoss Pleurozium Schreberi. Bryol. 2011, 114, 367–378. [Google Scholar] [CrossRef]
Figure 1.
Location of study regions and sample distribution of the mosses.
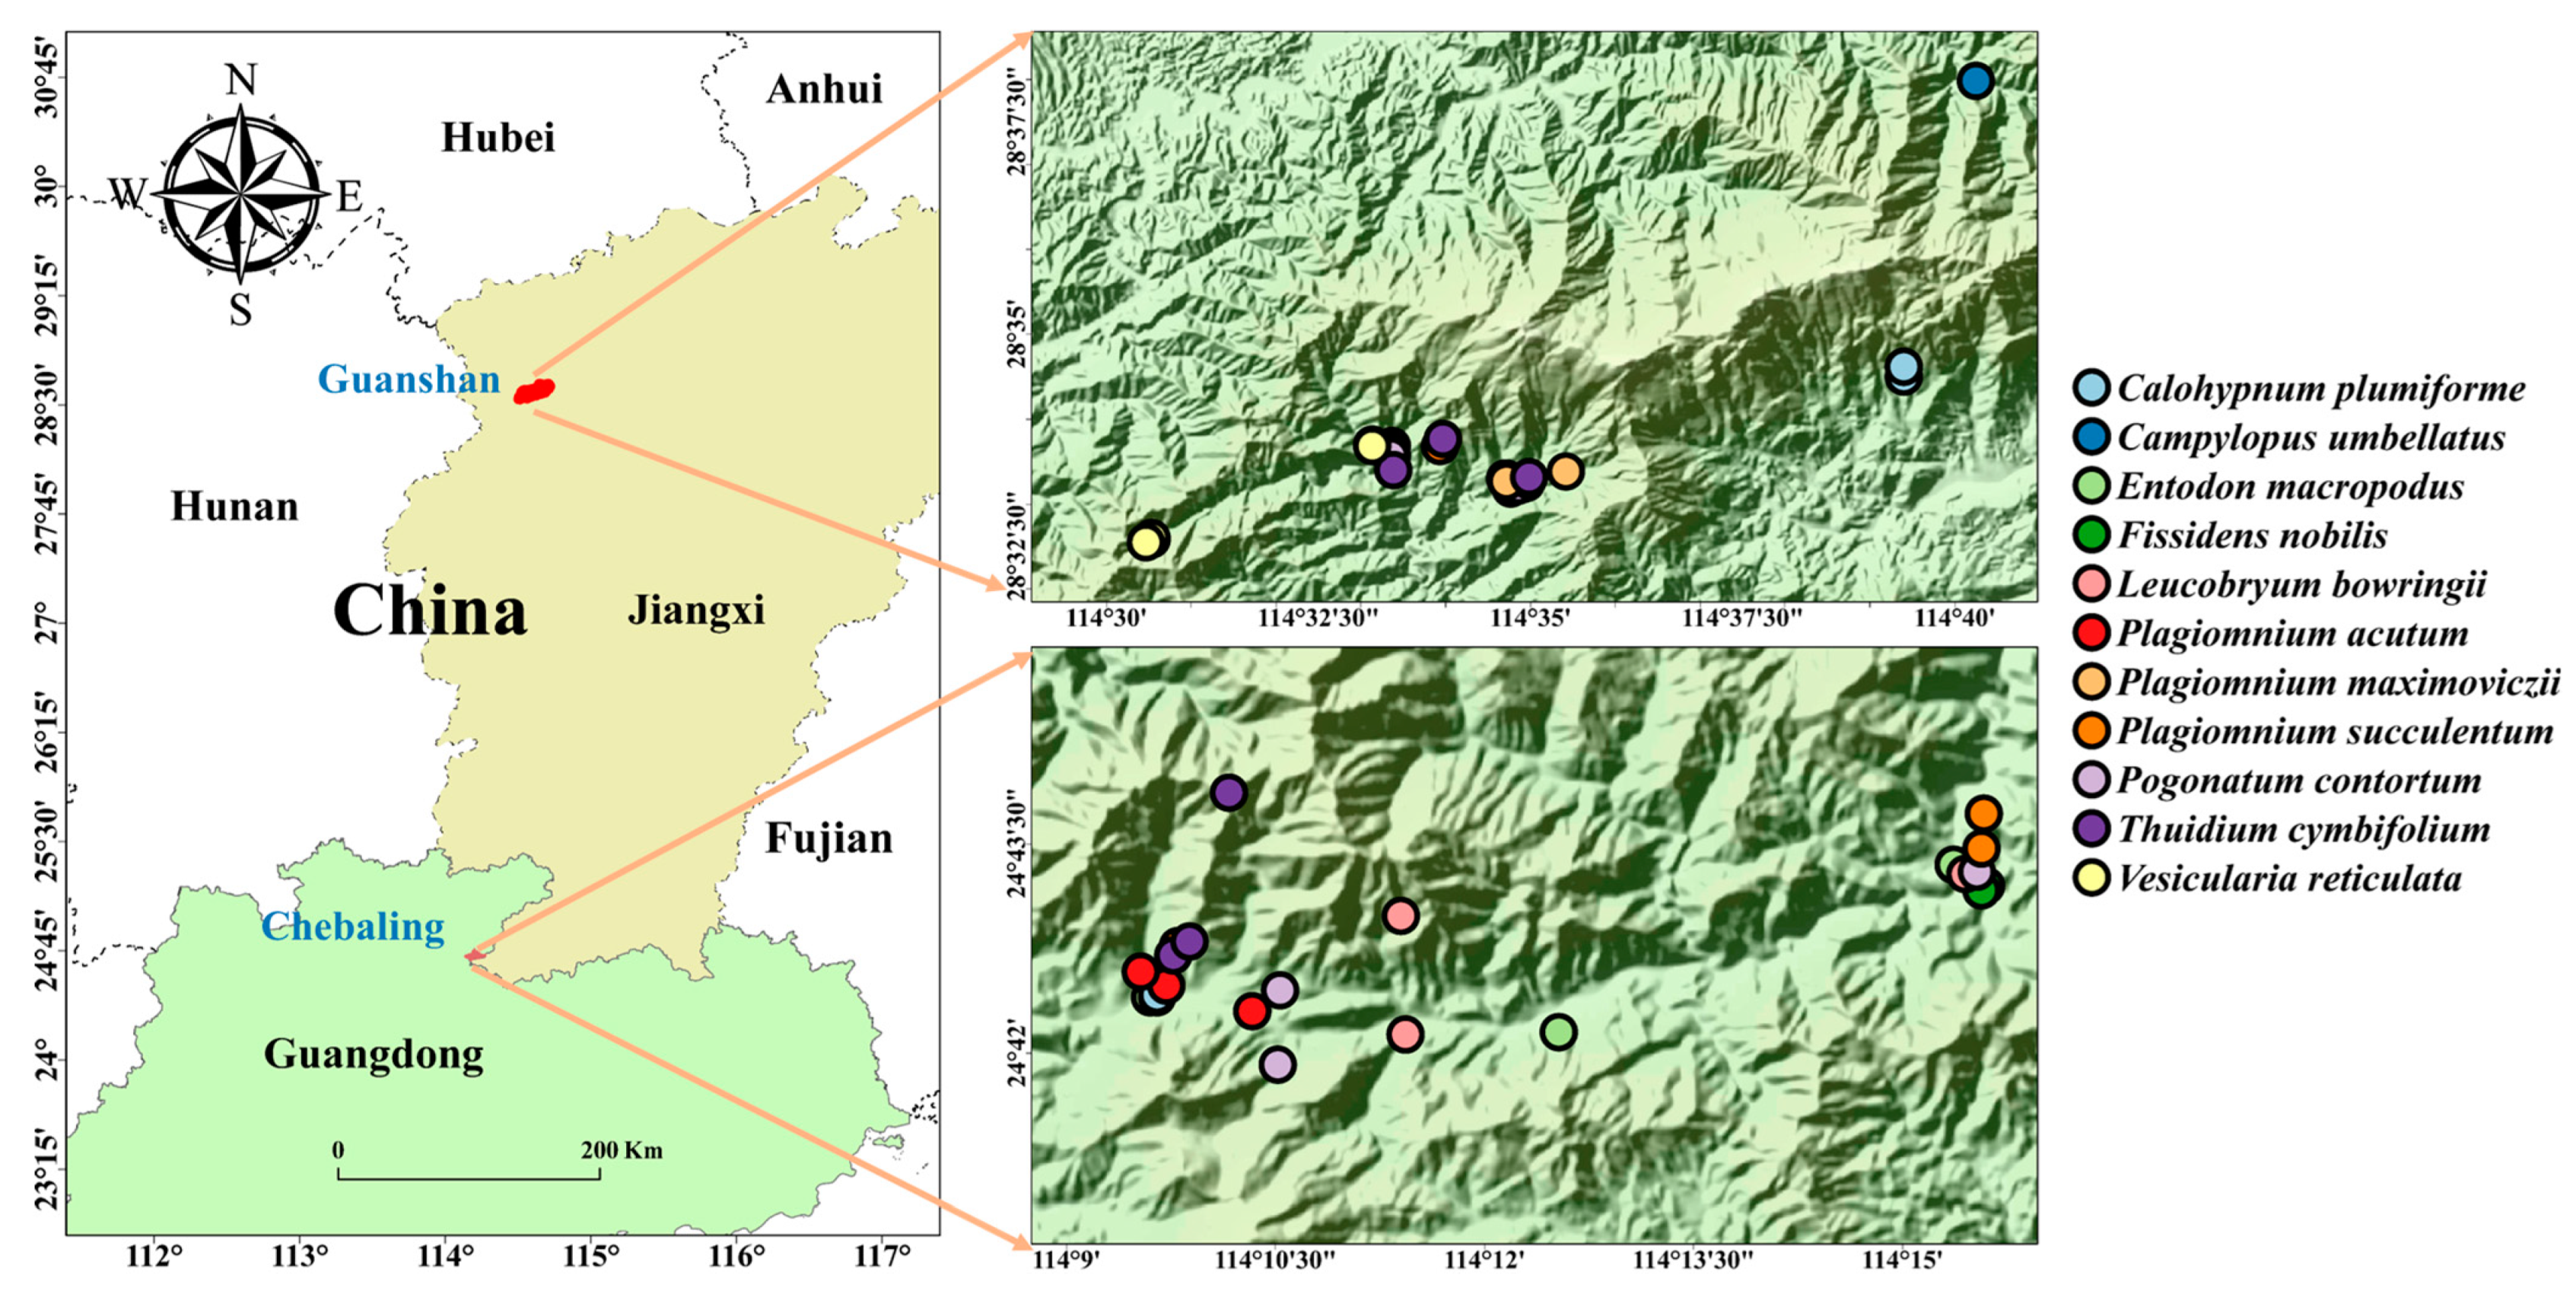
Figure 2.
Principal component analysis (PCA) showed the relationship between functional traits of mosses (A,C,E) and the ordination of samples (B,D,F) along the first and fourth principal component axes (PCs). To enhance our understanding of the relationship between these functional traits, the traits with loadings simultaneously less than 0.3 in PC1 and PC2, or PC3 and PC4, were hidden from (A,C,E). Red arrows: architectural traits; blue arrows: traits related to nutrient content; green arrows: traits related to photosynthesis process and water retention capacity; black arrows: environmental gradient with significant impact on functional traits. CBL represents the Chebaling National Nature Reserve, while GS represents the Guanshan National Nature Reserve. Other abbreviations can be seen in Table 2.

Figure 3.
Bi-variate relationship between functional traits and environmental gradients evaluated by Spearman (A) and Pearson (B) correlation. Only the significant relationship (p < 0.05) was shown in the heatmaps.
Figure 3.
Bi-variate relationship between functional traits and environmental gradients evaluated by Spearman (A) and Pearson (B) correlation. Only the significant relationship (p < 0.05) was shown in the heatmaps.


Table 1.
The family, life forms, substrate, and sampled region of the 11 species of mosses in the study. CBL: Chebaling, GS: Guanshan.
Table 1.
The family, life forms, substrate, and sampled region of the 11 species of mosses in the study. CBL: Chebaling, GS: Guanshan.
| Family | Species | Life-Form | Substrate | Region |
|---|---|---|---|---|
| Fissidentaceae | Fissidens nobilis | Fan | Soil/Rock | CBL/GS |
| Hypnaceae | Calohypnum plumiforme | Weft | Soil/Rock | CBL/GS |
| Vesicularia reticulata | Weft | Soil/Rock/Rotten wood | GS | |
| Leucobryaceae | Leucobryum bowringii | Cushion | Soil | CBL/GS |
| Campylopus umbellatus | Turf | Soil/Rock | GS | |
| Mniaceae | Plagiomnium acutum | Rough mat | Soil | CBL/GS |
| Plagiomnium succulentum | Rough mat | Rock/Rotten wood | CBL/GS | |
| Plagiomnium maximoviczii | Turf | Soil | GS | |
| Polytrichaceae | Pogonatum contortum | Turf | Soil | CBL/GS |
| Thuidiaceae | Thuidium cymbifolium | Weft | Soil/Rock | CBL/GS |
| Entodonaceae | Entodon macropodus | Weft | Rock/Rotten Wood | CBL |
Table 2.
Functional trait symbols and units.
| Traits | Code | Unit | Mean ± SD | CV |
|---|---|---|---|---|
| Photosynthesis progress | ||||
| Saturation irradiance | Is | µmol photons m−2 s−1 | 748.71 ± 247.57 | 0.33 |
| Compensation irradiance | Ic | µmol photons m−2 s−1 | 21.72 ± 13.45 | 0.62 |
| Light-saturated assimilation rate per mass | Amass | nmol CO2 g−1 s−1 | 21.01 ± 11.79 | 0.56 |
| Light-saturated assimilation rate per area | Aarea | μmol CO2 m−2 s−1 | 75.24 ± 44.34 | 0.69 |
| Light-saturated assimilation rate per chlorophyll | AChl | nmol CO2 g−1 s−1 | 2.86 ± 2.15 | 0.75 |
| Photosynthetic N use efficiency | AN | nmol CO2 g−1 s−1 | 1.14 ± 0.62 | 0.54 |
| Photosynthetic P use efficiency | AP | nmol CO2 g−1 s−1 | 16.9 ± 11.52 | 0.68 |
| Dark respiration per mass | Rdmass | nmol CO2 g−1 s−1 | 20.51 ± 9.60 | 0.47 |
| Dark respiration per area | Rdarea | μmol CO2 m−2 s−1 | 0.79 ± 0.47 | 0.60 |
| Dark respiration rate/maximum photosynthetic rate | Rd/A | Dimensionless | 1.55 ± 2.06 | 1.32 |
| Optimal photochemical efficiency of PSII | Fv/Fm | Dimensionless | 0.66 ± 0.03 | 0.05 |
| Actual photochemical efficiency of PSII | φPSII | Dimensionless | 0.39 ± 0.14 | 0.35 |
| Photochemical quenching | qP | Dimensionless | 0.44 ± 0.12 | 0.28 |
| Nonphotochemical quenching | NPQ | Dimensionless | 3.36 ± 1.56 | 0.46 |
| Chlorophyll per mass | Chlmass | mg g−1 | 8.36 ± 2.91 | 0.35 |
| Chlorophyll per area | Chlarea | g m−2 | 3.58 ± 1.63 | 0.47 |
| Water retention capacity | ||||
| Maximum water content | WCmax | % of d.w. | 432.16 ± 191.13 | 0.44 |
| Water loss decaying constant | DC | ×10−3 | 16.01 ± 7.82 | 0.48 |
| Nutrient content | ||||
| Organic carbon per mass | Cmass | mg g−1 | 377.57 ± 31.26 | 0.08 |
| Organic carbon per area | Carea | g m−2 | 14.87 ± 7.94 | 0.47 |
| Total nitrogen per mass | Nmass | mg g−1 | 18.82 ± 4.60 | 0.24 |
| Total nitrogen per area | Narea | g m−2 | 0.69 ± 0.28 | 0.40 |
| Total phosphorus per mass | Pmass | mg g−1 | 1.44 ± 0.60 | 0.41 |
| Total nitrogen per area | Parea | g m−2 | 0.05 ± 0.02 | 0.45 |
| C:N ratio | C/N | Dimensionless | 21.22 ± 5.23 | 0.25 |
| C:P ratio | C/P | Dimensionless | 313.67 ± 141.89 | 0.45 |
| N:P ratio | N/P | Dimensionless | 14.45 ± 4.13 | 0.28 |
| Architectural traits | ||||
| Costa length | CL | mm | 3.75 ± 2.70 | 0.72 |
| Costa width | CW | mm | 24.52 ± 21.51 | 0.88 |
| Leaf length | LL | mm | 4.12 ± 2.32 | 0.56 |
| Maximum leaf width | LW | mm | 1.29 ± 0.84 | 0.65 |
| Leaf area | LA | mm | 4.09 ± 4.47 | 1.09 |
| Shoot mass per area | SMA | g m−2 | 39.01 ± 17.88 | 0.46 |
| Cross-axis area of central strand | CAA | mm2 | 0.003 ± 0.002 | 0.79 |
| Cross-sectional area of shoot | CSA | mm2 | 0.08 ± 0.03 | 0.40 |
| Perimeter2⁄area | P2/A | Dimensionless | 52.29 ± 30.75 | 0.58 |
| Leaf length-to-width ratio | L/W | Dimensionless | 3.75 ± 2.38 | 0.63 |
| Cells per area | CPA | cells mm−2 | 666.70 ± 536.87 | 0.81 |
| Cell lumen length | CLL | µm | 41.98 ± 30/32 | 0.72 |
| Cell lumen width | CLW | µm | 12.83 ± 12.4 | 0.97 |
| Cell lumen area | CLA | µm2 | 582.44 ± 981.12 | 1.68 |
| Cell wall thickness | CWT | µm | 2.23 ± 0.80 | 0.36 |
Table 3.
The effects of environmental gradients on the first four principal components estimated using fixed effect and mixed effect models. Mixed-effect models with species or species nested within regions as random effects were, respectively, established.
Table 3.
The effects of environmental gradients on the first four principal components estimated using fixed effect and mixed effect models. Mixed-effect models with species or species nested within regions as random effects were, respectively, established.
| Models | Statistics | PC1 | PC2 | PC3 | PC4 | |
| Fixed | Estimate | Slope | −0.01 | −0.04 ** | −0.03 * | −0.02 |
| Canopy density | −1.62 * | 0.63 | 0.41 | −1.01 * | ||
| Water availability | −2.16 ** | 0.40 | −0.71 | −1.52 ** | ||
| R2 | Slope | 0.01 | 0.12 ** | 0.12 * | 0.05 | |
| Canopy density | 0.10 * | 0.02 | 0.01 | 0.09 | ||
| Water availability | 0.16 ** | 0.01 | 0.03 | 0.18 ** | ||
| Mixed (Species) | Estimate | Slope | 0.00 | −0.03 * | 0.00 | 0.00 |
| Canopy density | −0.10 | 0.44 | −0.13 | −0.00 | ||
| Water availability | −0.14 | −0.26 | 0.11 | −1.23 * | ||
| Marginal R2 | Slope | 0.00 | 0.09 * | 0.00 | 0.00 | |
| Canopy density | 0.00 | 0.01 | 0.00 | 0.00 | ||
| Water availability | 0.00 | 0.00 | 0.00 | 0.12 * | ||
| Conditional R2 | Slope | 0.938 *** | 0.30 * | 0.81 *** | 0.71 *** | |
| Canopy density | 0.935 *** | 0.33 ** | 0.81 *** | 0.72 *** | ||
| Water availability | 0.935 *** | 0.36 ** | 0.81 *** | 0.72 *** | ||
| Mixed (Species nested within region) | Estimate | Slope | −0.00 | −0.03 * | 0.01 | 0.00 |
| Canopy density | −0.14 | 0.79 | −0.14 | 0.04 | ||
| Water availability | −0.19 | −0.54 | 0.02 | −1.29 * | ||
| Marginal R2 | Slope | 0.00 | 0.10 * | 0.00 | 0.00 | |
| Canopy density | 0.00 | 0.04 | 0.00 | 0.00 | ||
| Water availability | 0.00 | 0.02 | 0.00 | 0.13 * | ||
| Conditional R2 | Slope | 0.95 *** | 0.56 *** | 0.85 *** | 0.73 *** | |
| Canopy density | 0.95 *** | 0.59 *** | 0.83 *** | 0.74 *** | ||
| Water availability | 0.95 *** | 0.60 *** | 0.83 *** | 0.83 *** | ||
Significant results are bolded. * p ≤ 0.05. ** p ≤ 0.01. *** p ≤ 0.001.
Disclaimer/Publisher’s Note: The statements, opinions and data contained in all publications are solely those of the individual author(s) and contributor(s) and not of MDPI and/or the editor(s). MDPI and/or the editor(s) disclaim responsibility for any injury to people or property resulting from any ideas, methods, instructions or products referred to in the content. |
© 2024 by the authors. Licensee MDPI, Basel, Switzerland. This article is an open access article distributed under the terms and conditions of the Creative Commons Attribution (CC BY) license (https://creativecommons.org/licenses/by/4.0/).
Share and Cite
MDPI and ACS Style
Liu, Z.; Yi, L.; Zhou, X.; Xiong, Y.; Liu, J.; Qiu, H.; Liu, W. Multiple Dimensions of Functional Traits in Subtropical Montane Mosses. Forests 2024, 15, 587. https://doi.org/10.3390/f15040587
AMA Style
Liu Z, Yi L, Zhou X, Xiong Y, Liu J, Qiu H, Liu W. Multiple Dimensions of Functional Traits in Subtropical Montane Mosses. Forests. 2024; 15(4):587. https://doi.org/10.3390/f15040587
Chicago/Turabian StyleLiu, Zhiwei, Lingli Yi, Xiaohang Zhou, Yong Xiong, Jinhui Liu, Haiyan Qiu, and Weiqiu Liu. 2024. "Multiple Dimensions of Functional Traits in Subtropical Montane Mosses" Forests 15, no. 4: 587. https://doi.org/10.3390/f15040587
Note that from the first issue of 2016, this journal uses article numbers instead of page numbers. See further details here.