Early Effects of Afforestation with Willow (Salix purpurea, “Hotel”) on Soil Carbon and Nutrient Availability

Abstract
:1. Introduction
2. Experimental Section
2.1. Experimental Design

| Site (ID) | Geographic Coordinates | Site History | Soil Texture † | Soil pH (SE) | Mean Annual Precipitation for Production Years (SE) ‡ | Year Planted | Year Sampled | Harvested Biomass (SE) § |
|---|---|---|---|---|---|---|---|---|
| mm | Mg·ha−1 | |||||||
| Ellerslie Research Station, AB (ELL) | 53°25'N 113°31'W | Cereal crops | Silty Clay Loam | 6.0 (0.1) | 404 (43) | 2005 | 2007 | N/A †† |
| Smoky Lake, AB (SMO) | 54°07'N 112°24'W | Tree nursery ¶ | Sandy Loam | 5.1 (0.1) | 412 (27) | 2005 | 2007 | 5.4 (0.1) |
| Lakeshore Tree Nursery, SK (LAK) | 52°00'N 106°45'W | Pasture | Silty Clay Loam | 8.3 (0.0) | 454 (53) | 2005 | 2007 | 18.4 (1.2) |
| University of Saskatchewan, SK (UOS) | 52°07'N 106°36'W | Cereal crops | Clay | 6.6 (0.1) | 382 (74) | 2006 | 2008 | 5.3 (0.8) |
| Portage la Prairie, MB (POR) | 49°57'N 98°10'W | Vegetables | Silt Loam | 8.3 (0.0) | 523 (88) | 2005 | 2007 | 22.8 (3.2) |
| Bird’s Hill, MB (BIR) | 50°00'N 97°00'W | Pasture | Heavy Clay | 8.3 (0.1) | 538 (91) | 2005 | 2007 | N/A †† |
| Sault Ste Marie, ON (SSM) | 46°32'N 84°24'W | Managed forest | Sandy Clay Loam | 5.4 (0.1) | 826 (56) | 2006 | 2008 | 6.1 (0.3) |
| Guelph, ON (GUE) | 43°33'N 80°13'W | Turf grass | Clay Loam | 6.9 (0.0) | 971 (143) | 2005 # | 2008 | 9.5 (2.5) |
| Pickering, ON (PIC) | 44°00'N 79°01'W | Idle/Failed plantation | Clay | 6.8 (0.2) | 948 (131) | 2006 | 2008 | 14.0 (2.1) |
2.2. Laboratory Analyses
2.3. Statistical Analyses
3. Results and Discussion
| Site | Nutrient Content | ||||
|---|---|---|---|---|---|
| N | P | K | Ca | Mg | |
| kg·ha−1 | |||||
| SMO | 39.7 | 5.7 | 15.2 | 27.1 | 3.7 |
| LAK | 125.4 | 12.4 | 35.9 | 90.9 | 14.3 |
| UOS | 37.8 | 5.1 | 16.9 | 21.7 | 7.1 |
| POR | 103.3 | 15.4 | 40.6 | 119.4 | 15.3 |
| SSM | 41.4 | 3.9 | 9.3 | 35.1 | 4.4 |
| PIC | 100.0 | 15.2 | 28.9 | 73.4 | 6.0 |
| GUE | 51.4 | 9.4 | 15.4 | 56.6 | 5.9 |
| Mean | 71.3 | 9.6 | 23.2 | 60.6 | 8.1 |
3.1. Soil Carbon
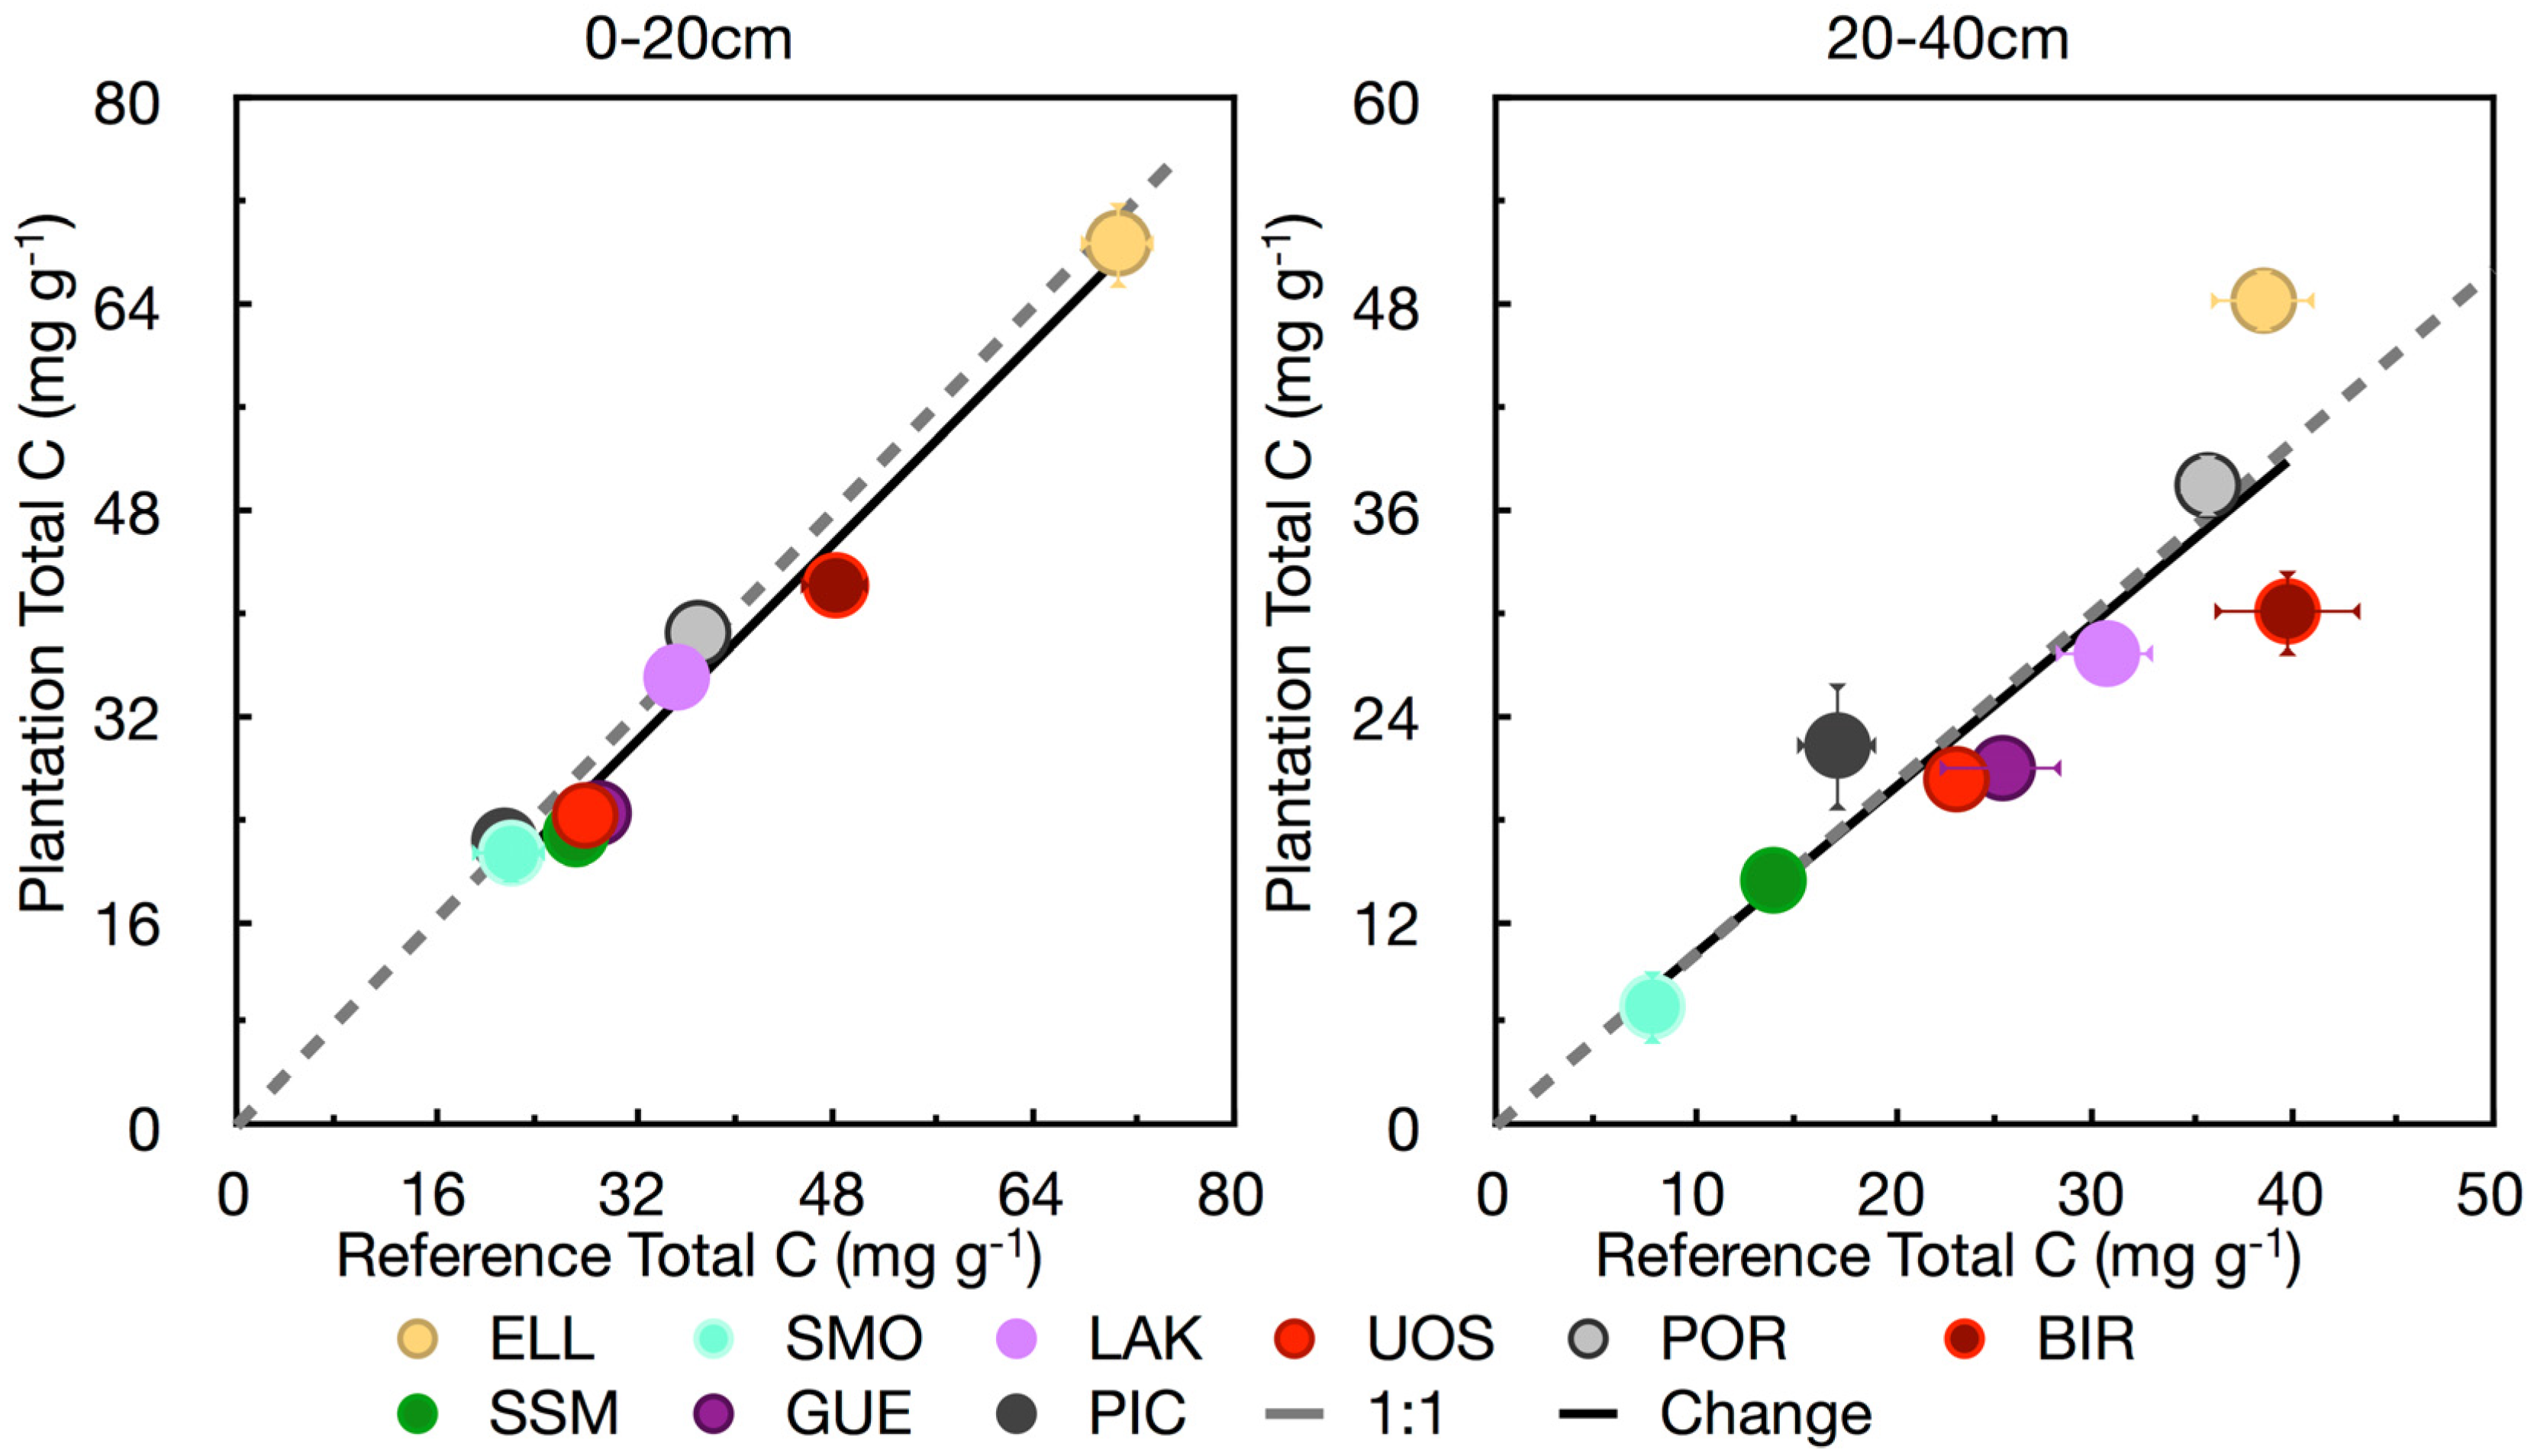
| Variable | 0–20 cm | 20–40 cm |
|---|---|---|
| Total C (mg·g−1) | −2.22 * | −0.43 |
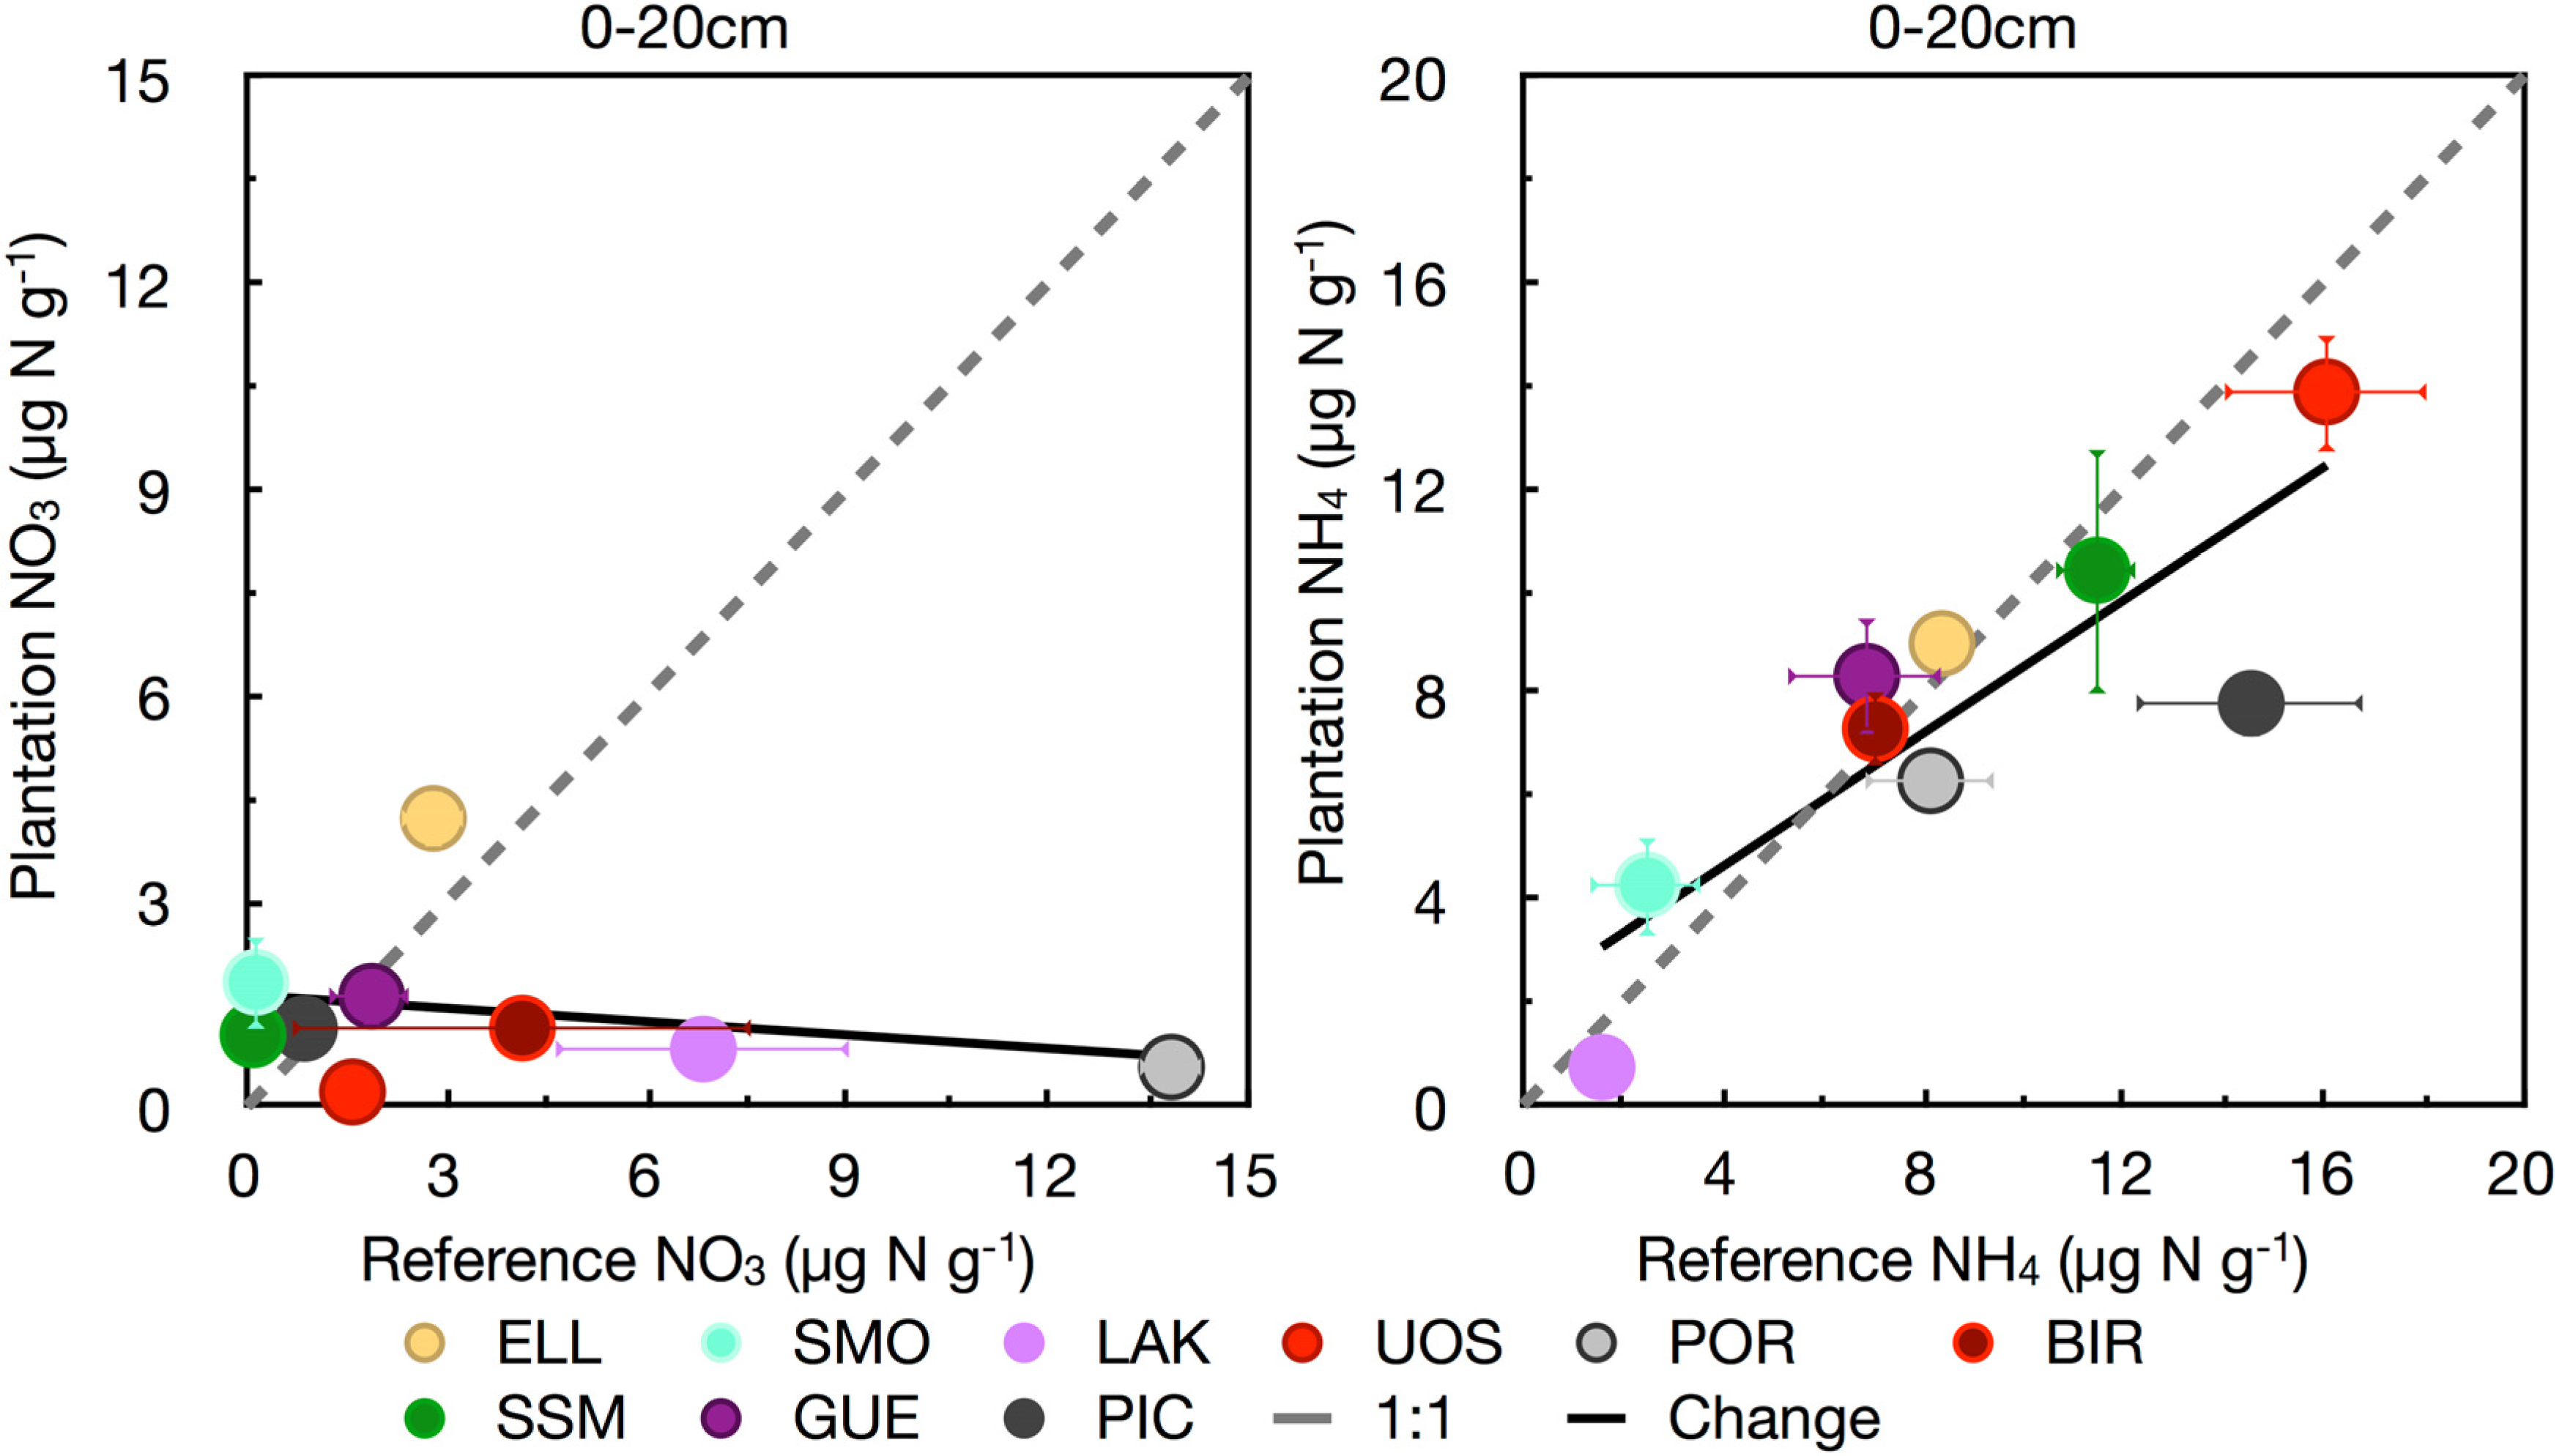
| Inorganic N (μg·N·g−1) | −3.12 † | −2.60 † |
| NH4 (μg·N·g−1) | −0.95 † | −1.38 † |
| NO3 (μg·N·g−1) | −2.17 † | −1.22 † |
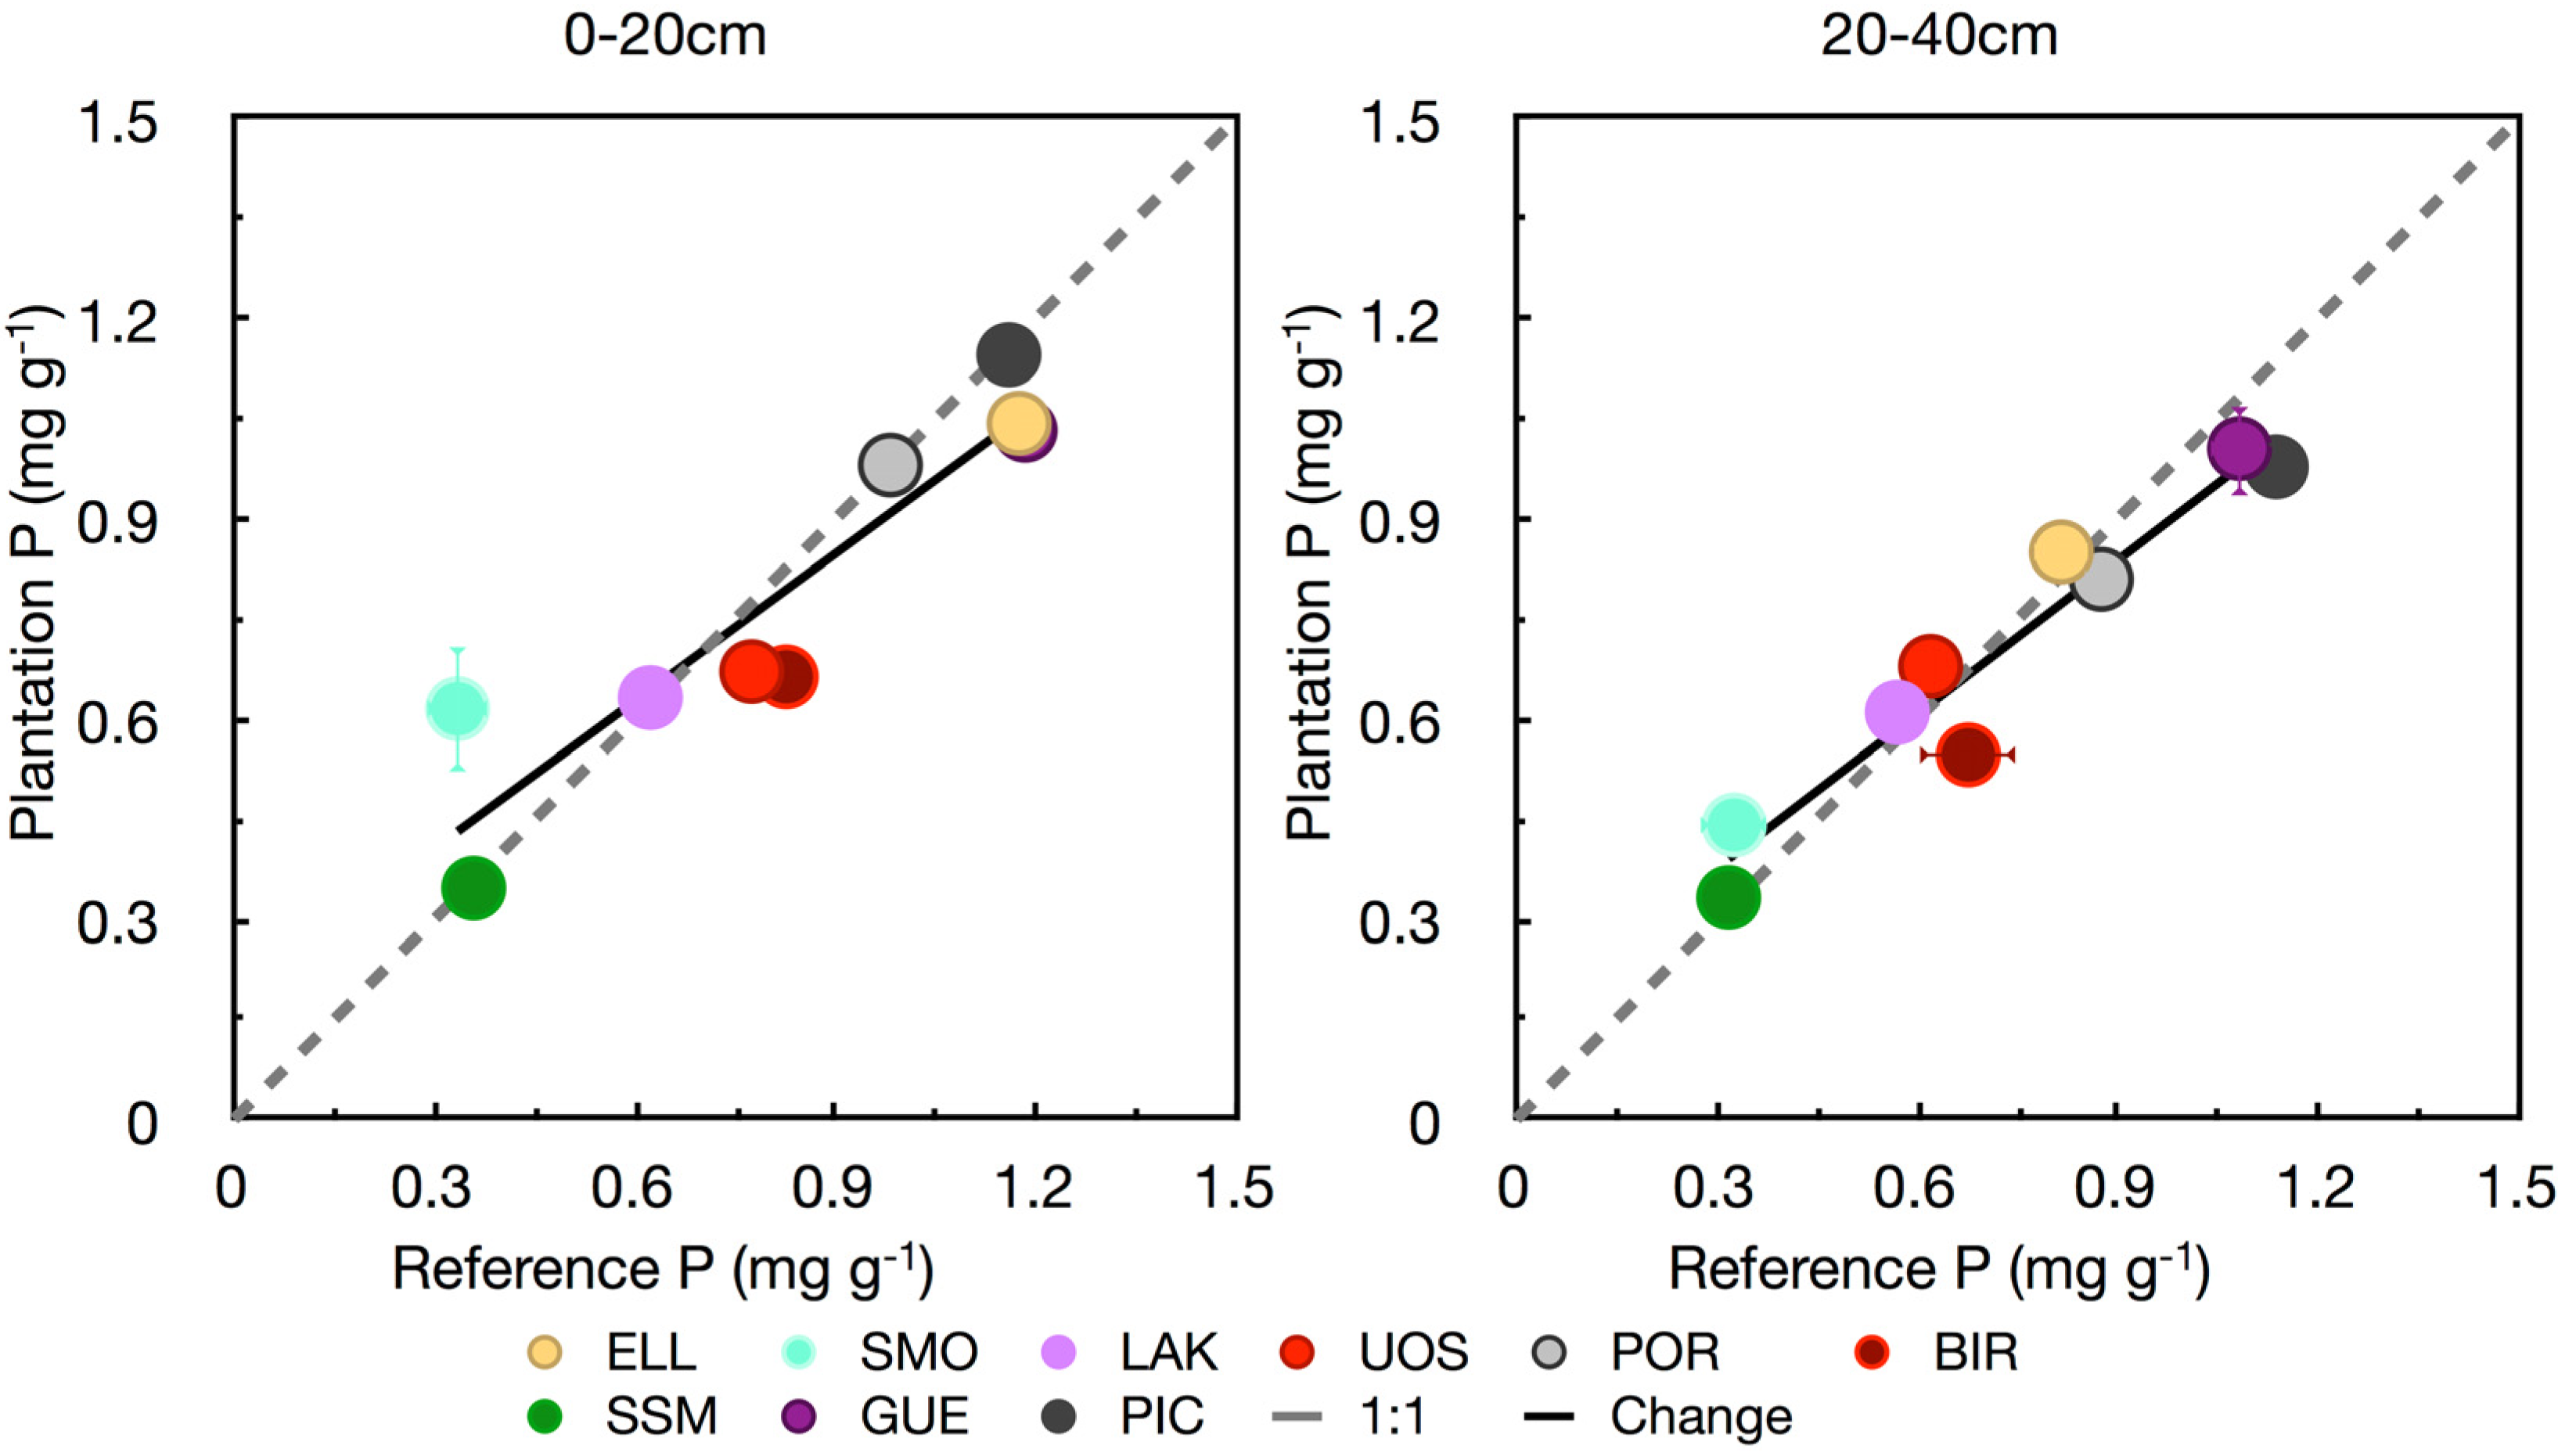
| Leachable P (mg·g−1) | −0.03 † | −0.02 † |
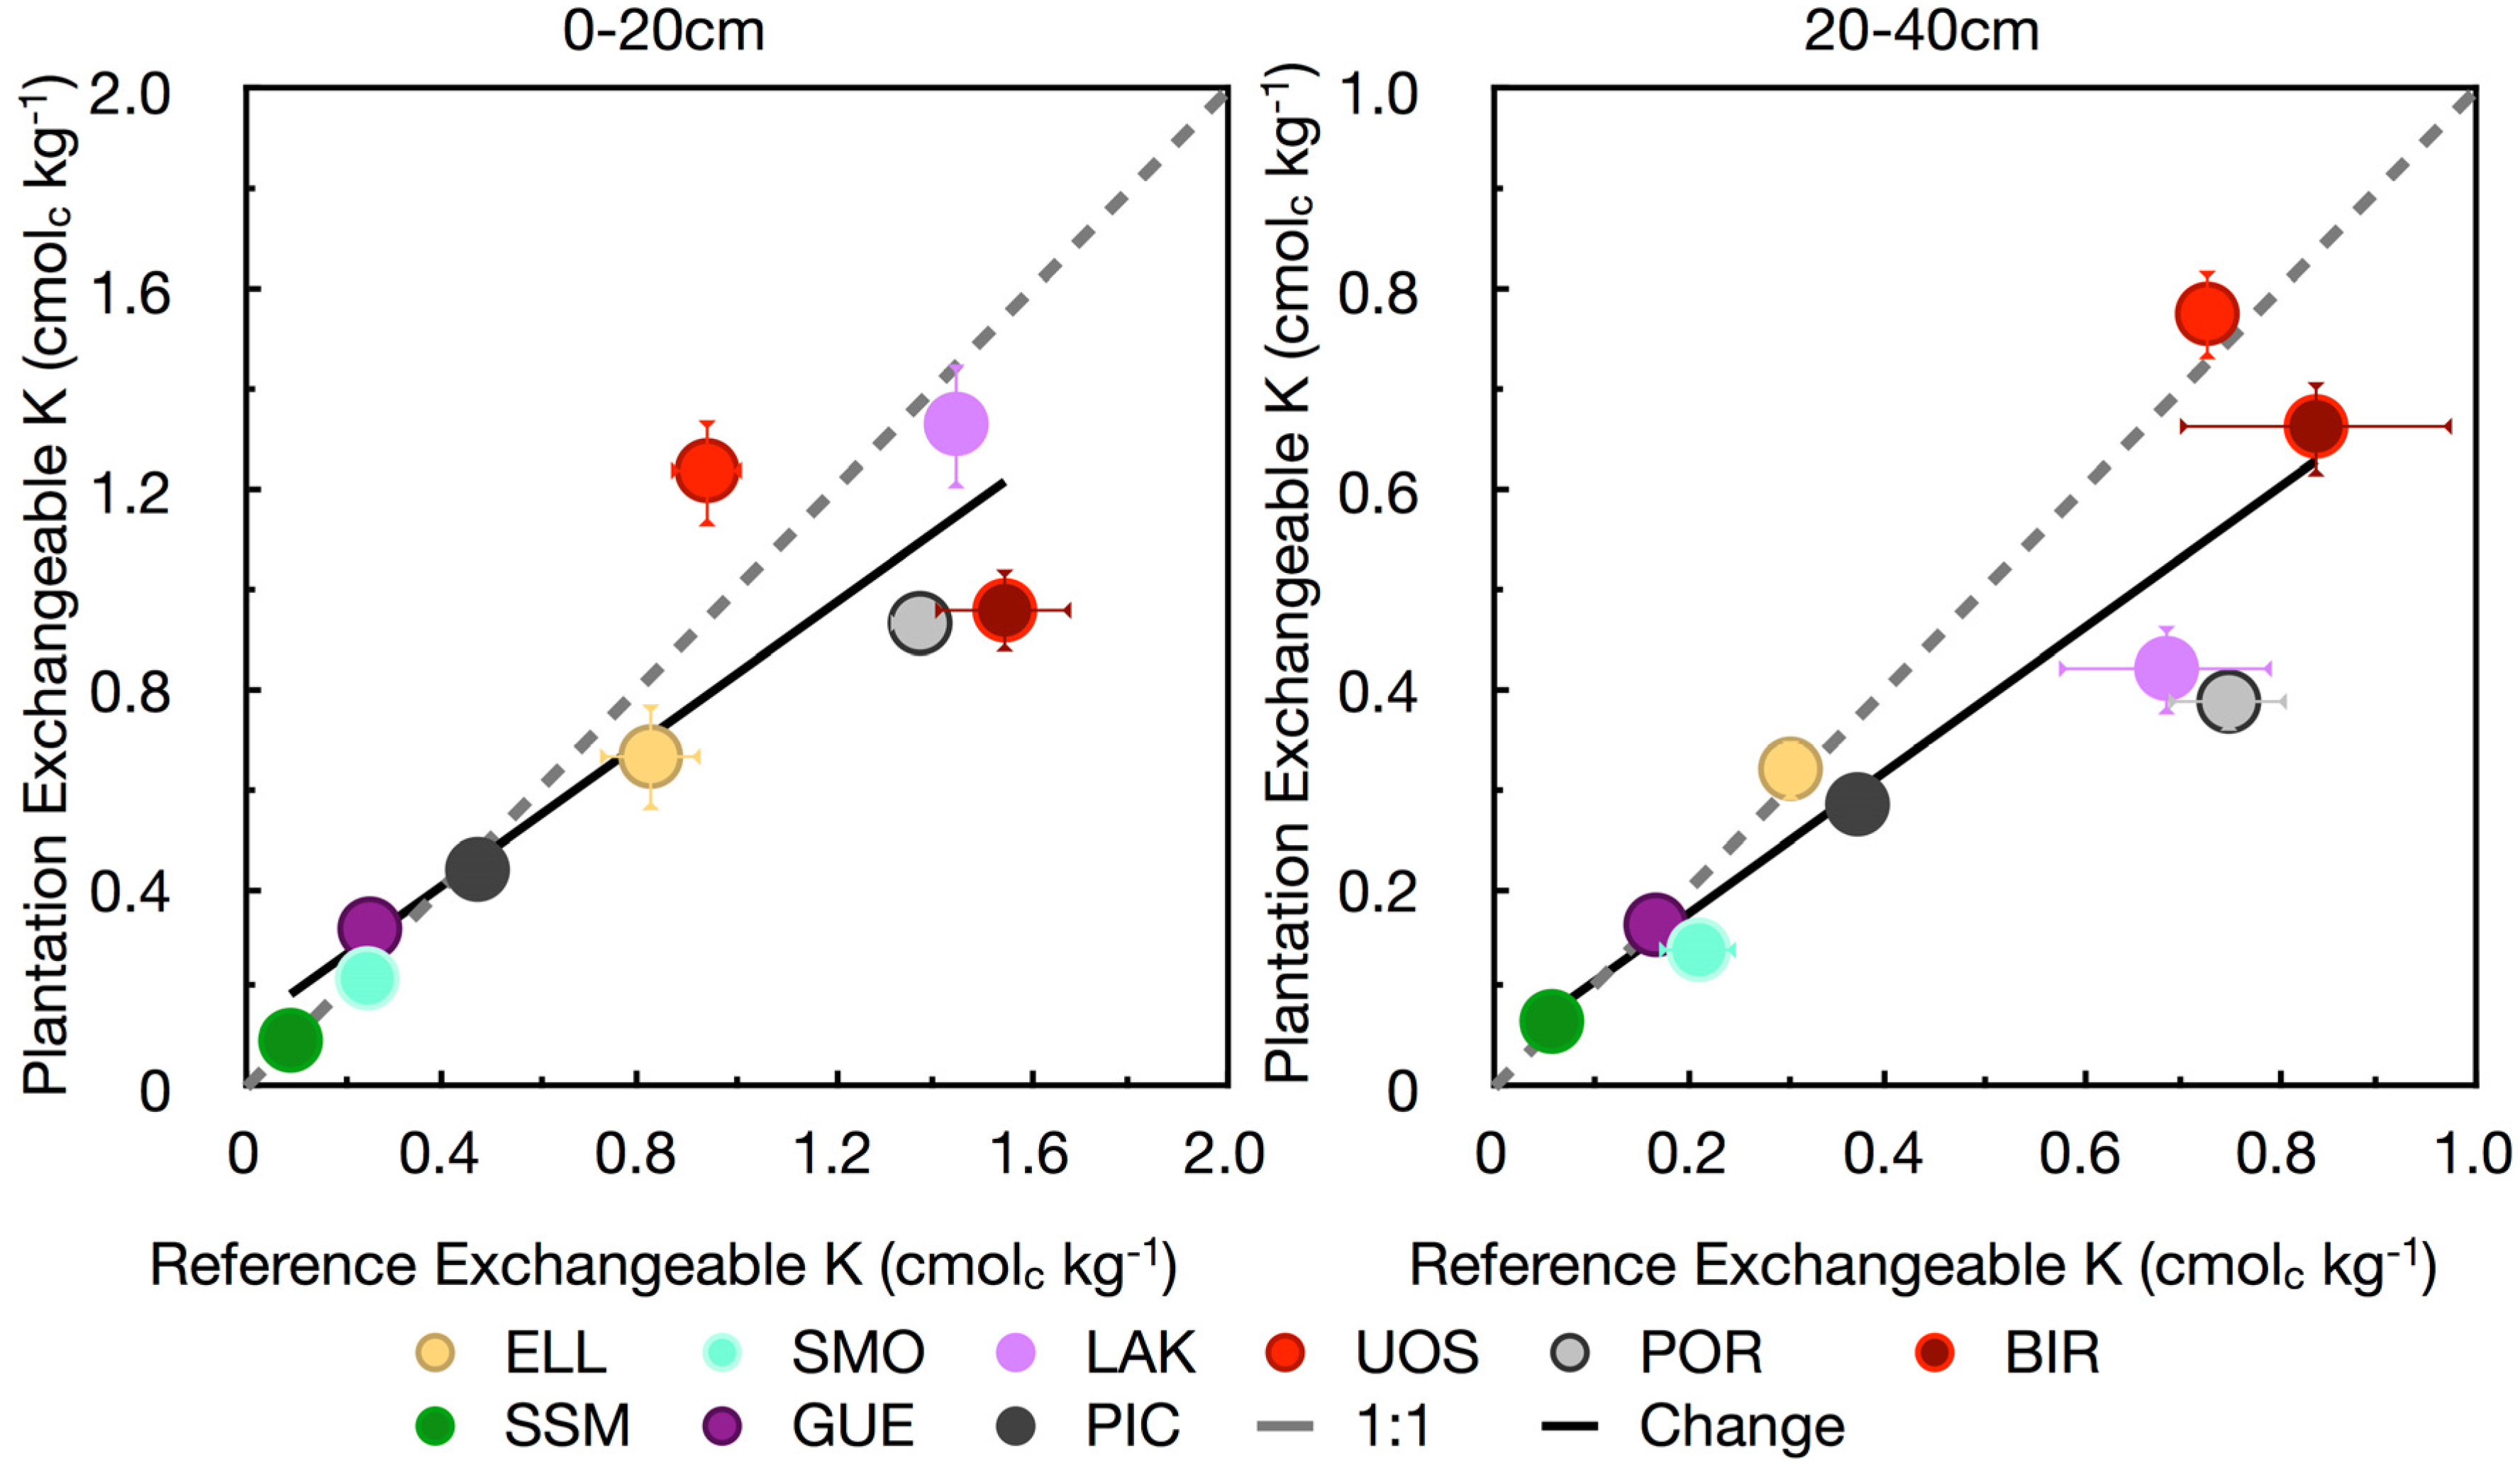
| Exchangeable cations | ||
| K (cmolc·kg−1) | −0.11 † | −0.10 † |
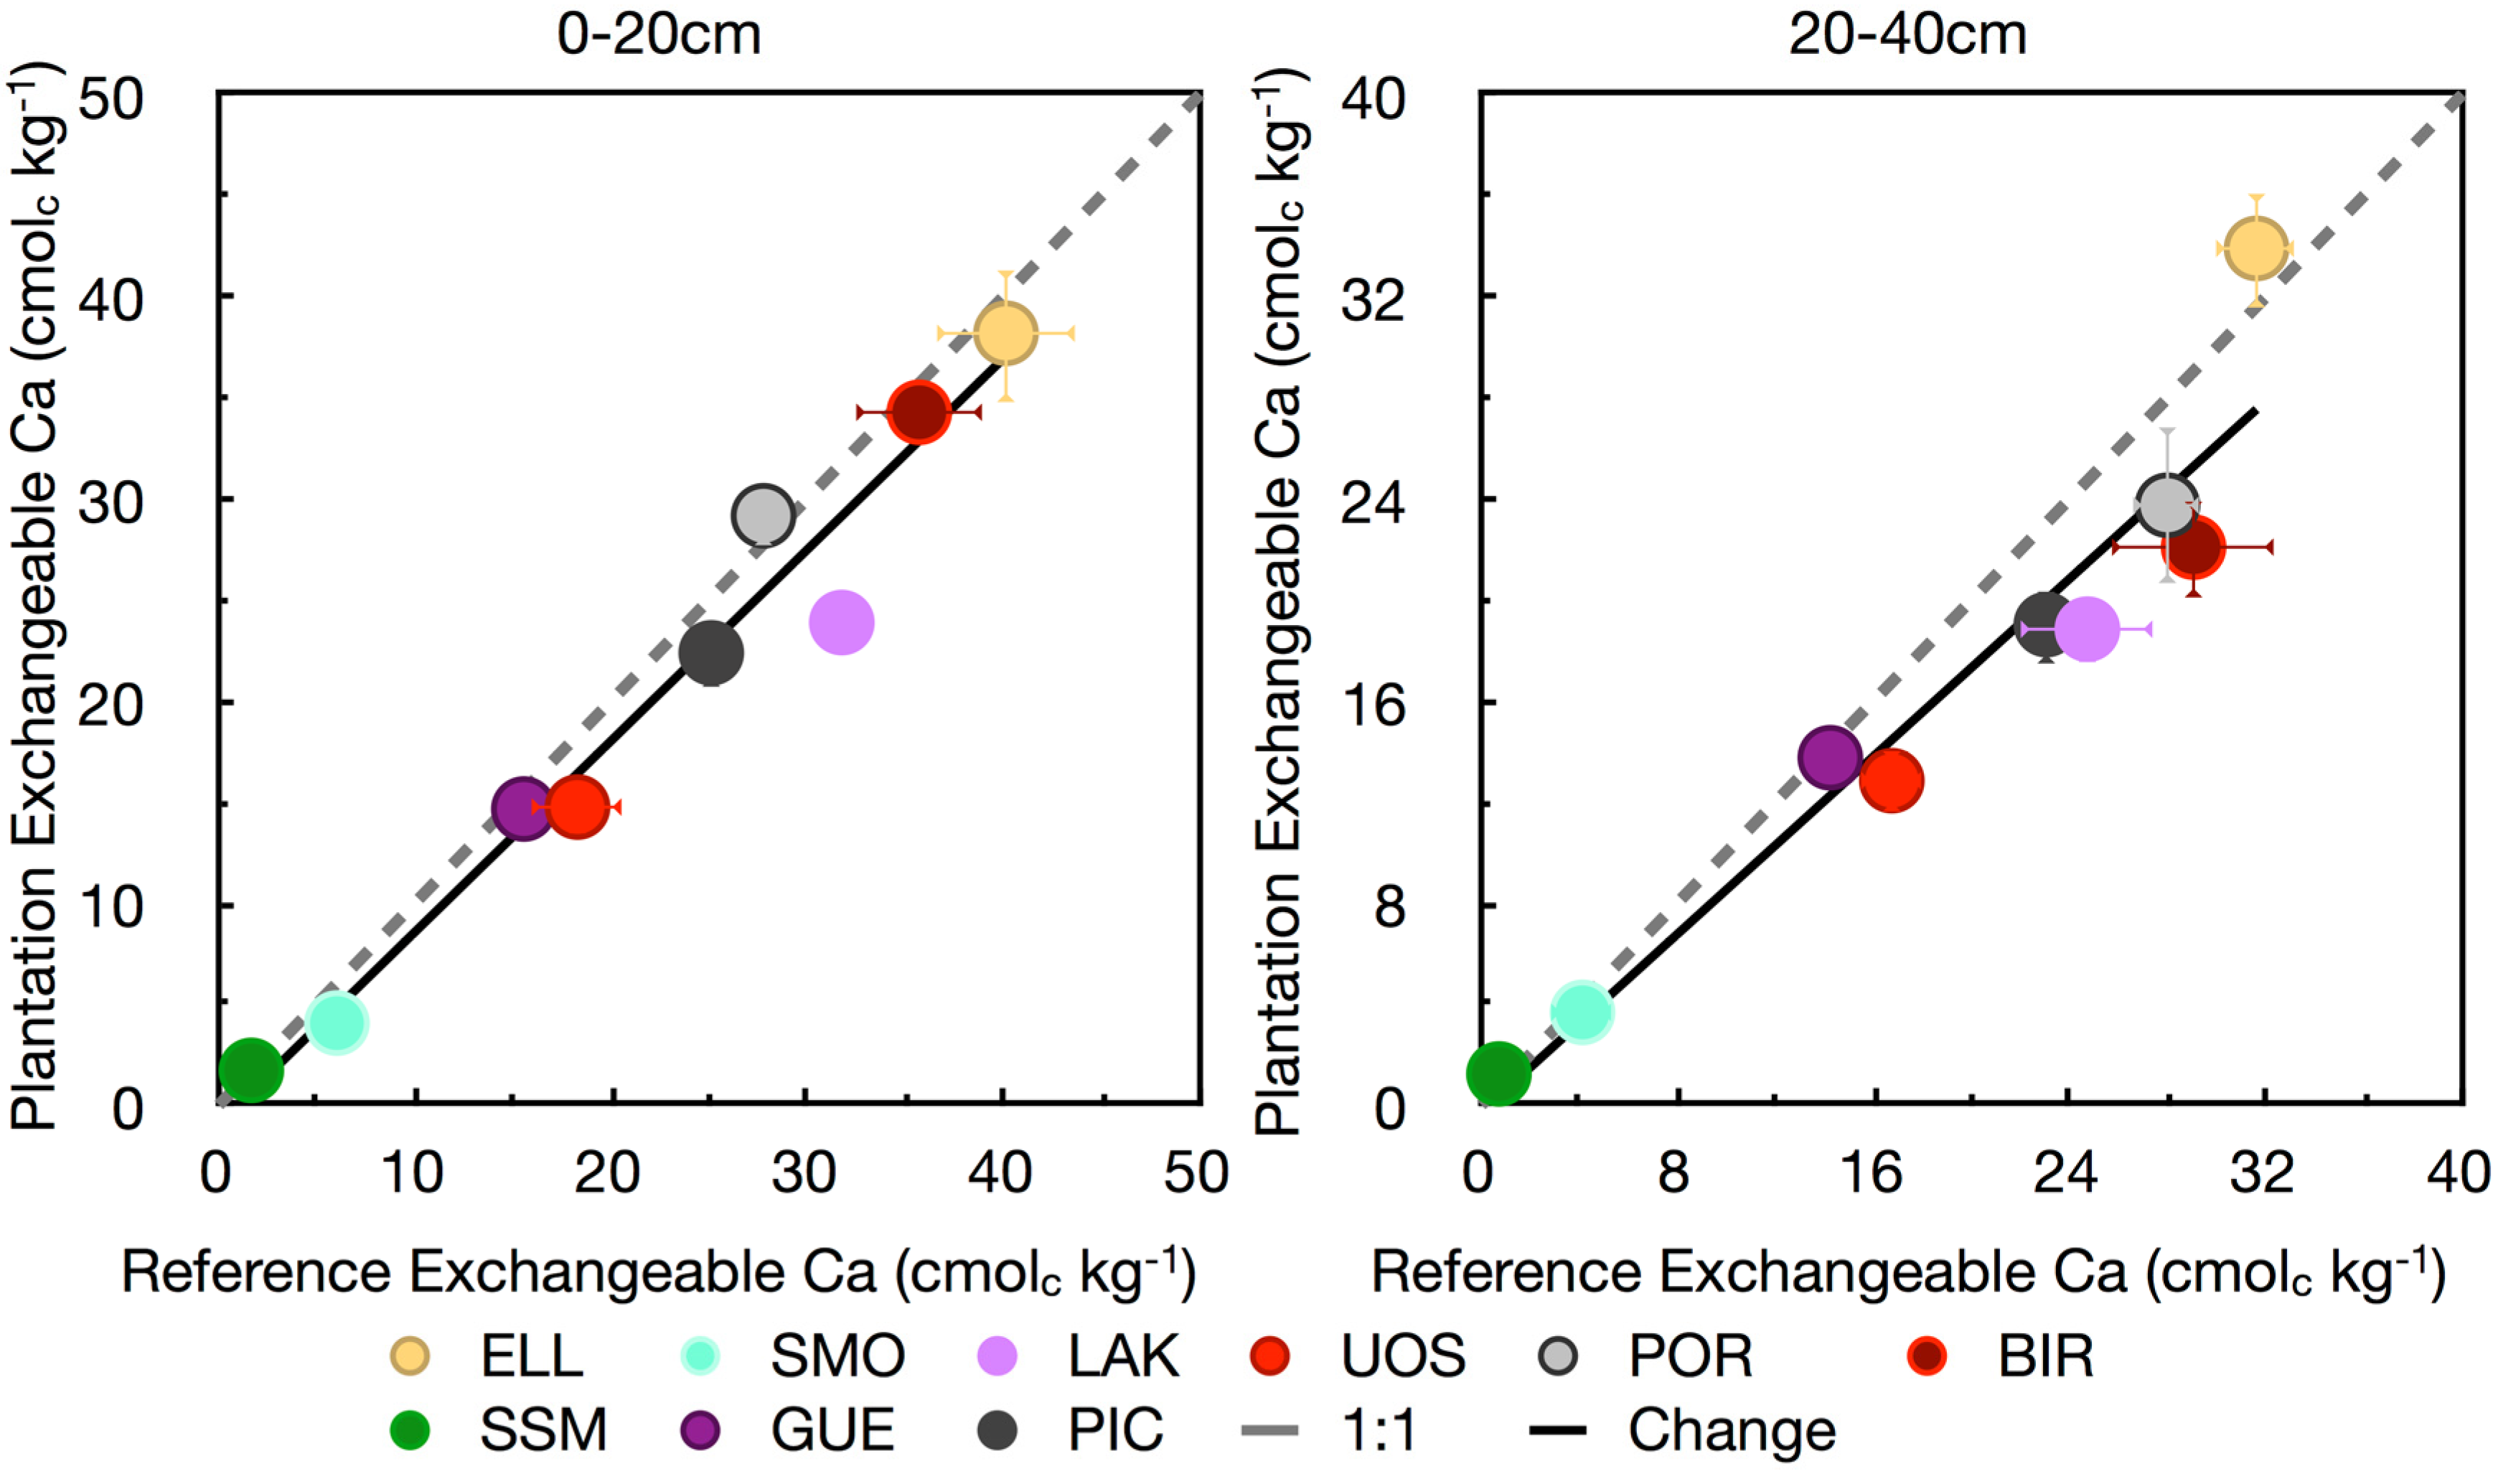
| Ca (cmolc·kg−1) | −2.10 * | −2.57 * |
| Mg (cmolc·kg−1) | 0.30 | −0.11 |
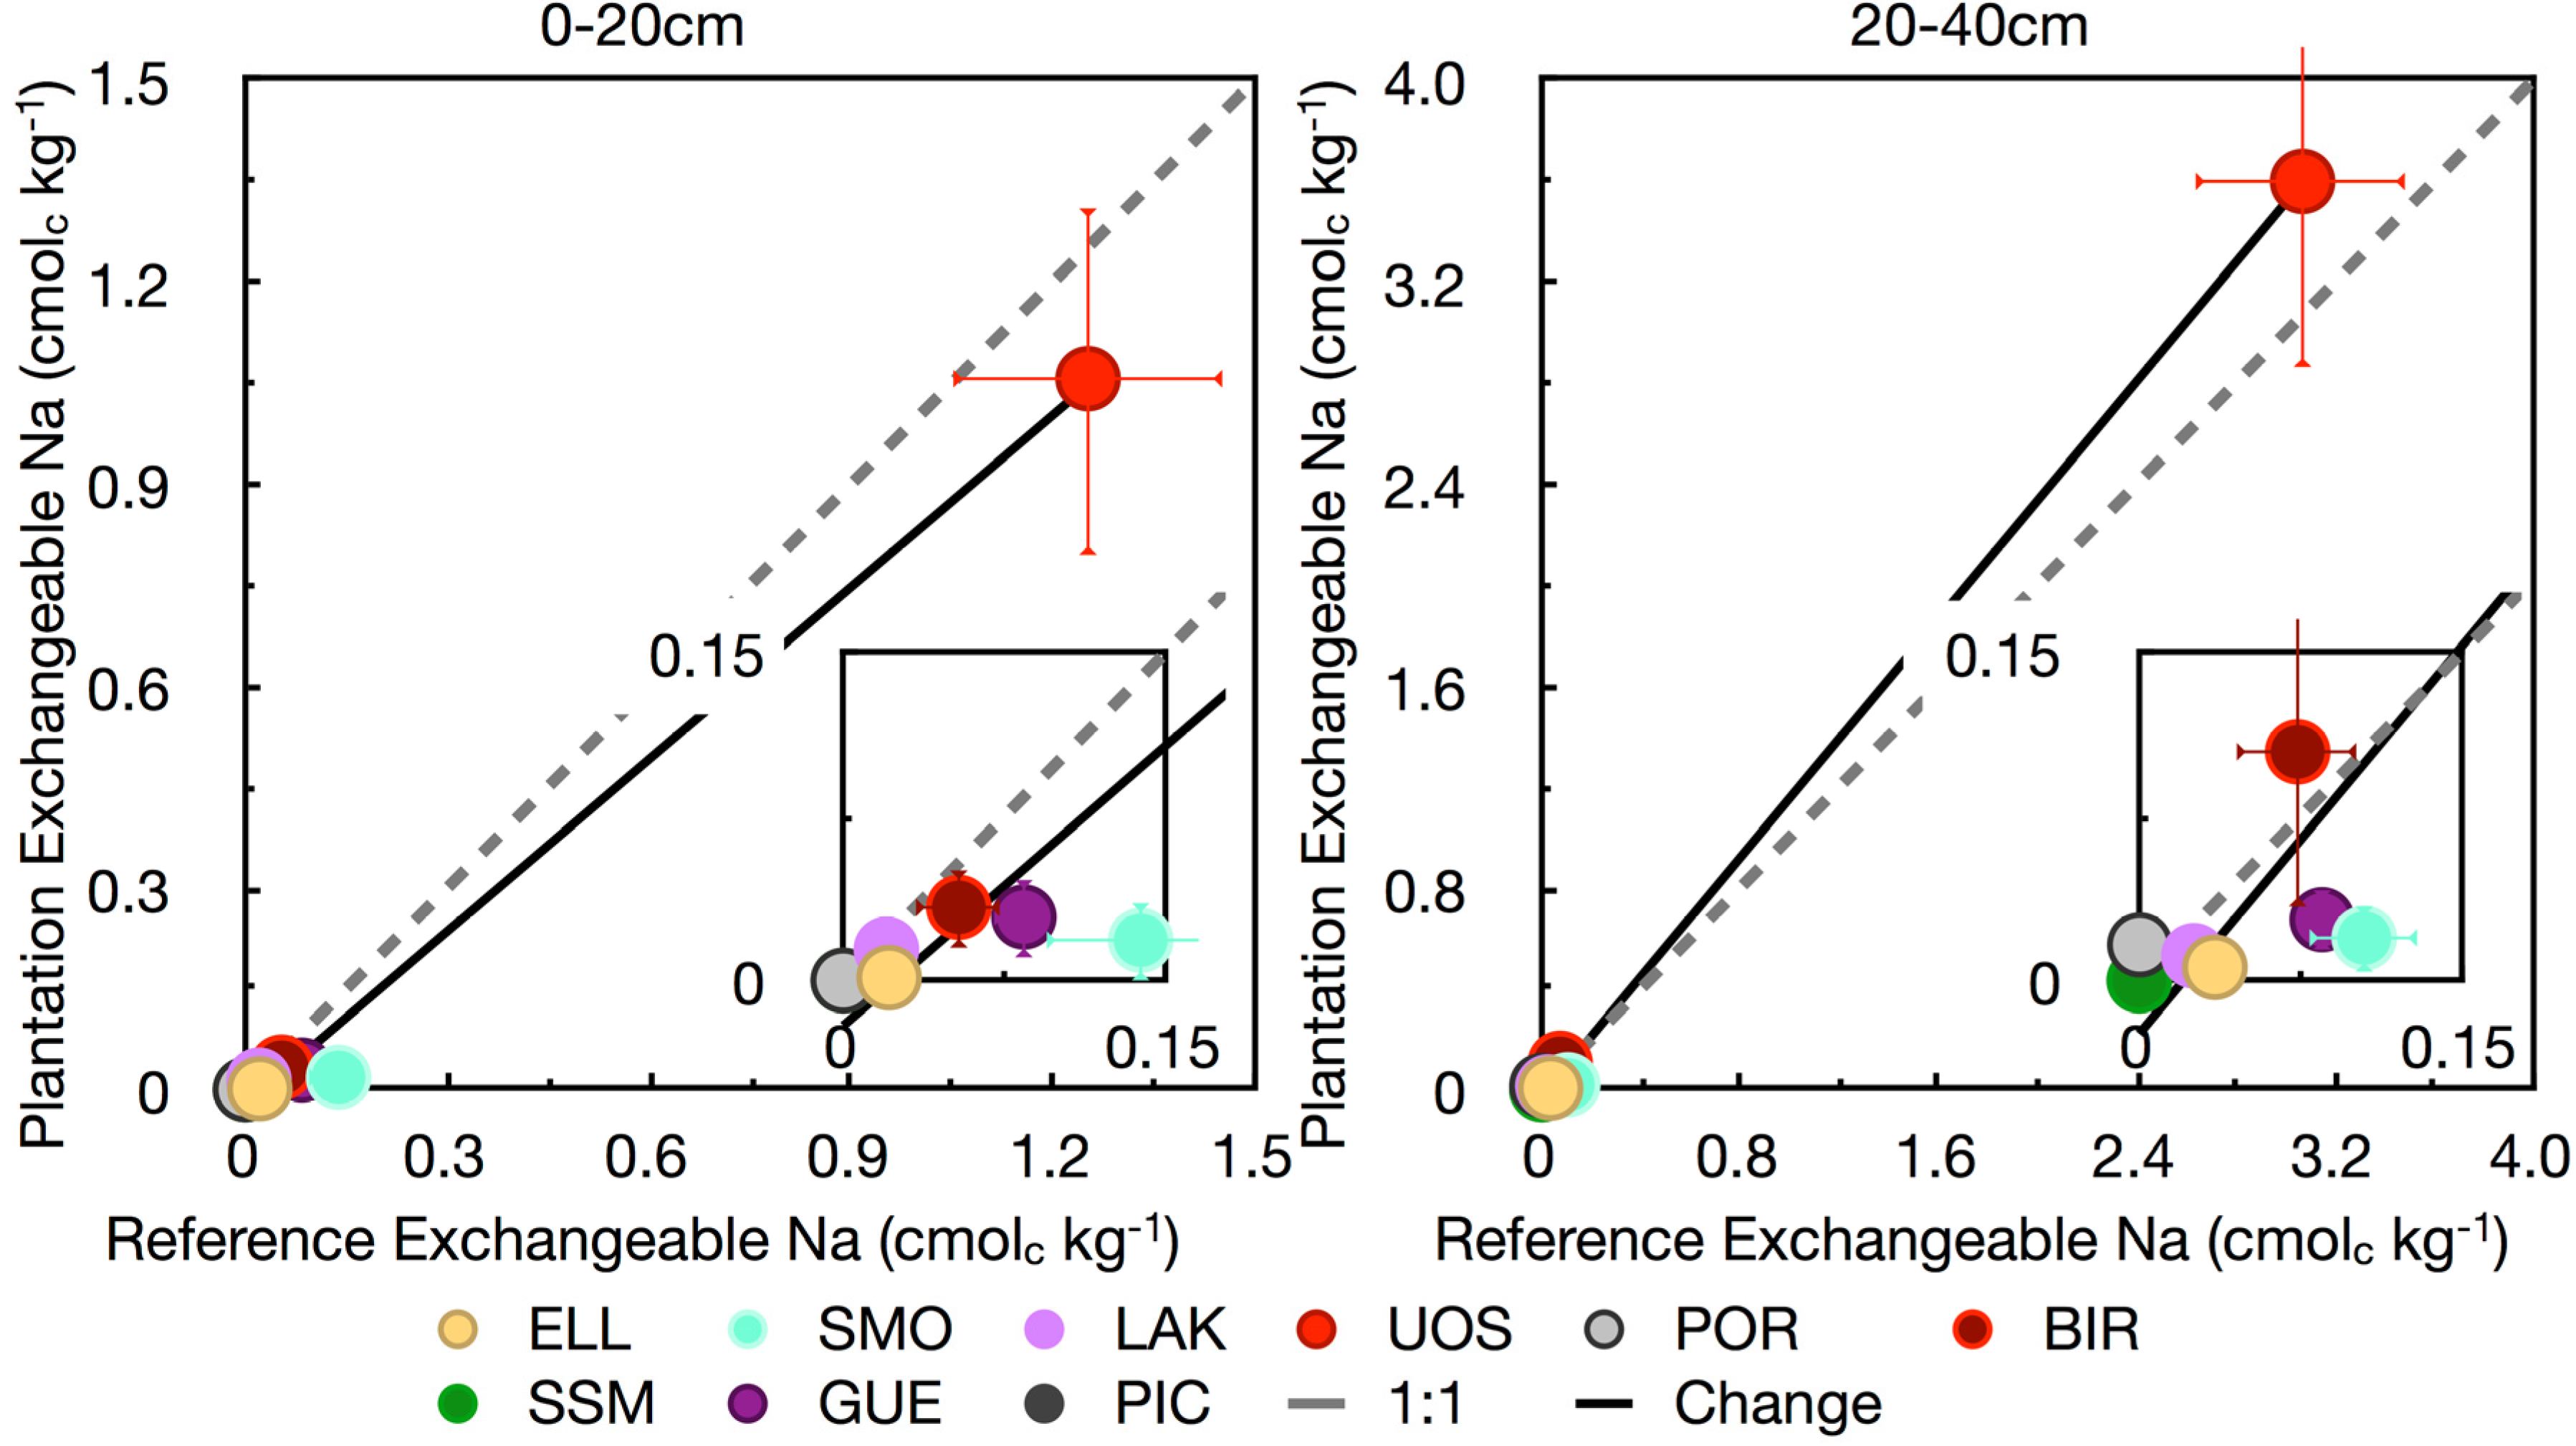
| Na (cmolc·kg−1) | −0.05 † | 0.04 † |
3.2. Nitrogen
3.3. Phosphorus
3.4. Base Cations
4. Conclusions
Acknowledgments
Conflict of Interest
References
- Kopp, R.F.; Smart, L.B.; Maynard, C.A.; Isebrands, J.G.; Tuskan, G.A.; Abrahamson, L.P. The development of improved willow clones for eastern North America. For. Chron. 2001, 77, 287–292. [Google Scholar]
- Richards, J.H.; Fung, K.-I. Atlas of Saskatchewan; University of Saskatchewan: Saskatoon, SK, Canada, 1969. [Google Scholar]
- Volk, T.A.; Verwijst, T.; Tharakan, P.J.; Abrahamson, L.P.; White, E.H. Growing fuel: A sustainability assessment of willow biomass crops. Front. Ecol. Environ. 2004, 2, 411–418. [Google Scholar]
- Labrecque, M.; Teodorescu, T.I.; Daigle, S. Early performance and nutrition of two willow species in short-rotation intensive culture fertilized with wastewater sludge and impact on the soil characteristics. Can. J. For. Res. 1998, 28, 1621–1635. [Google Scholar] [CrossRef]
- Adegbidi, H.G.; Volk, T.A.; White, E.H.; Abrahamson, L.P.; Briggs, R.D.; Bickelhaupt, D.H. Biomass and nutrient removal by willow clones in experimental bioenergy plantations in New York State. Biomass Bioenerg. 2001, 20, 399–411. [Google Scholar] [CrossRef]
- Bauhus, J.; Messier, C. Soil exploitation strategies of fine roots in different tree species of the southern boreal forest of eastern Canada. Can. J. For. Res. 1999, 29, 260–273. [Google Scholar]
- Fox, T.R. Sustained productivity in intensively managed forest plantations. For. Ecol. Manage. 2000, 138, 187–202. [Google Scholar] [CrossRef]
- Attiwill, P.M.; Adams, M.A. Tansley Review No. 50 Nutrient cycling in forests. New Phytol. 1993, 124, 561–582. [Google Scholar] [CrossRef]
- Binkley, D.; Giardina, C. Why do tree species affect soils? The warp and woof of tree-soil Interactions. Biogeochemistry 1998, 42, 89–106. [Google Scholar] [CrossRef]
- Augusto, L.; Ranger, J.; Binkley, D.; Rothe, A. Impact of several common tree species of European temperate forests on soil fertility. Ann. For. Sci. 2002, 59, 233–253. [Google Scholar] [CrossRef]
- Paul, K.I.; Polglase, P.J.; Nyakuengama, J.G.; Khanna, P.K. Change in soil carbon following afforestation. For. Ecol. Manage. 2002, 168, 241–257. [Google Scholar] [CrossRef]
- Simon, M.; Zsuffa, L.; Burgess, D. Variation in N, P, and K status and N efficiency in some North American willows. Can. J. For. Res. 1990, 20, 1888–1893. [Google Scholar] [CrossRef]
- Kopinga, J.; van den Burg, J. Using soil and foliar analysis to diagnose the nutritional status of urban trees. J. Arboric. 1995, 21, 17–24. [Google Scholar]
- Cornelissen, J.H.C.; Werger, M.J.A.; Castro-Díez, P.; van Rheenen, J.W.A.; Rowland, A.P. Foliar nutrients in relation to growth, allocation and leaf traits in seedlings of a wide range of woody plant species and types. Oecologia 1997, 111, 460–469. [Google Scholar] [CrossRef]
- Mitchell, C.P.; Stevens, E.A.; Watters, M.P. Short-rotation forestry—Operations, productivity and costs based on experience gained in the UK. For. Ecol. Manage. 1999, 121, 123–136. [Google Scholar] [CrossRef]
- Bélanger, N.; Paré, D.; Bouchard, M.; Daoust, G. Is the use of trees with superior growth a threat to soil nutrient availability? A case study with Norway spruce. Can. J. For. Res. 2004, 34, 560–572. [Google Scholar] [CrossRef]
- Ericsson, T. Growth and nutrition of three Salix clones in low conductivity solutions. Physiol. Plant 1981, 52, 239–244. [Google Scholar] [CrossRef]
- Bormann, F.H.; Likens, G.E.; Siccama, T.G.; Pierce, R.S.; Eaton, J.S. The export of nutrients and recovery of stable conditions following deforestation at Hubbard Brook. Ecol. Monogr. 1974, 44, 255–277. [Google Scholar] [CrossRef]
- Quideau, S.; Chadwick, O.; Graham, R.; Wood, H. Base cation biogeochemistry and weathering under oak and pine: A controlled long-term experiment. Biogeochemistry 1996, 35, 377–398. [Google Scholar] [CrossRef]
- Hobbie, S.E. Effects of plant species on nutrient cycling. Trends Ecol. Evol. 1992, 7, 336–339. [Google Scholar]
- Guo, L.B.; Gifford, R.M. Soil carbon stocks and land use change: A meta analysis. Glob. Change Biol. 2002, 8, 345–360. [Google Scholar] [CrossRef]
- Olszewska, M.; Smal, H. The effect of afforestation with Scots pine (Pinus silvestris L.) of sandy post-arable soils on their selected properties. I. Physical and sorptive properties. Plant Soil 2008, 305, 157–169. [Google Scholar] [CrossRef]
- Laganière, J.; Angers, D.A.; Paré, D. Carbon accumulation in agricultural soils after afforestation: A meta-analysis. Glob. Change Biol. 2010, 16, 439–453. [Google Scholar] [CrossRef]
- Ens, J.A.; Farrell, R.E.; Bélanger, N. Rapid biomass estimation using optical stem density of willow (Salix spp.) grown in short rotation. Biomass Bioenerg. 2009, 33, 174–179. [Google Scholar] [CrossRef]
- Ens, J. Short Rotation Culture of Willow Clones Across Canada: Growth Requirements and Implications for Soil Nutrients and Greenhouse Gas Balances. Ph.D. Thesis, Department of Soil Science, University of Saskatchewan, Saskatoon, SK, Canada, 2012; p. 158. [Google Scholar]
- Soil Calssification Working Group. In The Canadian System of Soil Classification; NRC Press: Ottawa, ON, Canada, 1998.
- Kalra, Y.P.; Maynard, D.G. Methods Manual for Forest Soil and Plant Analysis; Canadian Forest Service, Northern Forestry Centre: Edmonton, AB, Canada, 1999. [Google Scholar]
- Hendershot, W.H.; Lalande, H.; Duquette, M. Ion Exchange and Exchangeable Cations. In Soil Sampling and Methods of Analysis, 2nd; Carter, M.R., Gregorich, E.G., Eds.; CRC Press: Boca Raton, FL, USA, 2008; pp. 197–206. [Google Scholar]
- Kroetsch, D.; Wang, C. Particle Size Distribution. In Soil Sampling and Methods of Analysis, 2nd; Carter, M.R., Gregorich, E.G., Eds.; CRC Press: Boca Raton, FL, USA, 2008; pp. 713–726. [Google Scholar]
- Rawls, W.J. Estimating soil bulk density from particle size analysis and organic matter content. Soil Sci. 1983, 135, 123–125. [Google Scholar]
- Jug, A.; Hofmann-Schielle, C.; Makeschin, F.; Rehfuess, K.E. Short-rotation plantations of balsam poplars, aspen and willows on former arable land in the Federal Republic of Germany. II. Nutritional status and bioelement export by harvested shoot axes. For. Ecol. Manage. 1999, 121, 67–83. [Google Scholar] [CrossRef]
- Jobbágy, E.G.; Jackson, R.B. The vertical distribution of carbon and its relation to climate and vegetation. Ecol. Applic. 2000, 10, 423–436. [Google Scholar] [CrossRef]
- Pinno, B.D.; Bélanger, N. Ecosystem carbon gains from afforestation in the Boreal Transition ecozone of Saskatchewan (Canada) are coupled with the devolution of Black Chernozems. Agric. Ecosyst. Environ. 2008, 123, 56–62. [Google Scholar] [CrossRef]
- Six, J.; Callewaert, P.; Lenders, S.; de Gryze, S.; Morris, S.J.; Gregorich, E.G.; Paul, E.A.; Paustian, K. Measuring and understanding carbon storage in afforested soils by physical fractionation. Soil Sci. Soc. Am. J. 2002, 66, 1981–1987. [Google Scholar]
- Turner, J.; Lambert, M. Change in organic carbon in forest plantation soils in eastern Australia. For. Ecol. Manag. 2000, 133, 231–247. [Google Scholar] [CrossRef]
- Zou, X.; Bashkin, M. Soil carbon accretion and earthworm recovery following revegetation in abandoned sugarcane fields. Soil Biol. Biochem. 1998, 30, 825–830. [Google Scholar] [CrossRef]
- Woods, P.V.; Nambiar, E.K.S.; Smethurst, P.J. Effect of annual weeds on water and nitrogen availability to Pinus radiata trees in a young plantation. For. Ecol. Manag. 1992, 48, 145–163. [Google Scholar] [CrossRef]
- Aronsson, P.G.; Bergström, L.F. Nitrate leaching from lysimeter-grown short-rotation willow coppice in relation to N-application, irrigation and soil type. Biomass Bioenerg. 2001, 21, 155–164. [Google Scholar] [CrossRef]
- Moukoumi, J.; Farrell, R.; van Rees, K.; Hynes, R.; Bélanger, N. Intercropping Caragana arborescens with Salix miyabeana to satisfy nitrogen demand and maximize growth. Bioenerg. Res. 2012, 5, 719–732. [Google Scholar] [CrossRef]
- Crutzen, P.J.; Mosier, A.R.; Smith, K.A.; Winiwarter, W. N2O release from agro-biofuel production negates global warming reduction by replacing fossil fuels. Atmos. Chem. Phys. 2008, 8, 389–395. [Google Scholar] [CrossRef]
- Scott, A.D.; Dean, T.J. Energy trade-offs between intensive biomass utilization, site productivity loss, and ameliorative treatments in loblolly pine plantation. Biomass Bioenerg. 2006, 30, 1001–1010. [Google Scholar] [CrossRef]
- Chen, C.R.; Condron, L.M.; Xu, Z.H. Impacts of grassland afforestation with coniferous trees on soil phosphorus dynamics and associated microbial processes: A review. For. Ecol. Manag. 2008, 255, 396–409. [Google Scholar] [CrossRef]
- Chen, C.; Condron, L.; Davis, M.; Sherlock, R. Effects of afforestation on phosphorus dynamics and biological properties in a New Zealand grassland soil. Plant Soil 2000, 220, 151–163. [Google Scholar] [CrossRef]
- Ellert, B.H.; Gregorich, E.G. Storage of carbon, nitrogen and phosphorus in cultivated and adjacent forested soils of Ontario. Soil Sci. 1996, 161, 587–603. [Google Scholar]
- Likens, G.E.; Driscoll, C.T.; Buso, D.C.; Siccama, T.G.; Johnson, C.E.; Lovett, G.M.; Ryan, D.F.; Fahey, T.; Reiners, W.A. The biogeochemistry of potassium at Hubbard Brook. Biogeochemistry 1994, 25, 61–125. [Google Scholar]
- Schofield, N.J. Tree planting for dryland salinity control in Australia. Agrofor. Syst. 1992, 20, 1–23. [Google Scholar] [CrossRef]
- Hangs, R.D.; Schoenau, J.J.; van Rees, K.C.J.; Steppuhn, H. Examining the salt tolerance of willow (Salix spp.) bioenergy species for use on salt-affected agricultural lands. Can. J. Plant Sci. 2011, 91, 509–517. [Google Scholar] [CrossRef]
- Schroeder, W.; Kort, J.; Savoie, P.; Preto, F. Biomass harvest from natural willow rings around prairie wetlands. Bioenerg. Res. 2009, 2, 99–105. [Google Scholar] [CrossRef]
- Gigler, J.K.; Meerdink, G.; Hendrix, E.M.T. Willow supply strategies to energy plants. Biomass Bioenerg. 1999, 17, 185–198. [Google Scholar] [CrossRef]
© 2013 by the authors; licensee MDPI, Basel, Switzerland. This article is an open access article distributed under the terms and conditions of the Creative Commons Attribution license (http://creativecommons.org/licenses/by/3.0/).
Share and Cite
Ens, J.; Farrell, R.E.; Bélanger, N. Early Effects of Afforestation with Willow (Salix purpurea, “Hotel”) on Soil Carbon and Nutrient Availability. Forests 2013, 4, 137-154. https://doi.org/10.3390/f4010137
Ens J, Farrell RE, Bélanger N. Early Effects of Afforestation with Willow (Salix purpurea, “Hotel”) on Soil Carbon and Nutrient Availability. Forests. 2013; 4(1):137-154. https://doi.org/10.3390/f4010137
Chicago/Turabian StyleEns, Joels, Richard E. Farrell, and Nicolas Bélanger. 2013. "Early Effects of Afforestation with Willow (Salix purpurea, “Hotel”) on Soil Carbon and Nutrient Availability" Forests 4, no. 1: 137-154. https://doi.org/10.3390/f4010137
APA StyleEns, J., Farrell, R. E., & Bélanger, N. (2013). Early Effects of Afforestation with Willow (Salix purpurea, “Hotel”) on Soil Carbon and Nutrient Availability. Forests, 4(1), 137-154. https://doi.org/10.3390/f4010137