Article

Heavy Metal Contamination in Soils of Remnant Natural and Plantation Forests in an Urbanized Region of the Pearl River Delta, China

1
Institute of Ecology and Environmental Sciences, South China Botanical Garden, Chinese Academy of Sciences, Guangzhou 510650, China
2
Key Laboratory of Vegetation Restoration and Management of Degraded Ecosystems, South China Botanical Garden, Chinese Academy of Sciences, Guangzhou 510650, China
3
University of the Chinese Academy of Sciences, Beijing 100049, China
4
Agricultural and Forestry Extension Centre of Nanhai District, Guangdong 528222, China
*
Author to whom correspondence should be addressed.
These authors contributed equally to this work.
Forests 2014, 5(5), 885-900; https://doi.org/10.3390/f5050885
Submission received: 10 January 2014 / Revised: 5 May 2014 / Accepted: 5 May 2014 / Published: 13 May 2014

Abstract

:
Remnant forests in urban areas provide vital ecosystem services but are susceptible to many human activities including heavy metal emissions. In this study, we collected 192 samples of mineral soils at depths of 0–3, 3–13 and 13–23 cm in 16 remnant forests (eight natural forests and eight plantation forests) in the urbanized Pearl River Delta, China. We assessed the potential risks of soil Cu, Zn, Pb, Mn, Ni and Cr to the vegetation in these forests based on their total and 0.1 M HCl extractable concentrations. The mean concentrations for all soil samples were 202.7, 102.0, 75.7, 24.3, 30.3, and 7.8 mg/kg for Zn, Mn, Pb, Cu, Cr, and Ni, respectively. Compared to background values, total soil Zn concentrations were higher for both the natural and plantation forests located near both industrial and non-industrial sites; total soil Cu and Pb concentrations were higher near industrial sites, particularly for the natural forests. Total soil Pb, Cu, and Mn concentrations and exchangeable soil Pb and Mn concentrations were higher in the natural forests than in the plantation forests. Total soil Cu and Pb concentrations and extractable soil Cu, Pb, Zn, and Mn concentrations decreased with soil depth. Based on these results and previous findings of continued acidification and low phosphorus availability of these soils, we recommend that the growth of these remnant forests can be improved by the application of phosphate rock.

1. Introduction

Remnants of forest ecosystems occur in urban areas around the world [1,2]. Although forest remnants are typically small patches, they can provide important ecological services that improve human well-being in urban areas. They can, for example, improve urban air quality, ameliorate the heat island effect, preserve biodiversity, and provide wood products, recreational venues, and landscape aesthetics [1,2,3,4]. For these reasons, multidisciplinary studies have increasingly focused on the sustainability and conservation of these forests [1,2,3,5,6].
Relative to natural forests in rural areas, remnant forests in urban areas are typically more influenced by human activities, such as the building of houses and roads, recreation, and emissions of SOx, NOx, and particulate matters [2,7,8]. Of these activities, the emissions of pollutants are likely to influence forest ecosystems at a large spatial scale in urban and rural areas because of atmospheric transport [9,10,11]. The particulate matters emitted from industries and as a consequence of urban heating and other human activities usually contain high levels of heavy metals such as Pb and Zn [7,8,12]. A long-term continuous emission of particulate matters may result in the deposition of a significant amount of heavy metals in forest ecosystems, which may reduce biomass production, litter decomposition, and other ecosystem functions, especially in urban areas [9,13,14].
The Pearl River Delta (PRD) in southern China (Figure 1) has an area of 41,600 km2 and had a population of over 56 million in 2010 [15]. The PRD has contributed greatly to the rapid economic development of China and is now the economic center of southern China. With rapid urbanization and industrialization, however, large areas of natural lands in the PRD have been converted into farmlands or urban areas [16,17]. At the same time, various harmful substances, including acid precursors and heavy metals, have been emitted into the environment [7,17,18] and have increasingly impacted the remnant forests in this area [19,20,21]. Previous studies reported that heavy metals in forest soils were generally higher in the urbanized (or industrialized) areas than in the rural (or non-industrialized) areas of the PRD [20,22]. However, it is still unclear how heavy metals in soils of remnant forests in the PRD and in other urbanized areas vary with site location, forest type, and soil depth.
In this study, we determined the total and 0.1 M HCl extractable concentrations of Cu, Zn, Pb, Mn, Ni, and Cr in mineral soils (0–3, 3–13, and 13–23 cm depths) in 16 patches of remnant forests (eight natural forests and eight plantation forests) in the PRD, China. Our purposes were: (1) to compare the distribution of heavy metals in soils of the remnant forests in industrial vs. non-industrial locations, in natural forests vs. plantation forests, and at three soil depths; and (2) to assess the potential risks and possible sources of these heavy metals in the studied forests.
Figure 1. Location of 16 selected forest patches in Foshan, China. Black, grey and white areas in Foshan indicate the core urban, industrialized and non-industrial areas, respectively. “N” and “P” indicate the locations of remnant natural forests and plantation forests, respectively.
Forests 05 00885 g001

2. Materials and Methods

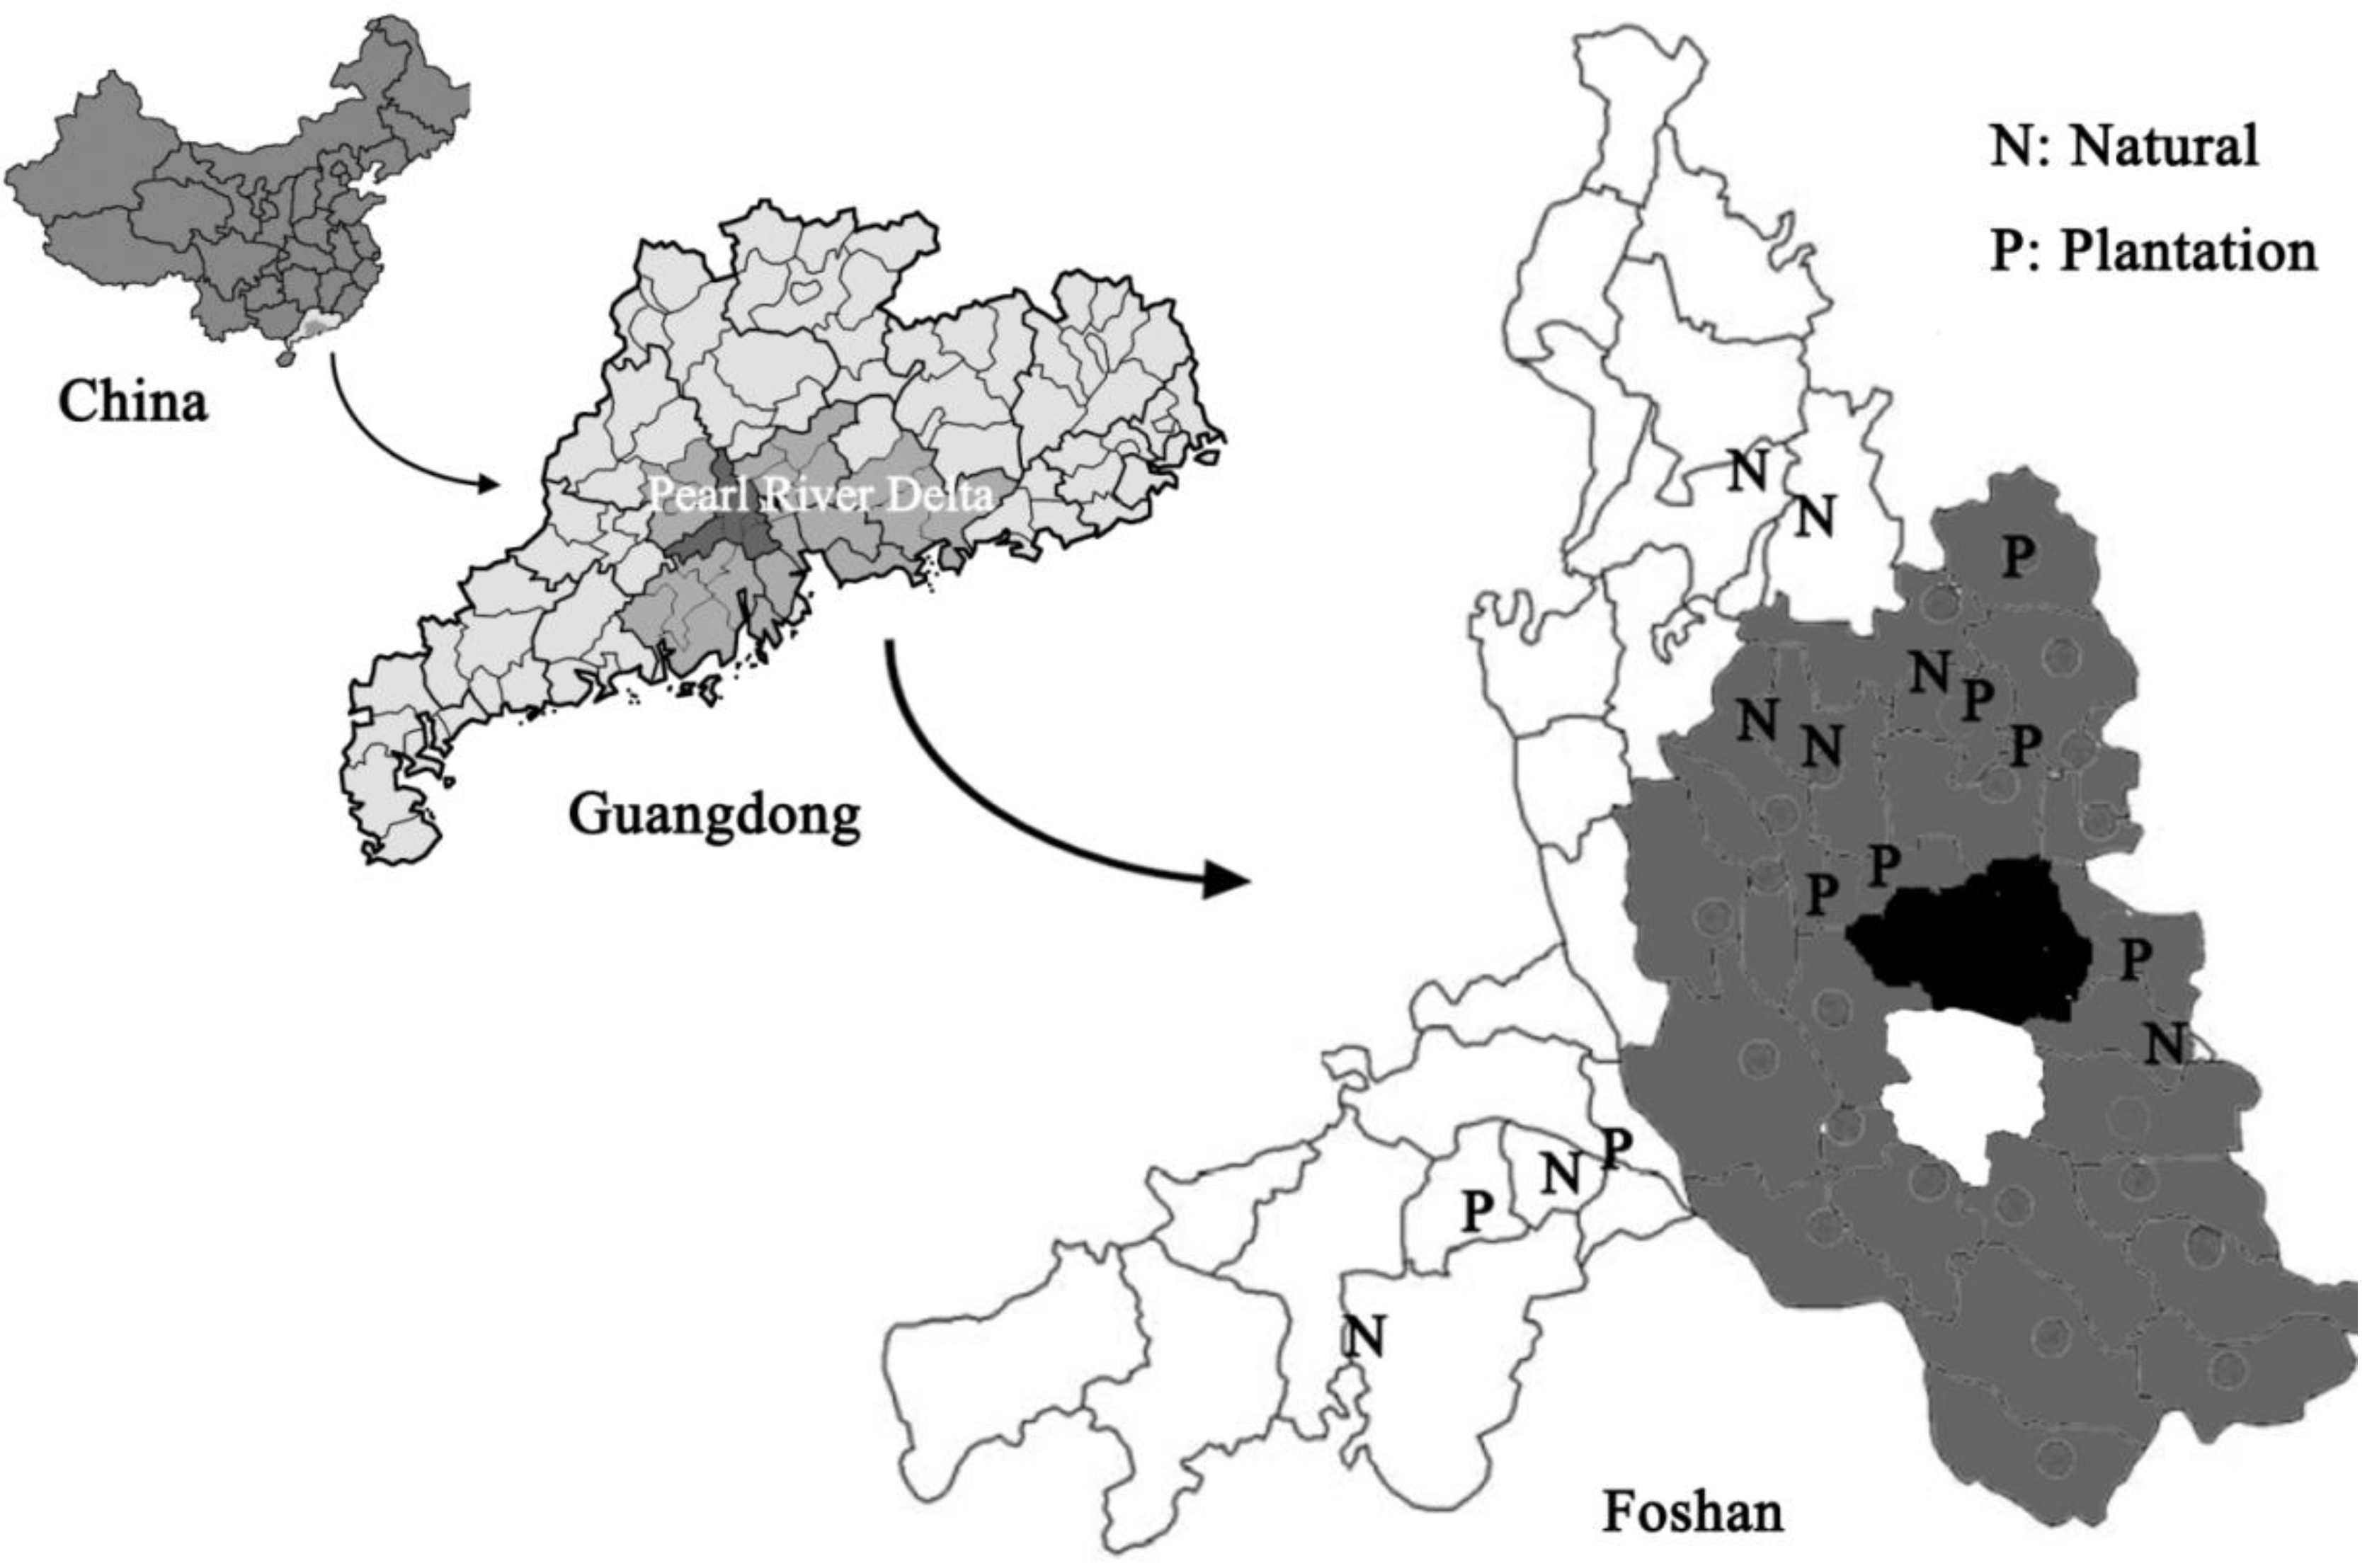
2.1. Site Description

This study was carried out in Foshan (22°38′–23°34′ N, 112°22′–113°23′ E), which is centrally located in the PRD of Guangdong Province (Figure 1). Foshan was one of the first three wholly urbanized, prefectural-level cities in China [23]. This region is characterized by a typical subtropical monsoon climate, with annual precipitation ranging from 1600 to 2000 mm and annual temperature ranging from 20 to 25 °C [17]. The forest soils are mainly Ferralsols [24], which developed from granite and sand shales.
Other than several large natural reserves in the suburban areas, remnant natural forests and remnant plantation forests are the major kinds of forest sites in the urban and suburban areas of the PRD [5,25], Remnant natural forests in the study area are also called “Fengshui Forests” or “Fengshui Woods” [3,25] and have been conserved as cultural heritage sites over the past several hundred years because of their socio-cultural significance for the indigenous people [26]. These forests are mainly near villages or graveyards and are generally dominated by native broadleaved evergreen species with community characteristics similar to those of regional climax forests [3,25]. Plantation forests with two rotations of reforestation are another major type of forests that remain in the area [25]. The first rotation was planted with Masson pine trees and/or eucalyptus species during the 1970–1980s, after the natural forests were harvested in 1950s. The second rotation was planted with native broadleaved tree species that corresponded to the tree species and community composition of the remnant natural forests after timber harvest of the Masson pine and/or Eucalyptus stands during 1997–2003 [25].
Eight patches of remnant natural forest and eight patches of remnant plantation forests in Foshan, China, were randomly selected (Figure 1). Site characteristics of the 16 remnant forest patches are shown in Table 1. Each site was categorized as an industrial or non-industrial location, according to the percentage of the local town’s gross domestic product represented by gross industrial production (industrial towns, >60%; non-industrial towns, ≤60%) [17,27]. Because more remnant plantation forests in Foshan are located in industrial rather than in non-industrial locations, a simple random selection of eight remnant plantation forests resulted in six remnant plantation forests at industrial locations and two at non-industrial locations.

2.2. Sampling and Analysis

All soils were sampled during December 2008–January 2009. At each site, four sample locations that were >50 m apart were randomly selected. These areas lacked visible disturbance of vegetation, forest floor, or vertical soil profile. At each sample area, a soil pit of ~30 cm depth was excavated. After the litter and fermentation layers (usually 1–3 cm thickness) were removed, the mineral soil adjacent to the pit was collected at 0–3 cm, 3–13 cm, and 13–23 cm depths with a small stainless steel shovel. A 0–3 cm layer of mineral soil was separated because there was a color change at ~3 cm depth in the mineral soils at the 16 sites; this 0–3 cm layer may be defined as the Ah horizon according to the Canadian system of soil classification [28]. The 192 soil samples (16 sites × four areas within each site × three soil depths) were kept separate for analysis. After roots and stones had been removed, each sample was air-dried and then ground with a wooden stick until 100% of it passed through a 2-mm non-metal mesh. After the sample was mixed, a subsample (about 10 g) was oven-dried at 105 °C for 24 h, and a dry weight conversion was computed. Another subsample (about 30 g) was ground in an agate crucible until 100% of it passed through a 0.15-mm non-metal mesh; this sample was stored in a clean plastic bottle for the determination of total heavy metal concentrations. The remainder of the sample (>50 g) was stored in another clean plastic bottle for the determination of extractable heavy metal concentrations.
Total concentrations of heavy metals (Cu, Zn, Mn, Pb, Cr, and Ni) in soils were determined using an acid digestion method at atmospheric pressure [29,30]. Extractable concentrations of heavy metals in soils were determined using an acid extraction method [29]. A 10.00-g quantity of air-dried soil was placed in an acid-cleaned 150-mL Erlenmeyer flask, and 50 ml of 0.1 M analytical grade HCl was added. The flask was sealed with a rubber stopper and then shaken for 1.5 h at room temperature on a horizontal shaker (150 rpm) [29]. The mixture was filtered, and the concentrations of heavy metals in the solution were determined by ICP/AES (Optima 2000, Norwalk, CT, USA). Data quality was controlled by the use of national standard reference material (ESS-3) supplied by China National Environmental Monitoring Center. The results met the accuracy demand of Technical Specification for Soil Environmental Monitoring HJ/T 166-2004 [29]. The quantity of extractable heavy metal was expressed as a concentration (mg/kg) and as a percentage of the total heavy metal concentration. All results were expressed on an oven-dried mass.
Table 1. Site characteristics of 16 selected forest patches in Foshan, China.
SiteLocation TypeForest TypeGrid ReferenceArea (ha)Major Tree Species
KengmeiIndustrialNatural112°58′29″ E, 23°10′11″ N4.6Schefflera octophylla, Desmos chinensis, Alocasia macrorhiza
LinyueIndustrialNatural113°14′02″ E, 23°00′13″ N20.8Syzygium hancei, Symplocos lancifolia, Desmos chinensis
WanshiIndustrialNatural113°05′09″ E, 23°10′46″ N6.9Engelhardtia roxburghiana, Aporosa dioica, Alchornea trewioides
YangaoIndustrialNatural113°00′09″ E, 23°09′14″ N3.0Syzygium hancei, Bambusa stenostachya, Ardisia hanceana
LunyongNon-industrialNatural112°50′47″ E, 22°52′31″ N9.5Schima superb, Indocalamus tessellates, Alpinia chinensis
ShanbuNon-industrialNatural113°00′07″ E, 23°16′36″ N9.0Phoebe namu, Ardisia hanceana, Ixora chinensis
ShukengNon-industrialNatural112°43′10″ E, 22°48′15″ N5.9Machilus chinesis, Lasianthus chinensis, Indocalamus tessellates
YuantouNon-industrialNatural112°56′07″ E, 23°18′16″ N2.9Helicia cochinchinensis, Desmos chinensis, Ardisia hanceana
LongtouIndustrialPlantation113°06′37″ E, 23°10′02″ N5.6Cinnamomum camphora, Albizia falcataria, Delonix regia
SanguigangIndustrialPlantation113°00′17″ E, 23°03′46″ N42.2Ficus altissima, Polyspora axillaris, Bombax malabaricum
SanshanIndustrialPlantation113°13′36″ E, 23°02′05″ N32.8Ficus altissima, Cinnamomum camphora, Schima superba
ShitangIndustrialPlantation113°04′25″ E, 23°16′18″ N74.0Cinnamomum camphora, Castanopsis hystrix, Liquidambar formosana
XinjingIndustrialPlantation112°59′32″ E, 23°04′35″ N104Ficus altissima, Ficus microcarpa, Bischofia javanica
ZhanqigangIndustrialPlantation113°08′45″ E, 23°09′34″ N83.7Cinnamomum camphora, Liquidambar formosana, Cinnamomum burmannii
XialiangNon-industrialPlantation112°49′25″ E, 22°51′45″ N10.7Cinnamomum camphora, Castanopsis hystrix, Liquidambar formosana
XianNon-industrialPlantation112°52′37″ E, 22°52′33″ N38.7Schima superb, Liquidambar formosana, Ficus microcarpa

2.3. Data Analyses

A three-way ANOVA (location × forest type × soil depth) using log-transformed data was carried out to determine the statistical significance of location type, forest type, soil depth, and their interactions. Significant interactions were assessed with one-way ANOVAs using Tamhane’s post hoc test. The values obtained in the current study were compared to “background” values, which were published by the China National Environmental Monitoring Centre [31]; the samples (n = 167) used to obtain the background values were generally collected at 20 cm depth (the A horizon) in Guangdong Province and were collected and processed using the same general procedures as used in the current study. Correlations between soil heavy metal concentrations were investigated using Spearman rank test. Principal component analysis (PCA) was performed using the rotation method of Varimax with Kaiser Normalization, which allows identification of groups of metals with similar behaviors and common origins [14]. All analyses were performed using SPSS (version 16.0 for Windows, IBM, Chicago, IL, USA).

3. Results

3.1. General Characteristics of Soil Heavy Metal Concentrations

Both the total and extractable concentrations of the six heavy metals varied greatly among the 192 soil samples. The coefficients of variation were larger for the extractable concentrations than for the total concentrations and were higher for Zn, Mn, and Pb than for Cu, Ni, and Cr (Table 2). The mean total soil concentrations of Zn, Pb, and Cu were 4.3-, 2.1-, and 1.4-times greater, respectively, than their background values, while the mean total concentrations for Cr, Ni, and Mn were lower than their background values (Table 2). Although the mean total Mn concentration in soil was lower than its background value, the upper limit was six times higher (Table 2). Therefore, our further analyses focused on Zn, Pb, Cu, and Mn concentrations in soil.

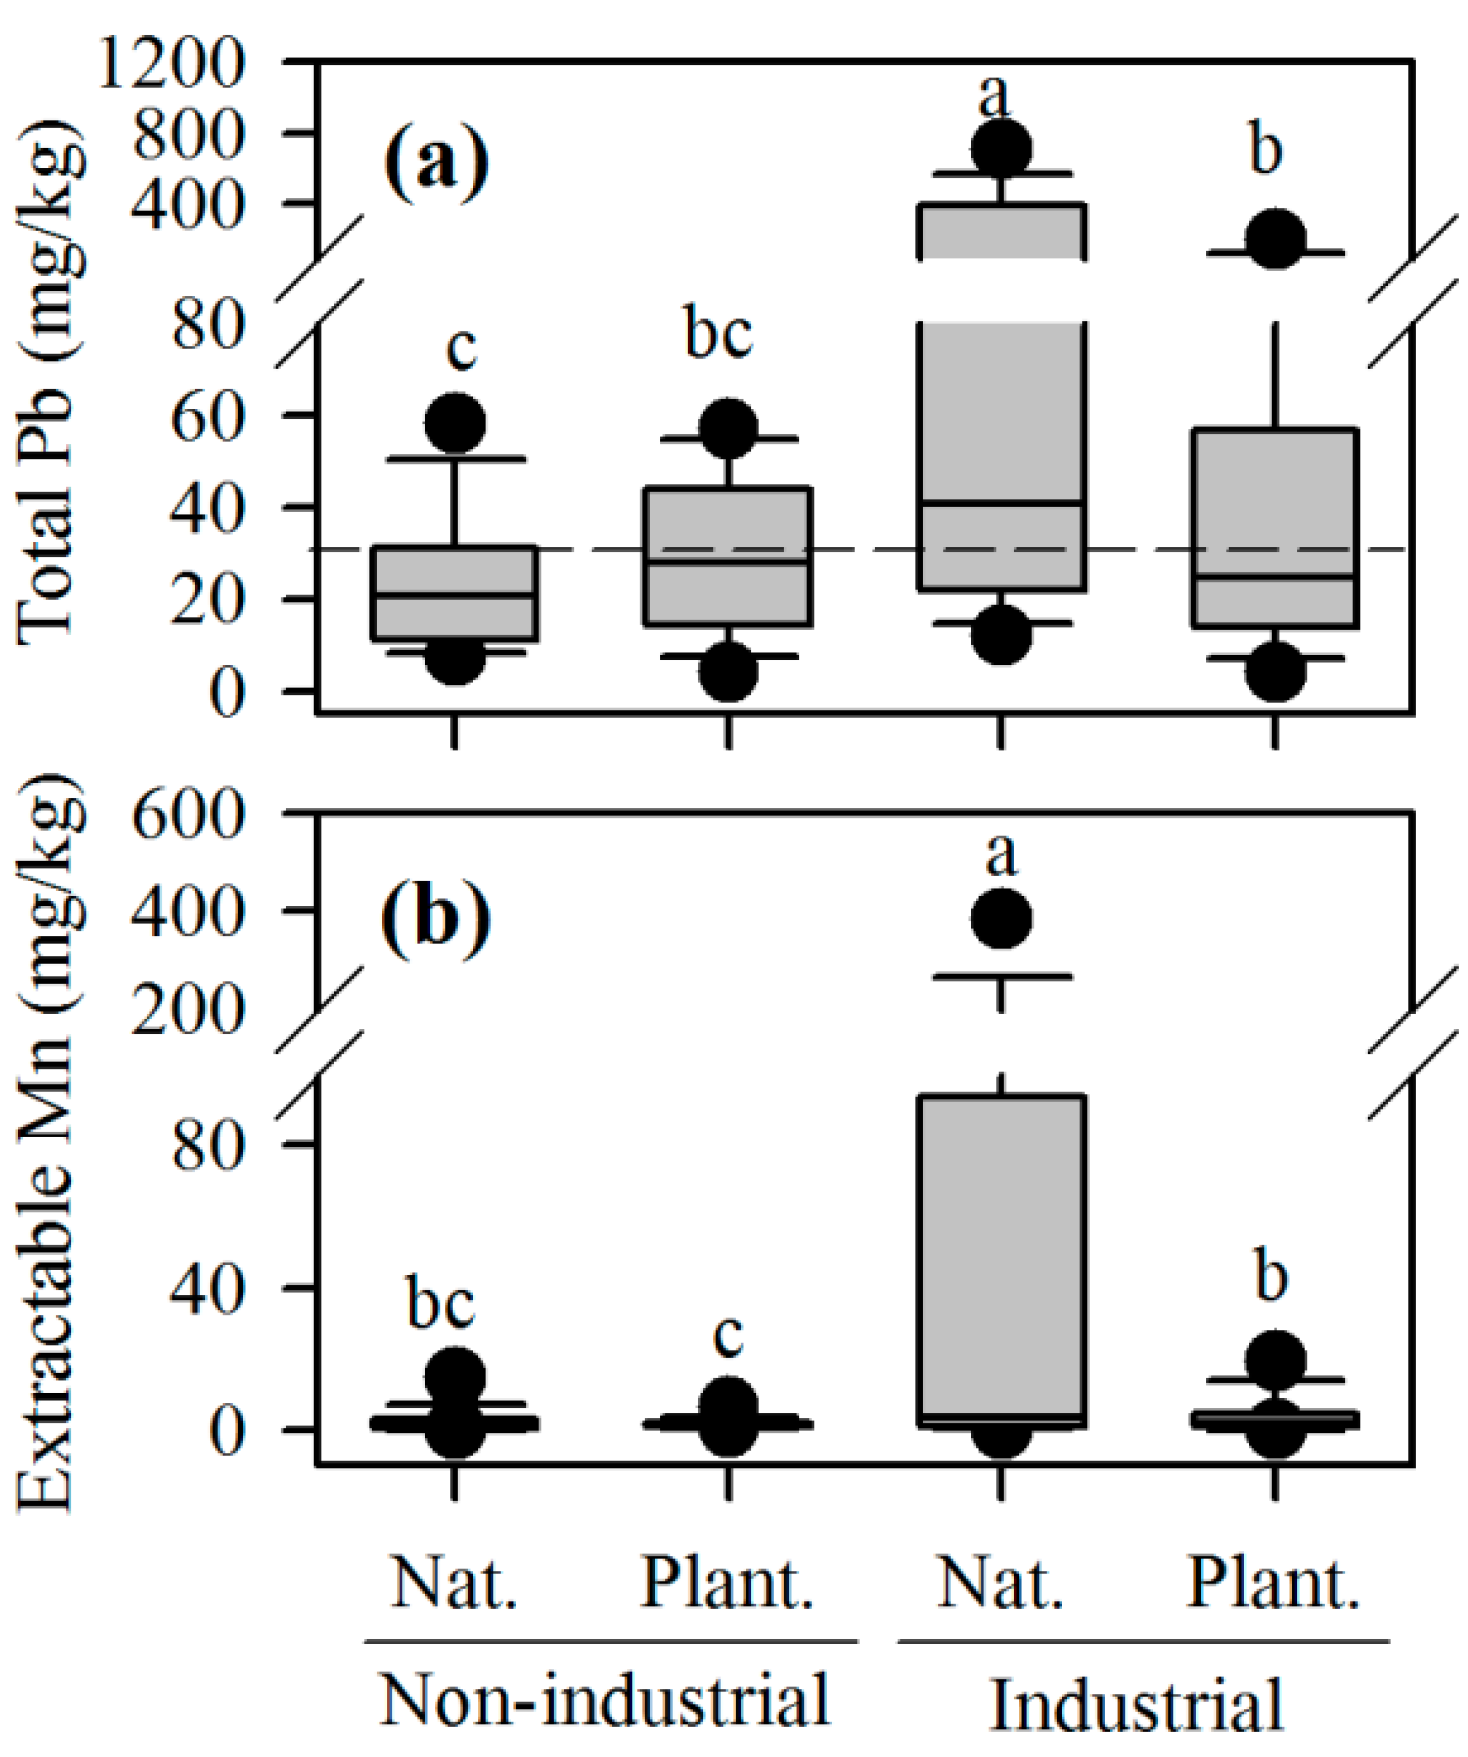
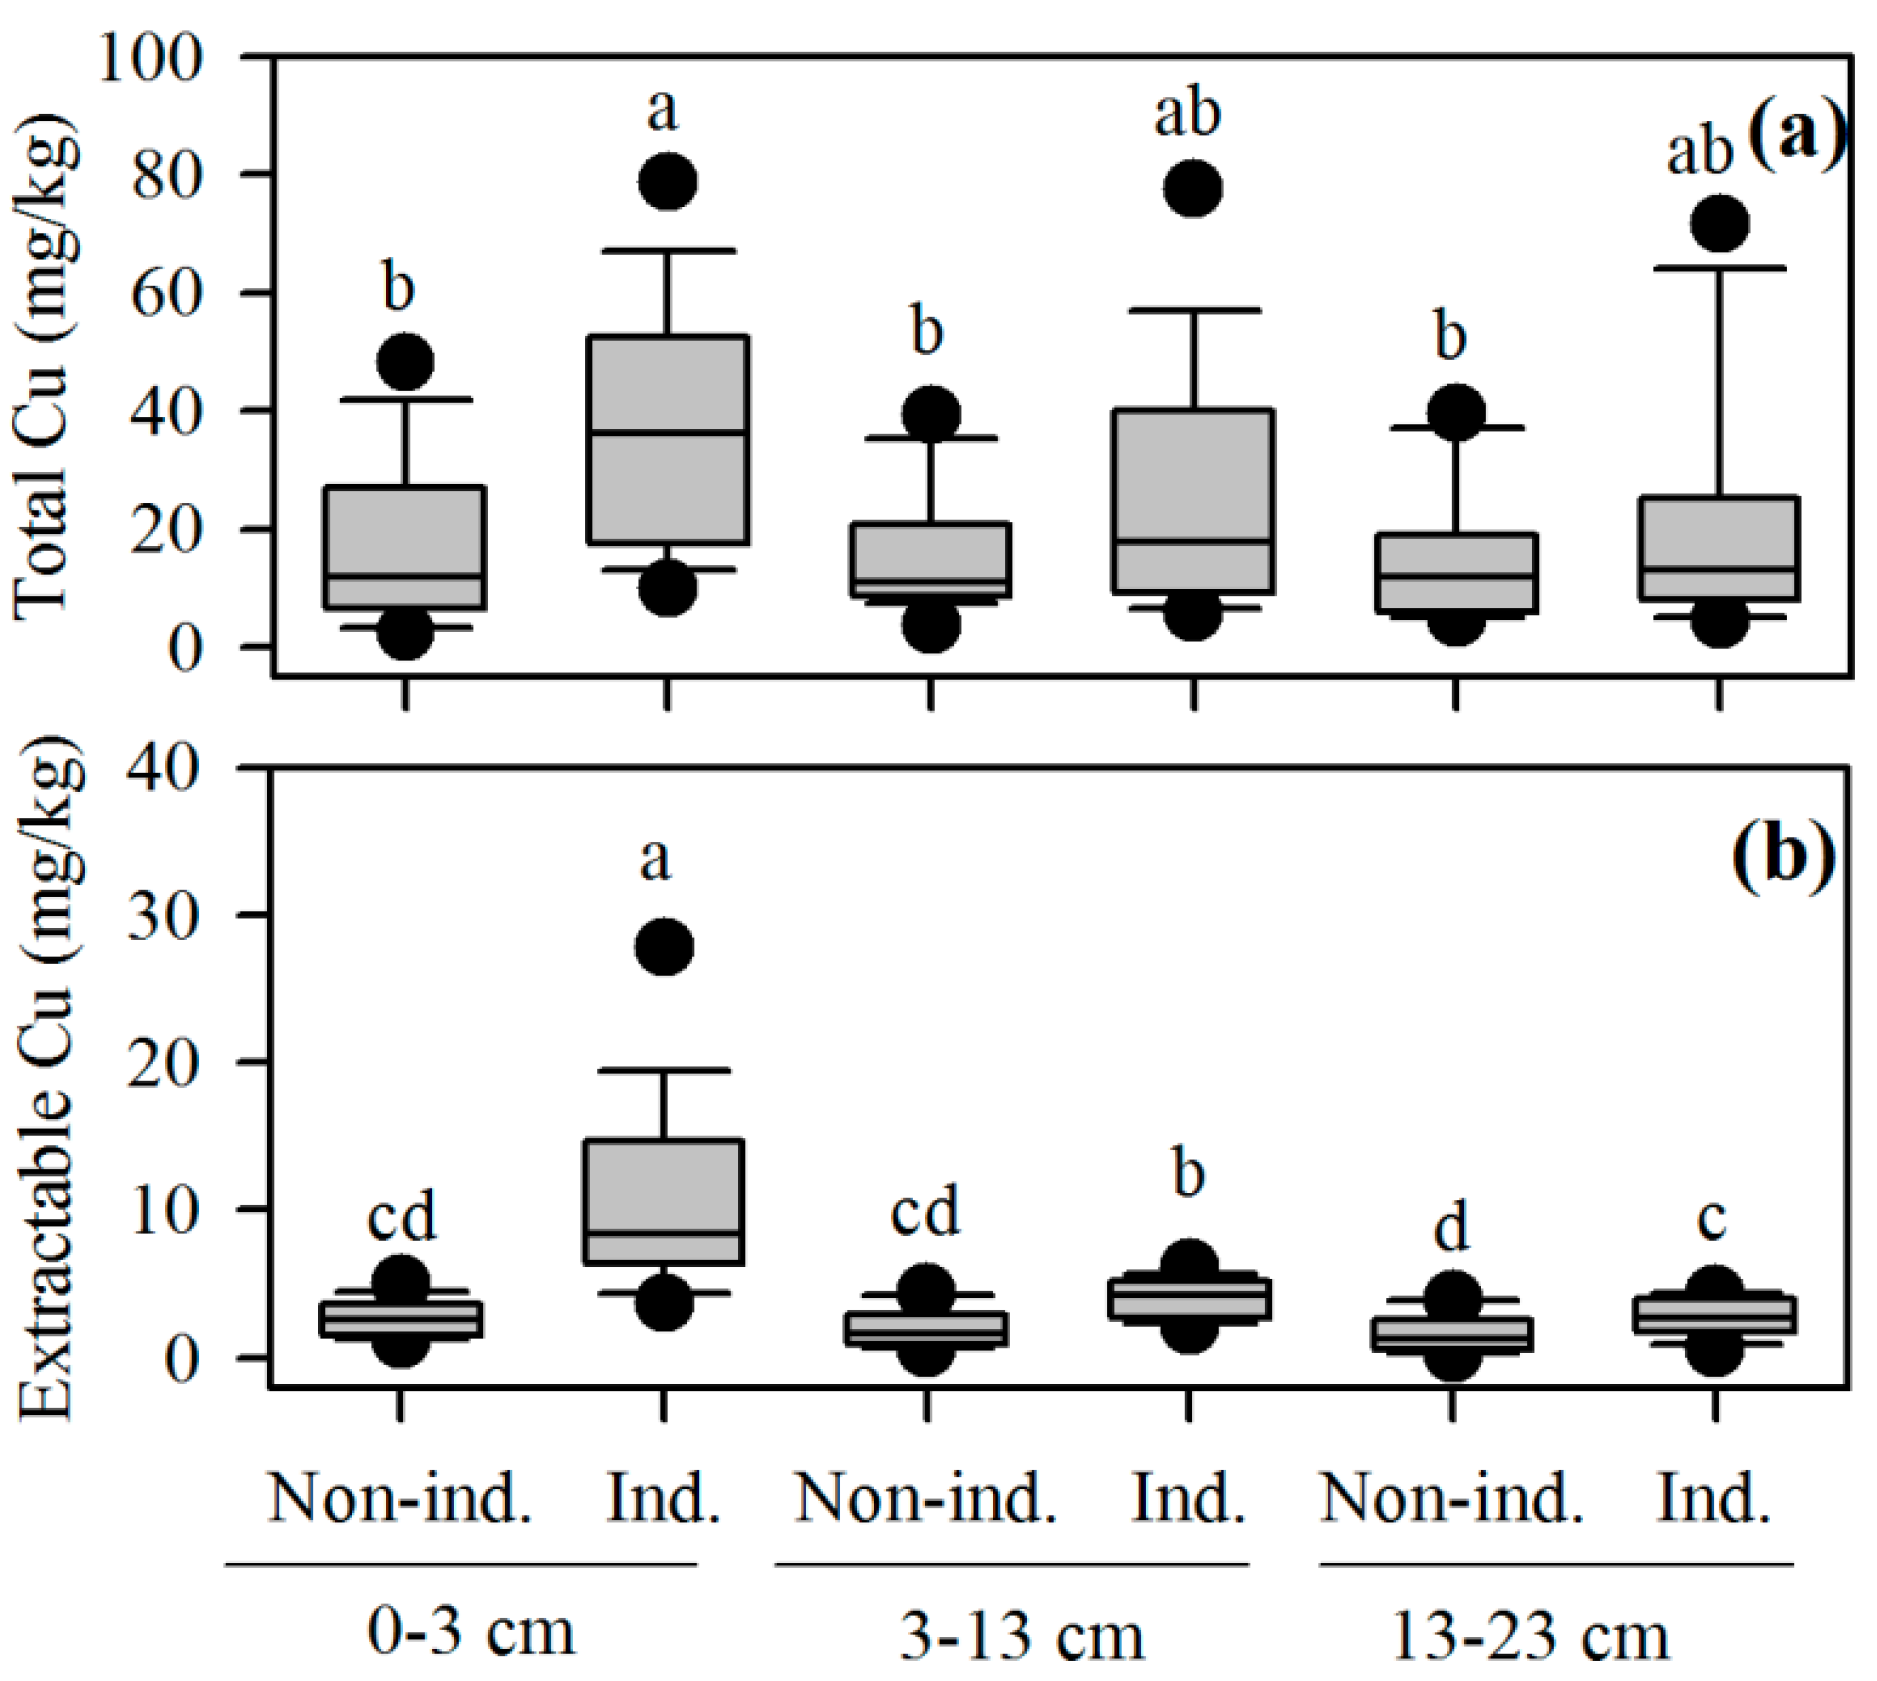
3.2. Comparison between Location Types and Forest Types and among Soil Depths

Total soil Cu, Mn, and Pb concentrations and extractable soil Cu, Zn, Mn, and Pb concentrations were all significantly higher in the industrial locations than in the non-industrial locations, while the trend for total soil Zn concentration was the opposite (Table 3 and Table 4). Total soil Cu, Mn, and Pb concentrations and extractable soil Mn and Pb concentrations were significantly lower in the plantation forests than in the natural forests (Table 3 and Table 4). In contrast, extractable soil Cu and Zn concentrations were significantly higher in the plantation forests than in the natural forests (Table 3 and Table 4), probably because more plantation forests than natural forests were in industrial locations (Table 4). For all soils, total soil Cu and Pb concentrations and extractable soil Cu, Pb, Zn, and Mn concentrations significantly decreased with soil depth (Table 3 and Table 4).
For total soil Pb concentration and extractable soil Mn concentration, interactions between location type and forest type were significant because values were relatively higher in the industrial locations than in the non-industrial locations particularly for the natural forests (Table 3 and Figure 2). For total and extractable soil Cu concentrations, interactions between location type and soil depth were significant because values were relatively higher in the industrial locations than in the non-industrial locations particularly for the upper layer of soil (Table 3 and Figure 3).
Table 2. General characteristics of total and extractable concentrations (mg/kg) of six heavy metals in soils in 16 remnant forests in Foshan, China.
ParameterRangeMedianMeanSDCV (%)Background §
Total Cu2.2–142.815.724.321.086.317.0
Total Zn25.3–999.0111.9202.7206.6101.947.3
Total Mn7.5–1452.532.2102.0257.2252.2279.0
Total Pb1.7–784.825.275.7144.9191.336.0
Total Ni0.7–34.47.07.84.760.014.4
Total Cr1.0–129.227.030.318.259.950.5
Extractable Cu0.2–51.63.34.65.4118.6
Extractable ZnN.D.–101.82.86.410.8169.1
Extractable Mn0.1–535.01.819.769.2351.4
Extractable PbN.D.–383.05.525.063.0252.3
Extractable NiN.D.–6.40.20.50.8165.6
Extractable CrN.D.–1.50.10.20.2101.5
n = 192 for values generated in the current study; § Background value of soils in the A horizon (generally about 20 cm depth) in Guangdong Province where Foshan is located. Values are means (n = 167) published by the China National Environmental Monitoring Centre [31], and these values were generally obtained using methods of field sampling, sample processing, and digestion that were similar to those used in the present study; N.D. indicates not detectable.
Figure 2. Total Pb and extractable Mn concentrations in soils from different location types (industrial vs. non-industrial) and forest types (Nat.: Natural forest; Plant.: Plantation forest). Whiskers indicate the 10th and 90th percentiles; the line in the box indicates the median; dots indicate the 5th and 95th percentiles of the outliers. Different letters indicate significant differences (p < 0.05) between soil groups. Dotted line indicates the background value of Guangdong province [31]. Soil total Pb (a) and extractable Mn (b) concentrations were relatively higher in the industrial locations than in the non-industrial locations particularly for the natural forests.
Forests 05 00885 g002
Table 3. Three-way ANOVA statistics of location type, forest type, soil depth, and interactions on total and extractable concentrations of Cu, Zn, Mn and Pb in soils in 16 remnant forests in Foshan, China.
ParametersValues of F and P Statistics for the Independent Variables
StatisticLocation type (L)Forest Type (F)Soil Depth (D)L × FL × DF × DL × F × D
df 1121222
Total CuF31.815.04.50.53.70.40.1
P0.0000.0000.0120.4660.0250.6480.883
Total ZnF7.81.30.69.30.30.10.1
P0.0060.2500.5570.0030.7280.9180.945
Total MnF14.538.60.31.90.70.10.1
P0.0000.0000.7070.1690.5130.9160.952
Total PbF18.94.76.710.61.40.10.3
P0.0000.0320.0020.0010.2470.8860.759
Extractable CuF89.04.043.74.15.50.60.2
P0.0000.0480.0000.0430.0050.5320.780
Extractable ZnF53.45.677.43.93.01.70.4
P0.0000.0190.0000.0510.0540.1790.665
Extractable MnF15.17.813.64.60.90.10.6
P0.0000.0060.0000.0330.4210.8970.538
Extractable PbF26.96.519.40.21.30.90.5
P0.0000.0120.0000.6690.2730.4200.629
P values < 0.05 are in bold font.
Figure 3. Total (a) and extractable (b) Cu concentrations in soils as affected by soil depth and location type (Non-ind.: non-industrial; Ind.: industrial). Whiskers indicate the 10th and 90th percentiles; the line in the box indicates the median; dots indicate the 5th and 95th percentiles of the outliers. Different letters indicate significant differences (p < 0.05) between soil groups. Soil total (a) and extractable (b) Cu concentrations were relatively higher in the industrial locations than in the non-industrial locations particularly for the upper layer of soil.
Forests 05 00885 g003
Table 4. Mean values of total and extractable metal concentrations in soils as affected by soil depth, forest type and location type.
Soil Depth (cm)Forest TypeLocation TypenCuZnMnPbNiCr
Total Concentration (mg/kg)
0–3NaturalNon-industrial1622.0334.147.928.110.327.5
Industrial1648.9129.8304.5256.28.130.5
PlantationNon-industrial810.2121.915.934.112.979.8
Industrial2433.2171.147.465.35.525.5
3–13NaturalNon-industrial1618.3331.350.821.89.023.4
Industrial1630.796.4273.3134.58.430.1
PlantationNon-industrial810.1124.813.925.012.253.3
Industrial2421.8195.141.253.75.022.4
13–23NaturalNon-industrial1617.7344.462.525.810.226.5
Industrial1625.8105.7273.7148.37.130.4
PlantationNon-industrial89.3159.816.928.510.152.9
Industrial2420.8225.436.648.04.620.3
Background §16717.047.3279.036.014.450.5
Extractable Concentration (mg/kg)
0–3NaturalNon-industrial162.44.04.26.51.10.3
Industrial1614.719.692.093.20.90.3
PlantationNon-industrial83.37.72.89.10.50.2
Industrial249.018.511.425.21.20.2
3–13NaturalNon-industrial161.81.52.14.30.20.3
Industrial163.94.954.363.80.30.1
PlantationNon-industrial82.41.91.02.10.20.2
Industrial244.14.02.47.70.30.1
13–23NaturalNon-industrial161.61.23.63.90.10.3
Industrial162.42.955.164.20.20.1
PlantationNon-industrial81.91.90.92.70.10.2
Industrial242.92.01.25.00.10.1
§ Background value of soils in the A horizon (generally about 20 cm depth) in Guangdong province, China where Foshan located, data is mean value, n = 167 [31].
Total soil Cu and Pb concentrations were greater than the background concentrations in the industrial locations but were similar to the background concentrations in the non-industrial locations (Table 4). Total soil Zn concentration was markedly higher than the background concentration for all soil depths, both forest types, and both location types (Table 4). The mean total soil Mn concentration was much lower than its background value for both location types and forest types except for the natural forests in the industrial locations where the mean total soil Mn concentration was similar to the background concentration (Table 4).
The concentration of each extractable heavy metal expressed as a percentage of the total concentration of heavy metals and across all soils was highest for Pb (mean 28.1%) and Cu (25.8%); was intermediate for Mn (10.3%), Ni (7.8%), and Zn (5.8%); and was lowest for Cr (1.0%) (Table 5). The percentages of extractable Zn, Mn, Pb, and Ni were significantly higher in the industrial than in the non-industrial locations (Table 5).
Table 5. The concentration of each extractable heavy metal expressed as a percentage of the total concentration of heavy metals as affected soil depth, forest type, and location type.
Soil DepthForest TypeLocation TypenCuZnMnPbNiCr
0–3 cmNaturalNon-industrial1625.12.49.831.710.81.0
Industrial1629.314.820.728.311.31.3
PlantationNon-industrial840.06.118.129.04.40.3
Industrial2437.417.521.449.324.20.7
3–13 cmNaturalNon-industrial1617.01.14.125.12.51.5
Industrial1618.65.711.228.43.70.6
PlantationNon-industrial823.31.87.712.61.80.4
Industrial2430.65.56.330.75.90.7
13–23 cmNaturalNon-industrial1620.70.94.223.66.41.3
Industrial1618.92.910.121.12.80.5
PlantationNon-industrial822.31.35.712.91.20.6
Industrial2423.32.24.421.65.01.9

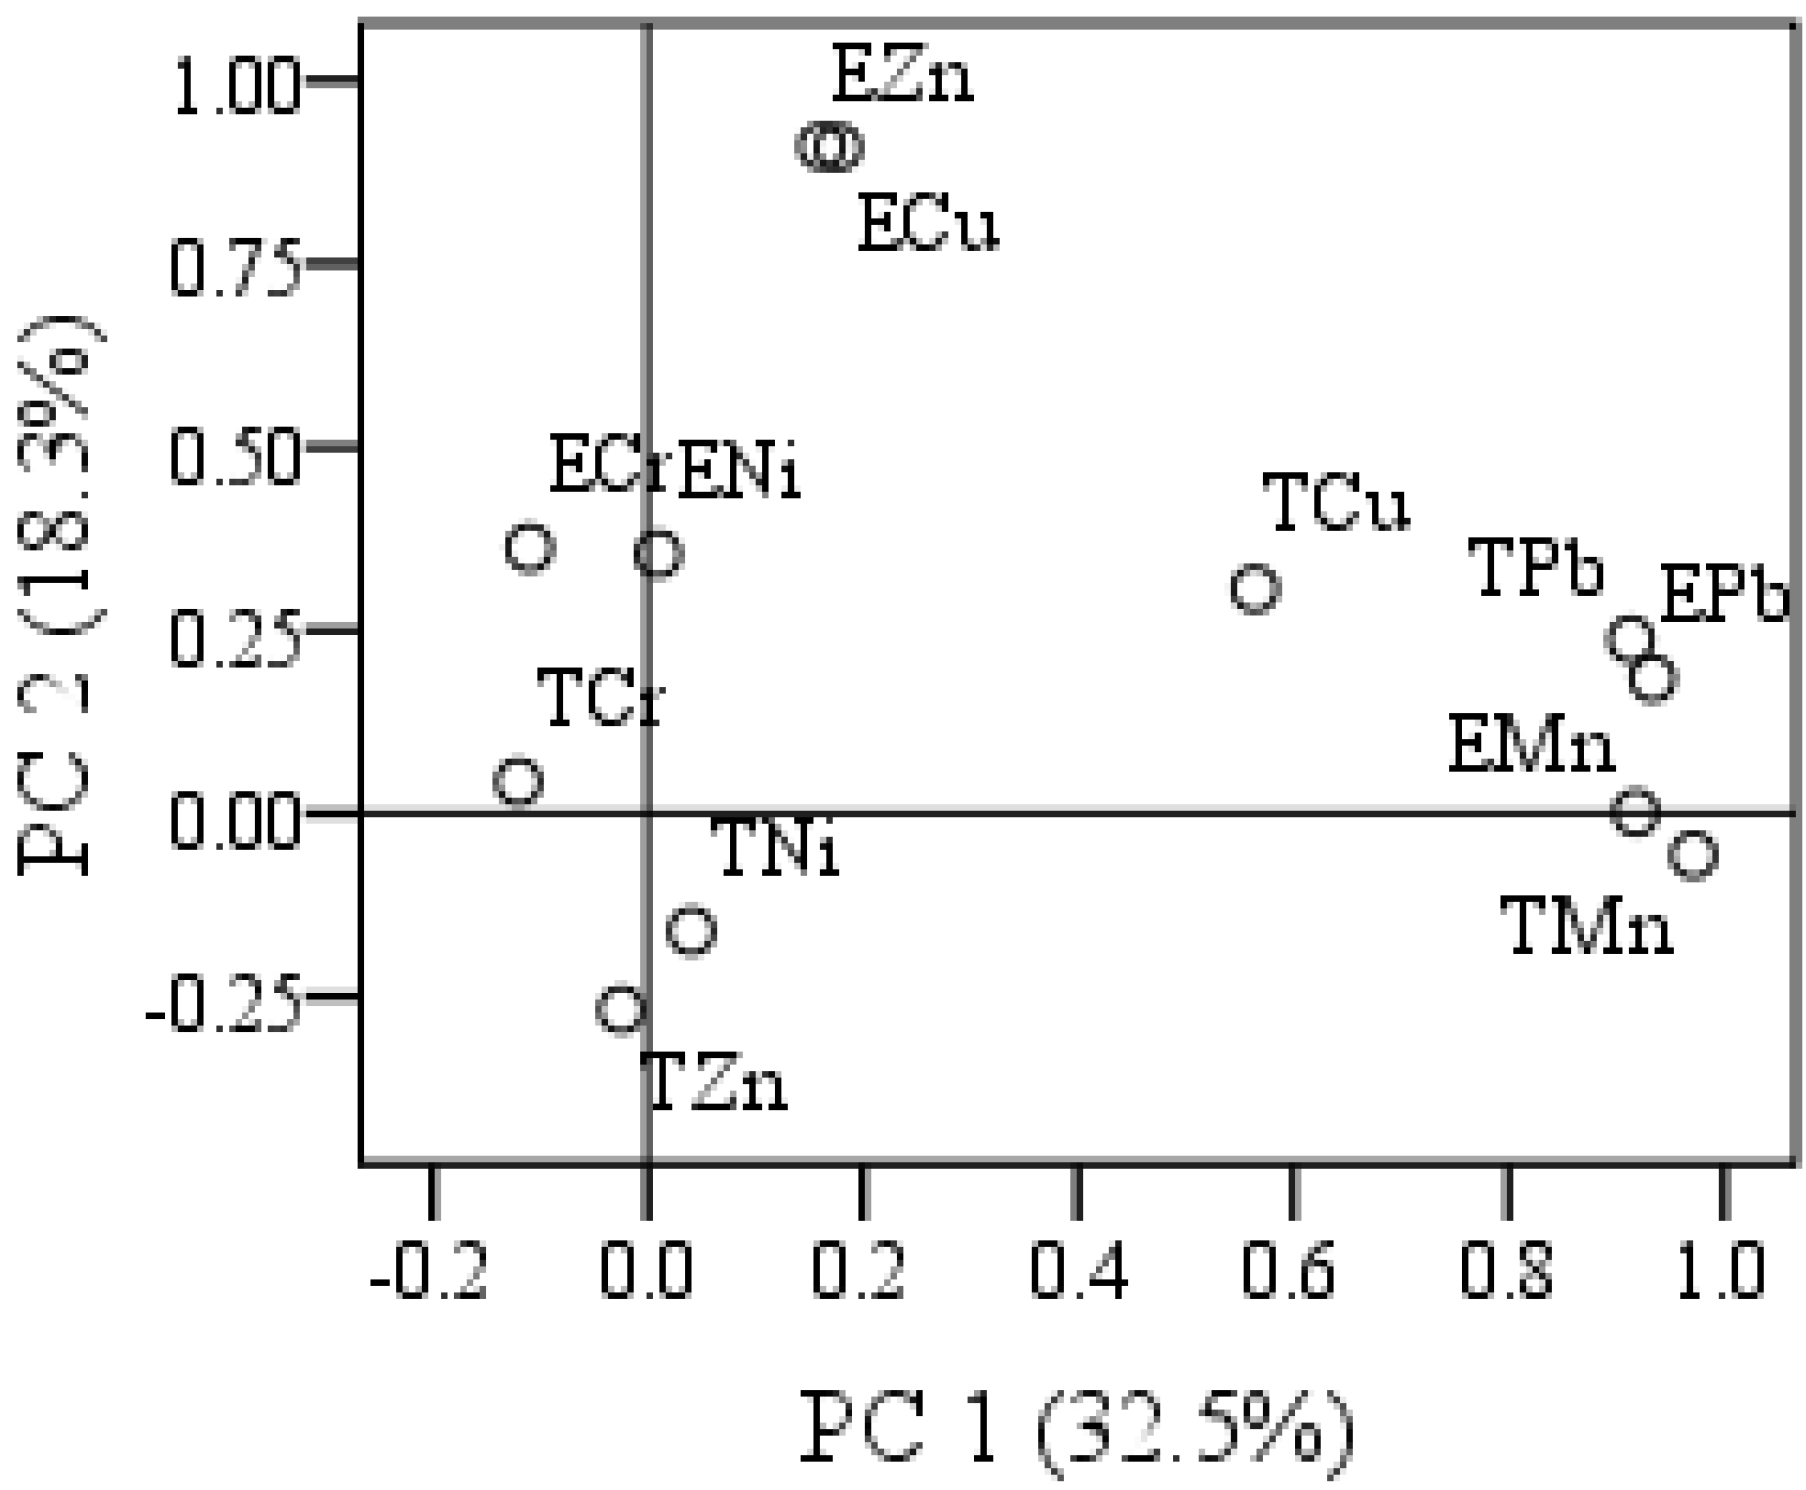
3.3. Correlations and PCA Analysis

Total soil Cu, Zn, and Mn concentrations were positively correlated with each other but the relationships were weak (r = 0.18–0.33, p < 0.05; Table 6). Extractable soil Cu, Zn, Mn, Pb, and Ni concentrations were positively correlated with each other (r = 0.32–0.71, p < 0.05; Table 6). Positive correlations were also evident between the total and the extractable soil concentrations for Cu (r = 0.32, p < 0.05), Mn (r = 0.47, p < 0.05), and Pb (r = 0.64, p < 0.05). According to PCA analysis, PC1 explained 32.5% of the total variation and was occupied by total soil Cu, Pb, and Mn concentrations and extractable soil Mn and Pb concentrations (Figure 4); PC2 explained 18.3% of the total variation and was occupied by extractable soil Zn and Cu concentrations (Figure 4).
Figure 4. Principal component analysis (PCA) of total and extractable concentrations of six heavy metals in soils in 16 remnant forests in Foshan, China. TCu, TZn, TMn, TPb, TCr and TNi indicate total soil concentrations of Cu, Zn, Mn, Pb, Cr and Ni, respectively; ECu, EZn, EMn, EPb, ECr and ENi indicate extractable soil concentrations of Cu, Zn, Mn, Pb, Cr and Ni, respectively.
Forests 05 00885 g004
Table 6. Coefficients (r values) of correlations among total and extractable metal concentrations in soils in 16 remnant forests in Foshan, China.
Total CuTotal ZnTotal MnTotal PbTotal NiTotal CrEx. CuEx. ZnEx. MnEx. PbEx. Ni
Total Zn0.28
Total Mn0.330.18
Total Pb0.26−0.200.16
Total Ni0.080.23−0.040.05
Total Cr−0.110.10−0.390.040.71
Ex. Cu0.32−0.250.010.36−0.28−0.06
Ex. Zn0.39−0.040.130.39−0.09−0.070.59
Ex. Mn0.22−0.190.470.49−0.09−0.160.500.61
Ex. Pb0.36−0.080.370.64−0.05−0.150.500.690.71
Ex. Ni0.350.210.260.090.06−0.020.320.550.350.30
Ex. Cr0.310.47−0.06−0.270.210.06−0.230.08−0.36−0.220.37
P values less than 0.05 are in bold font; n = 192; “Ex.” is the abbreviation of “Extractable”.

4. Discussion

4.1. Potential Risks of Heavy Metals in the Soils at Industrial and non-Industrial Locations

Total soil Cu, Pb, and Zn concentrations in the industrial locations were all considerably higher than the background values. Total soil Cu and Pb concentrations in the industrial locations were also significantly higher than those in the non-industrial locations. These results were consistent with a previous study on the concentrations of these metals in plant and soil samples in large forest reserves along an urban-rural gradient in the PRD [22]. The results of the previous and current study indicate that forest ecosystems in the urbanized areas of the PRD general suffer from Cu, Pb, and Zn contamination.
Because no heavy metal-containing fertilizers or agricultural or industrial wastes have been applied to these forests, the high concentrations of heavy metals in the soil may be largely attributed to atmospheric deposition [7,8,18]. Values for the annual atmospheric deposition of Zn, Pb, and Cu in the PRD, especially in the urbanized areas, are generally higher than those reported in North America (e.g., the Great Lakes) and Europe (e.g., the North Sea) [7]. A recent study showed that particulate matter with a diameter <2.5 μm (PM2.5) in the PRD, especially in Foshan, contained >1.5-times the concentrations of Zn (1360–3260 ng/m3), Pb (450–1080 ng/m3), and Cu (190–250 ng/m3) than the particulate matter in several big cities in both China and other countries (e.g., Beijing in China and Cantabria in Spain) (Zn: 62–600 ng/m3; Pb: 7.1–320 ng/m3; Cu: 3.4–70 ng/m3) [18].
For the non-industrial locations, total soil Zn concentrations (121.9–344.4 mg/kg) were markedly higher than the background value for Guangdong Province (47.3 mg/kg) (Table 4), a finding that agrees with previous reports [20,22]. In another previous study, the rate of atmospheric deposition was found to be five to 111 times higher for Zn (3740–6440 ng/m3) than for Cu (34–914 ng/m3) or Pb (147–995 ng/m3) in this area [8]. These findings suggest that the Zn concentration in soil was strongly influenced by atmospheric Zn deposition in the study area, although it is also possible that the background value of total soil Zn concentration in the PRD is higher than in the other areas of Guangdong Province; this possibility requires further examination.
Total soil Ni and Cr concentrations in the industrial and non-industrial locations were all lower than or similar to background values, suggesting that soil Ni and Cr concentrations have been little influenced by exogenous sources in the studied remnant forests. Although the mean total Mn concentration in all soils was lower than the background value, both total and extractable soil Mn concentrations were significantly higher in the industrial than in the non-industrial locations (Table 4 and Figure 2), suggesting the possibility of Mn contamination of the soils in the industrial locations. This result was consistent with a previous study in which foliar Mn concentrations for 10 woody species were higher in an industrial location than in a non-industrial location in the study area [20]. Close relationships of soil Mn concentrations with soil Pb and Cu concentrations (Figure 4 and Table 6) also suggest that soil has been contaminated with Mn in the study area, given that soil Pb and Cu concentrations appear to have been significantly influenced by exogenous sources.

4.2. Comparisons between Forest Types and among Soil Depths

Total soil Pb, Cu, and Mn concentrations and exchangeable soil Pb and Mn concentrations were all significantly higher in the natural forests than in the plantation forests. This result might be partly explained by the removal of these heavy metals by timber harvest or by the enhanced leaching of heavy metals after timber harvest [10,32,33]. The latter hypothesis is supported by the higher solubility of Cu, Mn, and Pb than of Zn, Ni, and Cr in the study area (Table 5) [22]. It is also possible that the canopy cover is more closed in the remnant natural forests than in the remnant plantation forests, and a closed canopy might reduce the deposition of atmospheric particulates, which would then reduce heavy metal deposition to the soil via throughfall and litterfall [34,35]. The interactions of total soil Pb concentration and extractable soil Mn concentration between location type and forest type (Figure 2) suggest that remnant natural forests at the industrial locations faced the highest potential Pb and Mn contamination.
Assessments of heavy metal pollution of soil usually focus only on surface soils because researchers usually assume that exogenous heavy metals may mainly be retarded in the surface soils [13,14,36]. This assumption was supported by the significant decreases in soil Cu, Zn, Mn, and Pb concentrations with soil depth (Table 3 and Table 4) and by the interactions of total and extractable soil Cu concentrations with location type and soil depth in the present study (Table 3 and Figure 3). Soil Zn and Mn concentrations significantly decreased with soil depth in the extractable forms but not in the total forms, suggesting that exchangeable forms of soil metals were more responsive to external inputs than the total forms [37,38]. However, the accumulation of heavy metals in surface soils may also depend on other factors, such as soil binding capacity, solubility of heavy metals, and plant cycling [11,39,40].

4.3. Implications for Soil Management

Our results from the PRD of China suggest that exogenous sources have resulted in significantly elevated levels of soil Zn in remnant forests at both industrial and non-industrial locations, and in significantly elevated levels of Pb, Cu, and Mn sources in remnant forests at industrial locations. In addition, all of the sampled soils were strongly acidic (pHH2O < 4.5), with <20% saturation of base cations [6] and a generally low availability of phosphorus [41]. Phosphate rocks are inexpensive and easy to obtain and may benefit forest growth by immobilizing harmful heavy metals [42] and aluminum [43], alleviating soil acidity [44], and supplying phosphorus and calcium [45]. Therefore, the application of phosphate rock with CaO and P2O5 as the main constituents may be cost effective for the remnant forests in the PRD, especially in the industrial areas.

5. Conclusions

Our results demonstrate that remnant forest soils contain high total Zn concentrations at both industrial and non-industrial locations in the PRD and also contain high total Cu and Pb concentrations at industrial locations, suggesting the potential toxicity effects of Zn, Cu and Pb on vegetation in the remnant forests in the PRD. These patterns agree with previous studies of the levels and compositions of heavy metals in the atmospheric depositions in this region [7,8,18]. Total and/or extractable concentrations of Cu, Pb, and Mn in soils were significantly higher in the natural forests than in the plantation forests, suggesting that the risk of Cu, Pb, and Mn toxicity to vegetation is greater in the natural forests. Based on these results and previous studies, we recommend the application of phosphate rock to the soils in the remnant forests of the PRD.

Acknowledgments

We are very grateful to two anonymous reviewers for their constructive comments. We also thank Hao Zhang (Fudan University, China) for information on industrial and non-industrial towns in Foshan, China. This research was supported by the Agricultural and Forestry Promotion Project of Nanhai Agro-forestry Extension Centre, Guangdong Province (No. 084101001), the Natural Science Foundation of Guangdong Province (No.8151065005000016), and the National Natural Science Foundation of China (No. 31070409).

Author Contributions

Conceived and designed the experiments: Enqing Hou, Huimin Xiang and Dazhi Wen; performed the experiments: Enqing Hou, Huimin Xiang, Jianli Li and Jiong Li; Wrote the paper: Enqing Hou and Dazhi Wen.

Conflicts of Interest

The authors declare no conflict of interest.

References

  1. Jim, C.Y. Holistic research agenda for sustainable management and conservation of urban woodlands. Landsc. Urban Plan. 2011, 100, 375–379. [Google Scholar] [CrossRef]
  2. Sukopp, H. Human-caused impact on preserved vegetation. Landsc. Urban Plan. 2004, 68, 347–355. [Google Scholar] [CrossRef]
  3. Hu, L.; Li, Z.; Liao, W.B.; Fan, Q. Values of village fengshui forest patches in biodiversity conservation in the Pearl River Delta, China. Biol. Conserv. 2011, 144, 1553–1559. [Google Scholar] [CrossRef]
  4. Gao, H.; Ouyang, Z.; Chen, S.; Koppen, C.S.A. Role of culturally protected forests in biodiversity conservation in Southeast China. Biodivers. Conserv. 2013, 22, 531–544. [Google Scholar] [CrossRef]
  5. Jim, C.Y. Soil recovery from human disturbance in tropical woodlands in Hong Kong. Catena 2003, 52, 85–103. [Google Scholar] [CrossRef]
  6. Hou, E.; Wen, D.; Li, J.; Zuo, W.; Zhang, L.; Kuang, Y.; Li, J. Soil acidity and exchangeable cations in remnant natural and plantation forests in the urbanised Pearl River Delta, China. Soil Res. 2012, 50, 207–215. [Google Scholar] [CrossRef]
  7. Wong, C.S.C.; Li, X.D.; Zhang, G.; Qi, S.H.; Peng, X. Atmospheric deposition of heavy metals in the Pearl River Delta, China. Atmos. Environ. 2003, 37, 767–776. [Google Scholar] [CrossRef]
  8. Lee, C.S.L.; Li, X.; Zhang, L.; Zhang, G.; Peng, X. Biomonitoring of trace metals in the atmosphere using moss (Hypnum plumaeforme) in the Nanling Mountains and the Pearl River Delta, Southern China. Atmos. Environ. 2005, 39, 397–407. [Google Scholar] [CrossRef]
  9. Rademacher, P. Atmospheric Heavy Metals and Forest Ecosystems; Work report of the Institute for World Forestry: Hamburg, Germany, 2013. [Google Scholar]
  10. Berthelsen, B.O.; Steinnes, E. Accumulation patterns of heavy metals in soil profiles as affected by forest clear-cutting. Geoderma 1995, 66, 1–14. [Google Scholar] [CrossRef]
  11. Steinnes, E.; Friedland, A.J. Metal contamination of natural surface soils from long-range atmospheric transport: Existing and missing knowledge. Environ. Rev. 2006, 14, 169–169. [Google Scholar] [CrossRef]
  12. Bergkvist, B.; Folkeson, L.; Berggren, D. Fluxes of Cu, Zn, Pb, Cd, Cr, and Ni in temperate forest ecosystems—A literature review. Water Air Soil Poll. 1989, 47, 217–286. [Google Scholar] [CrossRef]
  13. Pouyat, R.V.; Mcdonnell, M.J. Heavy-metal accumulations in forest soils along an urban-rural gradient in southeastern New York, USA. Water Air Soil Poll. 1991, 57–58, 797–807. [Google Scholar] [CrossRef]
  14. Nygård, T.; Steinnes, E.; Røyset, O. Distribution of 32 elements in organic surface soils: Contributions from atmospheric transport of pollutants and natural sources. Water Air Soil Poll. 2012, 223, 699–713. [Google Scholar] [CrossRef]
  15. Statistics Bureau of Guangdong Province. Main data of the 6th National Census Bulletin of Guangdong Province, 2011. Available online: http://www.gdstats.gov.cn/tjzl/tjgb/201105/t20110511_83329.html (accessed on 9 January 2014). (in Chinese)
  16. Weng, Q.H. Land use change analysis in the Zhujiang Delta of China using satellite remote sensing, GIS and stochastic modelling. J. Environ. Manag. 2002, 64, 273–284. [Google Scholar] [CrossRef]
  17. Zhang, H.; Ma, W.C.; Wang, X.R. Rapid urbanization and implications for flood risk management in hinterland of the Pearl River Delta, China: The Foshan study. Sensors 2008, 8, 2223–2239. [Google Scholar] [CrossRef]
  18. Wang, Q.; Tan, J.; Ma, Y.; He, K.; Wei, L.; Yang, F.; Yu, Y.; Wang, J. Characteristics of heavy metals in PM2.5 during winter in Foshan city. China Environ. Sci. 2012, 32, 1384–1391. (in Chinese). [Google Scholar]
  19. Chen, T.B.; Chen, H.; Tian, Q.Z.; Zheng, Y.M.; Lei, M.; Huang, Z.C.; Wu, X.; Wu, H.T.; Fan, K.K.; Yu, K. Assessment of heavy metal pollution in surface soils of urban parks in Beijing, China. Chemosphere 2005, 60, 542–551. [Google Scholar] [CrossRef]
  20. Zhang, L.L.; Wang, H.E.; Li, J.; Kuang, Y.W.; Wen, D.Z. Physiological responses and accumulation of pollutants in woody species under in situ polluted condition in Southern China. J. Plant Res. 2013, 126, 95–103. [Google Scholar] [CrossRef]
  21. Wen, D.Z.; Kuang, Y.W.; Liu, S.Z.; Zhang, D.Q.; Lu, Y.D.; Li, J.L. Evidences and implications of vegetation damage from ceramic industrial emission on a rural site in the Pearl River Delta of China. J. Forest. Res. 2006, 17, 7–12. [Google Scholar] [CrossRef]
  22. Sun, F.F.; Wen, D.Z.; Kuang, Y.W.; Li, J.; Zhang, J.G. Concentrations of sulphur and heavy metals in needles and rooting soils of Masson pine (Pinus massoniana L.) trees growing along an urban-rural gradient in Guangzhou, China. Environ. Monit. Assess. 2009, 154, 263–274. [Google Scholar] [CrossRef]
  23. China International Urbanization Development Strategy Research Committee. Report of Urbanization Rate in China; CIUDSRC: Beijing, China, 2008. (in Chinese) [Google Scholar]
  24. Food and Agriculture Organization of the United Nations—United Nations Educational, Scientific and Cultural Organization. FAO-UNESCO Soil Map of the World; (Volume 1); UNESCO: Paris, France, 1974. [Google Scholar]
  25. Liao, Y.H.; Chen, H.Y.; Wang, Z.; Chen, C.G.; Liu, L.W. Study on community of fengshui woods and the value of application in construction of ecological public welfare forest. J. Subtro. Res. Environ. 2008, 3, 42–48. (in Chinese). [Google Scholar]
  26. Zhuang, X. Floristic composition and conservation of the Fungshui woods in Guangdong’s Pearl River Delta and Hong Kong. Guangdong For. Sci. Technol. 2012, 28, 72–76. (in Chinese). [Google Scholar]
  27. Zhang, H.; Department of Environmental Science and Engineering, Fudan University. Personal Communication. 2014. [Google Scholar]
  28. Soil Classification Working Group (SCWG). The Canadian System of Soil Classification; NRC Research Press: Ottawa, ON, Canada, 1998. [Google Scholar]
  29. State Environmental Protection Administration of China (SEPAC). The Technical Specification for Soil Environmental Monitoring; HJ/T 166-2004; Environmental Press of China: Beijing, China, 2004. (in Chinese) [Google Scholar]
  30. USEPA. Method 3052: Microwave Assisted Acid Digestion of Siliceous and Organically Based Matrices. US Environmental Protection Agency (USEPA): Washington, DC, USA, 1996. [Google Scholar]
  31. China National Environmental Monitoring Centre. Background Values of Soil Elements in China; Environmental Science Press of China: Beijing, China, 1990. (in Chinese) [Google Scholar]
  32. Scott, N.A.; Likens, G.E.; Eaton, J.S.; Siccama, T.G. Trace metal loss following whole-tree harvest of a northeastern deciduous forest, USA. Biogeochemistry 2001, 54, 197–217. [Google Scholar] [CrossRef]
  33. Pulford, I.D.; Watson, C. Phytoremediation of heavy metal-contaminated land by trees—A review. Environ. Int. 2003, 29, 529–540. [Google Scholar] [CrossRef]
  34. Nieminen, T.M.; Derome, J.; Helmisaari, H.S. Interactions between precipitation and Scots pine canopies along a heavy-metal pollution gradient. Environ. Poll. 1999, 106, 129–137. [Google Scholar] [CrossRef]
  35. Brandford, D.; Flower, D.; Moghaddam, M.V. Study of aerosol deposition at a wind exposed forest edge using 210Pb and 137Cs soil inventories. Water Air Soil Poll. 2004, 57, 107–116. [Google Scholar]
  36. Chen, T.; Wong, J.; Zhou, H.; Wong, M. Assessment of trace metal distribution and contamination in surface soils of Hong Kong. Environ. Poll. 1997, 96, 61–68. [Google Scholar] [CrossRef]
  37. Bermudez, G.M.A.; Moreno, M.; Invernizzi, R.; Plá, R.; Pignata, M.L. Heavy metal pollution in topsoils near a cement plant: The role of organic matter and distance to the source to predict total and HCl-extracted heavy metal concentrations. Chemosphere 2010, 78, 375–381. [Google Scholar]
  38. Chen, Z.S. Relationship between Heavy Metal Concentrations in Soils of Taiwan and Uptake by Crops. Food & Fertilizer Technology Center: Taipei, Taiwan, 2010. [Google Scholar]
  39. Lee, B.D.; Carter, B.J.; Basta, N.T.; Weaver, B. Factors influencing heavy metal distribution in six Oklahoma benchmark soils. Soil Sci. Soc. Am. J. 1997, 61, 218–223. [Google Scholar] [CrossRef]
  40. Blaser, P.; Zimmermann, S.; Luster, J.; Shotyk, W. Critical examination of trace element enrichments and depletions in soils: As, Cr, Cu, Ni, Pb, and Zn in Swiss forest soils. Sci. Total Environ. 2000, 249, 257–280. [Google Scholar] [CrossRef]
  41. Hou, E.; Chen, C.; Li, J.; Zuo, W.; Wang, Y.; Wang, X.; Wen, D. Soil inorganic phosphorus fractions of remnant native and plantation forests in Foshan region. J. Trop. Subtrop. Bot. 2012, 20, 546–554. [Google Scholar]
  42. Lin, C.W.; Lian, J.; Fang, H.H. Soil lead immobilization using phosphate rock. Water Air Soil Poll. 2005, 161, 113–123. [Google Scholar] [CrossRef]
  43. Alloush, G.A.; Clark, R.B. Maize response to phosphate rock and arbuscular mycorrhizal fungi in acidic soil. Commun. Soil Sci. Plant Anal. 2001, 32, 231–254. [Google Scholar] [CrossRef]
  44. Rajan, S.S.S.; Watkinson, J.H.; Sinclair, A.G. Phosphate rocks for direct application to soils. Adv. Agron. 1996, 57, 77–159. [Google Scholar] [CrossRef]
  45. Nabahungu, N.; Semoka, J.; Zaongo, C. Limestone, Minjingu phosphate rock and green manure application on improvement of acid soils in Rwanda. In Advances in Integrated Soil Fertility Management in Sub-Saharan Africa: Challenges and Opportunities; Springer: Dordrecht, The Netherlands, 2007; pp. 703–712. [Google Scholar]

