Article

Biomass and Carbon Stocks of Sofala Bay Mangrove Forests

by
Almeida A. Sitoe
1,*,
Luís Júnior Comissário Mandlate
2 and
Benard S. Guedes
1
1
Department of Forestry, Faculty of Agronomy and Forestry, Eduardo Mondlane University, P.O. Box 257, Maputo, Mozambique
2
Course of Forest Engineer, Agriculture Division, Higher Polytechnic Institute of Gaza, Chókwè, Mozambique
*
Author to whom correspondence should be addressed.
Forests 2014, 5(8), 1967-1981; https://doi.org/10.3390/f5081967
Submission received: 8 January 2014 / Revised: 25 July 2014 / Accepted: 5 August 2014 / Published: 14 August 2014
(This article belongs to the Special Issue Forest and Wood Vegetation Carbon Stores and Sequestration)

Abstract

:
Mangroves could be key ecosystems in strategies addressing the mitigation of climate changes through carbon storage. However, little is known regarding the carbon stocks of these ecosystems, particularly below-ground. This study was carried out in the mangrove forests of Sofala Bay, Central Mozambique, with the aim of quantifying carbon stocks of live and dead plant and soil components. The methods followed the procedures developed by the Center for International Forestry Research (CIFOR) for mangrove forests. In this study, we developed a general allometric equation to estimate individual tree biomass and soil carbon content (up to 100 cm depth). We estimated the carbon in the whole mangrove ecosystem of Sofala Bay, including dead trees, wood debris, herbaceous, pneumatophores, litter and soil. The general allometric equation for live trees derived was [Above-ground tree dry weight (kg) = 3.254 × exp(0.065 × DBH)], root mean square error (RMSE = 4.244), and coefficient of determination (R2 = 0.89). The average total carbon storage of Sofala Bay mangrove was 218.5 Mg·ha−1, of which around 73% are stored in the soil. Mangrove conservation has the potential for REDD+ programs, especially in regions like Mozambique, which contains extensive mangrove areas with high deforestation and degradation rates.

1. Introduction

One of the main tropical and subtropical ecosystems that provide numerous functions and services are mangrove forests. Mangroves are largely confined to the regions between 30° North and South of the Equator, with notable extensions beyond this to the north in Bermuda (32°20′ N) and Japan (34°38′ N), and to the south in Australia (38°45′ S), New Zealand (38°03′ S) and the east coast of South Africa (32°59′ S). Within these confines, they are widely distributed, although their latitudinal development is restricted along the western coasts of the Americas and Africa, as compared to the equivalent eastern coasts. In the Pacific Ocean, natural mangrove communities are limited to Western areas, and they are absent on many Pacific Islands [1,2,3,4,5,6,7,8,9,10]. Mangrove forests cover approximately 137,760 km2 worldwide [1] and are more productive in terms of net primary production than most types of forests. These ecosystems provide coastal protection, habitat, shelter, nursery and breeding grounds for many fish and crustaceous species and other sea and terrestrial fauna [4,10,11,12,13].
Carbon storage is one of the most important environmental services provided by mangrove forest. Even though data shows that the total carbon storage in mangrove forests is exceptionally high compared with most upland forest types, little has been done to quantify the amount of carbon stored. Donato et al. [8], found that the total carbon storage in mangroves could reach an average of 1023 Mg·ha−1. These carbon stocks may result from a combination of a high density of large trees (trees may reach up to 2 m in diameter), organic-rich peat soils and generally deep growth (5 m or more) [14]. However, over the past 50 years, approximately one-third of the world’s mangrove forests has been lost due to anthropogenic activities [3], making them a significant source of greenhouse gas (GHG) emissions.
In Mozambique, mangrove forests occur in protected shoreline, deltas, and estuaries that are distributed mainly along the coastline. They are important coastal ecosystems providing ecological, economic, and environmental benefits to local people [15,16]. The area of mangrove forest in Mozambique decreased from 408,000 ha in 1972 to 357,000 ha in 2004, resulting in a deforestation rate of 15.9 km2·year−1 [17]. Mangrove deforestation and degradation is mainly attributed to anthropogenic causes such as collection of firewood, charcoal, poles production, salt production, water pollution, and changes in freshwater flow of the main rivers due to dam construction upstream [12,15,16,17,18]. However, coastal sand deposition has also been indicated as one of the causes of massive mangrove mortality [19,20].
Although worldwide estimations of emissions from deforestation vary depending on the definitions used and pools accounted (8.1 Gt CO2 year−1 according to Baccini et al. [21], and 3.0 Gt CO2 year−1 according to Harris et al. [22]) there is an agreement that during the period of 2000–2005 the gross emissions from deforestation were 3 Gt CO2 year−1 [23], equivalent to around 10% of global anthropogenic GHG emissions. The United Nations Framework Convention on Climate Changes (UNFCCC) in recent years agreed to study and consider a new initiative led by forest-rich developing countries that call for economic incentives aiming to reduce carbon emissions through reduction of deforestation levels in these countries (REDD+) [24,25,26]. However, the feasibility of such a program depends on the availability of sound information on carbon storage in various forests and how much carbon may be released when these forests are converted. To inform the design and implementation of REDD+ strategies, in the past five years, several studies have been carried out, quantifying carbon storage in tropical forests. In Mozambique, carbon studies are still very limited, and most of them are focused on miombo woodlands [27,28] and only a few on mangroves [29,30]. Therefore, the main objective of this study is to quantify above-ground and below-ground carbon storage in the mangroves of the Sofala Bay. This region is estimated as having the largest mangrove area and the second highest rate of deforestation of mangrove in Mozambique, estimated at 4.9% per year after Maputo with 15% [31].

2. Methods and Study Area

2.1. Description of the Study Area

The study was carried out in Sofala Bay, Central Mozambique, located at the estimated coordinates 20°11′ S and 34°45′ E. The area is known as the greatest continental platform of the African East Coast and the average depth is less than 20 m [32]. Although the mangrove forest of Sofala Bay covers a large area, this study was conducted around the city of Beira, where mangrove deforestation is particularly high [33], in the estuaries of Pungue and Buzi Rivers in the southern part of the town and the Savane River in the northern part of the town (Figure 1).
Figure 1. Location of the study site and sampling points in the mangrove of Sofala Bay.
Forests 05 01967 g001
Six tree species are common in the study area, and the estimated relative stem densities are Avicennia marina (Forssk.) Vierh. (53%), Rhizophora mucronata Lamk. (20%) Bruguiera gymnorrhiza (L.) Savigny (15%), Ceriops tagal (Perr.) C.B. Robinson (10%), Xylocarpus granatum J. Koenig (2%), and Hiritiera littoralis Dryand. (1%). All species found in this study are common in Mozambique mangroves [29,33,34].

2.2. Study Design

ArcView GIS 3.2 was used to map the study area and later to generate a quadrangular grid of 0.5 km × 0.5 km which was used to establish a systematic sampling (Figure 1). From the grid, a total of 55 sampling points were generated and their geographical coordinates registered. In the field, the sampling plots were located using the Global Positioning System (GPS) model Garmin GPSMAP62. Within each plot, we estimated the whole-ecosystem carbon stocks (above-ground and below-ground) based on methodologies recommended by Kauffman and Donato [7].

2.2.1. Tree Biomass

For all trees with stem diameter at breast height (DBH) greater than 5 cm, the DBH (cm) and height (m) were measured, and the species identified within circular 7 m radius sampling plots. Trees with stem diameters between 0.5 and 5 cm were measured in a 2 m radius subplot, located in the center of the main plot. Modifications of these procedures were made for Rhizophora mucronata trees whose diameter was measured 30 cm above the height of prop roots [7,14].
To calculate the above-ground tree biomass, we developed a general allometric equation for all species found in the study area. A total of 31 trees, representing different size classes (DBH range 0.5–42 cm) were cut at ground level using a handsaw and separated manually into stem, branch, and leaf fractions. Still on the ground, we registered the fresh weight of each tree component using a digital weighing scale. Samples of around 500 g of each component were taken into the laboratory for dry weight estimation. The wood density of tree stem ρ (g·cm3) was estimated in the lab by measuring wood samples of about 500 g each. These were oven-dried (100 °C) to constant weight, and the volume was estimated recording the water displaced by immersion of the samples in a graduated container [35].
Allometric equations were fitted using nonlinear methods (nls function in R) [36] using above-ground individual tree total dry weight as dependent variable and DBH as independent variable. Three non-linear growth functions, namely polynomial quadratic (Equation (1)), exponential (Equation (2)), and power function (Equation (3)) were selected as candidate equations:
DW = b0 + b1 × DBH + b2 × DBH2
DW = b0 × exp(b1 × DBH)
DW = b0 + b1 × DBHb2
where DW is above-ground tree dry weight (kg), DBH is tree diameter at breast height (cm), and b0, b1, and b2 are regression coefficients.
The choice of the best model was based on the low root mean square error (RMSE) (Equation (4)), and the lowest Akaike Information Criterion method (AIC) (Equation (5)). In order to visualize the explanatory power of the allometric equation chosen, the regression coefficient (pseudo R2) was calculated.
R M S E = i = 1 n ( y y ̂ i ) 2 n
A I C = n L o g ( i = 1 n ( y y ̂ ) 2 n ) + 2 p
Model goodness of fit was evaluated on the basis of the average bias (AB) (Equation (6)) and the analysis of normality of the distribution of the residual.
A B = 1 n i = 1 n ( y i y ̂ i )
where n is the number of observations (number of trees used to fit the equation), yi is the observed tree dry weight, and is the predicted dry weight, and p is the number of parameters in the equation.
Tree root dry weight was calculated using a general allometric equation (Equation (7)) developed for mangroves [37]. The plant carbon content was estimated by multiplying the oven dry weight by factor of 0.48 for above-ground live trees, 0.5 for dead trees, 0.45 for herbaceous and litter, and 0.39 for below-ground biomass (roots) as suggested by Kauffman and Donato [7]:
Wr = 0.199ρ0.899DBH2.22
where Wr is tree below-ground dry weight (kg), ρ is wood density (g·cm−3), and DBH is tree diameter at breast height (cm).

2.2.2. Dead Wood, Herbaceous, Litter, and Pneumatophores

The sample collection for wood debris, herbaceous, and litter was performed following a protocol established to estimate biomass and carbon stocks in mangrove forests [7]. Dead trees were classified into three classes as follows: (1) dead trees without leaves; (2) dead trees without secondary branches; and (3) dead trees without primary or secondary branches. Wood debris was sampled using the planar intersect technique in four 14 m transects crossing the center of the main plot. Dead woody material (fallen/detached twigs, branches, prop roots or stems of trees and shrubs) intersecting the transect were measured [7,14,38].
To determine the specific gravity of wood debris, we collected 25 pieces from different size classes and the specific gravity was calculated dividing the oven-dried material by its volume, using the procedure for wood density described above. We also calculated the biomass of standing dead trees according to Kauffman and Donato [7], who suggest using the allometric equation developed for live trees and subtract a proportion varying from 2.5% (for Class 1 dead trees) to 20% (for Class 2 dead trees), while dry weight for Class 3 dead trees is estimated by multiplying the estimated volume of the remaining stem by wood density.
Herbaceous and litter samples were taken in two square 0.46 × 0.46 m micro-plots located 2 m apart from the main plot center [14]. In each micro-plot, all above-ground herbaceous vegetation was collected and weighed fresh, and samples (approximately 300 g) for each component were taken for the oven dry weight estimation in the laboratory [14,39]. Aerial roots (pneumatophores) of Avicennia marina were sampled by counting the numbers in the square 0.46 × 0.46 m micro-plots. After counting all pneumatophores in the micro-plot, they were collected and weighed fresh, and a sample was taken for oven dry weight determination [40].

2.2.3. Soil Sampling

At each sampling plot, duplicate samples were collected at 0–30, 30–60 and 60–100 cm depth using a corer with a volume of 100 cm3. Undisturbed samples for bulk density estimation and disturbed samples for carbon content estimation were collected from each of the three depths. Bulk density for undisturbed soil samples was determined by dividing oven-dried samples (at 70 °C for 48 h or until constant weight) by the volume of the corer. Soil carbon content was estimated in the laboratory using the Walkley-Black method [41]. The soil carbon (Mg·ha−1) per sampled depth interval was calculated using Equation 8 as suggested by several authors [7,41,42,43].
Soil Carbon (Mg·ha−1) = bulk density (g·cm−3) × soil depth interval (cm) × %Carbon

3. Results and Discussion

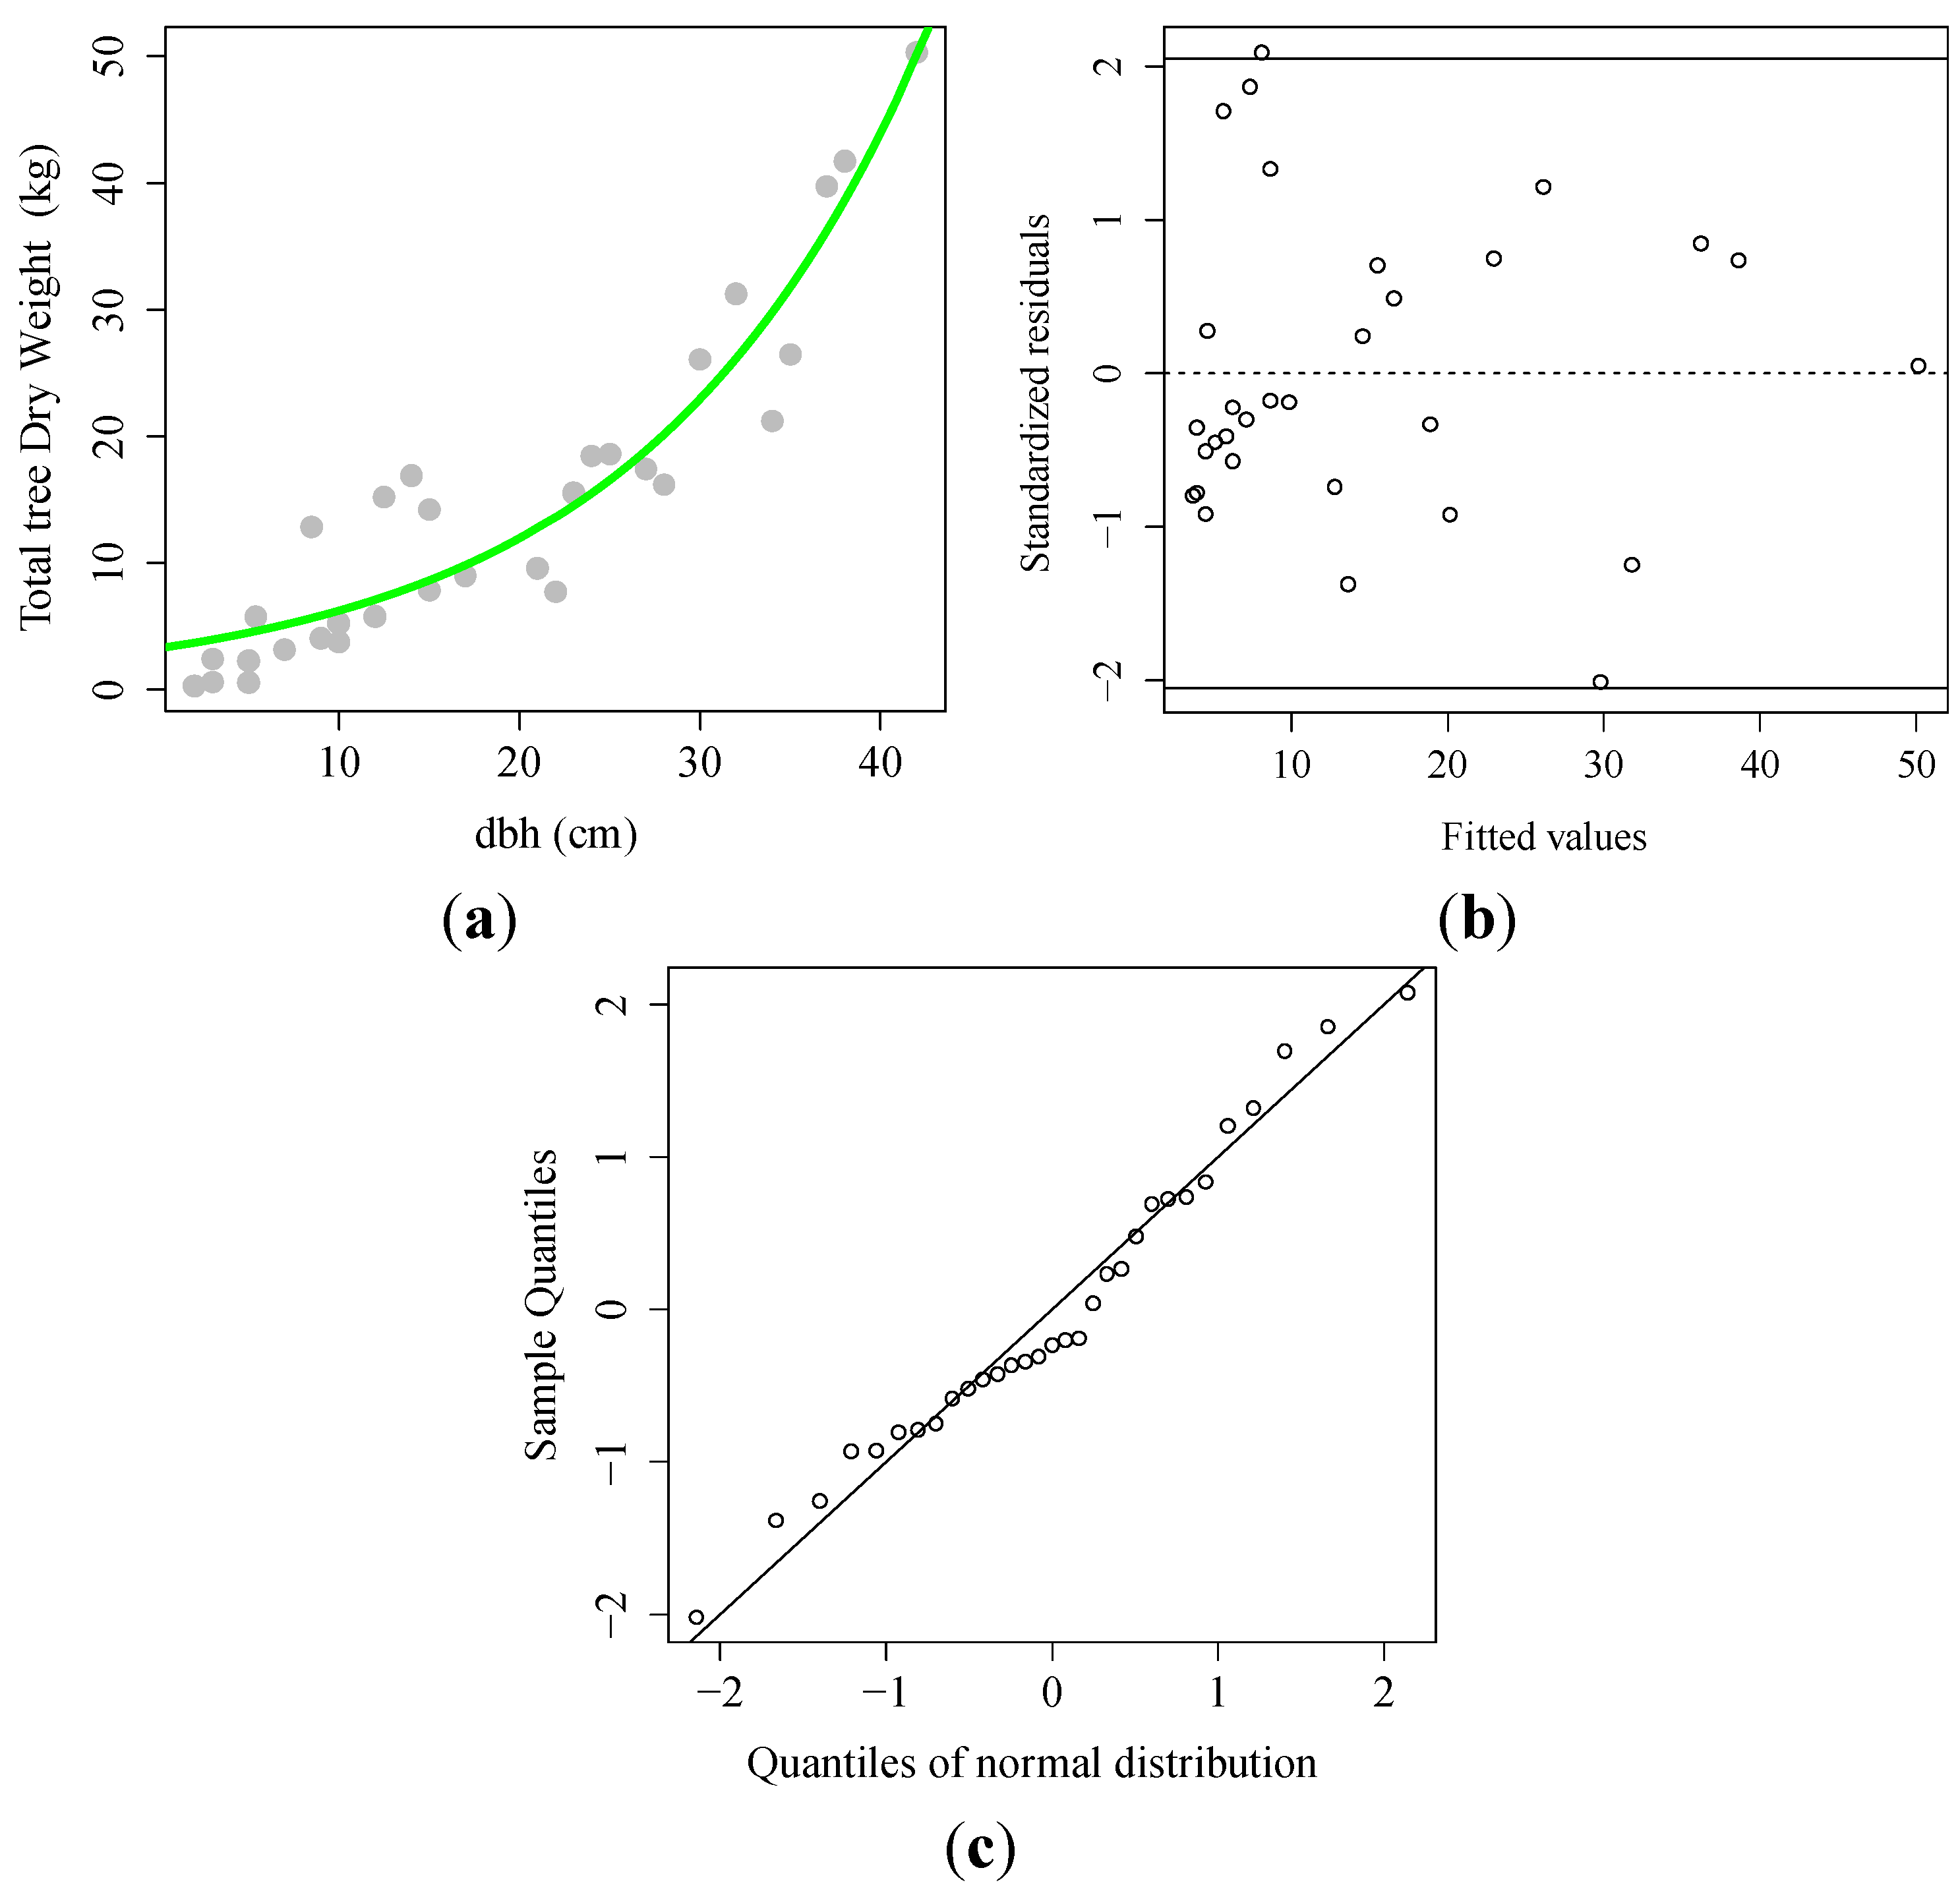
3.1. Allometric Equation

The biomass of mangroves at Sofala Bay was best estimated by the exponential equation (Equation (2)) with a root mean square error (RMSE = 4.244), Akaike Information Criterion (AIC = 181.5), and an adjusted coefficient of determination (Adj. R2 = 0.89) as shown in Table 1. The criteria used to select the best-fit equation was the lowest RMSE and lowest AIC when compared with the quadratic function (RMSE = 4.617, AIC = 187.7) and the power function (RMSE = 4.541, AIC = 186.6).
Table 1. Allometric model for predicting above-ground tree biomass of mangrove at Sofala Bay.
NDBH Range (cm)b0 (95% Confidence Limits)b1 (95% Confidence Limits)RMSEAICAdjusted R2
310.5–423.254
(2.214–4.513)
0.065
(0.055–0.076)
4.244181.50.89
The individual tree above-ground dry weight is therefore estimated using Equation (9):
DW = 3.254 × exp(0.065 × DBH)
where DW is the individual tree total dry weight (kg), DBH is the diameter at breast height (cm), and b0, and b1 are regression coefficients, RMSE is the root mean square of error, R2 is the coefficient of determination.
The fitted line that minimizes the error goes through the observed points (Figure 2A) supporting the adequacy of the model to the observed data. Random distribution of the scatter-points of the residuals along the predicted values of dry weight (Figure 2B) indicates that the fitted exponential model adequately describes the relationship between the two variables. In addition, Figure 2C shows the residuals along the 45° diagonal line indicating that the residuals are normally distributed. Model goodness of fit was evaluated using the average bias (AB = −0.035; 95% confidence limits: −1.566, 1.495). The average bias is very close to zero, and its 95% confidence limits contain zero, supporting the hypothesis that the selected model is an unbiased estimator of the dry weight.
The regression coefficient found in this study (R2 = 0.89) is lower than those found by other studies in mangroves around the world. For example, Kairo et al. [43], found R2 = 0.98 in Gazi Bay, Kenya; Comley and McGuinness [39] found R2 = 0.97 in Darwin Harbour, Northern Australia, and Kridiborworn et al. [44] found R2 = 0.95 (with an allometric equation using DBH only) and 0.97 (with an allometric equation using DBH and total height) in Samut, Songkram Province, central Thailand, and Komiyama et al. [37], found R2 = 0.98 in Asia. The difference may be due to the species-specific nature of the equations developed by Kairo et al. [43] and Comley and McGuinness [39] and the inclusion of DBH and tree height together as predicting variables in the equations developed by Kridiborworn et al. [44] and Komiyama et al. [37]. In this study, we developed a general equation to represent the six species found in the study area and used only the DBH as predicting variable due to its easiness to measure.
Figure 2. Evaluation of the adequacy of the model: (A) Relationship between tree dry weight (kg) against diameter at breast height (cm): ( Forests 05 01967 i001) observed; ( Forests 05 01967 i002) fitted line; (B) Scatter plot of the standardized residual against predicted dry weight; (C) Normal Quantile–Quantile plot.
Forests 05 01967 g002
According to Litton and Kauffman [45], species-specific models remain more accurate than the generalized models that include several species at the same time. Individual species allometry takes into account differences in wood density, tree form, and architecture, all of which can affect the modeled relationship between the easy-to-measure parameters and the dry weight of individual trees. Some authors, such as Kridiborworn et al. [44] and Brown et al. [46], admit that allometric equations that include DBH and height probably provide the best prediction given that the inclusion of tree height introduces the aspects of tree shape into the equation.
Using species-specific equations and adding more variables to the allometric equation, although statistically increasing accuracy, may not lead to a substantial improvement of the precision of the biomass estimation [47]. Therefore, in this study we considered the difficulty of measuring tree height and the associated measuring error as limiting factors compared to the added accuracy of the adjusted model. We also considered the wide utility of a generalized model that can be used for a set of species and reduce the complexity of species-specific model construction and usage.

3.2. Above-Ground Biomass and Carbon

Above-ground biomass (AGB) of the studied site varied from 10.7 to 464.4 Mg·ha−1 with the higher biomass observed in plots with high density of adult trees of Avicennia marina and lower biomass in degraded plots with fewer trees. The average biomass for living and dead plants was estimated as 134.6 Mg·ha−1 resulting in average carbon stocks of 58.6 Mg·ha−1 (Table 2). The highest proportion of biomass was found in roots with 64.7 Mg·ha−1 (48.0% of the plant biomass). Carbon is, however, more concentrated in live trees, with 28.0 Mg·ha−1 (47.8% of plant carbon). Studies including all plant components are scarce, as most have limited their focus to above-ground live tree biomass, not including roots, dead trees, litter, and wood debris. This study shows that these neglected components could comprise more than half of the plant component biomass and carbon in mangrove ecosystems. The average biomass of live trees found in this study are below the lower limit (but included in the 95% confidence limits) of those found by Fatoyinbo et al. [29], who studied mangrove above-ground tree biomass along the coast of Mozambique and found a variation between 67 Mg·ha−1 in Inhambane and 207 Mg·ha−1 in Gaza. They attributed these differences to the average tree height, which was found to be highly correlated to above-ground tree biomass. The tallest mangrove was found in the Limpopo estuary and the Zambezi Delta where tree heights were up to 27 and 18 m respectively. In the Sofala province, where the Sofala Bay is located, they found an average height of 4.8 m and an above-ground tree biomass of 84 Mg·ha−1. Note, however, that these authors used species-specific allometric functions derived elsewhere, mainly in Southeast Asia, Australia, and Florida.
The figures of biomass in this study were in the range estimated by Mudiyarso et al. [14], in Indonesia who found that the aerial part of the trees and the roots represented the major proportion of the plant carbon in forests. In Aceh, Indonesia, Raffli et al. [48] reported that biomass of coarse woody debris, herbaceous vegetation, and litter was typically less than 10% of the plant carbon content, as we found in this study as well.
Table 2. Above-ground biomass and carbon pools (Mg·ha−1) in the mangrove at Sofala Bay.
ComponentBiomass (Mg·ha−1)Carbon (Mg·ha−1)
Average%Average%
Live trees58.38 ± 19.143.428.02 ± 9.247.8
Roots *64.67 ± 13.448.025.22 ± 5.343.0
Herbaceous4.29 ± 2.43.21.93 ± 1.13.3
Litter3.08 ± 1.72.31.39 ± 0.82.4
Dead trees3.40 ± 1.72.51.70 ± 0.92.9
Wood debris0.26 ± 0.20.20.13 ± 0.10.2
Pneumatophores0.53 ± 0.30.40.21 ± 0.10.4
Total134.61 ± 25.210058.60 ± 11.5100
* biomass of roots was calculated using a general allometric equation developed for mangroves by Komiyama et al. [37].

3.3. Soil Carbon

The results of the soil bulk density, organic matter, carbon concentration, and carbon content in the mangrove forests of Sofala Bay are given in Table 3. The average bulk densities were 1.12 g·cm−3, 1.07 g·cm−3, and 1.05 g·cm−3, in 0–30, 30–60, and 60–100 cm intervals of depth, respectively, and did not differ significantly (p = 0.40) across depths. Organic matter and the carbon concentration decreased with the depth as shown in Table 3, although these values did not show statistical differences (p = 0.18). The carbon concentration varied from 1.57% to 1.44% from top to deep layers, but with no statistical differences among layers. The carbon content in the soil of mangroves generally changes much more slowly with depth than in the upland forest. In the miombo woodlands of Malawi for instance, Walker and Desanker [49] found an exponential decrease of carbon concentration up to a depth of 150 cm, indicating a sharp decrease in carbon concentration with the increase of soil depth. Donato et al. [8], studying Indo-Pacific mangrove soils, found lower soil bulk densities (0.35–0.55 g·cm−3) with no significant changes from the top soil down to 100 cm depth, but higher bulk densities in deeper layers in a depth of up to 150 cm. According to Wendling [50], the reduction of carbon concentration with depth is more common in terrestrial forests due to high concentrations of biological activity, particularly litter deposition and decomposition near the soil surface, while deposition of sediments from the river stream constitute an important source of organic matter in mangrove soils.
Table 3. Bulk density, organic matter, carbon concentration, and carbon stocks in the Sofala Bay mangrove forest.
Sample Depth (cm)Bulk Density (g·cm−3)Mean of % Organic MatterMean Soil CarbonTotal Carbon (Mg/ha−1)
0–301.12 ± 0.232.73 ± 1.731.57 ± 1.053.32 ± 20.8
30–601.07 ± 0.262.35 ± 1.311.42 ± 0.8145.76 ± 24.43
60–1001.05 ± 0.262.49 ± 1.531.44 ± 0.8960.90 ± 38.04
The average soil carbon content (depth 0–100 cm) was estimated as 160 Mg·ha−1. The total carbon in soil recorded in this study is lower when compared with the soil carbon reported in other mangrove forests in the same depth (0–100cm). As an example, Kauffman et al. [51], found 236 Mg·ha−1 of soil carbon at Yap mangrove forest; Adame et al. [38] found 232.4 Mg·ha−1 of soil carbon at Isla Pitaya, while Bosire et al. [30], found an average of 321 Mg·ha−1 soil carbon in mangrove forests of Zambezi Delta, Mozambique, about 150 Km North of our study area. Neighboring upland forest soil carbon, however, is reportedly lower than the figures found in this study. For instance, Walker and Desanker [49] found an average of 85 Mg·ha−1 up to a depth of 150 cm in miombo woodlands of Malawi. In miombo woodlands of Gondola, just 100 km West of the study site, Tomo [27] found a median soil carbon of 58 Mg·ha−1 up to a depth of 30 cm, with a high variability (range 18–140 Mg·ha−1), comparable to the average of 53.3 Mg·ha−1 found in the topsoil (0–30 cm) in this study, but in general, lower when considering the sharp decrease with depth in miombo woodlands.
The low carbon value found in our study could be explained by the low carbon content in the soil, supporting what has been reported by Kairo et al. [43], which is that the difference in soil carbon stocks in different regions could be explained by the difference of carbon content across depth layers in each region. The high level of mangrove disturbance and degradation in our study area could be one of the reasons of the current state of carbon stock.

3.4. Total Carbon Stocks

The total carbon stock of the Sofala Bay mangrove forest is 218.34 Mg·ha−1 (Table 4), around 85% of which is stored below-ground (73.28% in the soil and 11.55% in the roots). Our results are supported by the findings of Kauffman et al. [51], who also found similar fractions of carbon stock in mangrove soils of some Federated States of Micronesia. In other studies, soil carbon accounted for 72%–99% [8,14] and 40%–98% [8] of the total mangrove ecosystem carbon. These values show the role of mangrove soil as an important carbon pool. However, our findings show that the total carbon storage in the mangrove forest is lower compared to those reported by other authors e.g., Mudiyarso et al. [14], who recorded an average of 986 Mg·ha−1 of total carbon in Indonesia whereas Bosire et al. [30] recorded an average of 534 Mg·ha−1 of total carbon in Zambezi Delta, in central Mozambique. These differences may be associated to differences of tree species composition and forest structure, density of trees, forest conservation status, soil depth, carbon concentration, and soil water content in each region. For instance, the structure of mangrove trees of the Zambezi Delta, dominated by Sonneratia alba (Sm.) with trees growing up to 45 cm DBH and 27 m height [29,30] is clearly different from our study site dominated by relatively small trees of Avicennia marina with a dominant height of 4 m. Fatoyinbo et al. [29] also suggest that mangrove productivity, as expressed by tree biomass, would vary with the quality of the upstream sediment, therefore, taller mangrove trees are found in nutrient rich sediments of the Zambezi Delta and Limpopo estuary.
Table 4. Total Carbon stocks in the Sofala Bay mangrove forest.
ComponentCarbon (Mg·ha−1)% of Total
Total Above-ground carbon (live and dead trees, herbaceous, pneumatophores and litter)33.315.2
Total Below-ground carbon (soil and roots)185.284.8
Total Ecosystem carbon218.5100
Kairo et al. [43] stated that biomass accumulation rate is mainly influenced by tree age, species, management regime, as well as the climate, while Fatoyinbo et al. [29] consider the nutrient sediment and proximity to the water stream as additional factors of mangrove productivity. In central Kalimantan, Indonesia, Mudiyarso et al. [14] reported around 1220 Mg·ha−1 carbon stock, which is considered high, and the reason being the presence of both deeper soils and larger trees. In contrast, the same authors found relatively low carbon stocks (586 Mg·ha−1) in Segara Anakan, Central Java largely due to the smaller size of trees and lower soil carbon concentration. Other authors, such as Kauffman et al. [51] infer that the relative high above-ground biomass coupled with carbon-rich soils result in high carbon stocks in mangrove forests compared to other tropical forests. For instance, Tomo [52] found 23 and 60 Mg·ha−1 in above-ground and soil carbon (depth 0–30 cm) in miombo woodlands of Gondola.
Mangrove tree removal is a problem in the study area, resulting in areas of degraded mangrove with little above-ground biomass. Reduction of above-ground biomass is suspected to go along with loss of below-ground carbon as it was found in miombo woodlands [49]. However, in this study we did not find any significant correlation between above-ground and below-ground carbon (Pearson’s r = −0.025). Donato et al. [8], found a weak correlation between below-ground and above-ground carbon in Micronesian mangrove forests with a Pearson’s correlation of r = 0.21 and 0.50 in estuarine and oceanic sites, respectively. The weak correlation suggests that loss of trees above-ground biomass does not necessarily imply immediate loss of soil carbon content, since these may also be highly influenced by water flux, sediment deposition, and organic matter oxidation.

4. Conclusions

In this study, we present carbon stocks of the Sofala Bay mangrove forest. The exponential function was found to be the best fit for the tree species found in the site, with DBH explaining about 89% of the variability of individual tree dry weight. The average carbon stock in the mangrove forest was 218.5 Mg·ha−1, around 73% of which was stored in the soil, supporting the findings of other studies that the soil of mangrove forests contains about 72%–99% of the total carbon of these types of forests. These proportions of soil carbon to the total ecosystem carbon suggest that mangrove soils are the most carbon rich when compared to upland ecosystem in the same region. However, our observations show that the total carbon storage in the Sofala Bay mangrove forest is lower compared with other sites of mangrove forests in Mozambique. The differences may be due, mainly, to the differences in forest structure, species composition, conservation status, soil depth, soil carbon concentration, and bulk density. Differences in allometric functions used for above-ground biomass estimation in the other studies may also be a source of the differences. Although this study revealed a low carbon stock in the Sofala Bay compared to other mangrove ecosystems, the current values are higher than the miombo woodlands, suggesting the need for conservation efforts and particular attention to mangrove in carbon sequestration programs.

Acknowledgments

This study was conducted as part of the research project number 079_FNI funded by Fundo Nacional de Investigação of Mozambique (FNI). The authors extend their gratitude to Romano Guiamba, Sergio Filipe for their contribution in the fieldwork; Bento, Moisés and Balbino the fishermen who facilitated access to the sampling points. Thanks to the three anonymous reviewers for the valuable contributions to improve the manuscript.

Author Contributions

Almeida A. Sitoe conceptualized the research design and site selection, assisted with data analysis, coordinated the writing, and submitted the article. Luís Jr. Comissário Mandlate conducted field data collection, preliminary data processing as part of his Master thesis, and prepared the preliminary draft of the article. Benard S. Guedes assisted in the research design conceptualization, data quality assurance and statistics, and contributed to writing the manuscript.

Conflicts of Interest

The authors declare no conflict of interest.

References

  1. Giri, C.O.E.; Tieszen, L.L.; Zhu, Z.; Singh, A. Status and distribution of mangrove forests of the world using earth observation satellite data. Glob. Ecol. Biogeogr. 2011, 20, 154–159. [Google Scholar] [CrossRef]
  2. Spalding, M.; Blasco, F.; Field, C. World Mangrove Atlas; International Society for Mangrove Ecosystems: Okinawa, Japan, 1997; p. 178. [Google Scholar]
  3. Alongi, D. Present state and future of the world’s mangrove forests. Environ. Conserv. 2002, 29, 331–349. [Google Scholar] [CrossRef]
  4. Alongi, D.S.A.; Chong, V.C.; Pfitzner, J.; Trott, L.A.; Tirendi, F.; Dixon, P.; Brunskill, G.J. Sediment accumulation and organic material flux in a managed mangrove ecosystem: Estimates of land-ocean-atmosphere exchange in peninsular Malaysia. Mar. Geol. 2004, 208, 383–402. [Google Scholar] [CrossRef]
  5. Ong, E. The Hidden Costs of Mangrove Services: Use of Mangroves for Shrimp Aquaculture; The International Geosphere-Biosphere Program (IGBP): Stockholm, Sweden, 2002. [Google Scholar]
  6. Tomlinson, C.B. The Botany of Mangroves; Cambridge Tropical Biology Series; Cambridge University Press: Cambridge, UK, 1986. [Google Scholar]
  7. Kauffman, J.B.; Donato, D.C. Protocols for the Measurement, Monitoring and Reporting of Structure, Biomass and Carbon Stocks in Mangrove Forests; Working Paper 86; Center for International Forest Research (CIFOR): Bogor, Indonesia, 2012. [Google Scholar]
  8. Donato, D.K.J.B.; Murdiyarso, D.; Kurnianto, S.; Stidham, M.; Kanninen, M. Mangroves among the most carbon-rich forests in the tropics. Nat. Geosci. 2011, 4, 293–297. [Google Scholar] [CrossRef]
  9. Kalk, M.A. A Natural History of Inhaca Island Mozambique, 3rd ed.; Witwatersrand University Press: Capetown, South Africa, 1995. [Google Scholar]
  10. Food and Agriculture Organization of the United Nations (FAO). The World’s Mangroves 1980–2005; A Thematic Study Prepared in the Framework of the Global Forest Resources Assessment 2005; FAO: Rome, Italy, 2005. [Google Scholar]
  11. McLeod, E.; Salm, R.V. Managing Mangroves for Resilience to Climate Change; IUCN: Gland, Switzerland, 2006; p. 64. [Google Scholar]
  12. Taylor, M.; Ravilious, C.; Green, E.P. Mangroves of East Africa; UNEP and World Conservation Monitoring Center: Cambridge, UK, 2003; p. 25. [Google Scholar]
  13. Odum, E. Ecologia, 3rd ed.; Guanabara Koogan: Rio de Janeiro, Brazil, 1980; p. 639. [Google Scholar]
  14. Murdiyarso, D.D.D.; Kauffman, J.B.; Stidham, M.; Kanninen, M. Carbon Storage in Mangrove and Peatland Ecosystems: A Preliminary Account from Plots in Indonesia; Working paper 48; Center for International Forest Research (CIFOR): Bogor, Indonesia, 2011; p. 37. [Google Scholar]
  15. Barbosa, F.; Cuambe, C.; Bandeira, S. Status and distribution of mangroves in Mozambique. S. Afr. J. Bot. 2001, 67, 393–398. [Google Scholar]
  16. Relatório do estudo de avaliação da interacção entre a biodiversidade e pobreza em Moçambique; MICOA, Direcção Nacional de Gestão Ambiental: Maputo, Mozambique, 2008; p. 139.
  17. Marzoli, A. Relatório do Inventário Florestal Nacional; Ministério da Agricultura, Drecção Nacional de Terras e Florestas: Maputo, Mozambique, 2007; p. 82. [Google Scholar]
  18. Matusse, R.M. Os Mangais de Moçambique e o seu estado de Desmatamento (1990 a 1992); Ministério da Agricultura, Direcção Nacional de Terras e Florestas: Maputo, Mozambique, 1992; p. 18. [Google Scholar]
  19. De Boer, W. The rise and fall of the mangrove forests in Maputo Bay, Mozambique. Wetl. Ecol. Manag. 2002, 10, 313–322. [Google Scholar]
  20. Sitoe, A.S.A.; Wertz-Kanounnikoff, S. The Context of REDD+ in Mozambique: Drivers, Agents and Institutions; Occasional Paper; Center for International Forestry Research (CIFOR): Bogor, Indonesia, 2012; Volume 79. [Google Scholar]
  21. Baccini, A.G.S.J.; Walker, W.S.; Lapote, N.T.; Sun, M.; Sulla-Menashe, D.; Hackle, J.; Beck, P.S.A.; Dubayan, M.A.; Friedl, M.A.; Samanta, S.; et al. Estimated carbon dioxide emissions from tropical deforestation improved by carbon-density maps. Nat. Clim. Chang. 2012, 2, 182–185. [Google Scholar] [CrossRef]
  22. Harris, N.B.S.; Hagen, S.C.; Saatchi, S.S.; Petrova, S.; Salas, W.; Hansen, M.C.; Potapov, P.V.; Lotsch, A. Baseline map of carbon emissions from deforestation in tropical regions. Science 2012, 336, 1573. [Google Scholar] [CrossRef]
  23. Harris, N.B.S.; Hagen, S.C.; Baccini, A.; Houghton, R. Progress toward a Consensus on Carbon Emissions from Tropical Deforestation: Policy Brief; Meridian Institute: Washington, DC, USA, 2012. [Google Scholar]
  24. Angelsen, A. Movind Ahead with REDD: Issues, Options, and Implications; Center for International Forestry Research (CIFOR): Bogor, Indonesia, 2008. [Google Scholar]
  25. Angelsen, A. RealisingREDD+: National Strategy and Policy Options; Center for International Forestry Research (CIFOR): Bogor, Indonesia, 2009. [Google Scholar]
  26. Kanninen, M.M.D.; Seymour, F.; Angelsen, A.; Wunder, S.; German, L. Do Trees Grow Money? The Implications of Deforestation Research and Policies to Promote REDD; Center for International Forestry Research (CIFOR): Bogor, Indonesia, 2007. [Google Scholar]
  27. Williams, M.R.C.M.; Rees, R.M.; Sambane, E.; Fernando, J.; Grace, J. Carbon sequestration and biodiversity of re-growing miombo woodlands in Mozambique. For. Ecol. Manag. 2008, 254, 145–155. [Google Scholar] [CrossRef]
  28. Ryan, C. Carbon Cycling, Fire and Carbon Cycling, Fire and Phenology in a Tropical Savanna Woodland in Nhambita, Mozambique; University of Edinburgh: Edinburgh, UK, 2009; p. 257. [Google Scholar]
  29. Fatoyinbo, T.S.M.; Washington-Allen, R.A.; Shugart, H.H. Landscape-scale extent, height, biomass, and carbon estimation of Mozambique’s mangrove forests with Landsat ETM+ and Shuttle Radar Topography Mission elevation data. J. Geophys. Res. 2008, 113, G02S06. [Google Scholar]
  30. Bosire, J.; Bandeira, S.O.; Rafael, J. Coastal Climate Change Mitigation and Adaptation through REDD+ Carbon Programs in Mangroves in Mozambique: Pilot in the Zambezi Delta. Component: Determination of Carbon Stocks through Localized Allometric Equations; Eduardo Mondlane University: Maputo, Mozambique, 2012; p. 27. [Google Scholar]
  31. Saket, M.; Matusse, R.M. Estudo da Taxa de Desflorestamento da Vegetação de Mangal em Moçambique; Ministério da Agricultura, Unidade de Inventário Florestal: Maputo, Mozambique; p. 99.
  32. Sete, C.R.J.; Dove, V. Seasonal Variation of Tides, Currents, Salinity and Temperature along the Coast of Mozambique; Odinafrica, U., Ed.; Centro Nacional de Dados Oceanográficos: Maputo, Mozambique, 2002; p. 72. [Google Scholar]
  33. Consultec. Estudo Ambiental Simplificado da Dragagem do Canal de Acesso ao Porto da Beira; Consultec: Beira, Mozambique, 2007. [Google Scholar]
  34. Macamo, C.; Cangy, F.; Bandeira, S. Formas de uso, estrutura e estado de conservação de Mangal de Mieze e Muchara - Baía de Pemba, Cabo Delgado; Universidade Eduardo Mondlane and Instituto Nacional de Investigação: Pesqueira: Maputo, 2008; p. 23. [Google Scholar]
  35. Brown, S. Estimating Biomass and Biomass Change of Tropical Forests: A Primer; FAO: Rome, Italy, 1997. [Google Scholar]
  36. R: A Language and Environment for Statistical Computing; R Foundation for Statistical Computing: Vienna, Austria, 2011.
  37. Komiyama, A.; Poungparn, S.; Kato, S. Common allometric equations for estimating the tree weight of mangroves. J. Trop. Ecol. 2005, 21, 471–477. [Google Scholar] [CrossRef]
  38. Adame, M.K.J.B.; Medina, I.; Gamboa, J.N.; Torres, O. Carbon stocks of tropical coastal wetlands within the karstic landscape of the mexican caribbean. PLoS One 2013, 8. [Google Scholar] [CrossRef]
  39. Comley, B.W.T.; McGuinness, K.A. Above- and below-ground biomass, and allometry of four common northern Australian mangroves. Austr. J. Bot. 2005, 53, 431–436. [Google Scholar] [CrossRef]
  40. Arevalo, L.A.; Alegre, J.C.; Vilcahuman, L.J.M. Metodologia para Estimar Estoques de Carbono em Diferentes Sistemas de uso de Terra; Embrapa: São Paulo, Brazil, 2002. [Google Scholar]
  41. Pearson, T.; Walker, S.M.; Brown, S. Sourcebook for Land Use, Land-Use Change and Forestry Projects; BioCarbon Fund, Winrock International: Washington, DC, USA, 2005; p. 64. [Google Scholar]
  42. Cerón-Bretón, J.G.; Cerón-Bretón, R.M.; Rangel-Marrón, M.; Muriel-García, M.; Cordova-Quiroz, A.V.; Estrella-Cahuich, A. Determination of carbon Sequestration rate in soil of mangrove forest in Campeche, Mexico. Int. J. Energy Environ. 2011, 5, 328–336. [Google Scholar]
  43. Kairo, J.L.; Lang’at, J.K.S.; Dahdouh-Guebas, F.; Bosire, J.; Karachi, M. Structural development and productivity of replanted mangrove plantations in Kenya. For. Ecol. Manag. 2008, 255, 2670–2677. [Google Scholar] [CrossRef]
  44. Kridiborworn, P.C.A.; Yuttitham, M.; Tripetchkul, S. Carbon sequestration by mangrove forest planted specifically for charcoal production in Yeesarn, SamutSongkram. J. Sustain. Energy Environ. 2012, 3, 87–92. [Google Scholar]
  45. Litton, C.M.; Kauffman, J.B. Allometric models for predicting aboveground biomass in two widespread woody plants in Hawaii. Biotropica 2008, 40, 313–320. [Google Scholar] [CrossRef]
  46. Brown, S.; Gillespie, A.J.R.; Lugo, A.E. Biomass estimation methods for tropical forests with applications to forest inventory data. For. Sci. 1989, 35, 881–902. [Google Scholar]
  47. Ter-Mikaelian, M.; Korzukhin, M. Biomass equations for sixty-five North American tree species. For. Ecol. Manag. 1997, 97, 1–24. [Google Scholar]
  48. Raffli, T.P.; Usher, G.; Niles, J.O. Reducing Carbon Emission from Deforestation in the Ulu Masen Ecoystem, Aceh, Indonesia; Provincial Government of Nanggroe Aceh Darussalam: Aceh, Indonesia, 2007. [Google Scholar]
  49. Wendling, B.J.I.; Mendonça, E.S.; Neves, J.C.L. Carbono organico e estabilidade de agregados de um Latossolo Vermelho Sob diferentes Manejos. Pesquisa Agropecuária 2005, 40, 487–494. [Google Scholar]
  50. Walker, S.M.; Desanker, P.V. The impact of land use on soil carbon in Miombo Woodlands of Malawi. For. Ecol. Manag. 2004, 203, 345–360. [Google Scholar] [CrossRef]
  51. Kauffman, J.C.H.; Thomas, G.C.; Kathleen, A.D.; Daniel, C.; Donato, D. Ecosystem carbon stocks of micronesian mangrove forests. Wetlands 2011, 31, 343–352. [Google Scholar] [CrossRef]
  52. Tomo, F.A. Estimativas de stock de carbono nas florestas de miombo em Gondola. Tese de Licenciatura, DEF, FAEF. In Department of Forestry; Universidade Eduardo Mondlane: Maputo, Mozambique, 2012; p. 63. [Google Scholar]

