Article

A Methodological Framework for Assessing Agents, Proximate Drivers and Underlying Causes of Deforestation: Field Test Results from Southern Cameroon

1
Unique Forestry and Land Use, Schnewlinstr.10, 79098 Freiburg, Germany
2
Department of Geography, University of Sheffield, Winter Street, Sheffield S10 2TN, UK
3
Ecological and Monitoring Unit, Ministry of Environment and Nature Protection, P.O. Box 1106 Yaoundé, Cameroon
*
Author to whom correspondence should be addressed.
Forests 2015, 6(1), 203-224; https://doi.org/10.3390/f6010203
Submission received: 6 October 2014 / Accepted: 16 December 2014 / Published: 9 January 2015

Abstract

:
The international debates on REDD+ and the expectations to receive results-based payments through international climate finance have triggered considerable political efforts to address deforestation and forest degradation in many potential beneficiary countries. Whether a country will receive such REDD+ payments is largely contingent on its ability to effectively address the relevant drivers, and to govern the context-dependent agents and forces responsible for forest loss or degradation. Currently, many REDD+ countries are embarking on the necessary analytical steps for their national REDD+ strategies. In this context, a comprehensive understanding of drivers and their underlying causes is a fundamental prerequisite for developing effective policy responses. We developed a methodological framework for assessing the drivers and underlying causes of deforestation and use the Fako Division in Southern Cameroon as a case study to test this approach. The steps described in this paper can be adapted to other geographical contexts, and the results of such assessments can be used to inform policy makers and other stakeholders.

1. Introduction

In 2013, the 19th Conference of the Parties (COP) of the United Nations Framework Convention on Climate Change (UNFCCC) completed the methodological framework for REDD+, providing additional momentum for tropical forest countries to develop strategies for reducing forest-based emissions and/or for the enhancement of forest carbon stocks, conservation and sustainable forest management (REDD+). The Parties decided that REDD+ should be implemented in three phases: first, developing national strategies or action plans and capacity-building, second, the implementation of the national approaches, and finally, “results-based actions that should be fully measured, reported and verified” in phase three [1]. So far, most countries are in phase one or two and seek ways to identify and address the drivers of deforestation. The importance and inherent complexity of this challenge have also been acknowledged by the Parties [2], but the respective decision does not provide guidance on how REDD+ countries can actually cope with drivers [3]. In parallel to the national policy processes, a number of sub-national jurisdictional REDD+ schemes are being developed with bi- and multi-lateral donor support, where REDD+ programs are embedded in national frameworks as an interim measure for eventually upscaling results-based finance to the national level.
A crucial element in the process of designing (sub-) national strategies and action plans is a thorough understanding of the drivers, agents and underlying causes of deforestation [4]. In order to inform REDD+ actions and enable the development of evidence-based strategy options to effectively address drivers, REDD+ policy makers and stakeholders seek thorough analysis and quantification of drivers—a challenging task, due to inherent local complexities surrounding deforestation and the scarcity or dispersed nature of reliable data.
Literature on drivers of deforestation distinguishes between proximate drivers and underlying causes. Proximate or direct drivers are human activities and actions that directly impact forest cover and result in the loss of carbon stocks, e.g., agricultural expansion or logging for timber [4,5,6]. Underlying causes are complex interactions of social, economic, political, cultural and technological developments that in combination create the enabling environment for proximate drivers to unfurl, such as the lack of land use planning and ineffective law enforcement [6]. Underlying causes stem from multiple scales: international (e.g., commodity markets and commodity price dynamics), national (e.g., economic development strategies, population growth, domestic markets, governance) and local circumstances (e.g., livelihood options, poverty, and unclear land tenure) [6,7,8]. While proximate drivers and the corresponding agents may be considered relatively straightforward to quantify within defined spatio-temporal boundaries, a thorough evaluation of underlying causes requires other tools and methods as underlying causes are not all geographically proximate.
Given the cross-disciplinary dimension of deforestation, comprehensive assessments require collaboration amongst those with diverse sets of skills and knowledge such as remote sensing, socio-economic analysis, human-ecosystem interaction and macro-economic and trade analysis. Another challenge concerns the availability of reliable data, which is required in order to provide up-to-date and evidence-based information for the development of strategic options to effectively address deforestation under the specific circumstances. The purpose of this paper is to provide REDD+ stakeholders with a generally applicable methodological framework for assessing drivers, agents and underlying causes of deforestation. After introducing the global context and relevance of the study in Section 1 (Introduction), we describe the proposed methodological framework for systematically assessing and quantifying the drivers and agents of deforestation, including preliminary identification, categorization and weighing of their corresponding underlying causes (Section 2). Section 3 presents the results of the field test, carried out in the Fako Division in the Southwest Region. In Section 4, we discuss the methodology in light of limited available data and capacities, and the implication of the results on the design of effective REDD+ strategy options. Finally, we draw conclusions on how the approach may be applied at the national/regional level, in Cameroon and other REDD+ countries.

2. Methodology

This section describes the methodological framework developed through this study with the aim of providing general and easily replicable steps for REDD+ stakeholders at the early stages of REDD+ strategy development. The methodological framework was developed in an iterative process combining expert judgment, applicability in the field and stakeholder consultation, beginning with a desk-based study to review literature on assessing deforestation and combine existing methods into a comprehensive framework. This was then tested in a pilot area of more than 200,000 ha and subsequently critically discussed in a series of national REDD+ stakeholder workshops and technical working groups [9].

2.1. Steps of the Methodological Approach

The methodological framework consists of a step-wise approach for assessing proximate drivers, agents and the underlying causes of deforestation within a specific and clearly demarcated area. Its bottom-up approach consisting of six simple steps, allows for flexible procedures based on the available amount of global and local data, additional information and available resources for the assessment (see Figure 1).

Step1: Data Gathering and Literature Review

The aim of the literature review is to identify key agents, proximate drivers of deforestation and their underlying causes. The first step consists of reviewing relevant information, existing research and analytical work regarding land use dynamics in the country, including available national REDD+ Readiness plans and strategy documents. Spatially explicit investment plans and sector strategies, and land use / land cover (LULC) maps with activity data estimates should be collated to identify key information sources as well as data gaps. A prerequisite to step two below, is the defining of proximate drivers and corresponding LULC classes to be mapped, aiming at the representation of the most important groups of drivers, creating classes that are clearly separate, but at the same time not too numerous. Through an iterative process, this classification may then need to be adapted to what is distinguishable at the available resolution in remote sensing. Typical classes of drivers include: small-scale agriculture, cattle ranching or industrial agriculture, possibly distinguishing between different crop types (e.g. annual subsistence versus perennial cash crops). The area in which the drivers study will be carried out should be defined at this stage as the scope of the assessment depends on the availability of historical land use data. Existing remote sensing analysis should be sought and assessed for applicability and reliability, as this would significantly reduce the costs of the assessment.
Figure 1. Methodological approach for the systematic assessment of proximate drivers, agents and underlying causes of deforestation.
Forests 06 00203 g001

Step2: Land Use / Land Cover and Change Analysis

The purpose of this step is to create land use and forest cover maps that estimate deforestation rates and attribute forest loss to the above-identified agents. In many cases, deforestation maps showing forest/non-forest may already be available, but without the specification of land use types and proximate drivers responsible for deforestation. If suitable maps and spatial data are not available, remote sensing analysis must be conducted by a member of the driver assessment team familiar with remote sensing tools and techniques. For this assessment, at least two time series of comparable images are required (preferably three), one depicting current land use and land cover (LULC) and the other(s) depicting historical LULC. Using available satellite imagery, a preliminary list of LULC categories is identified, based on the polygons visible in the images. Combined with the literature review from the step above, these categories should correspond to the main expected drivers and agents. This information allows for quantifying drivers in terms of forest area lost or affected. Thereafter, a quantitative LULC change assessment is carried out to develop a land use change matrix, following international guidelines from GOFC-GOLD [10]. The land use change analysis entails localizing the expansion of the major proximate causes of deforestation and quantifying their area-wise impact in the past, for example through an object-based segmentation mapping, where the images are automatically analyzed for spectrally similar objects, divided in a second step into segments and finally labeled and classified [11]. This process should be carried out in two phases, first distinguishing between forest and non-forest and then repeating the object-based classification separately for forest and non-forest areas to produce a detailed land use classification [12]. Next, land use change and forest loss attribution is calculated, for example, using the Land Change Modeler available in the IDRISI software [13]. An important result of this step is quantifying the contributions of different drivers and agents to deforestation, which is best represented in a table (cf. Table 1 in Results).

Step 3: Carbon Stock Change Analysis

In this step, the area approximations of the land use categories identified above are linked to their respective long-term average carbon stock value (in tCO2/ha) based on existing local and regional forest carbon inventories or carbon stock assessment of respective land uses.
If local carbon stocks or biomass stock information is lacking, IPCC Tier 1 biomass and carbon stock data may be used as a default until better data become available. The conversion into a consistent unit per ha (tCO2/ha) is carried out using respective IPCC Tier 1 biomass expansion factors (BEF), root-to-shoot ratios, carbon fractions and wood density conversion factors. The carbon pools included in the analysis should be selected based on availability of reliable information, keeping in mind that while more accurate assessments through carbon inventories is an option for generating accurate data, this will considerably increase the time and resources required for the drivers analysis. The historical greenhouse gas (GHG) emissions due to deforestation are quantified by multiplying emissions factors with the respective land area changes (activity data) [14]. Emissions factors were quantified based on the carbon stock difference (tCO2/ha) between two land uses that were subject to changes.

Step 4: Assessment of Agents and Proximate Drivers

This step consists of a field assessment to ground truth the LULC categories defined in the above remote sensing analysis. If necessary, the remote sensing analysis may need to be refined at this stage to better account for the findings of the field visit. The bottom-up approach following [14] aims to assess the net benefits gained from current land uses. First, an opportunity cost analysis evaluates the economic costs and benefits associated with different land uses defined as drivers [15]. The first step of this opportunity cost analysis is to estimate the value of the standing forest and to compare it to the revenues of other land use options. This is combined with an analysis of deforestation agents in their specific locations to capture the main products, relevant markets, costs, inputs and other economic considerations related to the different production systems of the different land uses, based on existing factors and market prices prevalent in the region. Opportunity costs are quantified on a one ha and per tCO2 basis, using GHG emission factors calculated in the previous steps. In addition, interviews with deforestation agents facilitate a better understanding of decision chains leading to deforestation and help in capturing those aspects relevant for deforestation that are not quantifiable in financial terms. This analysis also helps to capture the non-carbon benefits of standing natural forests.

Step 5: Analysis of Underlying Causes

The aim of this step is not only to understand the historic causes of deforestation, but also to estimate the likely future deforestation patterns, taking into consideration the international, national and sub-national circumstances, as well as expected trends. The projection of drivers takes an explorative approach through stakeholder interviews, classifying likely future impacts of different underlying causes and weighing them according to (1) increasing impact, (2) business as usual, and (3) decreasing impact (cf. Section 3.4). This classification should serve as the basis for subsequent focus group discussions with local experts and key stakeholders. Local facilitators should be identified prior to field work to support stakeholder identification and ensure that data collection methods are adapted to local communication norms.

Step 6: Stakeholder Validation

Once the assessment has been finalized, it is important to share and validate results, ideally through a multi-stakeholder workshop where the findings are openly discussed. Participants in such a workshop may include national government agencies and ministries, civil society, research institutes, academia and importantly, representatives from the assessment area.

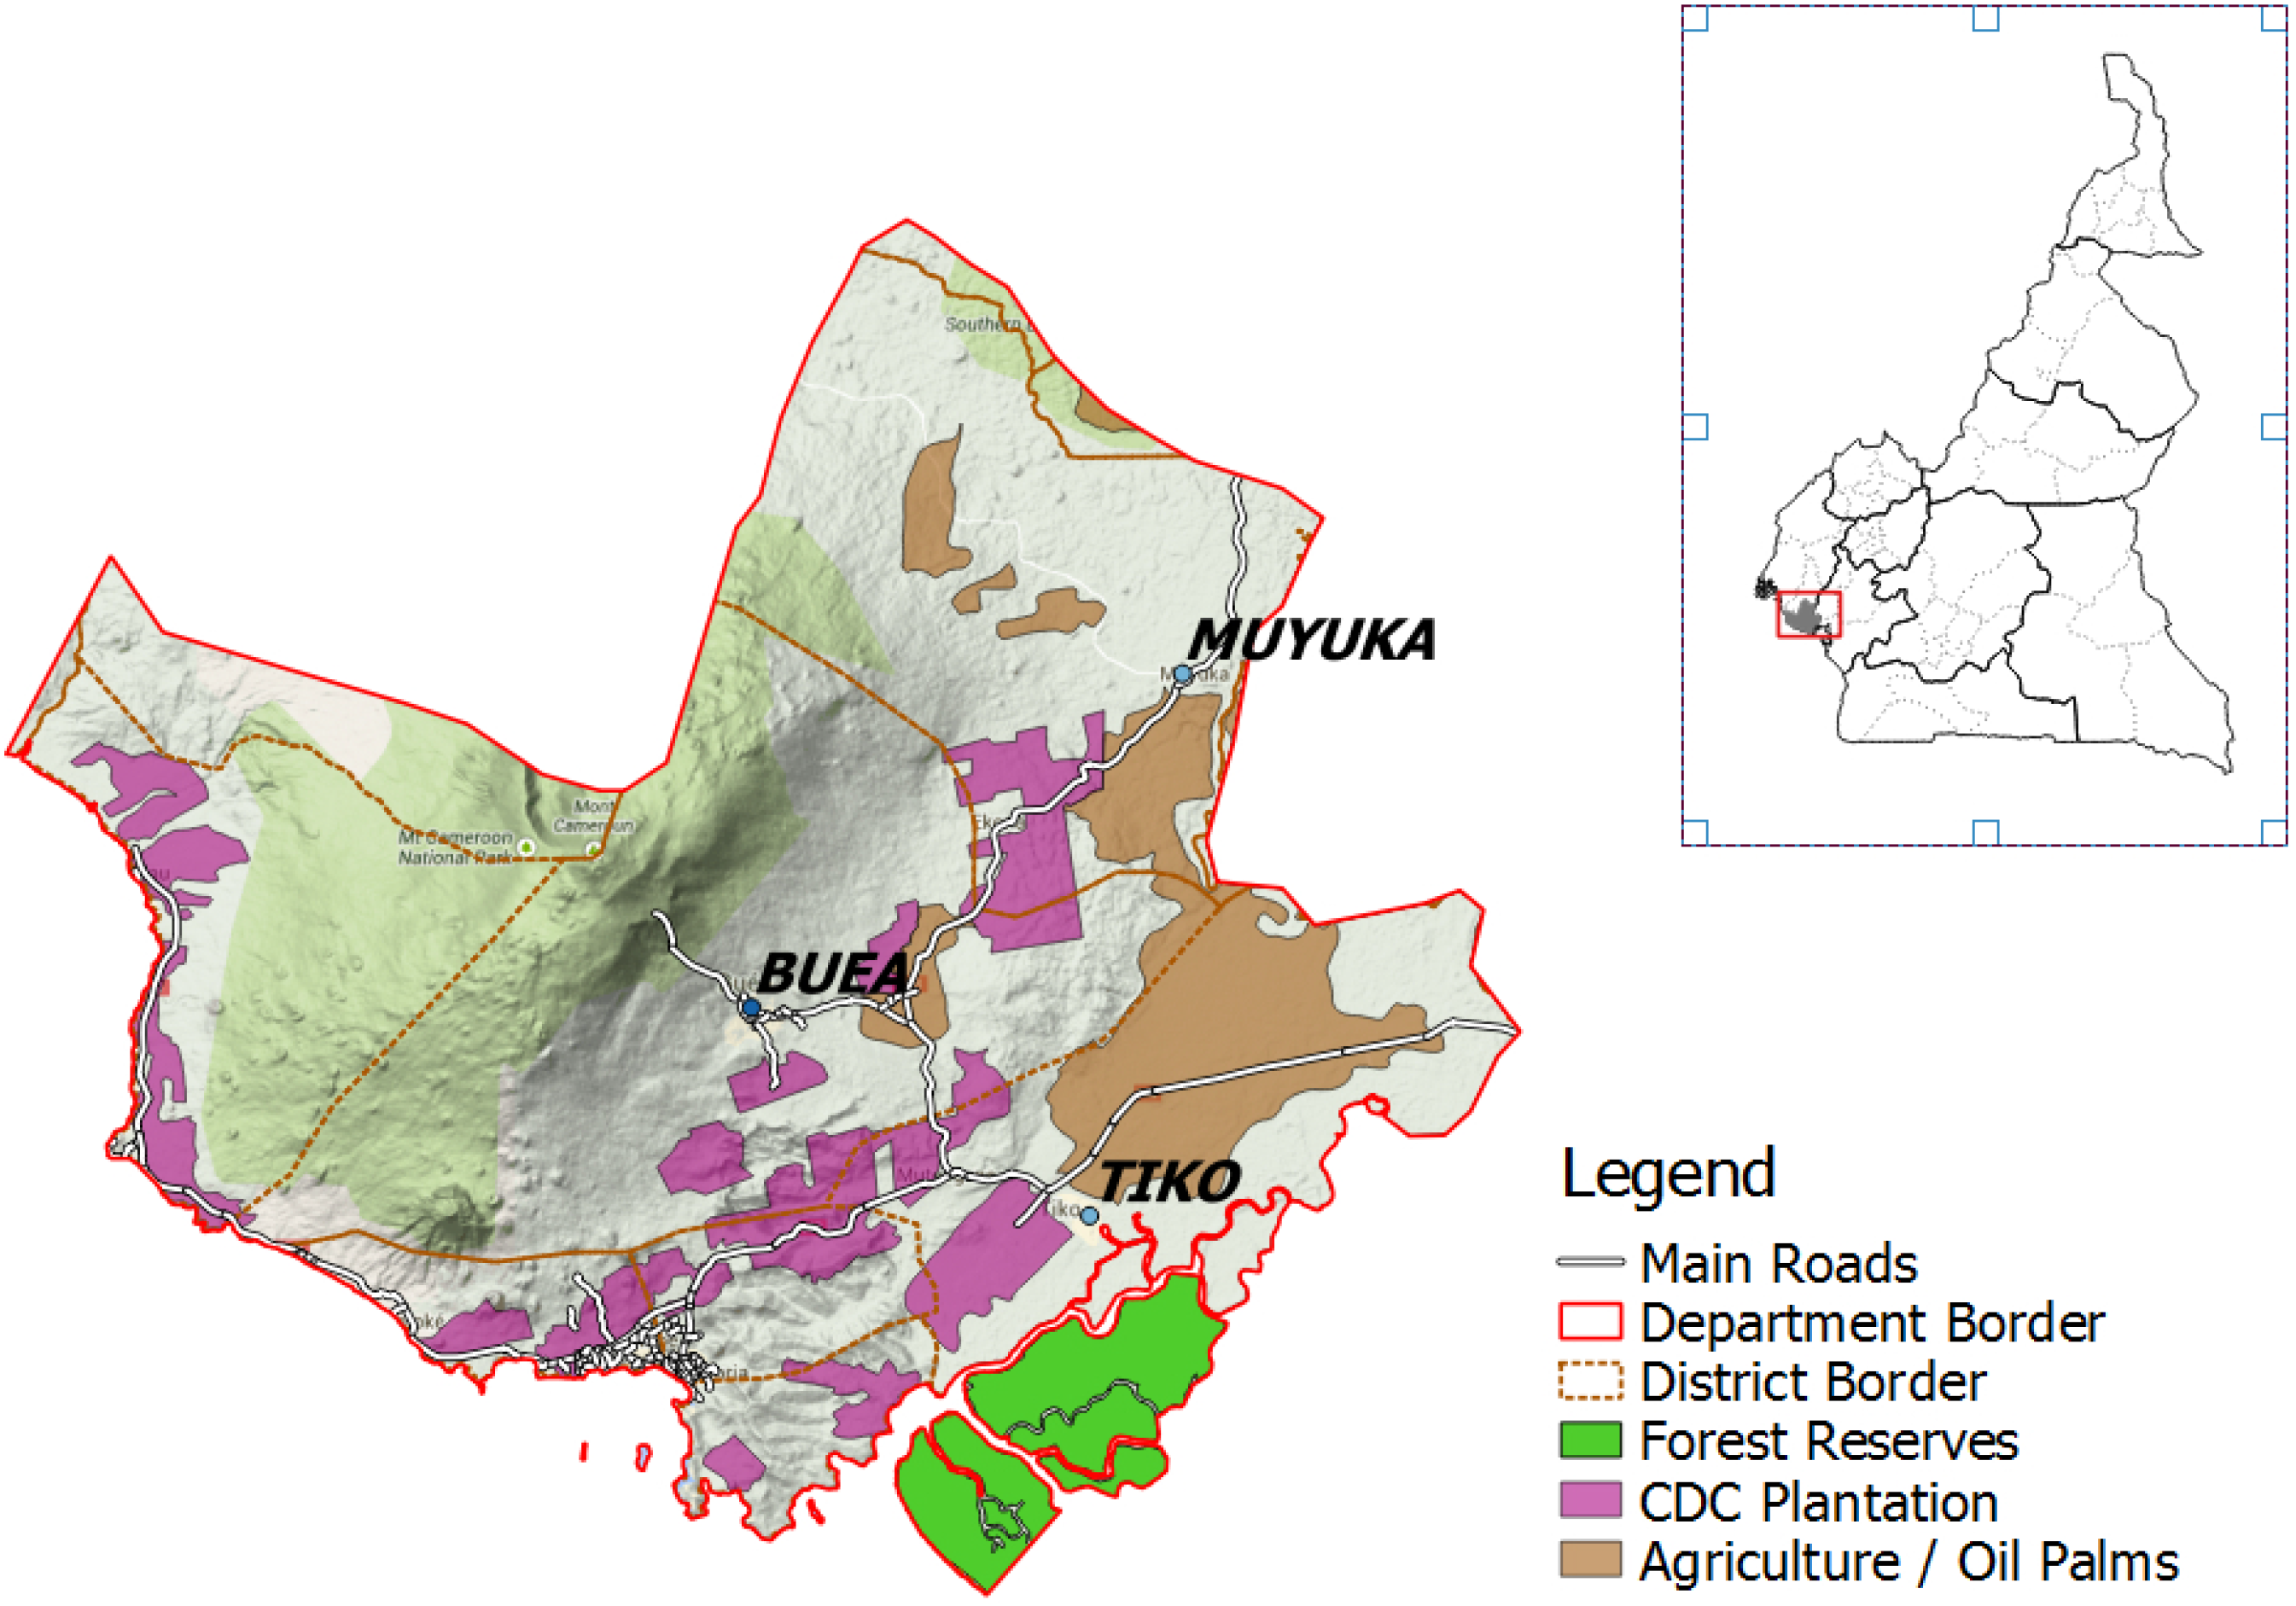
2.2. Description of the Case Study Area Used for Testing the Methodology

Cameroon was chosen as a follow-up to a global drivers study. Moreover, Cameroon is a relevant case study, as it is one of the many countries at the beginning stages of the national REDD+ strategy development process. The pilot study was conducted in the Fako Division, located in the Southwest region of Cameroon and falls within the forest mono-modal agro-ecological zone. This area was chosen due to the relatively good data availability in the region. Fako Division’s size was considered to be large enough to draw conclusions applicable at larger geographical contexts, such as jurisdictional REDD+ programs on a landscape level. In total, Fako Division covers an area of 203,876 ha and consists of montane and sub-montane forest, lowland forest and mangroves. With Mount Cameroon (4100 meters above sea level) near the coastline, the division is characterized by its biophysical circumstances, exceptional biodiversity and rich volcanic soils. The volcanic geography and average rainfall of between 2000 and 3000 mm in the lower parts of Fako Division contribute to high soil fertility, making the area predisposed for agricultural production.
The predominant land uses in the Fako Division can be attributed to three major classes (Figure 2): agricultural lands, urban areas and forests. In line with the forest transition theory [16], the significant land cover changes in the Fako Division are accelerated through positive feedback loops.
The division has experienced large-scale deforestation since colonial times, with the first commercial plantations established in 1907 under the German colonial administration in the coastal plains around Mount Cameroon [17]. Today, the area is characterized by a high influx of farmers from outside the division, who often combine subsistence and cash cropping.
Figure 2. Administrative boundaries of Fako Division in Cameroon.
Forests 06 00203 g002

3. Results

In this section, we present the main findings of the introduced six steps of our methodological framework. The presentation of results is organized according to these methodological steps, with sub-sections corresponding to the steps found in the framework above, except for first step (data gathering and literature review), as the results from this step are integrated throughout.

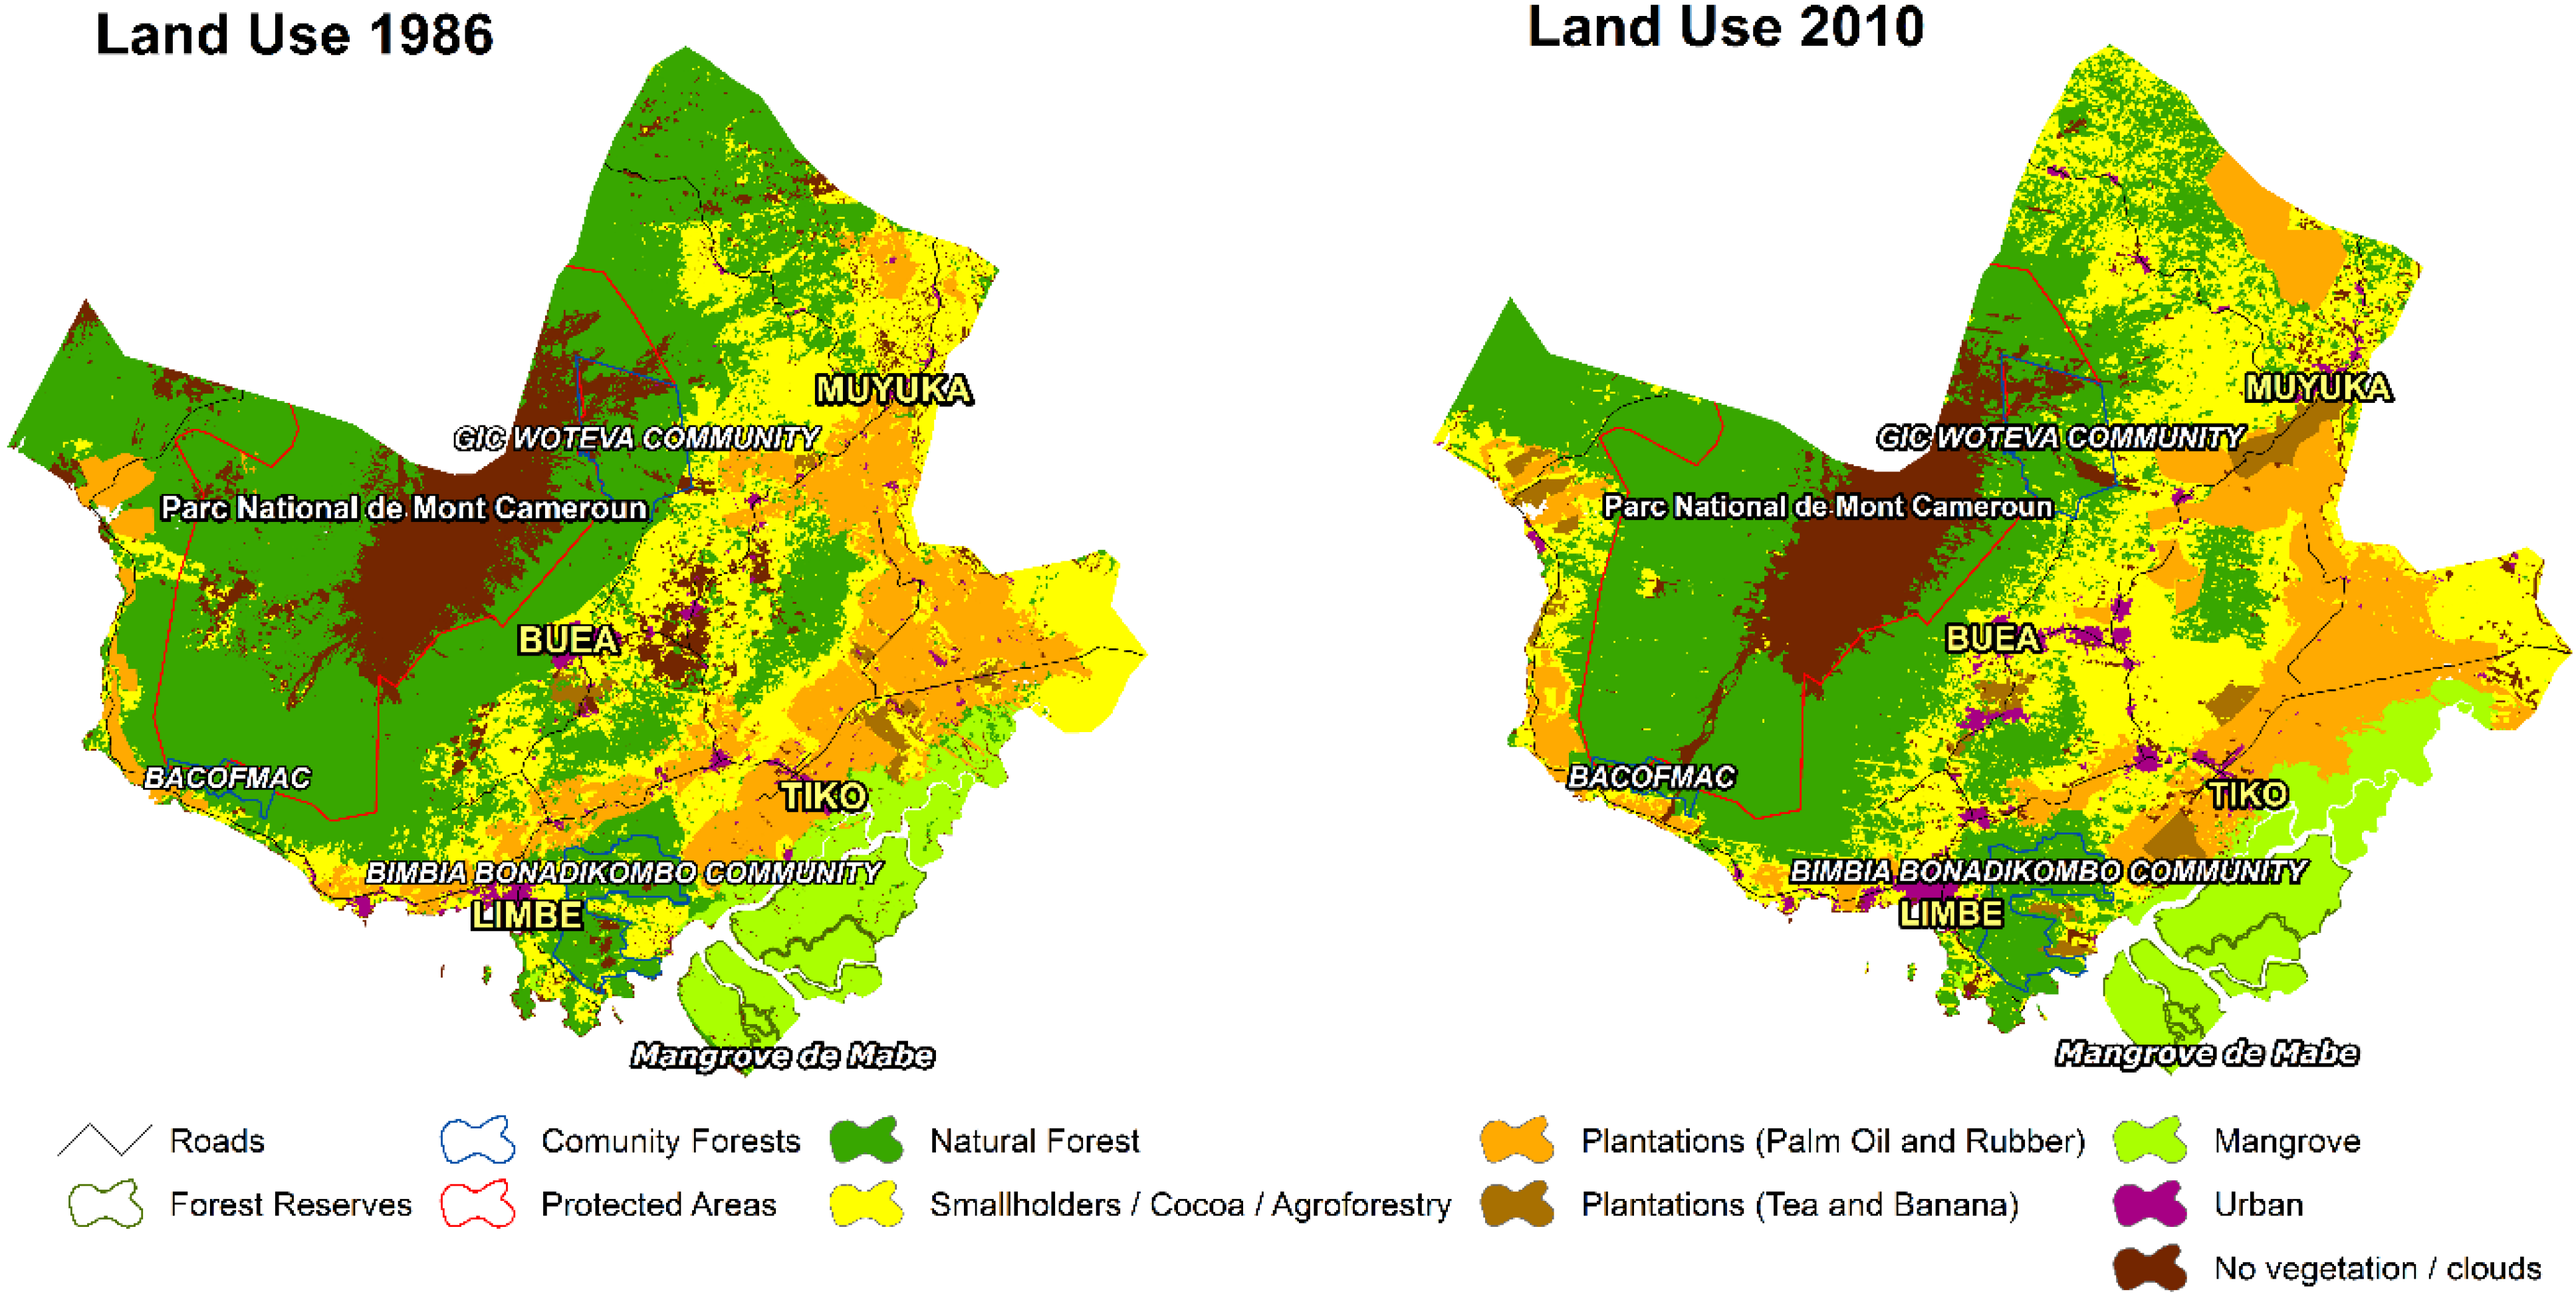
3.1. Land Use/Land Cover and Change Analysis

For the remote sensing analysis, we selected two consistent time series for the years 1986 and 2010 from the Landsat archive. These years had the best coverage of the entire study area with the least cloud cover, allowing for a relatively consistent wall-to-wall comparison. In order to improve the classification, secondary data were used as a reference, for example the World Resources Institute’s (WRI) Interactive Forest Atlas, which provides land use allocation and land cover data [18]. Besides remote sensing data, complementary vector data were gathered related to infrastructure, protected areas, forestry reserves, and large-scale agriculture areas. Our assessment quantified only land use changes due to deforestation, as the degradation assessment using Landsat was not possible. Thus, efforts were made to estimate degradation by using secondary data [19] and by conducting interviews with local stakeholders. According to our remote sensing analysis, in 2010 natural forests cover approximately 80,232 ha, from which almost 75% of these forests are located within the Mount Cameroon National Park and reserves [20]. In addition, mangroves cover about 16,532 ha (see Table 1). The second biggest share of land use in 2010 was agricultural production: cocoa subsistence farming systems (52,445 ha), followed by palm oil and rubber production (27,990 ha), and, less important but rapidly increasing, banana and tea production (4205 ha).
Table 1. Land use change in the Fako Division.
Land useArea in 1986 (ha)Area in 2010 (ha)Net change (ha)
Forest land105,32896,764−8,564
Dense and montane forests90,74280,232−10,509
Mangrove forest14,58716,5321,945
Agricultural land71,84284,64012,798
Smallholder cocoa/subsistence43,52452,4458,920
Plantations—Palm oil and rubber26,87527,9901,116
Plantations—Banana and tea1,4434,2052,762
Urban areas2,7834,1961,412
Clouds23,92318,276−5,647
TOTAL203,876203,876
These figures can be translated in spatially explicit land use maps for the years 1986 and 2010 (Figure 3).
Figure 3. Fako Division land use / land cover in 1986 and 2010.
Forests 06 00203 g003
According to the remote sensing results, net forest lost from 1986–2010 was 8564 ha equaling an annual deforestation rate of 0.51%. The major land use changes have been due to subsistence and cocoa farming (85%) and plantation development for rubber and palm oil (11%) (see Figure 4). Minor proximate deforestation drivers, such as plantation development for tea and banana production and urban development, were responsible only for 4% of the total deforestation. Conversely, mangrove forest areas have increased by 1945 ha, but the discrepancy may only be due to cloud cover changes and the differences in the classification of the Landsat images, instead of an actual increase in cover. However, our field based assessment indicates that mangroves are subject to significant degradation processes, which was not captured by remote sensing.
Figure 4. Forest cover change 1986–2010.
Forests 06 00203 g004

3.2. Carbon Stock Change Analysis

Using the long-term average carbon stock differences (Table 2) of different land uses, and multiplying by area subject to historical changes, the total GHG emission of 4.77 million tCO2 were emitted due to forest loss from 1986–2010, which averages roughly 199,000 tCO2 annually. Deforestation due to subsistence agriculture and cocoa farming was the main GHG emitter, with 3.81 million tCO2 (158,800 tCO2/year), followed by palm oil and rubber with 0.67 million tCO2 (27,800 tCO2/year). Minor, proximate contributors to GHG emissions were forest conversion to banana and tea plantations (195,600 tCO2; 8150 tCO2/year) and urbanization (100,000 tCO2; 4200 tCO2/year).
Table 2. Carbon stocks and emissions of identified land uses.
Land use typeAboveground biomass carbon stock (tCO2/ha)Belowground biomass carbon stock (tCO2/ha)Total long-term average carbon stock (tCO2/ha)
Primary dense natural forest [21,22]568.2136.4704.6
Mangrove forest [21,23]797.4191.4988.8
Degraded mangrove forest [21,22,23]359.995491
Subsistence cocoa mixed [22,24] agroforestry systems and cocoa cashcrop systems [25]210.450.5277.3
Palm oil plantation [21]105.6
Banana and tea plantations [26]91.722113.7
Rubber plantation [26]170.1

3.3. Assessment of Agents and Proximate Drivers

In the Fako Division, we identified four major land uses and four main agent groups responsible for deforestation (Table 3). For the opportunity cost assessment, the net present values (NPVs) were calculated at a discount rate of 10% for a period of 20 years [27]. An economic analysis of standing natural forest was carried out by quantifying the combined value of currently marketed non-timber forest product (NTFPs). The main NTFPs commercialized and consumed by local communities include: eru (Gnetum Africanum), a leaf used in local dishes; bush pepper (Berberis Canadensis) and njansang (Ricinodendron Heudelotii), which are local culinary spices; and bush mango (Irvingia Gabonensis) fruits and nuts [25]. Some NTPFs are also exported such as Prunus Africana (a bark valued by the pharmaceutical industry), and eru, as significant amounts are exported to neighboring Nigeria or Cameroon’s worldwide diaspora. In addition, natural forests provide important ecosystem services, such as hydrological regulation and prevention of soil erosion. Spiritual and cultural values were identified in particular by local community groups.

3.3.1. Agricultural Drivers

The literature review revealed a range of secondary data and analysis regarding economic valuation of land uses in Southwest Cameroon [24,28]. Agricultural land use has been identified as the major proximate driver of deforestation [29]. Our review and field assessment identified three major agents: (1) small-scale farmers practicing cocoa cash cropping combined with subsistence food crop farming; (2) national, medium to large scale investors and local elite, mainly investing in palm oil or rubber production, and (3) large-scale agro-industry, represented by the Cameroon Development Corporation (CDC) undertaking palm oil, rubber and banana production.
Small-scale farmers in the Fako Division can be divided into two groups: local communities, who are traditional land owners and migrants, who moved to the region for the productive farmland. The latter group acquires land through purchase or by user rights transfer from the local traditional chiefs. These migrants are mostly involved in cocoa farming, and are the main agents operating at the forest frontier compared to the indigenous peoples, whose role in deforestation in this context is generally considered minor. Farmers are mainly attracted by the availability of fertile soil, adequate climatic conditions and the relative proximity of markets, mainly for cocoa. Small-scale agriculture, including cocoa farming, is mainly concentrated in areas surrounding the Mount Cameroon National Park, the city of Muyuka and coastal areas. Agricultural production here is characterized by a gradual shift from annual crops (e.g. cocoyams, plantain, cassava, maize for subsistence) to perennial crops (mainly cocoa), combined with the gradual expansion of fields.
Table 3. Overview of proximate agents of deforestation and degradation in Fako Division.
ActivityAgents GroupActivity DescriptionNPV at 10% Discount Rate and 20 yearsOpportunity Costs of Converting Natural Forest or Mangroves Key Social and Environmental Benefits
Natural dense forest—extensive useMainly smallholders in the Fako DivisionCollection of NTFPs and fuel wood51 USD/ha Biodiversity and water, NTFPs food and fuel, tourism, spiritual and cultural values, water and soil erosion control, carbon storage
Sustainable mangrove exploitationCurrently not practicedUtilization of fuel wood and fishing215 USD/ha Biodiversity, maintenance of fish population, flood prevention, fuel wood and building material, employment, carbon storage
Unsustainable mangrove exploitationFuel wood collectors/fishersUnsustainable logging of mangroves for fuel wood and fish-smoking855 USD/ha640 USD/ha 1.3 USD/tCO2
Agricultural expansionSmall-scale farmersCocoa cash crop farming combined with subsistence food crops2,125 USD/ha2,074 USD/ha 4.7 USD/tCO2Food security, income generation, poverty alleviation, fuel wood and construction materials, biodiversity and carbon storage
Medium–large scale investorsPalm oil production 1,244 USD/ha1,193 USD/ha 2 USD/tCO2Creation of local employment and income; outgrower schemes establishment, infrastructural development, carbon storage
Rubber production821 USD/ha770 USD/ha 1.4 USD/tCO2
Large-scale agro-industry (CDC)Palm oil production3,186 USD/ha3,135 USD/ha 5.2 USD/tCO2
Rubber production1,959 USD/ha1,980 USD/ha 3.6 USD/tCO2
Note: For the opportunity costs calculation for agricultural expansion natural dense forest is assumed, while for mangrove forest degradation mangrove forests are used as a basis.
For the economic profitability analysis, we assume the natural forest is initially thinned by burning and used for subsistence crops in the first three years, followed by the planting of cocoa as a cash crop and other fruit tree species. The mixed farming system results in a NPV of US dollars (USD) 2,125 USD/ha over a period of 20 years compared to 51 USD/ha for standing natural forest. The profitability of cocoa without subsistence crops is reduced to 1.615 USD/ha (Table 3), which is mainly due to the late yield of cocoa after planting (year four), while subsistence crops begin generating net positive cash flows in year one. The conversion of natural dense forest to mixed cocoa agroforestry systems results in opportunity costs of 2.074 USD/ha and 4.7 USD/tCO2. Small-scale agriculture is therefore an important source of income generation for local communities and helps them to improve and sustain their livelihoods. With respect to social and environmental non-carbon benefits, this land use type is crucial for domestic food security, providing timber products for construction and fuel wood for cooking. Cash cropping is an additional source of income, with mixed agroforestrycocoa systems potentially playing an important role in conserving local biodiversity while functioning as carbon sinks.
Medium-scale investors are composed of a group of local elites who invest in agriculture, especially in palm oil and rubber. This agent group may include former civil servants, business men, politicians, high-ranking officials or the returning diaspora. Generally, this group purchases land areas between 5 and 100 ha in order to establish plantations, mostly in proximity to agro-industry, where forests have already been removed or degraded and a paved road system is already in place. Such investors are also attracted by the division’s fertile soils and favorable climatic conditions, but are highly motivated also by expected increases in international commodity prices. Plantations are managed and developed by permanent local staff, with the support of seasonal farmers. Because of the poor equipment and old machinery, palm oil yields and processing efficiency is generally very low, with an average yield of 8 t/ha fresh fruit bunches (FFB) and efficiency rates at around 12%, compared to the agro-industry with a return on investment between 18% and 20%. Rubber yields are also relatively low, with an average of 1.26 t/ha dried rubber at maturity [30], which we confirmed during our field assessment and interviews.
One rotation cycle generally lasts 25 years for both land use types. The profitability of both rubber and palm oil production models is relatively similar. Over a 20-year period, palm oil has a NPV of 1.244 USD/ha, with an internal rate of return (IRR) of 19%, whereas rubber has an NPV of 821 USD /ha, with an IRR of 13.9% (Table 3). The low NPV for rubber is mainly due to the fact that trees can only be tapped for the first time at an age of 8 years, thus positive cash flows occur very late. The opportunity cost for avoiding the conversion of natural forest to palm oil creates opportunity costs of 1,193 USD /ha and 2 USD/tCO2, while avoiding conversion to rubber results in opportunity costs of 770 USD/ha and 1.4 USD/tCO2. Benefits related to local employment generation are considered important non-carbon benefits, as well as the contribution to national food security, as Cameroon relies on international imports to meet domestic food needs.
Agro-industry The state-owned CDC is one of the biggest agro-businesses in Cameroon, with currently around 11,900 ha under palm oil production, 8500 ha for rubber and 4500 ha for banana [18]. Prior to the 25 year time period covered by this study, agro-industry was the major deforestation agent in the Fako Division. However, the relative importance of this agent can be considered to be decreasing, as land leases are expiring and investment in maintenance and replanting is low. The palm oil and rubber plantations are generally over-mature, with relatively low yield level compared to international benchmarks. CDC palm oil plantations yield on average between 12 and 18 t/ha FFB, whereas internationally, average yields range between 20 and 25 t/ha [30]. The processing efficiency rate is only about 18.5% due to old and partially outdated machinery. Compared to the medium size investors, palm oil and rubber development under the CDC is more professionalized and more intense with higher fertilizer, herbicide and insecticide as well as labor inputs, which result in a higher profitability.
The analysis shows that palm oil is most profitable over a period of 20 years with an NPV of 3,186 USD/ ha and an IRR of 24.2%, while rubber is less competitive over a period of 20 years with an NPV of 1959 USD/ha and an IRR of 16.6%. The opportunity costs for the avoidance of converting natural forest to palm oil and rubber amount to 3,135 USD/ha (5.2 USD/ tCO2) and 1908 USD /ha (3.6 USD/ tCO2), respectively.
Similar to the medium size investors, the CDC as a large employer, also contributes to poverty alleviation, income generation and established outgrower schemes. Moreover, the company contributes significantly to meeting the national demand for palm oil products and reducing international import dependency. Furthermore, the company often supplies some electrical facilities and helps to build unpaved roads in some areas, which facilitate access to the market for nearby communities.

3.3.2. Mangrove Ecosystems

Mangrove ecosystems play a crucial role in the local economy, where people around coastal locations in the Fako Division are heavily dependent on these ecosystems for the harvesting of fish, shrimp, NTFPs, timber and fuel wood [31]. It is estimated that about 62.5% of the total wood harvested is used for fish smoking alone, while 34.3% of wood harvested is used for cooking and 3.3% for construction [32]. It has been estimated that one ha of mangroves can produce around 3.4 m³/ha sustainable annual yield of timber and fuel wood [33]. In our economic valuation, and excluding annual labor costs, this yield could result in an NPV of 215 USD/ha over a period of 20 years. However, mangrove ecosystems have additional crucial social and environmental benefits. Most important is the provision of a healthy habitat for fish populations for commercial and subsistence uses, erosion prevention, a natural barrier against floods, water regulation services and spiritual values. Our economic values thus only partially reflect the actual economic value of this ecosystem. Moreover, mangroves are a significant biodiversity hotspot and function as a large carbon sink.
Our field assessment has shown that mangroves are generally not managed and harvesting rates exceed annual growth rates, leading to significant degradation. Therefore, in our economic model we assume annual extraction rates are roughly 13.6 m³/ha/year, resulting in a reduction from 402 m³/ha to 200 m³/ha over a period of 20 years, resulting in a NPV of 855 USD/ha. Thus, the opportunity cost of switching to more sustainable mangrove exploitation is 640 USD/ha and 1.3 USD/tCO2.

3.4. Analysis of Underlying Causes

In the following, the causes underlying the above drivers and agents are described according to the five main factors explained in the Methodology. Both the current and expected future impact is explained, as depicted in Figure 5.
Figure 5. Estimated impacts of underlying causes for deforestation and forest degradation.
Forests 06 00203 g005

3.4.1. Demographic Factors

Due to natural reproduction, in-migration, and urbanization, the population of Fako Division has grown from roughly 220,000 persons in 1987 to an estimated 465,000 in 2005 [34]. This increase implies a higher demand for agricultural products and thus more pressure on the land and forests. The relationship, however, between population growth and deforestation is not always linear and other factors such as land availability may be more influential. Without a transformation in current agricultural practices towards less area expansion, the increasing number of small-scale farmers will result in continued forest conversion. However, given the limited amount of arable land left in Fako Division, it can be expected that future deforestation resulting from larger-scale agents will increase in importance due to other causes not related to demographic trends.
The percentage of the population in urban areas in the Fako Division has risen from 48% in 1987 to 65% in 2005 [34]. Interviews suggest that urbanization in Fako Division in part due to educational opportunities in Buea. The increase in educational opportunities brings higher-income employment opportunities, resulting in changes in consumption patterns. Demand for local deforestation-driving products, e.g., eru and mangrove wood smoked fish, is expected to rise. However, higher income also implies more demand for processed foods and higher-value imported products, leading to deforestation outside of Fako.

3.4.2. Economic Factors

The main economic factors affecting large-scale agents are demand/market forces, whereas mainly poverty affects small-scale agents. Although Cameroon is a net importer of agricultural products, in particular, palm oil, rubber, cocoa and banana produced in the Fako Divisions are mainly exported, with international price speculations impacting deforestation. Small-scale cocoa and rubber are affected by fluctuations in crop prices while the CDC’s palm oil is by law destined for consumption in Cameroon, with the price fixed by the government. During the field work, the “growing influence of Nigeria’s economy” was often referred to, with this densely-populated neighbor already placing significant pressure on the area’s natural resources, including NTFPs and mangrove fuel wood. Improving regional trade and developing the infrastructure connecting Cameroon and Nigeria is part of the regional development plan, meaning this market is expected to place increasing pressure on all agents (except for agro-industry) in the future.
The definition of poverty is manifold and extremely subjective. In this study, poverty is defined as the lack of livelihood alternatives, and thus is most relevant to the small-scale agents. However, the impact of poverty is expected to decrease in the future in line with planned improvements in government service provision and related productivity improvements.

3.4.3. Technological Factors

The main technological factors impacting agents in the Fako Division are low productivity and infrastructure development. Low productivity generally affects all agents, with barriers for smallholders and small firms to access technology, skills and finance, widely documented as a constraint to sustainable productivity growth in Africa’s agriculture sector [35]. In the case of cocoa, research has shown that improved crop varieties result in significant productivity increases, which could (given the correct policy context) reduce agricultural area expansion [36]. Field interviews confirmed the perception of the direct link between agricultural inputs and productivity.
Regarding infrastructure development, the road network is considered of low quality and thus, the current impact on agents remains limited. However, planned infrastructure development is expected to have the highest influence on small-scale farmers, as local informants explain the lack of “farm-to-market” roads hinders small-scale agriculture expansion. The link between road infrastructure development and deforestation is highly context dependent; however, it is argued that increased market accessibility raises farmer net incomes, which leads to further investments in productivity and reduces the need to expand farm areas into forests. Moreover, infrastructure development is highly linked to the distribution and use of technology, especially in the case of agricultural inputs, which may in turn lead to higher productivity. Improving agricultural technology and crop yields can relieve pressure on the forests, but also can encourage more deforestation if the surplus generated is used for additional forest clearing [37].

3.4.4. Policy and Institutional Factors

Non-forest policies and processes, especially agriculture development programs, play an important role in stimulating forest clearance [36]. The development goals and sector strategies outlined in Cameroon’s national development plans, if realized, may lead to further deforestation, as the Cameroonian government has made a high-level political and economic decision to develop agro-industrial plantations to promote job creation, and economic growth and development [38]. However, as policy implementation is often weak, the impact of these development plans is difficult to quantify and in this analysis remains speculative only. Also, the lack of national land use planning to match these development plans results in land being allocated to large-scale agriculture or mining developments in a non-transparent way, which was witnessed in the Fako Division by the lack of awareness of local experts in the government’s granting of 100,000 ha around Mount Cameroon to a Russian coffee company [39]. The absence of a consistent framework for the allocation and publication of natural resource permits and contracts that ensures coherence across natural resource sectors is one of the main underlying causes of deforestation.
Traditional land tenure systems in rural areas often operate in opposition to national land ownership and use arrangements, which for smallholders create a sense of insecurity that restricts productivity-enhancing investments on land. There are often overlaps in land ownership and it is not uncommon that the same plot of land is sold to a number of individuals. Farmers, in particular migrants, cultivate forest areas in order to gain rights to land under customary law. Land tenure insecurity has less impact on larger-scale agents who are better placed to obtain official land titles.

3.4.5. Cultural Factors

In the Fako Division, cultural factors underlying deforestation or degradation are most relevant to the use of mangrove wood for fish drying. Mangroves are under pressure in the Division. The asserted better taste of the fish dried with mangrove wood [31] implies that those operating the dried fish value chain are unlikely to switch to alternative fuel sources, even if they were available.

4. Critical Discussion of the Methodological Framework

The framework combines a number of tools whose results demonstrate the relative importance of different drivers according to forest area lost (through remote sensing and ground truthing), associated emissions, economic weight (opportunity costs), associated non-carbon benefits of land use changes from the agent perspective. The methodology as developed and tested has proven to be suitable for identifying and prioritizing drivers and agents of deforestation in the Fako Division in Southern Cameroon, and for assessing the relevance of underlying causes and likely future trends. We argue the methodological framework is also relevant to other forest areas under pressure, including in contexts of limited data availability.
However, for a large-scale application in jurisdictional or national-level REDD+ schemes the methodology has a number of trade-offs, mainly with regards to the amount of resources required: the thoroughness and integrity of the drivers’ analysis depend very much on funding availability to carry out thorough field assessments and existing data, especially access to reliable and spatially-explicit land use data. In the following, we discuss the critical deficiencies we encountered while testing the methodological framework.

4.1. Land Use/Land Cover Change Analysis

Given the large spatial dimension of regions and countries considering REDD+, trade-offs have to be made between the level of detail of the drivers’ assessment and the costs. Developing the land use change matrix requires a wall-to-wall remote sensing coverage in at least two time periods from comparable satellite images. As this was not readily available for the entire mono-modal agro-ecological zone, carrying out the analysis for the Fako Division using Landsat data from 1986 and 2010 proved to be a relatively cost-effective approach. A limitation of Landsat, however, concerns the assessment of forest degradation: with its optical sensor, Landsat cannot detect forest degradation, especially small-scale forest degradation that causes spatial changes that are smaller than the pixel resolution of the satellite images. While high resolution satellite images can partially cope with these deficits, the high costs of these technologies may be prohibitive for many cases and for large areas. The methodology is flexible however, and more detailed remote sensing analysis using higher resolution images is encouraged, if available resources allow.

4.2. Estimation of GHG Emissions

The assessment of carbon stocks and GHG emissions according to land use category should be based on local/regional studies. Where data were unavailable or uncertain, IPCC tier 1 data that reflect long-term average carbon stocks can be used, as was done for some land use categories assessed in this case study. While the use of such proxy data may not be sufficient for carbon accounting in future REDD+ projects, it is helpful for understanding the dimension of emissions and for prioritizing actions and measures to address drivers. This step of the methodological framework provides reasonable preliminary estimates which serve to inform the development and prioritization of REDD+ strategy options, keeping in mind that REDD+ is results-based and net emissions reductions may likely be the key performance indicator.

4.3. Assessment of Proximate Drivers and Agents

The field assessment is critical for understanding the opportunity costs and other non-financial factors underpinning deforestation agents’ motivations and location-specific land uses, from a bottom-up perspective of land users. The field assessment is also important for understanding the socio-economic settings and contexts leading to deforestation, as drivers do not necessarily result from rational decision-making, where deforestation agents make informed decisions based on which land use has the highest economic return. For example, large-scale agents may be influenced by land use planning and national development priorities, while small-scale agents may be driven to engage in deforestation due to livelihood requirements. During the field work for this study, we found that it is crucial to triangulate different sources of information: using existing socio-economic local studies, collecting field based data and conducting expert interviews for each individual agent and land use to conduct regular plausibility checks of results generated.

4.4. Assessment of Underlying Causes

The approach to assessing current impacts and future trends of underlying causes is explorative and necessarily simplifies complex interactions between multiple forces. However, depicting underlying causes using colors and arrows allows for a broader range of stakeholders to understand and contribute to the analysis. The underlying causes analytical process is meant to bring together diverse stakeholders to discuss the oft sensitive reasons underlying forest decline. The driver assessment final validation workshop provided an ideal venue for this multi-stakeholder dialogue.
Driver assessments increasingly incorporate spatial or agent-based modeling to project future expected impacts of different parameters. These modeling exercises are often preceded by scenario-based stakeholder consultations to determine potentially salient factors to model, similar to the consultations carried out for this study. Thus, the results generated through this methodology can be seen as the first step in a more detailed analysis, including a quantitative analysis of non-proximate underlying causes. However, while the effects of some underlying causes can be more easily quantified and modeled, such as commodity price fluctuations, international trade or road construction, a number of important underlying causes are not easily captured by the modeling approach, i.e. poor natural resource governance and a lack in law enforcement capacity.
While carrying out the methodological steps within clearly delineated spatial and temporal boundaries allows for quantifying proximate drivers and agents in terms of forest loss, GHG emissions and economic weight, this approach is likely to miss or downplay distant drivers, e.g. international commodity demand and trade fluctuations, which may not be readily perceived by local land users.

5. Conclusions and Outlook

Our methodological framework guides systematic assessments of agents, proximate drivers and underlying causes of deforestation in a given geographical context by the use of existing information and studies and by combining the best practice drivers assessment methods and tools. The framework combines bottom-up (e.g., opportunity costs from agent perspective) and top-down (e.g., remote sensing) approaches, whose combined results lay the basis for subsequently identifying and prioritizing REDD+ strategy options. Further features are the inclusion of private and public stakeholders at different stages of the assessment and the purposeful combination of quantitative and qualitative information. The transparent generation and communication of the results helps in validating the findings.
While the testing of the framework reaffirmed the general suitability of the approach, it also revealed inevitable trade-offs in terms of the level of detail and accuracy. Detailed drivers assessments are crucial for the identification of strategic options to effectively address deforestation. In order to balance the trade-offs between accuracy and costs, we propose a disaggregated approach, where detailed drivers assessments are carried out in areas carefully selected for their representativeness and suitability. The criteria for selecting priority areas for assessment depends on the objectives of the REDD+ program, i.e., addressing deforestation or degradation, or developing REDD+ programs in a specific forest ecosystem. Priority areas may be deforestation hotspots or areas having experienced significant deforestation rates in the past or that possibly will in the future, identified through spatially explicit sector strategies or investment plans. We argue that such a disaggregated approach is suitable for balancing the above-described trade-offs, as driver assessments carried out at the national level have often concluded that drivers are highly context-dependent and recommend more detailed analysis at the local level.
Bearing in mind the trade-off-between costs and the level of detail, this method is sufficient to determine the most important agents and activities that lead to GHG emissions and should be improved over time. By applying this methodological framework, the gathered information provides a solid basis for the development of REDD+ strategy options and the different elements needed for a comprehensive national approach for REDD+. Opportunity cost analyses often show that non-forest land uses are economically more profitable than maintaining natural forest for local forest users. Given the relatively low economic benefits derived from forests for deforestation agents, countries need to develop REDD+ strategies that provide economic alternatives at the local level. New land use strategies may need to be developed in order to provide livelihood benefits without compromising forest health and functionality. The case study of Fako Division shows that smallholder farmers are the agent currently causing the most forest loss. Cameroon’s national REDD+ strategy can address the deforestation caused by this agent by through an array of specific interventions as part of an integrated landscape management strategy to maintain or regenerate forest cover and improve food production per unit area of cropland. Increasing small-holder farmer crop yield will also increase farmer income and welfare and with the right institutional context, reduce uncontrolled forest loss. Although a comprehensive and detailed driver analysis at the local level is only the first analytical step, the right combination of farm-level interventions and cross-cutting policy measures requires further analyses.

Acknowledgements

This study was carried out by UNIQUE forestry and land use, with institutional and in-kind funding provided by the later. The study was financed by the Deutsche Gesellschaft für Internationale Zusammenarbeit GmbH (GIZ) Forest Governance Program, who also provided technical support in terms of review of the methodology and Reinhard Wolf provided an expert review of this paper. Timm Tennigkeit and Didier Hubert provided thorough reviews of the longer version of this report. We also thank the Programme d’Appui du Programme Sectoriel Forêt et Environnement (ProPSFE) in Cameroon for their technical and financial contributions, especially in supporting the logistics of the field study, and financing and organizing the workshop and technical working group meeting. The article processing charge was funded by the open access publication fund of the Albert-Ludwigs University Freiburg. Thank you also to two anonymous reviewers for their constructive comments.

Author Contributions

Sophia Carodenuto and Eduard Merger developed the methodology. These two including Eric Essomba, undertook the field assessment and subsequent analysis. Metodi Panev carried out the remote sensing and Till Pistorius contributed to the discussion, conclusions and overall presentation of the paper. Joseph Amougou provided institutional support, ensuring the paper and overall study is in line with the expectations of Cameroon’s Ministry of Environment and Sustainable Development (MINEPDED), the state agency responsible for REDD+ strategy design and implementation.

Conflicts of Interest

The authors declare no conflict of interest.

References and Notes

  1. Draft Decision -/CP.16 Outcome of the Work of the Ad Hoc Working Group on Long-Term Cooperative Action under the Convention. Available online: http://unfccc.int/files/meetings/cop_16/application/pdf/cop16_lca.pdf (accessed on 15 November 2014).
  2. Decision 1/CP.16, Paragraphs 72 and 76 Warsaw COP REDD+ Decision. Available online: http://unfccc.int/files/meetings/warsaw_nov_2013/decisions/application/pdf/cop19_drivers_deforestation.pdf (accessed on 15 November 2014).
  3. Brockhaus, M.; di Gregorioa, M.; Mardiaha, S. Governing the design of national REDD+: An analysis of the power of agency. For. Policy Econ. 2013, 49, 23–33. [Google Scholar] [CrossRef]
  4. Hosonuma, N.; Herld, M.; de Sy, V.; de Fries, R.S.; Brockhaus, M.; Verchot, L.; Angelsen, A.; Romijn, E. An assessment of deforestation and forest degradation drivers in developing countries. Environ. Res. Lett. 2012, 7. [Google Scholar] [CrossRef]
  5. Kissinger, G.; Herold, M.; de Sy, V. Drivers of Deforestation and Forest Degradation: A Synthesis Report for REDD+ Policymakers; Lexeme Consulting: Vancouver, BC, Canada, 2012; p. 48. [Google Scholar]
  6. Geist, H.J.; Lambin, E.F. Proximate Causes and Underlying Driving Forces of Tropical Deforestation. BioScience 2002, 52, 143–150. [Google Scholar] [CrossRef]
  7. Mathews, R.; Swallow, B.; Noordwijk, M.; Milne, E.; Minang, P.; Bakam, P.; Brewer, M.; Muhammed, S.; Poggio, L.; Glenk, K.; et al. Development and Application of Methodologies for Reduced Emissions from Deforestation and Forest Degradation (REDD+)—Phase 1. Final Report; World Agro-Forestry Center: Nairobi, Kenya, 2010; p. 192. [Google Scholar]
  8. Crystal, D.; Nakhooda, S.; Daviet, F. Getting Ready. A Review of the World Bank Forest Carbon Partnership Facility Readiness Preparation Proposals; World Resources Institute: Washington, DC, USA, 2010. [Google Scholar]
  9. Field work was carried out in July 2013; a national stakeholder validation workshop was held in September 2013 where the results were presented and participants were divided into working groups to provide feedback on the methodology. A revised version of the methodology was developed and corrections were validated by a technical working group in November 2013. Workshop reports are available from the authors upon request.
  10. GOFC-GOLD. A Sourcebook of Methods and Procedures for Monitoring and Reporting Anthropogenic Greenhouse gas Emissions and Removals Associated with Deforestation, Gains and Losses of Carbon Stocks in Forests Remaining Forests, and Forestation, GOFC-GOLD Report version COP18-1; (GOFC-GOLD) Land Cover Project Office, Wageningen University: Wageningen, The Netherlands, 2012. [Google Scholar]
  11. Blaschke, T.; Burnett, C.; Pekkarinen, A. Image segmentation methods for object-based analysis and classification. Remote Sens. Digit. Image Proc. 2004, 5, 211–236. [Google Scholar]
  12. Gamanya, R.; de Maeyer, P.; de Dapper, M. An automated satellite image classification design using object-oriented segmentation algorithms: A move towards standardization. Expert Syst. Appl. 2007, 32, 616–624. [Google Scholar] [CrossRef]
  13. Land Change Modeler Software for ArcGIS. Available online: http://www.clarklabs.org/products/Land-Change-Modeler-Overview.cfm (accessed on 28 August 2014).
  14. Merger, E.; Held, C.; Tenningkeit, T.; Blomley, T. A bottom-up approach to estimating cost elements of REDD+ pilot projects in Tanzania. Carbon Balanc. Manag. 2012, 7, 1–14. [Google Scholar] [CrossRef]
  15. White, D.; Minang, P. Estimating the Opportunity Costs of REDD+: A Training Manual. World Bank Institute Version 1.3 March 2011. Available online: http://www.forestcarbonpartnership.org/redd-opportunity-costs-training-manual (accessed on 15 November 2014).
  16. Rudel, T.K.; Coomes, O.T.; Moran, E.; Achard, F.; Angelsen, A.; Xu, J.; Lambin, E. Forest transitions: Towards a global understanding of land use change. Glob. Environ. Chang. 2005, 15, 23–31. [Google Scholar] [CrossRef]
  17. Konings, P. L’Etat, l’agro-industrie et la paysannerie au Cameroun. Polit. Afr. 1986, 22, 120–137. [Google Scholar]
  18. Interactive Forest Atlas of Cameroon Version 3.0. Available online: http://www.wri.org/publication/interactive-forest-atlas-cameroon-version-30 (accessed on 28 August 2014).
  19. Ajonina, G.N.; Usongo, L. Preliminary Quantiative Impact Assessment of Wood Extraction on the Mangroves of Douala-Edea Forest Reserve, Cameroon. Trop. Biodivers. 2001, 7, 137–149. [Google Scholar]
  20. PSMNR-SWR (Program of Sustainable Management of Natural Resources—South West Region). In Benchmark Map and Assessment of Deforestation/Forest Degradation Trends in the Mount Cameroon REDD+ Project Area. Project Report February 2011; PSMNR-SWR: Buea, Cameroon, 2011.
  21. Penman, J.; Gytarsky, M.; Hiraishi, T.; Krug, T.; Kruger, D.; Pipatti, R.; Buendia, L.; Miwa, K.; Ngara, T.; Tanabe, K.; et al. Good Practice Guidance for Land Use, Land-Use Change and Forestry. Annex 3A.1. Biomass Default Tables for Section 3.2 Forest Land. Global Environmental Strategies (IGES) for the IPCC; IPCC: Kanagawa, Japan, 2003. [Google Scholar]
  22. Nonga, N.S.E.; Sonwa, D.J.; Kongmeneck, B.A.; Gockowski, J. Tree Management in Cocoa Agro Forests of South West Cameroon: Implications for Livelihoods and Carbon Stocks. IUFRO/FORNESSA; World Agroforestry Centre: Yaoundé, Cameroon, 2012. [Google Scholar]
  23. Ajonina, G.N. Inventory and Modelling Mangrove Forest Dynamics Following Different Levels of Wood Exploitation pressures in the Douala-Edea Atlantic Coast of Cameroon, Central Africa. Ph.D. Thesis, Faculty of Forest and Environmental Sciences, Albert Ludwigs University, Freiburg, Breisgau, Germany, 2008. [Google Scholar]
  24. Gil, Y. Forest, Plantation Crops of Small-Scale Agriculture? An Economic Analysis of Alternative Land Use Options in the Mount Cameroon Area; Center for Social and Economic Research on the Global Environment (CSERGE) Working Paper; GEC: Buea, Cameroon, 1999. [Google Scholar]
  25. Nkwatoh, W.F. Mount Cameron Project Buea, Final Report for the NTFPs Market Survey for Zone 3. M.C. Project; MCP: Buea, Cameroon, 1998. [Google Scholar]
  26. Egbe, A.E.; Tabot, P.T.; Fonge, B.A.; Bechem, E. Simulation of the impacts of three management regimes on carbon sinks in rubber and oil palm plantation ecosystems of South- Western Cameroon. J. Ecol. Nat. Environ. 2012, 4, 154–162. [Google Scholar]
  27. According to guidance provided in [16], the discount rate should reflect the approximate commercial loan interest rate. According to CIA World Factbook, Cameroon’s commercial bank prime lending rate its 14% and central bank discount rate is 4.25%. Thus, a discount rate of 10% was employed in this study.
  28. Bellassen, V.; Gitz, V. Reducing Emissions from Deforestation and Degradation in Cameroon—Assessing costs and benefits. Ecol. Econ. 2008, 68, 336–344. [Google Scholar] [CrossRef]
  29. Solymosi, K.; Carodenuto, S.; Tennigkeit, T. Agriculture as the Main Driver of Deforestation and Key Sector for the Implementation of REDD+. German Federal Ministry for Economic Cooperation and Development (BMZ), 2013. Available online: http://star-www.giz.de/fetch/3fQ00o3XY0001HgMEe/giz2013–0627en-agriculture-redd.pdf (accessed on 15 November 2014).
  30. Große-Rüschkamp, A.; Mkouonga, F.H. Development of Outgrower Schemes within the Subsectors of Palm Oil and Rubber; Draft Feasibility Study on behalf of the Financial Cooperation between the Government of Cameroon and the Federal Republic of Germany: Hamburg, Germany, 2008. [Google Scholar]
  31. Feka, N.Z.; Manzano, M.G. The implications of wood exploitation for fish smoking on mangrove ecosystem conservation in the South West Province, Cameroon. Trop. Con-Servation Sci. 2008, 1, 222–241. [Google Scholar]
  32. Feka, N.Z.; Chuyong, G.B.; Ajonina, G.N. Sustainable utilization of mangroves using improved fish-smoking systems: A management perspective from the Douala-Edea wildlife reserve, Cameroon. Trop. Conserv. Sci. 2009, 2, 450–468. [Google Scholar]
  33. Ajonina, G.N. Inventory and Modelling Mangrove Forest Stand Dynamics Following Different Levels of Wood Exploitation Pressures in the Douala-Edea Atlantic Coast of Cameroon, Central Africa. Ph. D. Thesis, Faculty of Forest and Environmental Sciences, Albert-Ludwigs-Universität, Freiburg, Germany, 2008. [Google Scholar]
  34. Cameroon national census. Bureau Central des Recensements et des Etudes de Population. 2010. [Google Scholar]
  35. World Bank. World Development Report 2008: Agriculture for Development; World Bank: Washington, DC, USA, 2007. [Google Scholar]
  36. Robiglio, V.; Ngendakumana, S.; Gockowski, J.; Yemefack, M.; Tchienkoua, M.; Tchawa, P.; Tchoundjeu, Z.; Bolognesi, M. Reducing Emissions from All Land Uses in Cameroon. Final National Report. ASB Partnership for the Tropical Forest Margins; ASB Partnership, ICRAF: Nairobi, Kenya, 2010. [Google Scholar]
  37. Angelsen, A.; Kaimowitz, D. Agricultural Technologies and Tropical Deforestation; CABI and CIFOR: New York, NY, USA, 2001; p. 423. [Google Scholar]
  38. Ministry of the Economy. Planning and Regional Development (MINEPAT). Cameroon Vision 2035.
  39. Cameroon Tribune Online. La cooperation Cameroun-Russie comme elle va. 23 Juillet 2012. Available online: https://www.cameroon-tribune.cm/index.php?option=com_content&view=article&id=69434:la-cooperation-cameroun-russie-comme-elle-va&catid=1:politique&Itemid=3&showall=1 (accessed on 28 August 2014).

