1. Introduction
In recent years it has become increasingly important to obtain accurate estimates of the wood volume or biomass of individual trees. These data are beneficial for multiple service forestries as a suitable forest management tool to produce a wide array of ecosystem goods and services such as timber and bioenergy production, carbon sequestration, and habitat provisioning [
1].
In order to better manage multiple service forests, it is essential to improve the ability to predict their dynamics. In standard forest inventories, diameter at breast height (DBH) and tree height (TH) are measured manually, and tree volumes are calculated from these data using allometric equations [
2]. For this allometric approach, the quality and quantity of the calibration data is crucial. In some regions the underlying data basis is very good for monospecific stands with even-aged trees, whereas forest stands that are structurally complex and diverse in species composition are much less well documented [
3,
4]. In these stands, individual trees display a large variation in shape and structure due to mixing effects, which may lead to substantial uncertainties when allometries obtained from uniform stands are applied [
5,
6]. Furthermore, allometric equations usually consider the trunk as the economically relevant aboveground woody component, but rarely branches. However, branch growth and development reflects tree growth responses to both biotic and abiotic environmental factors. Finally, the distribution of wood volume in the canopy cannot be calculated using allometric equations. Branch properties, tree crown structure, and canopy space filling are key characteristics in understanding light-use efficiency and tree-tree interactions [
7,
8], and thus the dynamics in multiple service forests. To obtain this information by direct field measurement is, however, challenging and time-consuming, and therefore costly [
9].
In recent years, high-resolution inventory tools have been developed and are increasingly being used to acquire individual tree data. Of these, LiDAR (Light Detection And Ranging) and especially terrestrial laser scanning (TLS) have been applied to analyze standard tree dendrometrics such as stem position, tree density, DBH, TH, basal area, and wood volume [
10,
11,
12,
13]. For example, Hopkinson
et al. [
10] estimated DBH and TH based on TLS data, but still relied on standard allometric equations for wood volume estimates. Moreover, several authors [
14,
15,
16,
17] have developed and deployed methods to estimate wood volume based solely on TLS data.
These methods can be classified as voxel-based approaches and geometric model approaches. Voxel-based approaches address TLS points within a three dimensional (3D) voxel-grid. A voxel represents a cube with a unique position, edge length, and volume. If a voxel is occupied by points, the voxel will be used for volume estimation and wood volume is calculated by the summation of voxel volumes over all occupied (assigned) voxels [
16,
18,
19], or is correlated with the total number of occupied voxels [
14]. Because only the outer form or surface of an object can be obtained by TLS, the accuracy of this method will essentially increase by identifying and adding non-occupied, empty voxels inside the tree's structure. If these inner voxels are not included, they will not contribute to the total volume calculation, resulting in a substantial underestimation [
18,
19,
20]. Alternatively, other approaches depend on geometric feature recognition within segments of the TLS points. Potentially representing a more natural model of the curved surface of the trunk and branches, cylinders are fitted within segments [
21] and their volumes are summed for volume estimations [
15,
17,
22,
23,
24,
25].
The accuracy of the voxel-based approach is largely determined by the chosen voxel size [
16,
18]. A small voxel size will tend to underestimate volumes due to missing structural information. Larger voxel sizes will lead to an overestimation due to an increase of additional artificial cuboid structures around the natural surface of the tree. However, geometrical approaches also generate inaccuracies. Specific thresholds in the process of branch identification and in the reconstruction, especially of small branches, will lead to underestimations. Primarily depending on the experimental setting (scan resolution, scan positions, distances), the minimum diameters in branch detection and volume estimation range from 5 mm [
26] over approximately 1 cm [
27], 2 cm [
22,
28] and 4 cm [
28] up to 7 cm [
15].
All approaches have in common, however, that the accuracy of volume estimates depends on the primary quality of the point cloud representing the tree. Firstly, the scan resolution and the number of scan positions directly influences the point density and therefore the accuracy in capturing the structure of the (nearly complete) tree [
29]. Secondly, post-processing of the point cloud by point cloud filtering to remove noise or ghost points may introduce inaccuracies if correct data points are wrongly removed. Thirdly, movements of target trees during the scan process as well as an imprecise registration process will lead to inaccuracies in the reconstruction of the tree structure and surface. In addition, fourthly, stand density and structural complexity, as well as the height of individual trees, directly influence the extent of occlusions and therefore the number of insufficiently captured structures within each scan.
The main objective of our study was to evaluate the accuracy of wood volume estimates as a function of the structural complexity of the scanned object. The structural complexity is different for different tree compartments (
i.e., the trunk and the branches), but also differs between tree species due to species-specific differences in tree architecture, predominantly characterized by the crown morphology and, thus, by the branch structures. Therefore, we separated the tree compartments’ trunk and branches and we selected three tree species that are very common and ecologically important in central Europe, but which differ considerably with regard to their architectural complexity:
Acer pseudoplatanus (sycamore maple: simple),
Sorbus aucuparia (rowan: intermediate),
Betula pendula (European white birch: complex; these species are henceforth referred to as
Acer,
Sorbus and
Betula). In order to keep all other influencing factors constant, we used an experimental setting under ideal field conditions with uniform scan data acquisition and post-processing procedures. We selected young trees because the differences in tree architecture are most significant in young and middle-aged stands [
8] and because the relative proportion of small branches to the total tree volume is highest.
For our study, we used a voxel-based approach in combination with a bounding box method for outer voxels, as published by Bienert
et al. [
16]. Compared to simple voxels (cubes) the bounding box method offers a closer fit of adapted cuboid bodies (bounding boxes) at the surface of the tree to reduce overestimations and to fully reveal species-dependent amounts of structural gaps due to occlusions. The accuracy of voxel-based volume estimates was validated against direct xylometric measurements. To our knowledge, this is the first study to analyze the accuracy of voxel-based volume estimates for different tree compartments of species with different tree architectural complexity. Specifically, we hypothesized that:
(H1) Volume estimates for trunks are more precise than those for branches due to differences in size, orientation and extent of occlusion.
(H2) Accuracy of volume estimation decreases in the order Acer > Sorbus > Betula due to differences in tree architectural complexity (low: Acer, high: Betula) and the extent of occlusions by branches (low: Acer, high: Betula).
2. Methods
2.1. Study Site and Target Trees
The study site Enzen forest is located near Stadthagen in the lowlands of Lower Saxony (52° 19.279 N, 9° 9.851 E, altitude 80 m above sea level). The climate is sub-Atlantic with a mean annual precipitation of 723 mm and a mean annual temperature of 8.9 °C. The dominant soil type is Pseudogley-Parabraunerde. The current forest vegetation is meso- to eutrophic sub-Atlantic oak-hornbeam mixed forest (Stellario-Carpinetum; NATURA 2000 Code: 9160).
The forest stand used for this study covers an area of about 5 ha. The overstory is dominated by the tree species Quercus robur, Carpinus betulus, Fagus sylvatica, Larix decidua and Acer. The understory is very species-rich, with all overstory tree species being present (except for Quercus robur), as well as other species, consisting primarily of Betula, Sorbus, Taxus baccata, Prunus avium, Fraxinus excelsior, Corylus avellana, Crataegus spec. and Ilex aquifolium. The overstory had a mean basal area of 20.0 m2 ha−1 and a mean density of 110 stems ha−1. The mean density of the understory was 2500 stems ha−1, and the maximum tree height was about 8 m.
We selected six individual young trees from each of the three species
Acer,
Sorbus and
Betula i.e., a total of 18 target trees. The selection criteria were: only understory trees, and tree height within the range of five to eight meters. The target trees were located in one group each in the case of
Acer and
Betula (patch size about 8 m
2 each), and in two distinct groups in the case of
Sorbus (patch size about 3 m
2 each).
Table 1 gives a descriptive overview of the 18 target trees. Tree age was analyzed by counting the tree rings of stem discs from the stem base under a binocular microscope. Diameter at the stem base (ground diameter, GD) and DBH were measured with a diameter tape at 0.1 cm intervals. TH was measured with a measuring tape as the length of the chopped trunk.
Table 1.
Descriptive statistics for the 18 target trees: tree age (Age), ground diameter (GD), diameter at breast height (DBH) and total tree height (TH).
Table 1.
Descriptive statistics for the 18 target trees: tree age (Age), ground diameter (GD), diameter at breast height (DBH) and total tree height (TH).
| Species | No | Age (year) | GD (cm) | DBH (cm) | TH (m) |
|---|
| Acer | 1 | 15 | 4.2 | 2.8 | 5.28 |
| 2 | 14 | 3.8 | 2.8 | 5.70 |
| 3 | 16 | 3.8 | 3.2 | 6.75 |
| 4 | 16 | 4.0 | 3.0 | 5.93 |
| 5 | 14 | 4.4 | 3.5 | 6.50 |
| 6 | 16 | 3.6 | 2.5 | 5.52 |
| mean | 15.2 | 4.0 | 3.0 | 5.95 |
| Sorbus | 1 | 12 | 5.2 | 4.5 | 7.96 |
| 2 | 12 | 5.0 | 4.3 | 6.80 |
| 3 | 12 | 4.8 | 3.9 | 6.27 |
| 4 | 11 | 5.0 | 4.0 | 6.92 |
| 5 | 11 | 4.0 | 3.3 | 7.50 |
| 6 | 11 | 3.5 | 2.9 | 7.02 |
| mean | 11.5 | 4.6 | 3.8 | 7.08 |
| Betula | 1 | 10 | 5.3 | 3.6 | 6.68 |
| 2 | 10 | 6.3 | 4.5 | 7.35 |
| 3 | 10 | 3.8 | 3.1 | 6.76 |
| 4 | 10 | 6.5 | 4.6 | 6.99 |
| 5 | 10 | 4.7 | 3.5 | 5.76 |
| 6 | 10 | 3.8 | 2.8 | 6.53 |
| mean | 10.0 | 5.1 | 3.7 | 6.68 |
The age range of the target trees was 10 to 16 years, with Betula having the lowest mean age (10.0 years) and Acer having the highest mean age (15.2 years; Sorbus: 11.5 years). The GD and DBH ranges were 3.5 to 5.2 cm and 2.5 to 4.6 cm, respectively, and tree heights varied between 5.3 and 8.0 m. Acer had both the lowest mean GD and the lowest TH, whereas these mean values were very similar for Betula and Sorbus.
2.2. Scan Data Acquisition
All data was recorded within two days in December 2013 under leaf-off conditions for the deciduous trees and nearly windless conditions. The scans were performed with a phase-shift FARO Laser Scanner Photon 120 (FARO Technologies Inc., Lake Mary, FL, USA). Details of technical specifications and experimental settings for the scan procedure are presented in
Table 2.
Table 2.
Technical specification and experimental settings of the FARO LS Photon 120.
Table 2.
Technical specification and experimental settings of the FARO LS Photon 120.
| FARO LS Photon 120 | Hardware Specifications | Experimental Settings |
|---|
| Measurement range | 0.6–120 m |
| Ranging error | ±2 mm (at 10 m) |
| Beam diameter | 3 mm at exit, 4 mm at 3 m |
| Field-of-view (V × H) | Up to 310° × 360° | 310° × 70° |
| Angular step size (V, H) | Up to 0.009° | 0.036° |
| Spatial resolution | Up to 2 mm (at 15 m) | 1.9/2.5/3.1/3.8 mm (at 3/4/5/6 m) |
| Data acquisition rate (X-Control) | Up to 976,000 points/sec. | 244,000 points/sec. (3×) |
| Scan time | 1:50 min |
| Filter Clear-Sky/Clear-Contour | active/active |
| Instrument height | 1.3 m |
| Number of scanning positions | 4 |
| Distance between laser scan positions and mounted tree | 3 m |
Our aim was to conduct the scanning under field conditions (
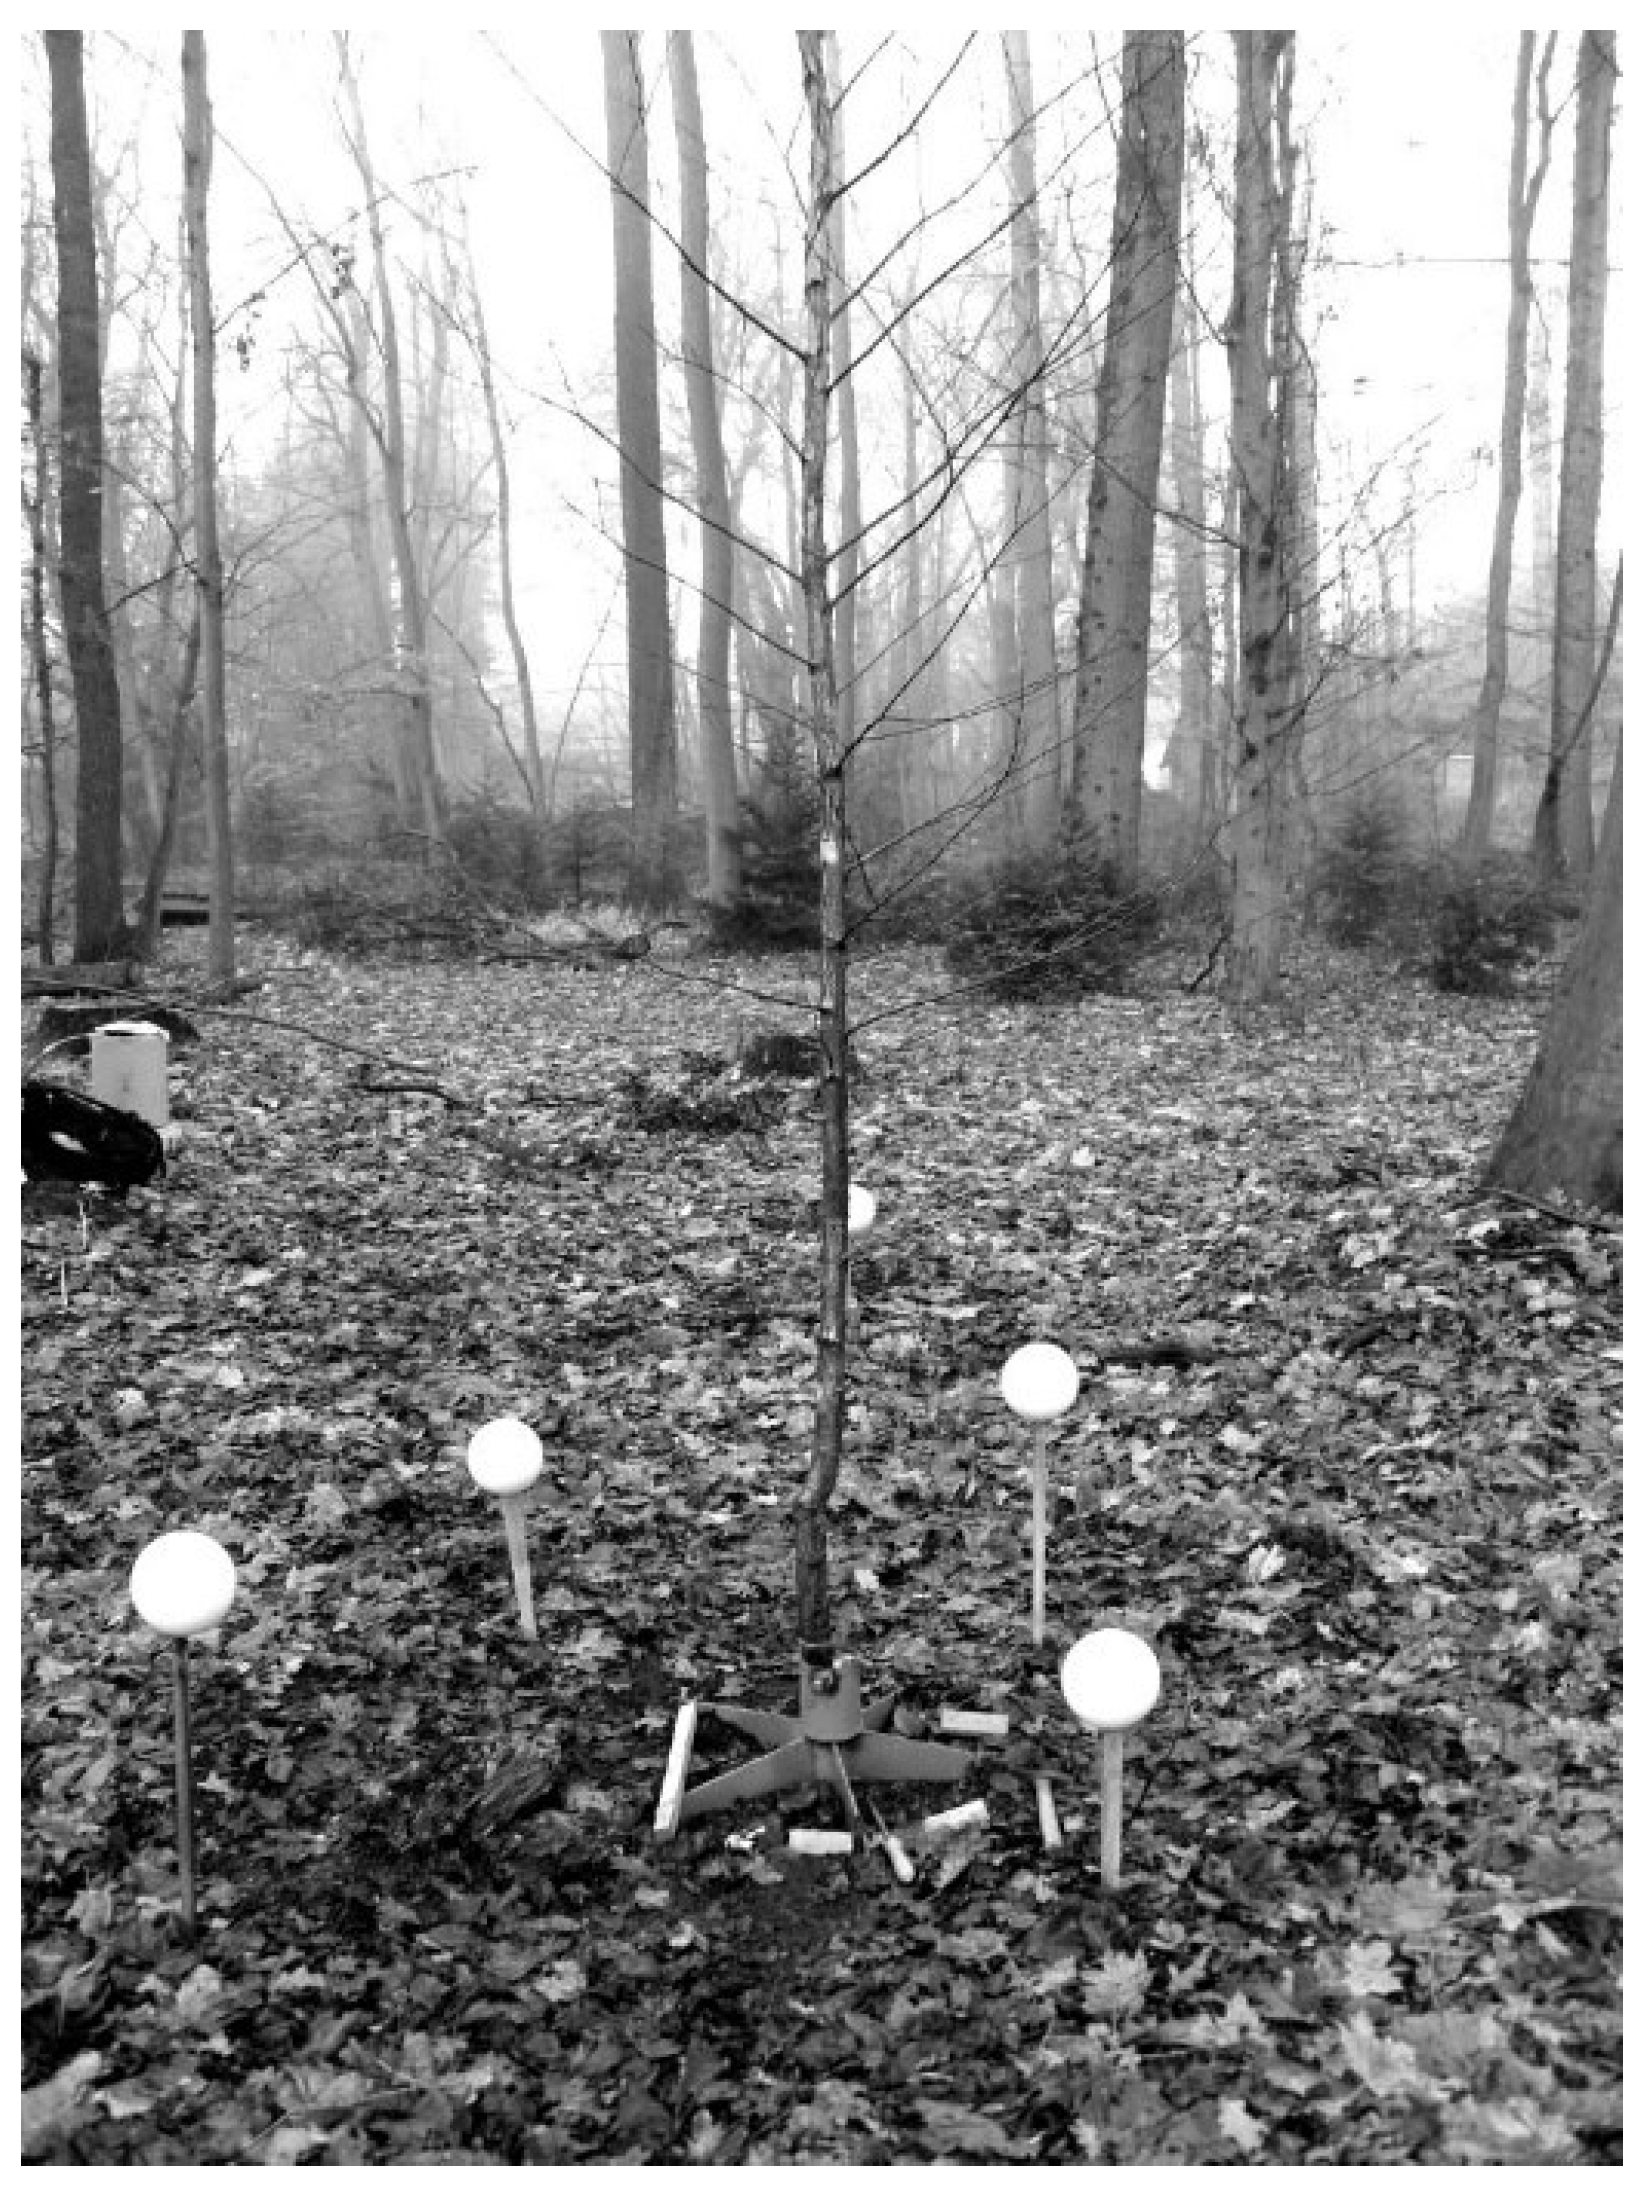
i.e., existence of a tree overstory, ambient temperature, humidity, and air movements), but at the same time to strictly control the conditions of the scanning procedure with regard to: (i) avoidance of any occlusion of the target trees by neighboring trees or ground vegetation; (ii) standardized set-up of the position of the laser scanner and the scan tie points (registration spheres). To achieve these aims each target tree was sawn off with a hand saw at ground level, transported over a distance of about 20 m to a forest patch with widely spaced overstory trees and missing understory, and fixed in a tree stand. The laser scanner was positioned on a tripod at a height of 1.3 m. Each isolated tree was scanned from four fixed positions (perpendicular to each other) at a distance of 3.0 m from the trunk. For the registration process four polystyrene spheres (radius: 14.5 cm) each were placed inside and outside the scan area, respectively (
Figure 1).
Figure 1.
Tree no. 1 of Betula mounted on a stand. The four reference spheres inside the scan area can be clearly seen in the foreground, and one of the four reference spheres outside the scan area is visible behind the trunk.
Figure 1.
Tree no. 1 of Betula mounted on a stand. The four reference spheres inside the scan area can be clearly seen in the foreground, and one of the four reference spheres outside the scan area is visible behind the trunk.
2.3. Scan Data Registration and Post-Processing
During the scan process, FARO LS built-in hardware filters
Clear-Contour and
Clear-Sky were applied to the recorded data. The filter
Clear-Contour removed incorrect measurements when a laser beam was reflected twice when hitting two different surfaces. The filter
Clear-Sky removed incorrect point results when scanning the sky and did not hit any scan object at all [
30].
For each tree, raw scan data from all four scan positions were registered in the FARO LS associated software FARO Scene (FARO Technologies Inc., Version 5.0.1, Lake Mary, FL, USA, 2012). Before registration a predefined standard filter for point cloud optimization was applied for each individual scan. This standard filter algorithm is based on specific stray point filtering in combination with a minimal threshold in intensity of the reflected laser pulse. Registration was performed automatically by FARO Scene using the reference spheres. With the registration process, the point clouds obtained by the four laser scanner positions were transformed into a common project coordinate system.
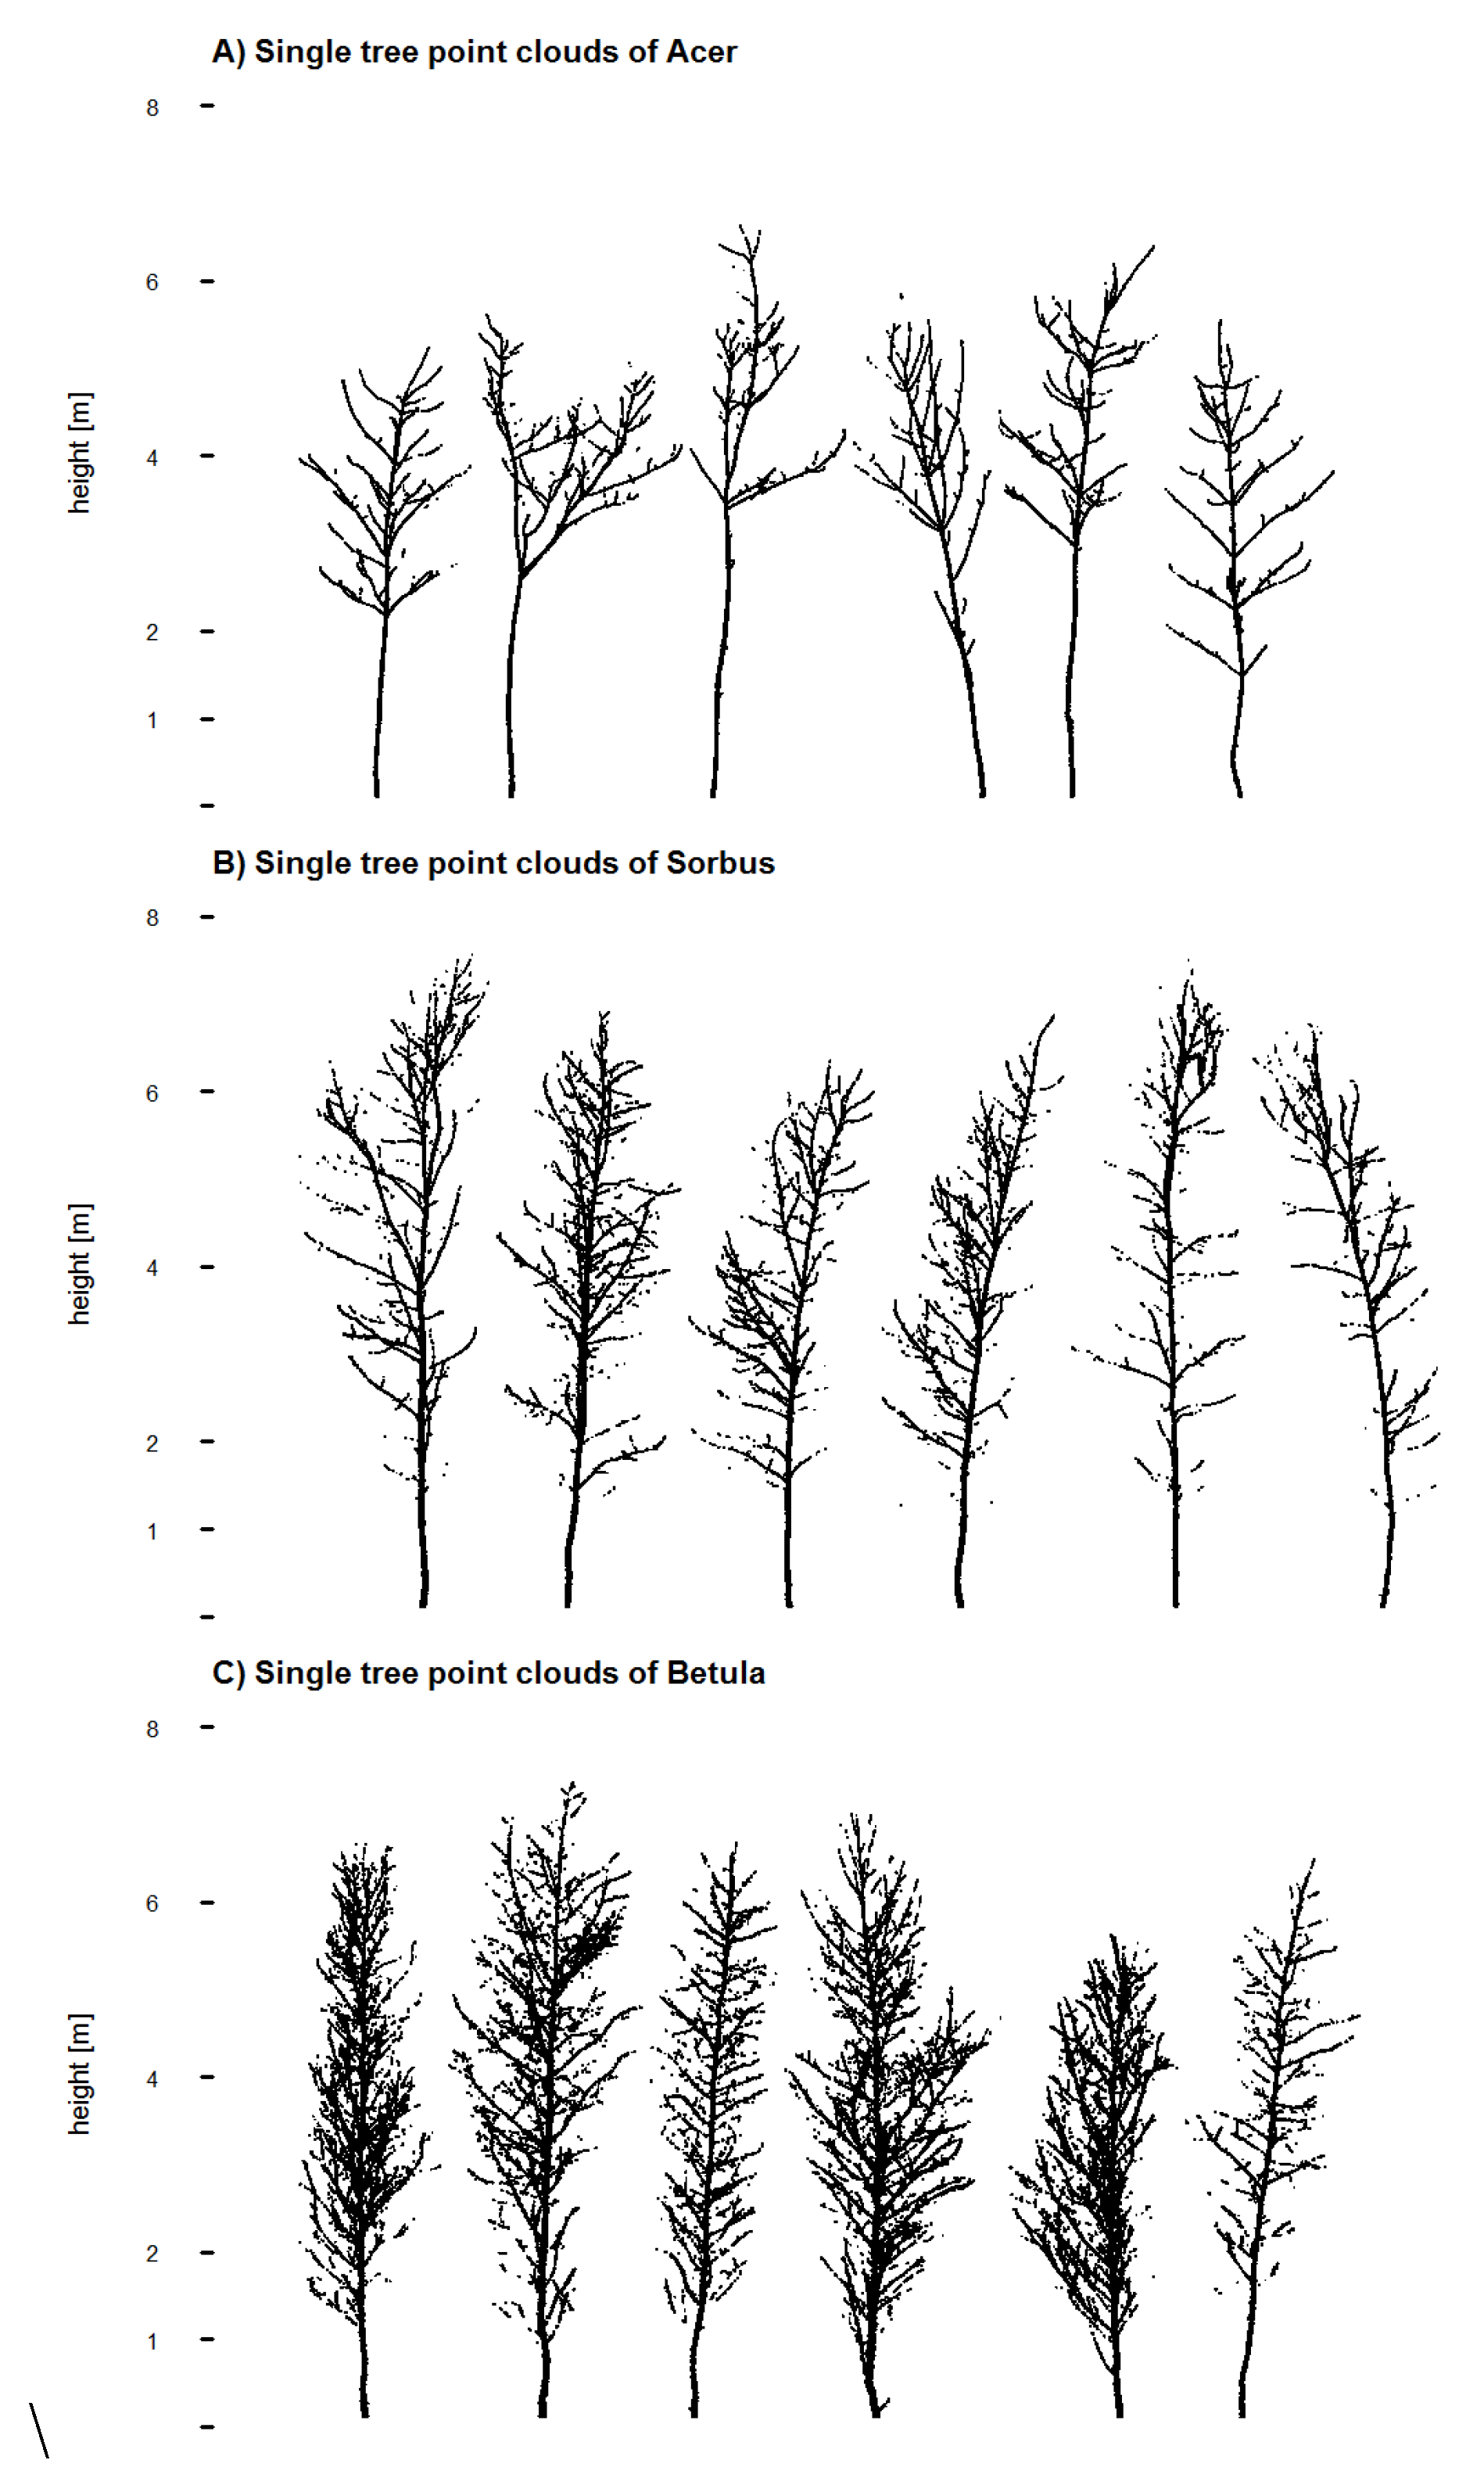
From the registered point cloud data, each tree was extracted manually as a single tree point cloud (
Figure 2) using the software CloudCompare (CloudCompare, Version 2.5.4, Paris, France, 2014). A copy of the tree’s point cloud was additionally split into two separate point clouds consisting of the trunk, and all the branches, respectively. Each of these point cloud objects (
i.e., total tree, trunk and branches) was post-processed by a statistical outlier remover filter plugin (qPCL) within CloudCompare to remove residual noise and ghost points. The cleaning filter analyzes 10 neighboring points and their distances. Points with a distance larger than one standard deviation plus the mean distance to the query point are marked as outliers and removed.
Figure 2.
2D images of all filtered single tree point clouds for (A) Acer; (B) Sorbus and (C) Betula.
Figure 2.
2D images of all filtered single tree point clouds for (A) Acer; (B) Sorbus and (C) Betula.
2.4. Architectural Complexity—Tree Characteristics
Different measurements and analyses of branch and crown variables were carried out on the target trees to quantify differences in the architectural complexity between the tree species in detail.
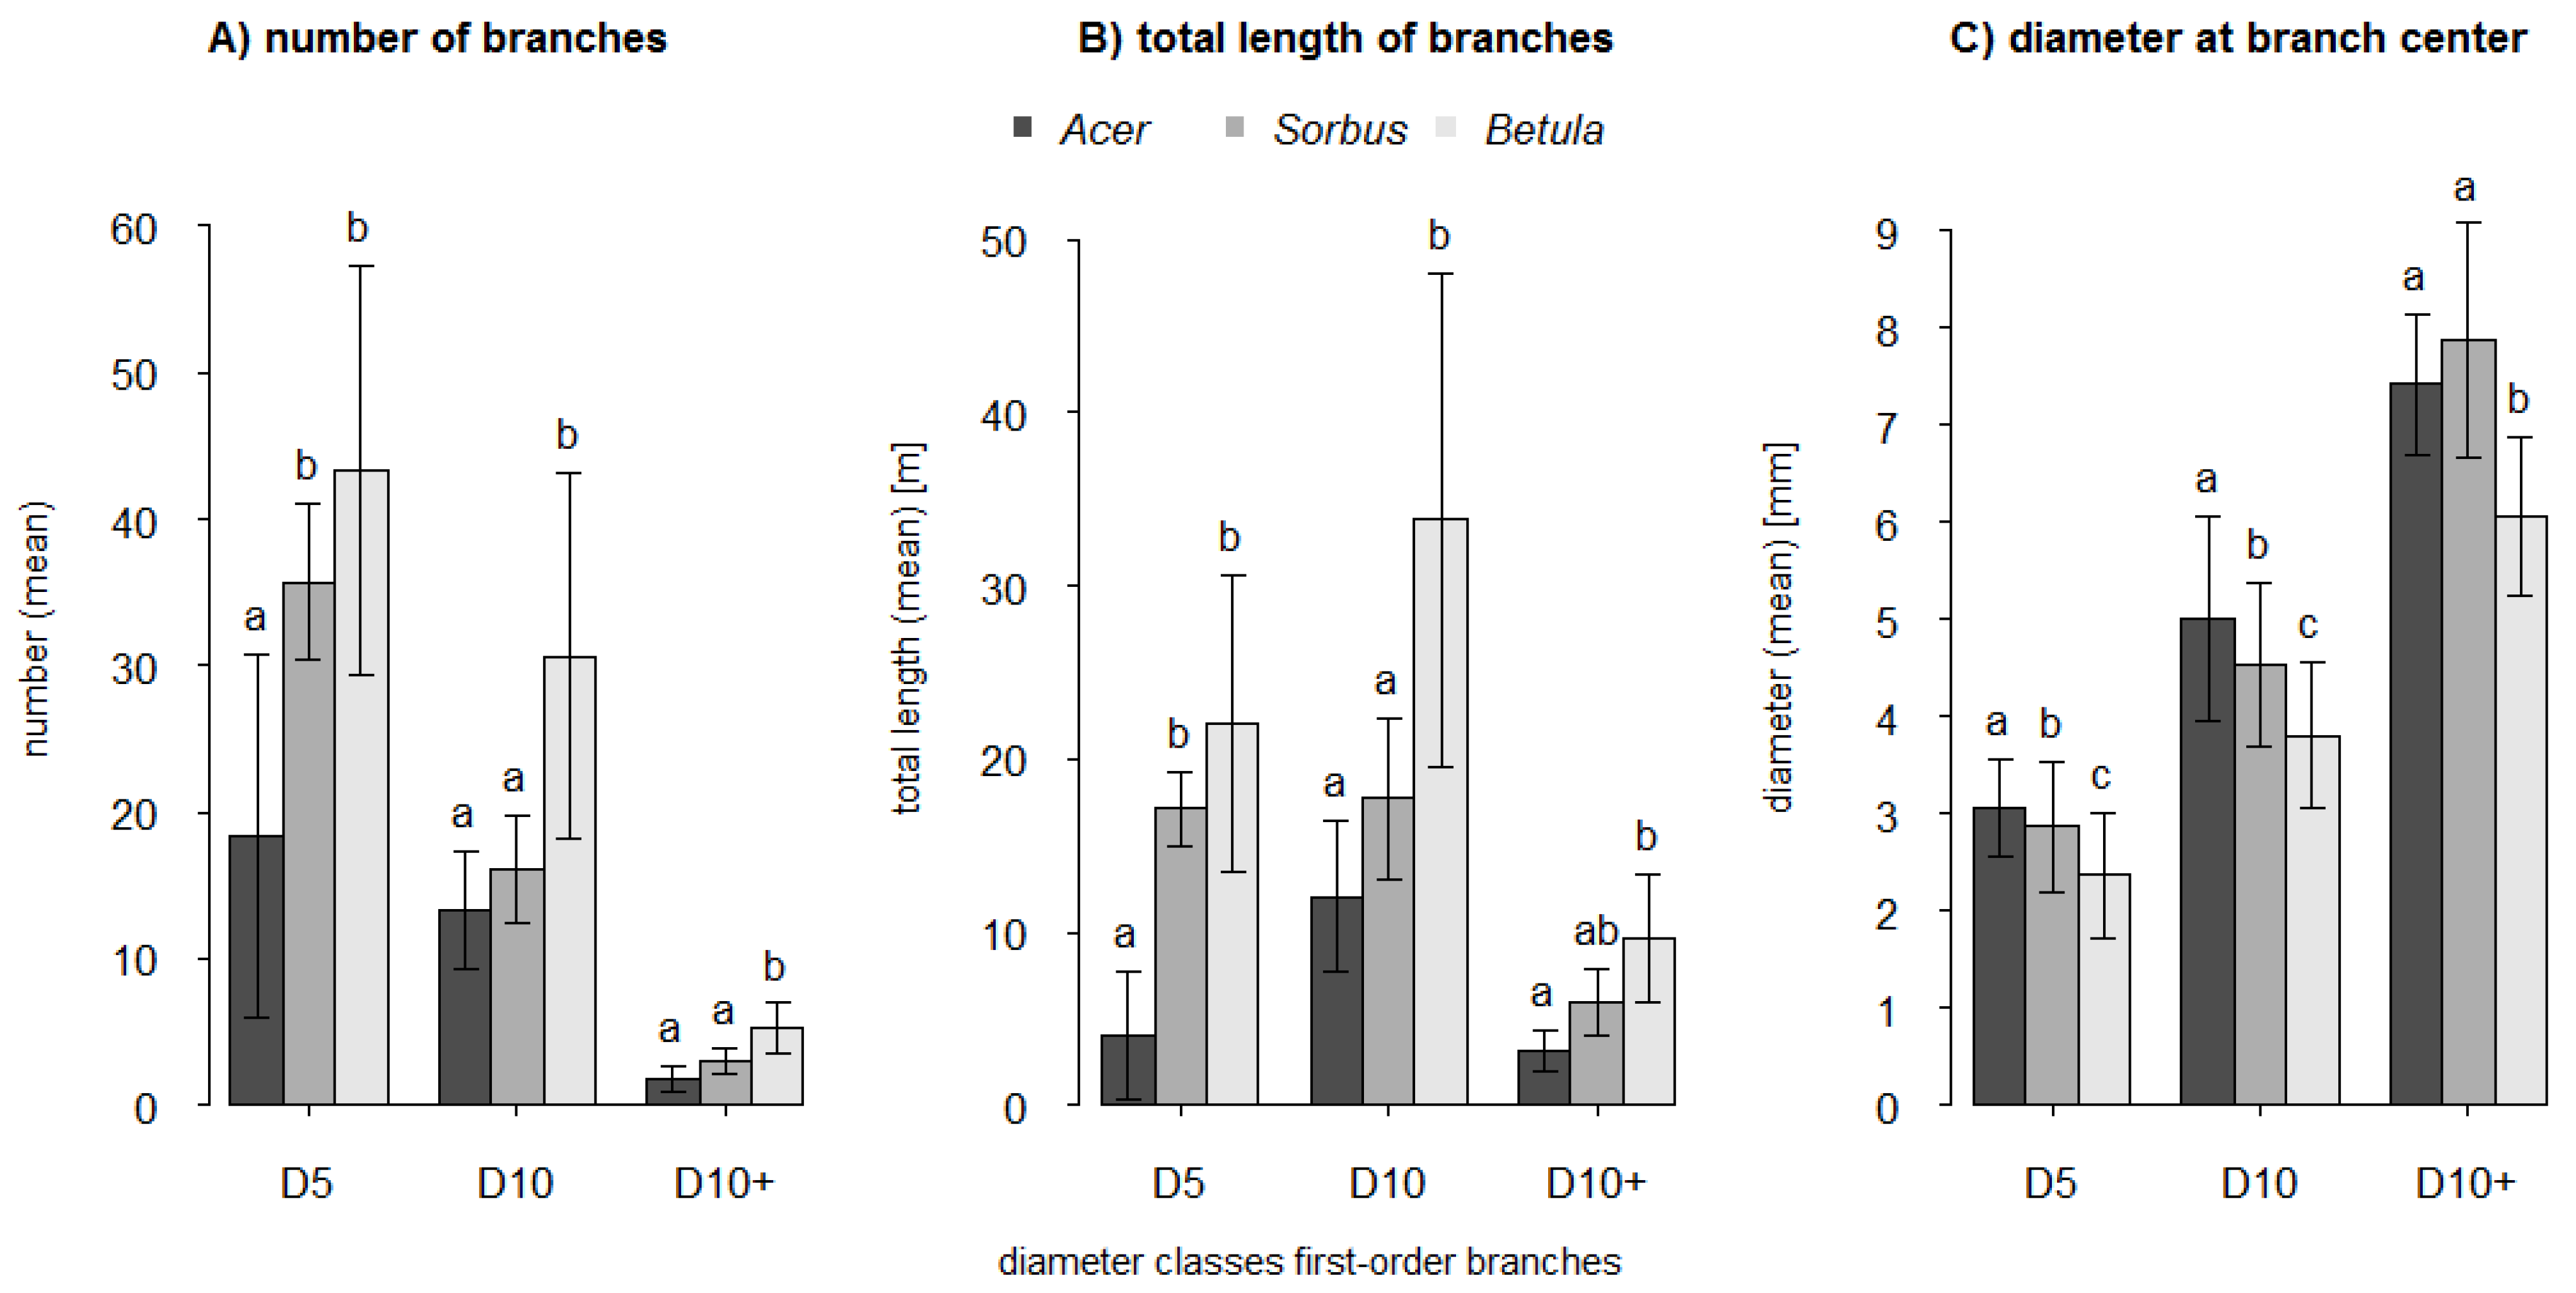
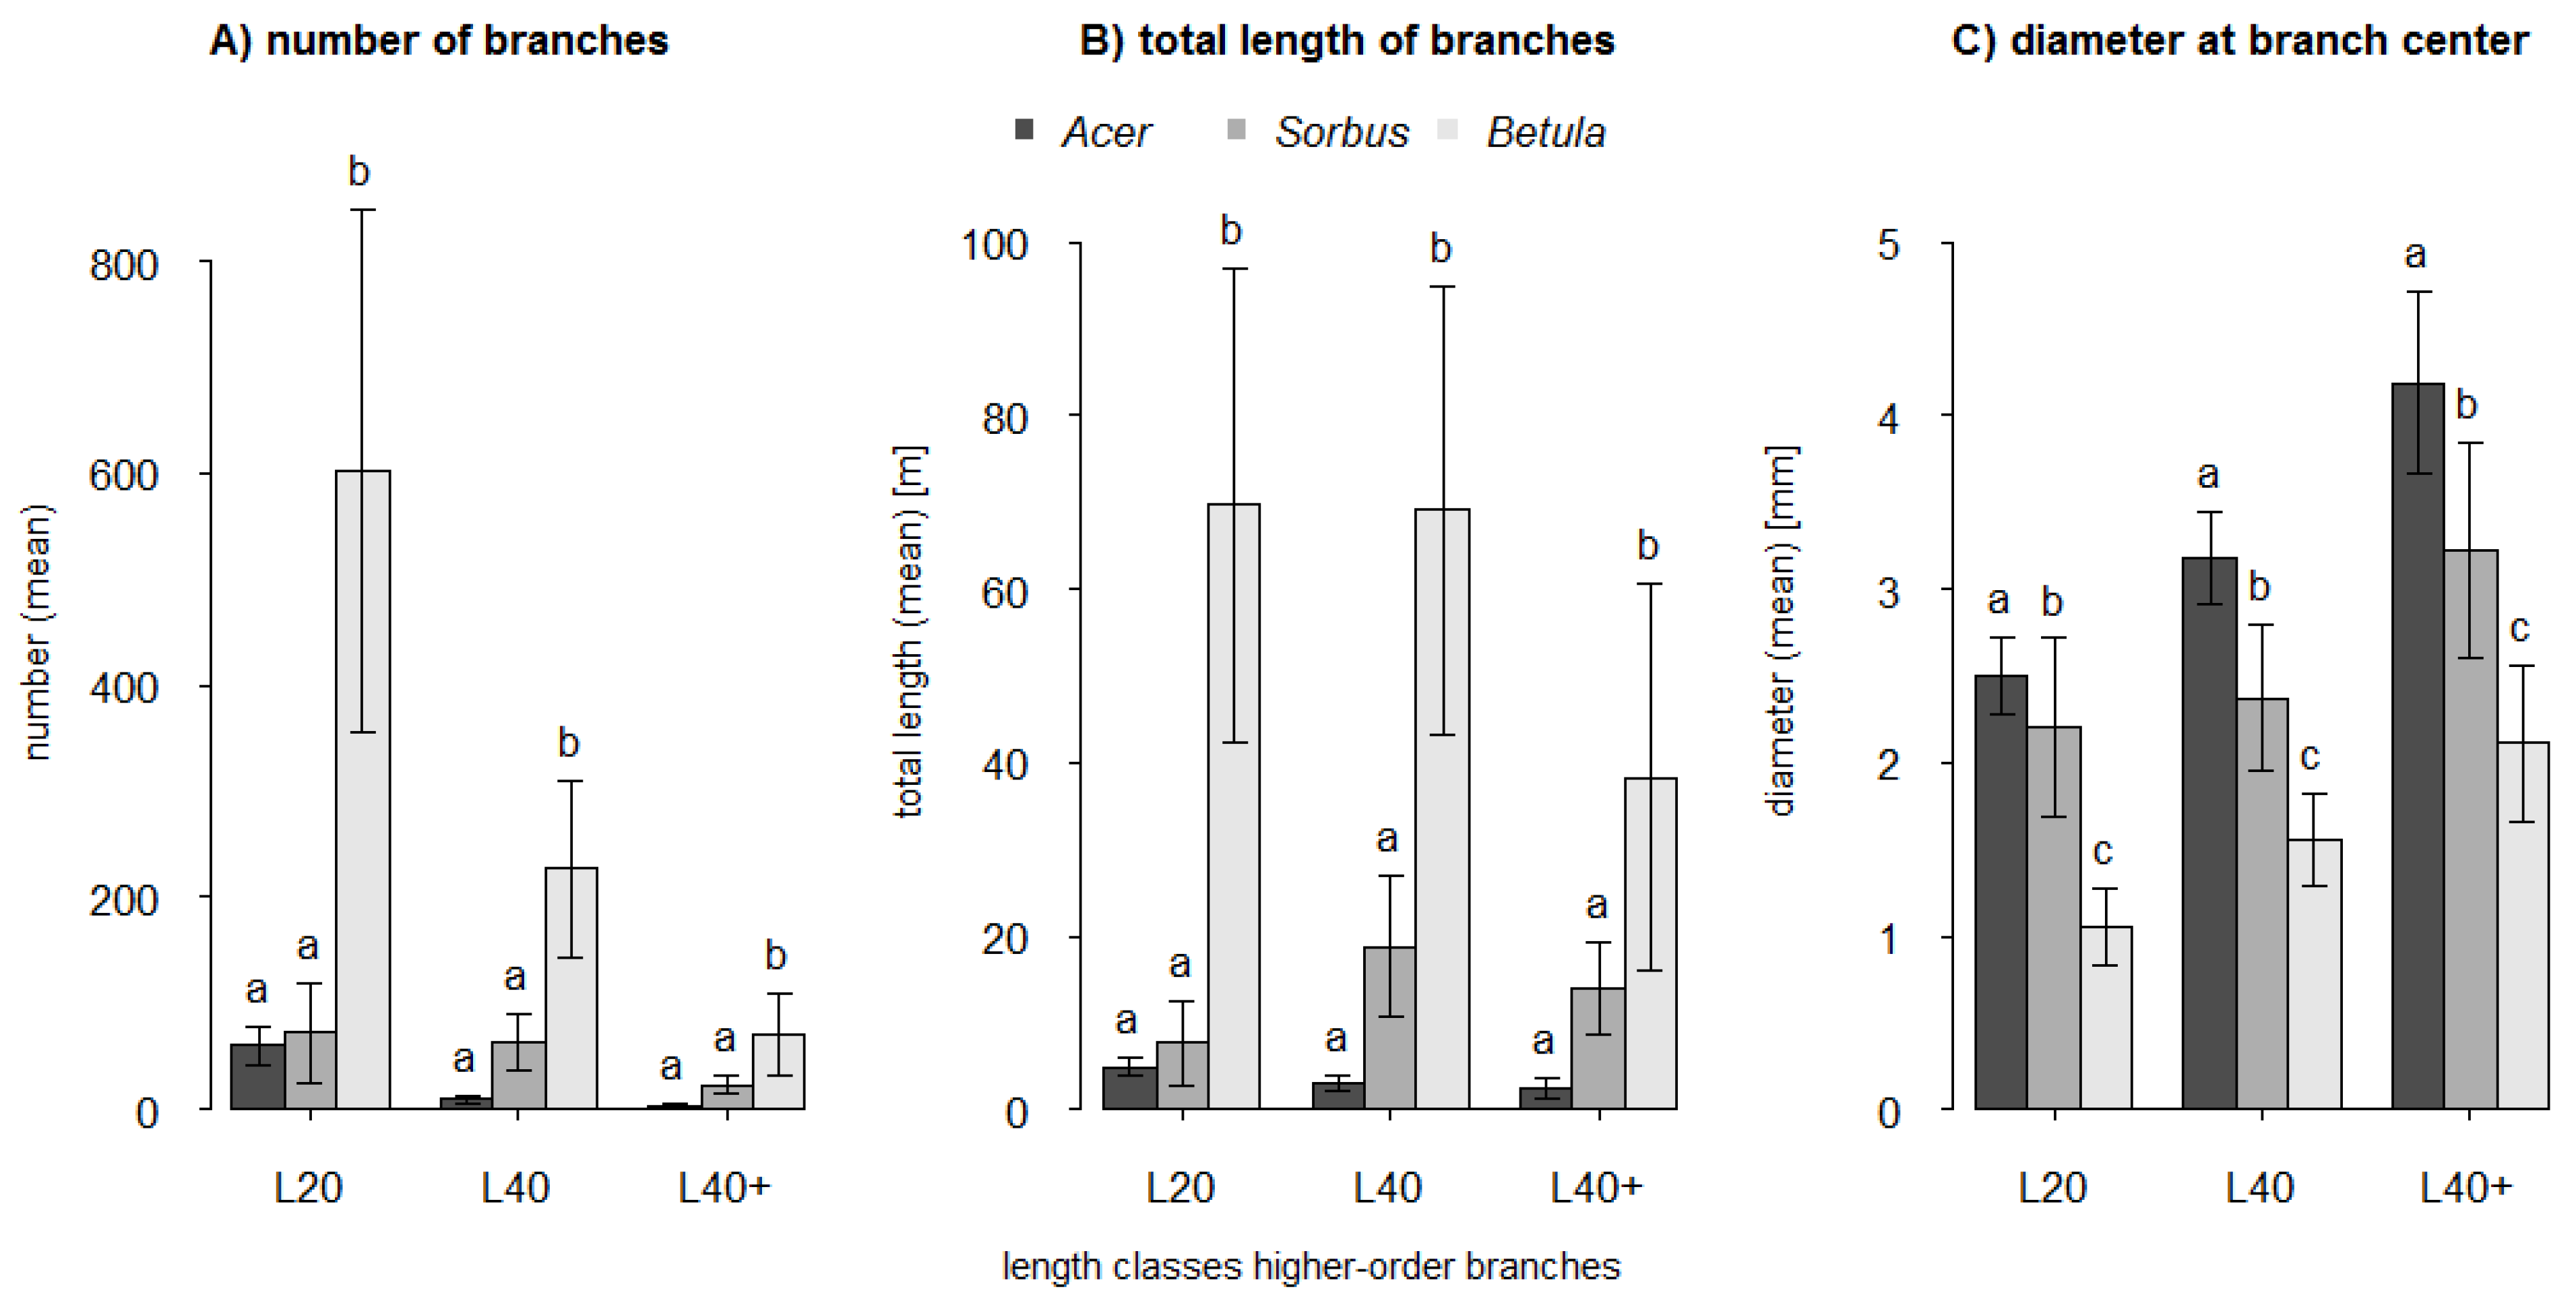
For the determination of branch variables and for the xylometric measurements (see below) the target trees were destructively divided into different compartments directly after the scan process. The first division was into trunk and branches. At branch level we differentiated between branch orders. The first branching away from the main axis is the first-order branch. The branching from the first-order branch results in a second-order branch, and so forth. For all branches and all order levels the length (BLen, in cm) and the diameter at branch center (BDia, in mm) were measured.
Depending on the branch order level all branches were categorized into either diameter classes (first-order branches) or length classes (all higher-order branches). The first-order branches were assigned to three classes with a diameter (D) at branch collar of D ≤ 5 mm (D5), 5 mm < D ≤ 10 mm (D10) and D > 10 mm (D10+). Higher-order branches were categorized in three length (L) classes with L ≤ 20 cm (L20), 20 cm < L ≤ 40 cm (L40) and L > 40 cm (L40+). The number of branches (BNum) was counted for each diameter class (first-order branches) and each length class (all higher-order branches).
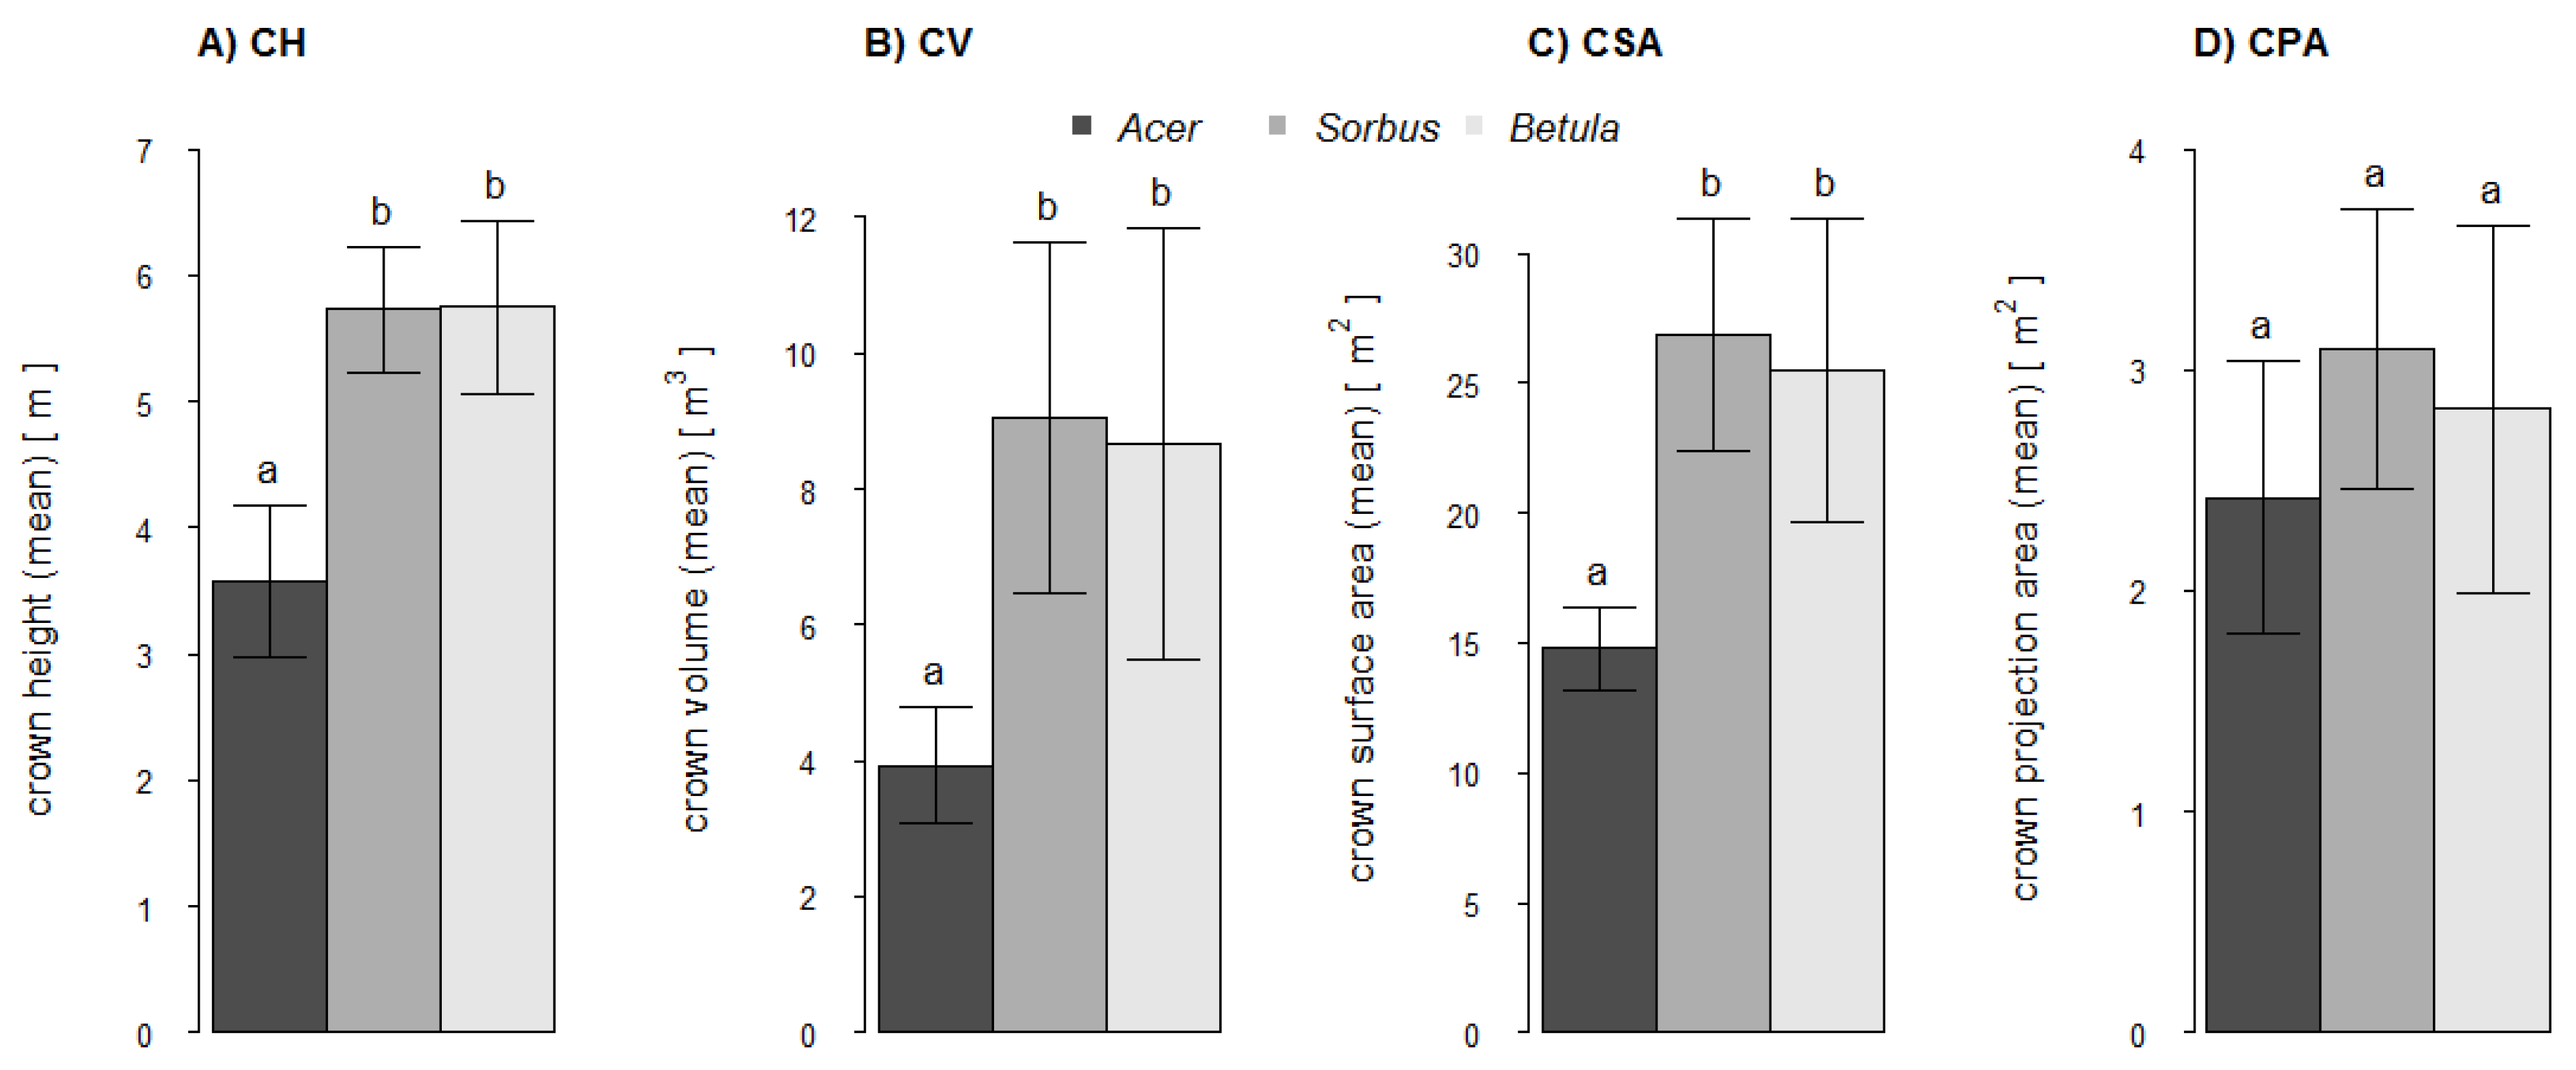
Based on the point clouds, four crown-related structural complexity variables were also calculated. These were: Crown height (CH) as the difference in height along the Z-axis between the starting point of the lowest first-order branch and the highest tree point; crown volume (CV) as the volume of a 3D convex hull of the crown; crown surface area (CSA) as the surface area of the 3D convex hull of the crown; and crown projection area (CPA) as the area of the 2D convex hull of all crown points projected in the xy-plane.
2.5. Volume Estimations
2.5.1. Xylometric Measurements
For the xylometric measurements all trunks were cut into sections of 65 cm in length so that they fit into the water container. Branches were measured in bundles of classes consisting of the branch order levels first-order branches or higher-order branches. Each trunk segment or branch bundle was fully submerged in a specifically constructed cylindrical water container (
Figure 3). The displaced and collected water was weighted and the equivalent water volume was calculated and assigned to each compartment. The xylometric volumes were determined directly after the scan process so that no reduction in wood volume should have occurred. As the period of submergence of each object was very short, the impact of water permeation into the wood was negligible.
Figure 3.
Medium-sized xylometer with a diameter of about 12 cm and overflow height of about 90 cm.
Figure 3.
Medium-sized xylometer with a diameter of about 12 cm and overflow height of about 90 cm.
2.5.2. Voxel-Based Analyses
Volume estimates from the point clouds of total tree, trunk, and branches were obtained by an extended version of the voxel-based method published by Bienert
et al. [
16]. All points from the filtered point cloud data are allocated to their individual voxel within the defined voxel-grid of 5 mm. Based on these occupied voxels, non-occupied empty voxel inside larger tree segments (shadow voxels) are identified similar to the method of Hosoi
et al. [
19]. To minimize overestimations the volume of the outer hull voxels is adjusted to the actual point distribution within each voxel by a determined axis-parallel bounding box. To close gaps between all neighboring bounding boxes and inner shadow voxels, the bounding boxes have to be expanded to the border of a neighboring shadow or bounding box voxel. This method provided two vital advantages: (1) the consideration of empty voxels inside tree structures (especially inside the trunk) for volume estimations and (2) a reduction of overestimation due to a closer outer surface fit thanks to the creation of smaller bounding boxes within each voxel.
To compare the influence of species-specific architectural complexity to the accuracy of volume estimations, all point clouds were processed with the same voxel size. At a distance of three meters, the spatial scan resolution was 1.9 mm (
Table 2). At an overall mean tree height of about 6.6 m and a scanner height of 1.3 m we assumed a maximum distance between the laser scanner and branches at the top of the trees of about five to six meters. At a distance of six meters, the spatial scan resolution was 3.8 mm. In order to enclose at least two neighboring measurement points within one voxel we chose a voxel size of 5 mm. As most branches had a diameter at branch collar of less than 10 mm, a voxel size of 5 mm will probably not create many empty voxels inside branch structures. With the close fit of the bounding boxes to the surface of the point cloud structures, we expected an underestimation in volume estimations due to missing structural information caused by occupations or the filter algorithm.
2.6. Data Analyses
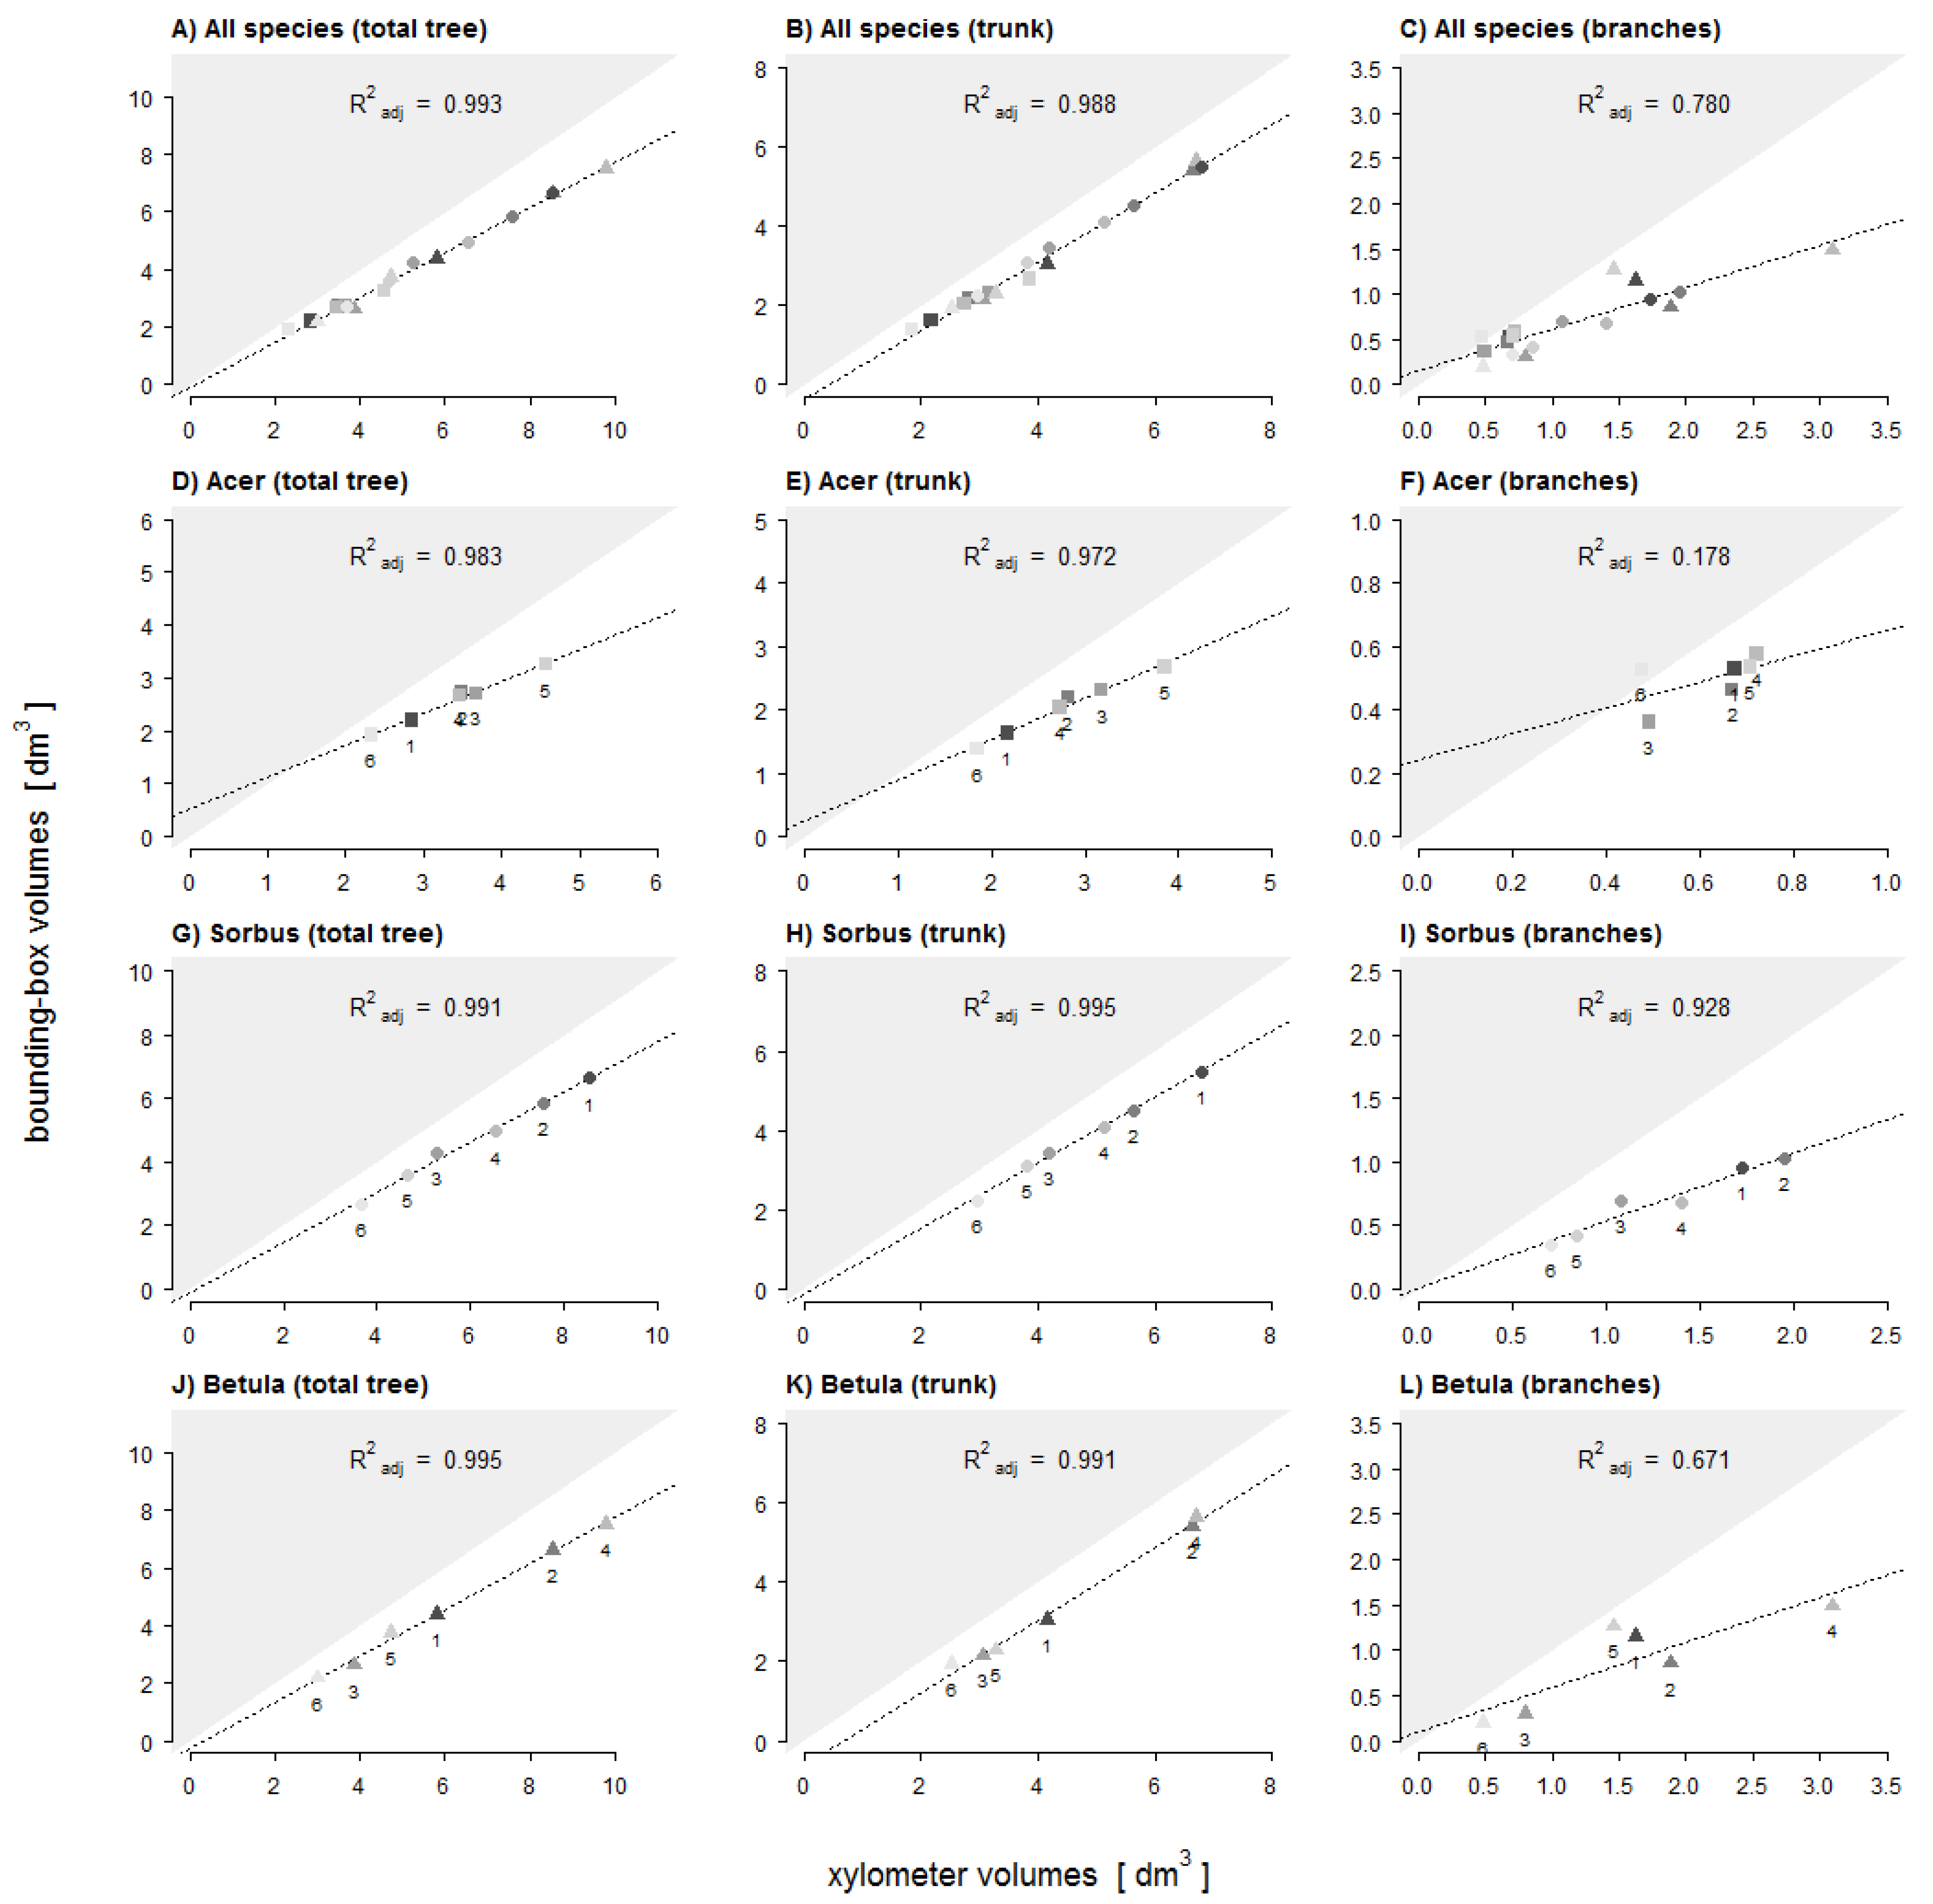
We tested for significant differences in architectural complexity variables between the tree species using one-way ANOVA. To test our hypotheses we assumed a linear relationship between volumes estimated by TLS and xylometric measurements. For each point cloud (total tree, trunk, and branches) we calculated adjusted
R2 (
R2adj) values of a linear regression for all species and for each species separately. The differences in volume determination from xylometric measurements and from voxel-based estimations were expressed as absolute and relative differences. One-way ANOVA was used to test for relative differences in volume estimates among tree species. In order to investigate the influence of architectural complexity variables on the relative differences in volume estimates, a stepwise multiple regression was performed for every point cloud (total tree, trunk, and branches). All statistical analyses were performed using the software R [
31].
4. Discussion
Overall, the extended voxel-based algorithm with bounding boxes provided highly congruent volume estimates based on TLS point clouds when compared to the direct volume determination. Results attested that we used a reliable method for wood volume estimation. As assumed, the chosen voxel-size of 5 mm generated underestimations for all tree point clouds.
In our study, we experimentally excluded the occlusion of the target tree by external structures and standardized scan positions for data recording. In addition, we tried to control wind impact by scanning under nearly windless conditions. Nevertheless, visual inspection of the tree point clouds revealed some significant structural inaccuracies within the crown, probably due to global registration errors which affect volume estimates by locally expanding tree segments. Ultimately, we identified two possible reasons. Although we placed a total of eight reference spheres (four inner and four outer spheres) around each target tree, we could only use up to four spheres to register the scans. To achieve a shorter scan duration we reduced the scanner’s horizontal field-of-view to 70° (
cf. Table 2) and therefore only the inner four spheres and one outer sphere on the opposite site of the scanner were captured within each scan. Additionally, the spheres were positioned mainly near the ground. A larger variation in distances and vertical positioning among the spheres would probably have helped to reduce registration errors. To enhance the quality of globally registered tree stands, Bucksch and Khoshelham [
32] presented a skeleton-based re-registration routine applied to point cloud data of single scans to optimize registration of segments such as branches of individual trees. A comparable approach but on stand level was presented by Bienert and Maas [
33] who used the vertical axis of scanned trees to enhance registration quality.
Furthermore, voxels occupied by noise or ghost points originating from measurement errors would lead to overestimations [
16]. Point cloud filter could remove a large proportion of these measurement errors, but most likely there will always be a loss of structural information. If correct measurement points from insufficiently recorded parts of the tree are removed, the amount of underestimation could increase, especially when the fraction of small branches is high. When working with imperfect and unorganized raw point cloud data (without topological information on the trunk and branches), a filter algorithm is needed which prevents branch structures with low point densities from being removed. Although subjective and individual quality control in point cloud filtering is beneficial in preserving branch structures from being removed [
17,
28], processing hundreds of trees requires automated filtering processes. Skeletonization of raw point clouds and resultant topological tree models could preserve structural information and prevent low point densities from being removed or could even add structural information by closing gaps between disconnected branch segments [
22].
Finally, regarding the size of relative differences between real volume (derived by xylometric measurements) and bounding box volume estimations, the accuracy strongly depends on the selected voxel size. To reveal all kinds of structural inaccuracies during the scan process or rather to identify missing structural information due to occlusions, low point densities and point cloud filter, we applied a small voxel size to realize a bounding box model with a close fit to the surface of the TLS point cloud. From this initial small voxel size, increasing the voxel size will counteract underestimations by overestimation as larger bounding boxes add additional volumes with no corresponding structures of TLS points. A tipping point would be reached when underestimations are balanced by overestimations. Finding this individual tree-specific tipping point as determined by an individual voxel size seemed impossible, or at best barely feasible and will add a new source of inaccuracy.
As predicted by H1 we found that trunk volume estimates were more accurate than branch volume estimates. Trunks not only have larger diameters than branches, but they also differ in their main growth orientation. We assume that both issues contribute to more precise scan results for trunks compared to branches. Structures with a greater surface area will be better captured even with comparatively low scan resolutions. The vertical growth orientation of the trunks enabled an all-around scanning of the whole structure. The extent of occlusions in higher trunk fractions is small compared to that of inclined or horizontal branches located far above the laser scanner. Nevertheless, there will be blind spots inside a branch fork when branches are orientated in line with the trunk and laser beam. Also the relation between voxel-size and diameter of the trunk or branch segment affects the possible accuracy of the volume estimation. A larger diameter results in a shallower circular arc and a better fit of the cuboid lateral plane to the curved area of the surface. Multiple regression analysis showed that the relative differences (underestimations) of trunk volume estimates significantly decreased with increasing crown volume (CV: R2adj = 0.39). A larger crown volume indicates a larger tree size with a larger and better captured trunk. The relative differences of volume estimates for branches seemed to be primarily dependent on the number of first-order branches of the smallest diameter class D5 (≤5 mm) and the surface area of the crown (BNum (D5) + CSA: R2adj = 0.61). Compared to higher-order branches, first-order branches account for a relatively high fraction of total tree volume (~15%). However, first-order branches within the diameter class D5 are less well captured than larger first-order branches (D10, D10+). Branches with a diameter close to or smaller than the scan resolution are only captured and represented by a few points or even only by a line of single points. This also applies to the higher-order branches with even smaller diameters whose influence might be expressed by the crown surface area as the predictor variable. These branches contribute to a higher level of underestimation, certainly amplified after applying the point cloud filter.
With regard to total tree and trunk volume estimates, we could not confirm H2 because only very small (and not significant) differences between the three tree species were found. For total tree volume estimates all tree species showed very high
R2adj values (>0.98;
Figure 7D,G,J). As mean values of relative differences only differed within the small range of 2.1% we could not determine a clear accuracy ranking between the three species. Our results suggest that fewer but larger branches might lead to a similar or even greater extent of occlusions than a very high number of smaller branches. From the point of view of scan position, occlusions of the trunk by branches will be high if branch and trunk are congruent in their spatial growth orientation and also increases with increasing branch diameter. A second reason might be greater open contours on the trunk surface of
Acer after the segmentation of all branches within the point clouds. The larger the sizes and proportion of open contours on the trunk surface the more empty voxels there are inside the trunk which will not be identified and considered as trunk volume.
The accuracy of branch volume estimates for Acer differs significantly from Sorbus and Betula. As volume estimates of Acer showed the lowest congruence, the accuracy ranking for the branches was, however, completely different to our assumption in H2 (Sorbus > Betula > Acer). There are different possible reasons for this ranking order. Based on Hampel’s outlier identification, we identified potential outliers in the value of relative difference of branch volume estimates: Acer no. 6 (+10.4%), Sorbus no. 3 (−35.5%) and Betula no. 1 and 5 (−29.1%, −13.2%). Visual inspections of these four point clouds revealed structural shifts within the branches, probably due to registration errors, which significantly decrease the degree of underestimations. The very low R2adj value of Acer can be explained by the impact of the high proportion of large branches as discussed above (i.e., stronger occlusion and larger open contour). Additionally, it could be a result of the very low variability (homogeneity) of the branch volume dimensions: whereas the range was 0.5 to 3.1 dm3 and 0.7 to 2.0 dm3 in Betula and Sorbus, respectively, these values ranged only from 0.5 to 0.7 dm3 in Acer. Both outlier trees of Betula tamper with the likely higher mean underestimation of the branches, which otherwise might also be significantly different from Sorbus. Branches are most susceptible to thresholds in scan resolution and structural shifts due to movements during the scans or to registration errors. Our results showed that larger branches (diameter at branch center >4 mm) tend to lead to higher means in local overestimations due to additional spatial structures, whereas smaller branches (diameter at branch center <4 mm) will lead to higher means in local underestimation due to a reduction in point densities and insufficient captured small branch structures. Compared with Betula the higher R2adj value for Sorbus could also originate in the asymmetry of the crown and therefore a lower degree of occlusion during the scan process.
5. Conclusion
Despite the determined underestimations the results showed that the voxel-based bounding box method provided highly congruent volume estimates based on TLS point clouds. The accuracy of volume estimates primarily depends on the achieved quality of a fully captured tree model. If single young trees are captured with similar high scan resolution the accuracy of total tree wood volume estimates proved to be independent from tree architectural complexity. This is also true for trunk wood volume estimates, a finding that can be related to the fact that trunks constitute the main component of the total wood volume. The impact of occlusions was, thus, not as high as expected for total tree and trunk volume estimates of our sample of single young trees. However, occlusion by branches might be more influential for wood volume estimates of older and larger trees, and for trees scanned within forest stands. In contrast to the total tree and trunk, the accuracy of wood volume estimates for branches significantly differed among tree species and was influenced by tree architectural complexity. This complexity is determined by the number, length and diameter of the branches. However, the degree of estimate accuracy was not related in a simple way to structural complexity, because underestimations originated from different sources in the three tree species: in particular from occlusions and blind spots on stronger branches in Acer, and from high numbers of small branches with diameters below scan resolution in Sorbus and Betula. The accuracy of branch volume estimates can thus not be directly derived from the degree of tree architectural complexity.
As our sample represents a first pool of fully xylometric measured wood volumes, one of our next goals is to further improve TLS-based wood volume estimates of the branches. Considering tree modeling approaches like geometrical cylinder fitting, a combination of voxel-based modeling and cylinder fitting methods referenced to a topological tree model might turn out to complement each other.


