
Modeling Crown Biomass for Four Pine Species in China


1
Key Laboratory of Digital Earth Science, Institute of Remote Sensing and Digital Earth, Chinese Academy of Sciences, Beijing 100101, China
2
Academy of Forest Inventory and Planning, State Forestry Administration, Beijing 100714, China
3
Forestry Experimental Center of North China, Chinese Academy of Forestry, Beijing 102300, China
4
Research Institute of Management Science & Information Engineering, Hangzhou Dianzi University, Hangzhou 310018, China
*
Author to whom correspondence should be addressed.
Forests 2015, 6(2), 433-449; https://doi.org/10.3390/f6020433
Submission received: 31 October 2014
/
Accepted: 2 February 2015
/
Published: 9 February 2015
Abstract
:To analyze the main variables affecting crown biomass, we measured crown biomass and a number of variables describing tree size, such as stem diameter at breast height (D), tree height (H), crown width (Cw) and crown length (Cl), from 754 sample trees of four pine species in China, specifically, Pinus massoniana, P. yunnanensis, P. tabulaeformis and P. elliottii. In addition, we developed individual tree crown biomass equations and compatible branch and needle biomass equations based on one-, two- and multi-variable models using nonlinear mixed-effects modeling and error-in-variable simultaneous equations. The results showed that: (i) crown biomass was strongly correlated to D and H, and the new combined variables (D4/H) and (D2/H) were suitable for modeling two- and multi-variable crown biomass equations, respectively; (ii) the four species were ranked as P. yunnanensis, P. massoniana, P. elliottii and P. tabulaeformis from small to large based on estimates from crown biomass equations, and the crown biomass estimate of P. tabulaeformis was about 60% greater than that of P. yunnanensis; (iii) the ratio of branch to crown biomass increased with increasing D, and the four species were ranked as P. elliottii, P. tabulaeformis, P. massoniana and P. yunnanensis from small to large by the proportion of the branch to crown biomass; (iv) the mean prediction errors (MPE’s) of the crown biomass equations for the four species were less than 10%, which could meet precision needs for biomass estimation.
1. Introduction
In the context of global climate change, the capacity of forest ecosystems to sequester carbon has attracted increasing attention [1,2]. The carbon sequestration capacity of a forest is strongly related to forest carbon stock, which is equal to forest biomass multiplied by carbon content factor (CCF) [3]. Because different species have essentially the same CCF, forest biomass estimation has become the most important issue in the estimation of the capacity of forest ecosystems to sequester carbon.
Forest biomass includes both above- and below-ground biomass, while aboveground biomass can be further divided into stem and crown (branch and foliage, respectively) biomass. Previous studies have reported significant variations in forest biomass estimation between different ecological zones, tree species, ages, density and management types [4,5]. Particularly, crown biomass estimates, which include branch and foliage biomass, vary widely between species. Many studies related to crown biomass have been reported worldwide [5,6,7,8,9,10,11,12,13,14,15,16,17]. For example, Yu et al. (2010) established individual tree crown, branch and foliage biomass equations for Larix gmelinii forests using stem diameter, tree height, crown width, and crown length [18]. Keyser et al. (2010) developed a crown biomass allometric model and a crown biomass distribution model for Pinus ponderosa in the Black Hills, South Dakota, USA, and found that crown biomass was mainly related to stem diameter and live crown ratio [19]. Affleck et al. (2013) explored crown biomass for the seven main coniferous tree species in the American Pacific Northwest, and concluded that stem diameter, tree height and crown length were the key variables affecting the crown biomass [20].
To establish individual tree biomass models and carbon accounting parameters for all major tree species in China, the State Forestry Administration began implementation of the National Biomass Modeling Program in Continuous Forest Inventory (NBMP-CFI) in 2009. In the last five years, researchers have collected biomass data for more than ten tree species or species groups, including four important pine species: Pinus massoniana, P. yunnanensis, P. tabulaeformis and P. elliottii. The stocking volume of these four species accounts for 14.5% of the total forest volume of China. Pinus massoniana, P. yunnanensis and P. tabulaeformis are the most frequent pine species in southern, southwestern and northern China, respectively, and P. elliottii is the most common exotic pine species in China [21]. In this paper, crown biomass data from 754 sample trees of these four species were used to (i) analyze the main variables affecting crown biomass estimation and determine the appropriate combination of variables for use in estimating crown biomass; (ii) establish the one-, two- and multi-variable fixed-effects models for crown biomass estimation based on a combination of variables; (iii) determine the differences of crown biomass between the four selected species through the establishment of crown biomass models using the nonlinear mixed-effects method [22,23,24,25]; and(iv) establish compatible branch and foliage biomass models for the selected four pine species, based on the developed crown biomass models mentioned above, using the error-in-variable simultaneous equations approach [26,27,28,29].
2. Material and Methods
2.1. Modeling Data
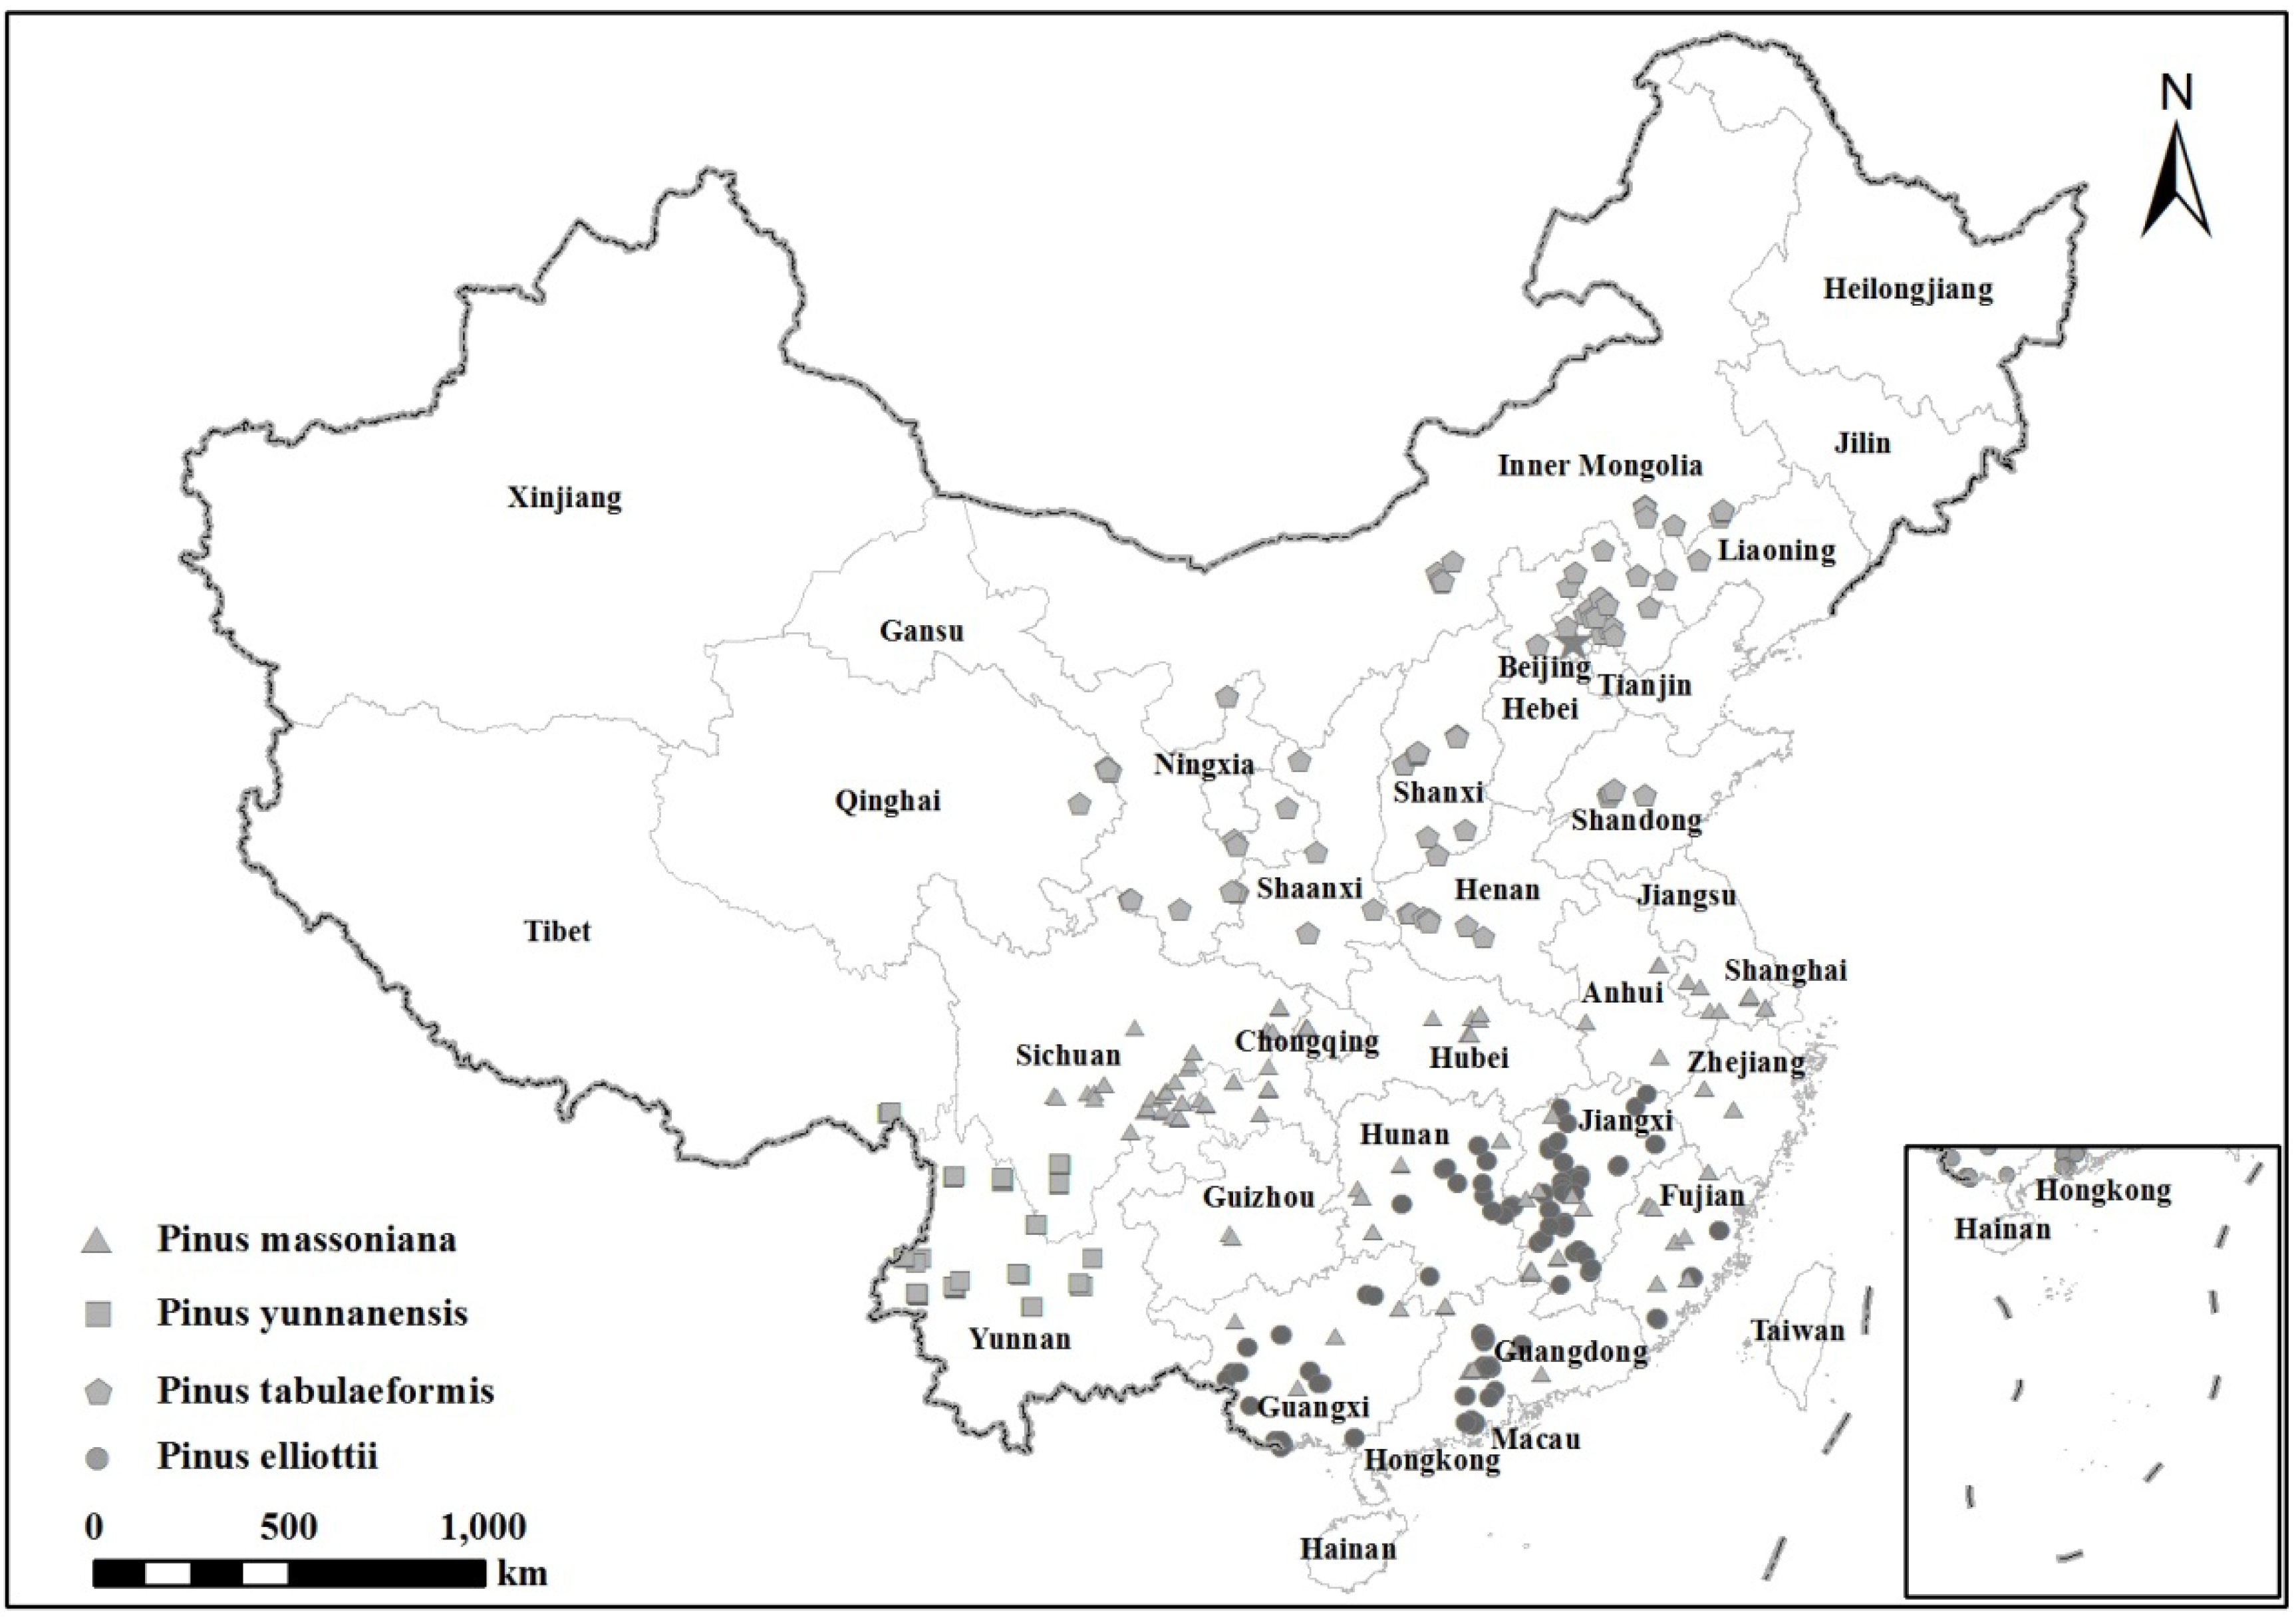
This study used data from the NBMP-CFI program funded by the State Forestry Administration of China. The data included stem diameter at breast height (D), tree height (H), crown width (Cw), crown length (Cl), and crown, branch and needle (or foliage) biomass from 754 sample trees of four pine species: P. massoniana, P. yunnanensis, P. tabulaeformis and P. elliottii, collected from the main distribution areas of the four species (Figure 1). For P. massoniana, the area includes 11 provinces in southern China, i.e., Anhui, Fujian, Guangdong, Guangxi, Guizhou, Hubei, Hunan, Jiangsu, Jiangxi, Sichuan, and Zhejiang. For P. yunnanensis, the area includes Sichuan, Tibet and Yunnan in southwest China. For P. tabulaeformis, the area includes areas of northern and northwestern China, including Beijing, Gansu, Hebei, Henan, Inner Mongolia, Liaoning, Ningxia, Qinghai, Shaanxi, Shandong, Shanxi, and Tianjin. For P. elliottii, the area includes the southern provinces of Fujian, Guangdong, Guangxi, Hunan, and Jiangxi. Sample trees for each species were selected to be evenly distributed into ten diameter classes with about 15 sample trees per diameter class, although this number becomes 30 for P. massoniana. The ten diameter classes are 2, 4, 6, 8, 12, 16, 20, 26, 32 cm and >38 cm for P. massoniana and P. yunnanensis, and 2, 4, 6, 8, 12, 16, 20, 24, 28 cm and >32 cm for P. tabulaeformis and P. elliottii.
Figure 1.
Location of sample trees in China.

Diameter at breast height (D) and crown width (Cw) of each sample tree were measured in the field. After the tree was felled, total trunk length (tree height, H) and live crown length (Cl) were also measured. The fresh weights of stems (the trunk from ground level to the top), branches, and needles were measured, respectively, and subsamples were selected and weighed in the field. In the laboratory, all subsamples were oven-dried at 85 °C until constant weights were reached. The ratio of dry weight to fresh weight of subsamples, branch and needle biomass were then computed. Table 1 shows the general situation of modeling samples.

| Species | Sample Numbers | Variables | Mean | Min. | Max. | S.D. | CV% |
|---|---|---|---|---|---|---|---|
| P. massoniana | 301 | Diameter (cm) | 16.6 | 1.2 | 47.2 | 12.0 | 72.4 |
| Height (m) | 12.1 | 1.6 | 30.3 | 7.2 | 59.3 | ||
| Crown width (m) | 4.4 | 0.6 | 12.0 | 2.5 | 56.2 | ||
| Crown length (m) | 6.2 | 0.7 | 17.5 | 3.5 | 56.4 | ||
| Crown biomass (kg) | 35.1 | 0.1 | 305.0 | 48.8 | 139.5 | ||
| P. yunnanensis | 150 | Diameter (cm) | 16.7 | 1.8 | 47.1 | 12.4 | 74.0 |
| Height (m) | 10.7 | 1.8 | 33.3 | 6.9 | 64.2 | ||
| Crown width (m) | 4.3 | 0.8 | 12.6 | 2.6 | 61.3 | ||
| Crown length (m) | 6.1 | 0.8 | 26.1 | 4.1 | 66.7 | ||
| Crown biomass (kg) | 38.6 | 0.1 | 212.3 | 51.8 | 134.2 | ||
| P. tabulaeformis | 149 | Diameter (cm) | 15.3 | 1.2 | 32.9 | 9.9 | 64.8 |
| Height (m) | 9.4 | 1.6 | 20.1 | 4.8 | 51.5 | ||
| Crown width (m) | 3.8 | 0.8 | 10.4 | 2.2 | 58.5 | ||
| Crown length (m) | 6.0 | 0.9 | 13.3 | 3.3 | 55.7 | ||
| Crown biomass (kg) | 47.7 | 0.2 | 278.5 | 59.0 | 123.7 | ||
| P. elliottii | 154 | Diameter (cm) | 15.5 | 1.2 | 33.9 | 10.1 | 64.9 |
| Height (m) | 9.7 | 1.6 | 20.0 | 4.8 | 50.2 | ||
| Crown width (m) | 3.8 | 0.9 | 9.0 | 2.2 | 58.7 | ||
| Crown length (m) | 5.3 | 1.0 | 12.0 | 2.7 | 51.1 | ||
| Crown biomass (kg) | 35.6 | 0.2 | 146.8 | 41.1 | 115.4 |
Note: Min—minimum; Max—maximum; S.D.—standard deviation; CV—coefficient of variation.
2.2. Nonlinear Fixed-Effects Model
We employed the following commonly used nonlinear equation [19,20,30,31] as the base model for crown biomass:
where y is crown, branch or foliage biomass, xj are variables describing the dimensions of a tree, βj are parameters, and ε is the error term. Based on previous studies of crown biomass [6,8,32], tree variables related to crown biomass include D, H, Cw and Cl. Therefore, the general formula for the nonlinear crown biomass (Mc) model can be expressed as:
To facilitate the application of Equation (2), more simplified biomass models were usually adopted. For example, the following models are often used:
Equations (2)–(4) are usually named multi-, two- and one-variable crown biomass models, respectively. In the first two equations, combined variables can be employed to reduce the number of model parameters, and the most widely used combined variable is (D2H) [12,13,18]. In this paper, the final form of the combined variable will be determined through analysis of the tree form characteristics and size of parameters βj. Assuming X1 and X2 are the combination of D and H in Equations (2) and (3), respectively, and X3 is the combination of Cw and Cl in Equation (2), two- and multi-variable crown biomass models can be expressed as:
where the symbols have the same meanings as in previous equations. To compare with the following mixed-effects model, Equations (1)–(6) are called fixed-effects model in this paper.
Because the biomass data exhibits obvious heteroscedasticity, it should be processed by logarithmic transformation or weighted regression methods to eliminate the impact of heteroscedasticity on parameter estimation [30,33]. In this paper, the weighted least square method was selected to conduct the elimination. The first step uses the ordinary least square method to fit the models, and then analyzes the relationship between the error variance and core independent variable D to determine the variance functions as the weights of the models, and finally fits the models by the weighted least square method [33].
2.3. Nonlinear Mixed-Effects Model
To analyze the difference of parameters among crown biomass models of different tree species, a nonlinear mixed-effects model [24,34,35] was used to establish species-specific models and a generalized model. We defined a variable z reflecting the difference of tree species as random-effects variable, and defined D and H, which reflected the dimensions of a tree, as fixed-effects variables. The general form of a one-variable nonlinear crown biomass mixed-effects model with both fixed-effects variables and a random-effects variable is expressed as:
where Mc is crown biomass, ai are fixed parameters, ui are random parameters, z is a random-effects variable, and other symbols are the same as in Equation (2). The random parameters ui are independent to each other and the mathematical expectation value is 0 (that is, E(ui) = 0), and cov (ui, uj) = 0 for (i ≠ j). Whether or not random parameters ui are significantly different from 0 depends upon the results of significance test. If any of random parameter ui is not significantly different from 0, then it should be removed from the model.
Similarly, the two- and multi-variable crown biomass mixed-effects models based on Equations (5) and (6) can be expressed, respectively, as:
The difference between mixed-effects models (Equations (7)–(9)) and conventional fixed-effects models (Equations (4)–(6)) is that in the mixed model, each parameter appearing in the conventional models is set as the sum of a fixed and random parameter, βi = ai + ui × z.
2.4. Error-in-Variable Simultaneous Equations
The proportions of branch and foliage biomass to crown biomass were studied in more detail based on the results of crown biomass modeling. Based on this analysis, the proportion of branch to crown biomass varied with D and other tree variables. If foliage biomass is considered to be one unit, and the relative ratio of branch to foliage biomass is a function ƒ(x) that varies with tree variables such as D and H, then we can establish the following error-in-variable simultaneous equations [26,27,28]:
where and are the estimates of branch and foliage biomass, respectively; is the estimate of crown biomass, obtained from the established nonlinear mixed-effects model; and ƒ(x) is the relative ratio function of branch biomass, of which the expressions based on one-, two- and multi-variable are completely similar to Equations (4), (3) and (6), respectively. By using a non-linear mixed model, the relative ratio models can be expressed as:
where X4 and X5 are variables based on the combination of D, H, Cw and Cl, bi are fixed parameters, vi are random parameters, and other symbols have the same meaning as in the equations mentioned above. After the one-, two- and multi-variable relative ratio functions of branch biomass had been fitted, we replaced them in simultaneous Equation (10) and substituted dummy variables for random variables. Then, the parameters of the compatible models could be solved through using nonlinear error-in-variable simultaneous equations [29].
2.5. Model Evaluation and Validation
Many statistical indices have been used to evaluate biomass models [30]. Zeng et al. (2011) conducted a thematic analysis designed to evaluate biomass models when modeling single-tree biomass, and presented six statistical indicators [32]. They are coefficient of determination (R2), standard error of estimates (SEE), mean prediction error (MPE), total relative error (TRE), average systematic error (ASE) and mean percentage standard error (MPSE). This paper applied four statistical indicators, i.e., R2, SEE, MPE and MPSE, to assess the models, using specific expressions of Zeng et al. (2011) [32].
To further test the applicability of the models, only 80% of the samples were randomly selected to establish the models while the remaining 20% (60 sample trees of Pinus massoniana, 30 sample trees of P. yunnanensis, P. tabulaeformis and P. elliottii) were used for model validation, with the exception that all sample trees were used to determine the main variables influencing crown biomass. The total relative error (TRE) was used to measure the applicability of models. If the absolute value of TRE is less than MPE, then the model is applicable.
3. Results
3.1. Regression Analysis of Variables Affecting Crown Biomass
Based on the data from all 754 sample trees, regression analysis was applied to demonstrate the relationship between crown biomass (Mc) and tree variables including D, H, Cw, and Cl (Table 2). Results showed that as for a single variable, D had the highest relationship to crown biomass (R2 = 0.78, also known as correlation index), Cw the second, and H the lowest (R2 = 0.41). For two variables, the combination of D and H had the highest relationship to crown biomass, D and Cw the second, and Cw and Cl the lowest. Therefore, even though the contribution of Cw in explaining crown biomass was only less than that of D while considering only one variable, the combination of D and H had the highest contribution when two variables were taken into consideration.
| Number of Variables | Regression Models | R2 |
|---|---|---|
| One | Mc = aDb + ε | 0.78 |
| Mc = aHb + ε | 0.41 | |
| Mc = aCwb + ε | 0.64 | |
| Mc = aClb + ε | 0.49 | |
| Two | Mc = aDbHc + ε | 0.81 |
| Mc = aDbCwc + ε | 0.79 | |
| Mc = aDbClc + ε | 0.78 | |
| Mc = aCwbClc + ε | 0.67 | |
| Three | Mc = aDbHcCwc + ε | 0.83 |
| Mc = aDbHcCld + ε | 0.83 | |
| Four | Mc = aDbHcCwdCle + ε | 0.84 |
The appropriate combined variables were also studied for two- and multi-variable regression models. If D was considered as one of the explanatory variables, the combination of D and H was the best for two-variable models, and the suitable combined form was (D4/H), which was inconsistent with the commonly-used combination (D2H). If D was not taken into consideration, the combination of Cw and Cl was better, and the proper combined form was (Cw2Cl); this is very similar to the commonly-used combination of D and H.
If four variables were considered to be explanatory variables in a crown biomass model, then combined forms of D and H or Cw and Cl could be determined from the values of power parameters in Equation (2). Based on the results of regression estimation, four variables in Equation (2) could be reduced to two combinations of (D2/H) and (CwCl). This indicates that different combinations of variables exist in biomass models with different structural forms.
3.2. Crown Biomass Fixed-Effects Models
The randomly selected 80% of samples were used to fit the one-, two- and multi-variable fixed-effects models for the population-averaged crown biomass in the models (Equations (4)–(6) in Table 3), where X1 = D4/H in Equation (5), X2 = D2/H, X3 = CwCl in Equation (6).
| Models | Parameter Estimates | Main Statistics | ||||||
|---|---|---|---|---|---|---|---|---|
| β0 | β1 | β2 | R2 | SEE/kg | MPE/% | MPSE/% | TRE% | |
| (4) | 0.0633 | 2.1384 | / | 0.77 | 24.33 | 5.01 | 44.88 | −0.83 |
| (5) | 0.0824 | 0.6511 | / | 0.81 | 22.44 | 4.62 | 39.80 | −0.16 |
| (6) | 0.1300 | 1.1504 | 0.4778 | 0.83 | 20.86 | 4.32 | 34.99 | −1.05 |
Note: The weight variables of one-, two- and multi-variable of fixed-effects models of crown biomass are respectively 1/D1.56, 1/D1.53 and 1/D1.45 (the same in Table 4). R2—coefficient of determination; SEE—standard error of estimates; MPE—mean prediction error; MPSE—mean percentage standard error; TRE—total relative error.
The goodness-of-fit of crown biomass models improved gradually with an increasing number of explanatory variables in models (Table 3). Four statistical indicators showed complete consistency: from one-variable model to two- and multi-variable models, the R2 increased while the SEE, MPE, and MPSE decreased gradually. The absolute value of TRE that was calculated based on the 20% test samples was less than the corresponding MPE, indicating a good behavior of the models.
3.3. Crown Biomass Mixed-Effects Models
Table 4 shows the one-, two- and multi-variable crown biomass nonlinear mixed-effects models (7)–(9); only u0 among all the random parameters is valid (significantly different from 0 at p = 0.00).
| Models | Fixed Parameters | Random Parameters | Main Statistics | |||||||||
|---|---|---|---|---|---|---|---|---|---|---|---|---|
| a0 | a1 | a2 | u0(1) | u0(2) | u0(3) | u0(4) | R2 | SEE/kg | MPE/% | MPSE/% | TRE/% | |
| (7) | 0.0535 | 2.2070 | / | −0.0092 | −0.0098 | 0.0202 | −0.0012 | 0.84 | 20.22 | 4.16 | 43.65 | 2.80 |
| (8) | 0.0733 | 0.6648 | / | −0.0062 | −0.0135 | 0.0243 | −0.0046 | 0.86 | 18.90 | 3.89 | 38.43 | 3.12 |
| (9) | 0.1255 | 1.1542 | 0.4856 | −0.0083 | −0.0237 | 0.0348 | −0.0028 | 0.88 | 18.05 | 3.72 | 33.08 | 1.26 |
Note: R2—coefficient of determination; SEE—standard error of estimates; MPE—mean prediction error; MPSE—mean percentage standard error; TRE—total relative error. The random parameters u0(i) are the response values of P. massoniana, P. yunnanensis, P. tabulaeformis and P. elliottii, respectively, for i = 1, 2, 3, 4.
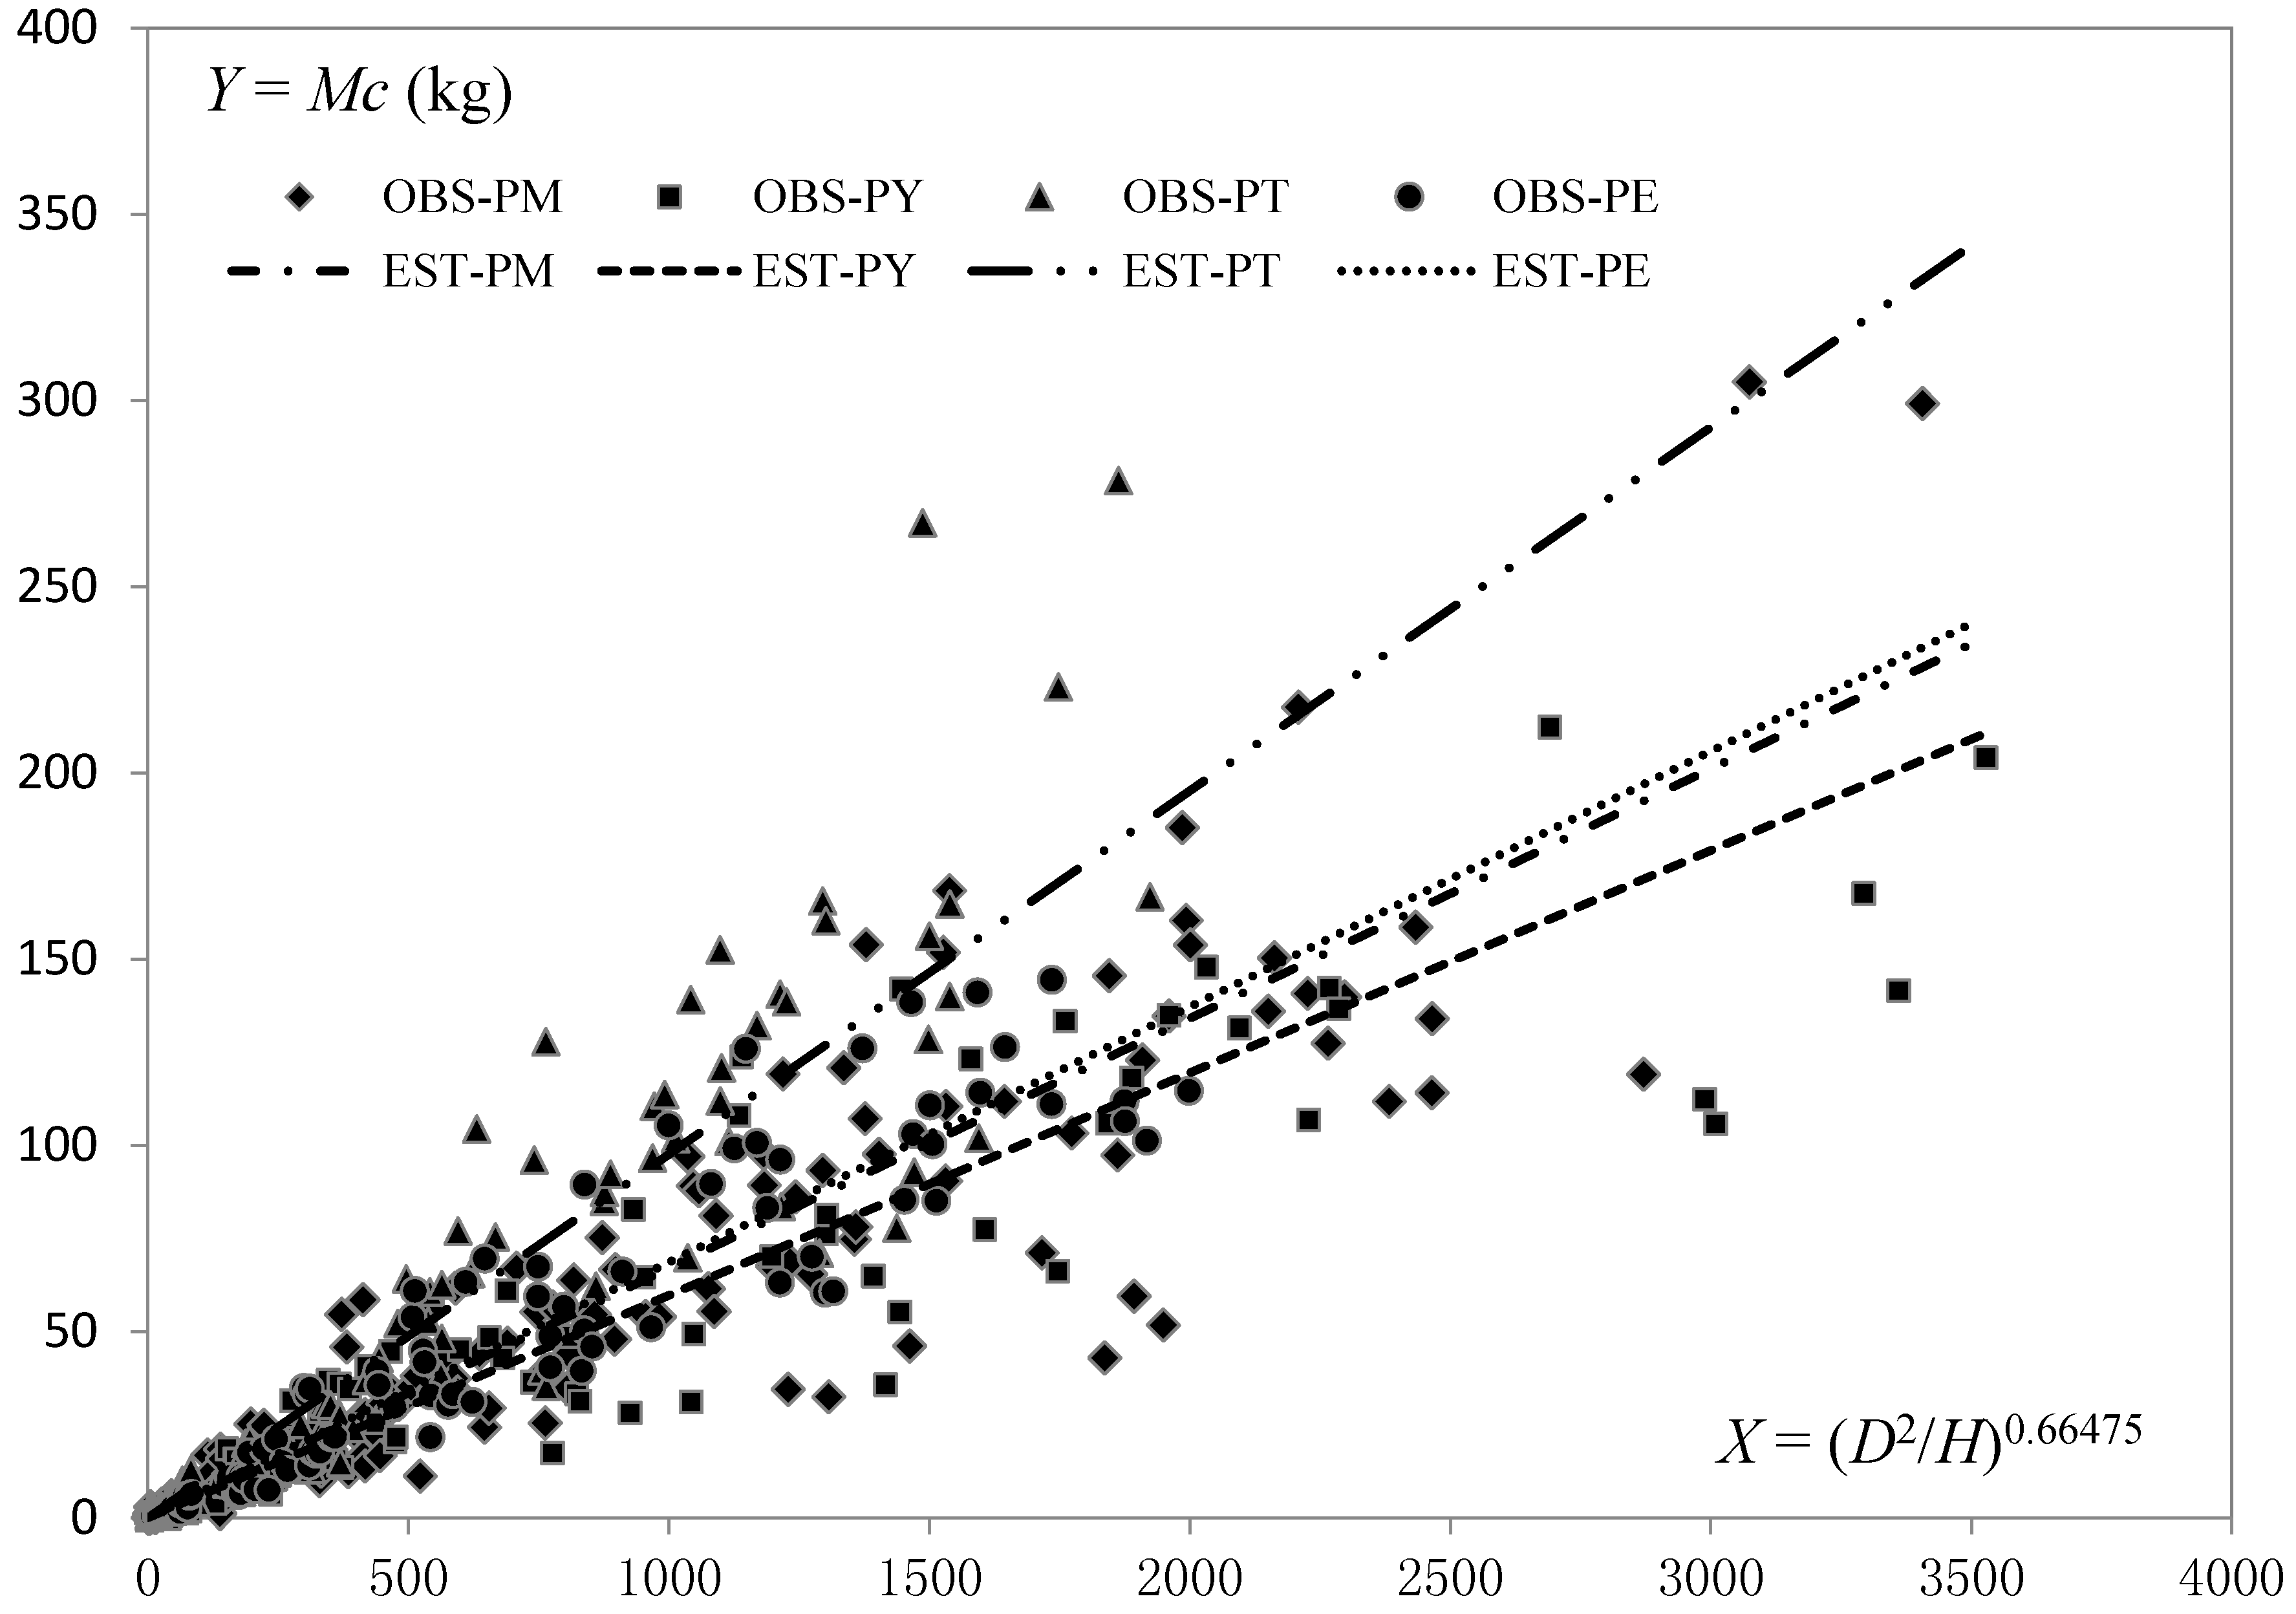
Comparing Table 3 and Table 4, the goodness-of-fit of nonlinear mixed-effects models was found to be better than that of the corresponding fixed-effects models. Similarly, with an increasing number of explanatory variables, the fitting results of nonlinear mixed models of crown biomass gradually improved. Based on the size of parameters in models (7)–(9), P. tabulaeformis had the largest crown biomass, followed by P. elliottii, while P. yunnanensis had the smallest crown biomass. The crown biomass estimates of the two-variable models for P. massoniana, P. elliottii and P. tabulaeformis were 12%, 15% and 63% larger, respectively, than that for P. yunnanensis (Figure 2).
Figure 2.
Comparison of two-variable crown biomass equations for the four pine species. (OBSobserved, EST—estimated; PM—P. massoniana, PY—P. yunnanensis, PT—P. tabulaeformis, PE—P. elliottii).
Figure 2.
Comparison of two-variable crown biomass equations for the four pine species. (OBSobserved, EST—estimated; PM—P. massoniana, PY—P. yunnanensis, PT—P. tabulaeformis, PE—P. elliottii).

From the fixed and random parameters in Table 4, we could obtain one-, two- and multi-variable crown biomass models for the four species, and calculate the primary statistical data of species-specific crown biomass models (Table 5).
Table 5 shows that the mean prediction errors of crown biomass models for the four species were less than 10%. That is, the precision of crown biomass estimates were greater than 90%, indicating good fitting results were achieved. Crown biomass models for P. elliottii had the greatest prediction precision (the MPE was about 6%), and the best R2 (>0.9); followed by models for P. tabulaeformis and P. massoniana, with models for P. yunnanensis having the lowest. The R2 = 0.82–0.89 for the models of other three species, and the MPE’s were 6.62%–10.31%. In addition, the prediction precisions of estimates for P. massoniana and P. tabulaeformis increased gradually from the one-variable model to the two- and multi-variable models, which were similar to those in the aforementioned fixed-effects model and mixed-effects model. However, the results for P. yunnanensis and P. elliottii were slightly different. For P. yunnanensis, the two-variable model provided the best fit, and the one-variable model performed best for P. elliottii. These might be related to the tree architecture of the species and quality of modeling samples. All the absolute values of TRE were less than the corresponding MPE, indicating a good behavior from the models.
Table 5.
The statistics of nonlinear mixed-effects models for species-specific crown biomass estimation.
| Species | Models | R2 | SEE/kg | MPE/% | MPSE/% | TRE% |
|---|---|---|---|---|---|---|
| P. massoniana | One-variable | 0.83 | 20.86 | 7.33 | 44.09 | 4.33 |
| Two-variable | 0.86 | 19.42 | 6.82 | 35.45 | 5.64 | |
| Multi-variable | 0.86 | 18.85 | 6.62 | 32.08 | 3.33 | |
| P. yunnanensis | One-variable | 0.82 | 21.25 | 10.31 | 38.93 | −6.30 |
| Two-variable | 0.86 | 18.75 | 9.10 | 34.66 | −3.28 | |
| Multi-variable | 0.85 | 19.23 | 9.33 | 35.40 | 2.76 | |
| P. tabulaeformis | One-variable | 0.83 | 25.10 | 9.40 | 52.85 | 5.64 |
| Two-variable | 0.85 | 23.18 | 8.68 | 48.80 | 5.54 | |
| Multi-variable | 0.89 | 20.55 | 7.70 | 38.60 | 1.58 | |
| P. elliottii | One-variable | 0.93 | 10.66 | 5.28 | 38.55 | −4.60 |
| Two-variable | 0.90 | 13.06 | 6.47 | 37.91 | −4.09 | |
| Multi-variable | 0.91 | 12.21 | 6.05 | 27.47 | −5.31 |
Note: R2—coefficient of determination; SEE—standard error of estimates; MPE—mean prediction error; MPSE—mean percentage standard error; TRE—total relative error.
3.4. Compatible Branch and Foliage Biomass Models
The results of one-, two- and multi-variable relative ratio models (based on Equations (11)–(13)) shown that among all the random parameters, only v0 is valid (significantly different from 0 at p = 0.00). The combined variables in Equation (13) were defined as: X4 = (DCw), X5 = (H 2/Cl). Equations (11)–(13) were substituted into compatible branch and foliage biomass simultaneous Equation (10), and the fitting results could be obtained (Table 6).
| Equations | Global Parameters | Specific Parameters | Statistics | ||||
|---|---|---|---|---|---|---|---|
| bi | v0(1) | v0(2) | v0(3) | v0(4) | Branch Models | Foliage Models | |
| (11) | 0.4289 | 0.0362 | 0.0650 | −0.0088 | −0.0924 | R2 = 0.83 | R2 = 0.72 |
| 0.5770 | / | / | / | / | MPE = 4.69% | MPE = 5.28% | |
| TRE = 2.91% | TRE = 2.46% | ||||||
| (12) | 0.4008 | 0.0309 | 0.0581 | −0.0070 | −0.0820 | R2 = 0.85 | R2 = 0.73 |
| 0.5311 | / | / | / | / | MPE = 4.40% | MPE = 5.17% | |
| 0.0805 | / | / | / | / | TRE = 3.19% | TRE = 2.90% | |
| (13) | 0.4474 | 0.0175 | 0.0597 | 0.0056 | −0.0828 | R2 = 0.86 | R2 = 0.74 |
| 0.2720 | / | / | / | / | MPE = 4.29% | MPE = 5.06% | |
| 0.1388 | / | / | / | / | TRE = 1.24% | TRE = 1.30% | |
Note: R2—coefficient of determination; MPE—mean prediction error; TRE—total relative error.
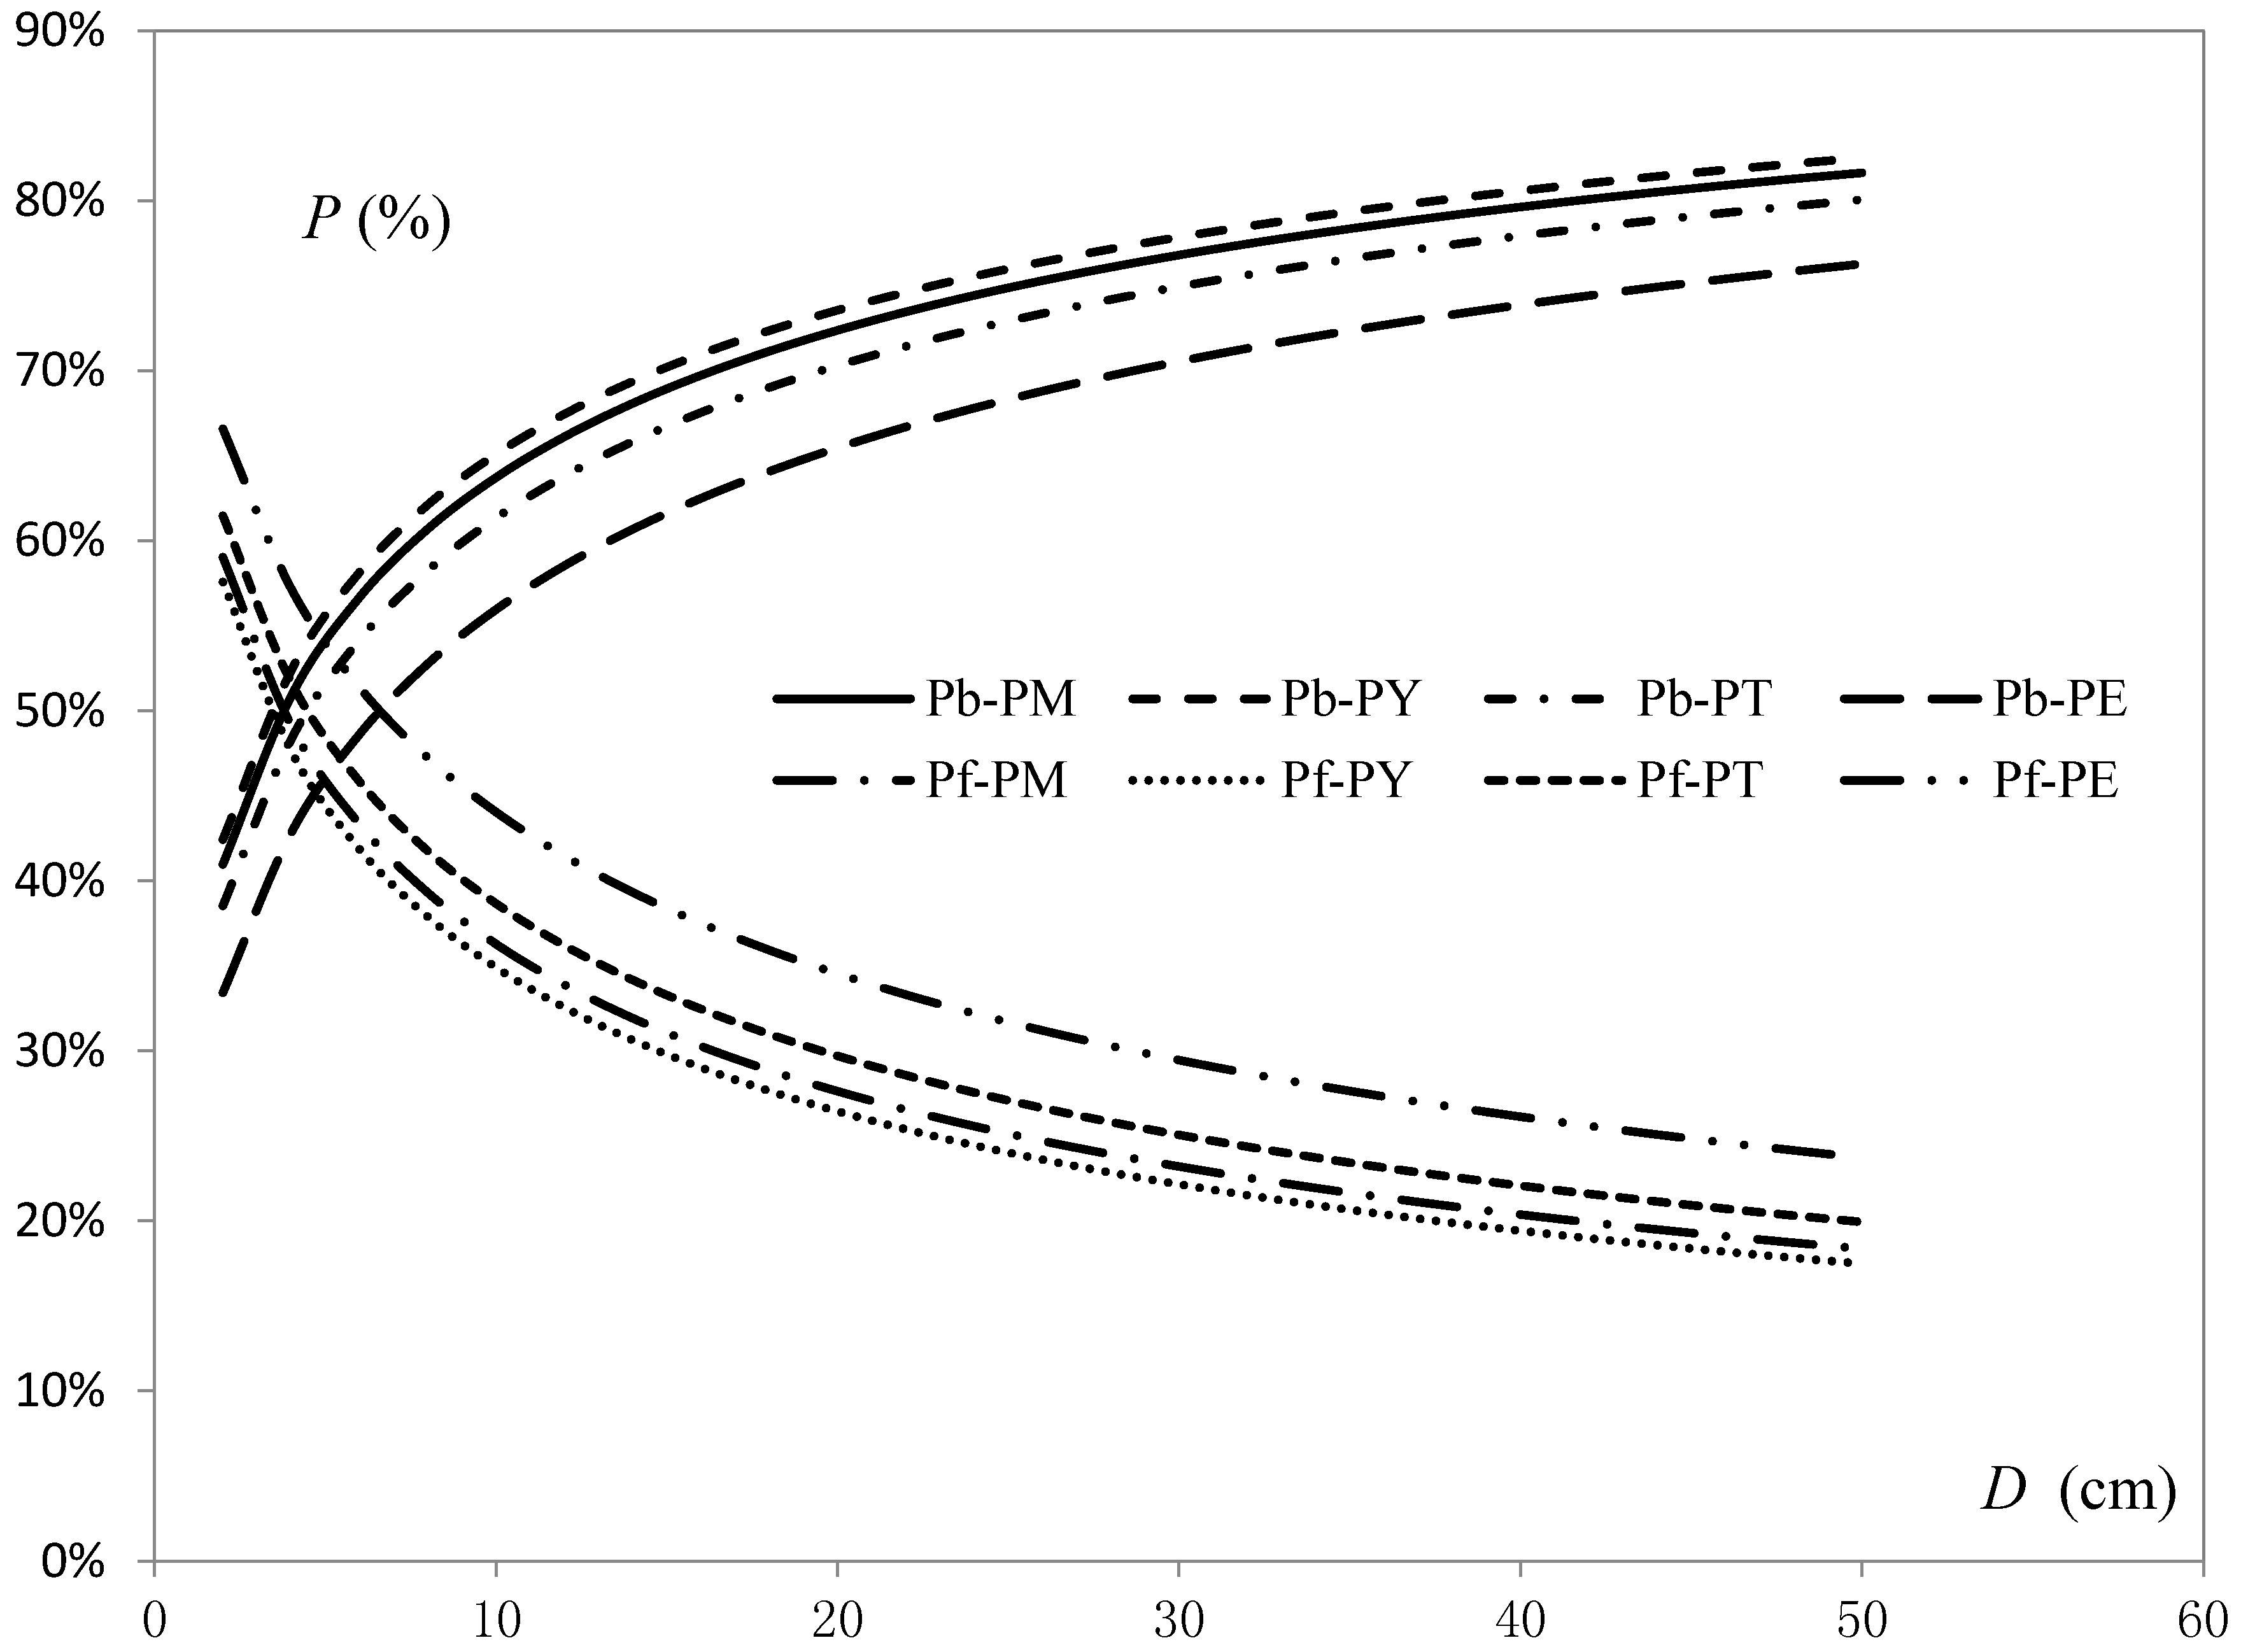
The MPEs of foliage biomass models were found to be slightly higher than those of branch biomass models, but all of them were around 5% for population-averaged predictions; the goodness-of-fit of branch and foliage biomass models improved gradually with an increase in the number of explanatory variables (Table 6). In addition, based on the values of the parameters in one-variable models, we found the proportion of branch biomass increased gradually with increasing D. The four pine species could be ranked by the size of branch biomass proportions as: P. yunnanensis > P. massoniana > P. tabulaeformis > P. elliottii. For example, using the trees that have a 40 cm D, the proportions of estimated branch or foliage biomass to crown biomass for P. yunnanensis, P. massoniana, P. tabulaeformis and P. elliottii were 81%, 80%, 78% and 74% (branch), and 19%, 20%, 22% and 26% (foliage), respectively (Figure 3).
Figure 3.
Comparison of proportions of branch and foliage biomass from compatible one-variable equations for the four pine species. (Pb—proportion of branch biomass, Pf—proportion of foliage biomass; PM—P. massoniana, PY—P. yunnanensis, PT—P. tabulaeformis, PE—P. elliottii).
Figure 3.
Comparison of proportions of branch and foliage biomass from compatible one-variable equations for the four pine species. (Pb—proportion of branch biomass, Pf—proportion of foliage biomass; PM—P. massoniana, PY—P. yunnanensis, PT—P. tabulaeformis, PE—P. elliottii).

From the global and specific parameters in Table 6, we could obtain one-, two- and multi-variable models of branch and foliage biomass for the four species, and calculate the primary statistics of species-specific branch and foliage crown biomass models. The MPE’s of all models were less than 17%, that is, the precision of biomass estimates exceeded 83%, providing acceptable fitting results. The prediction precision of the biomass models for P. elliottii were the largest (greater than 92%), with the precision of foliage biomass estimates slightly exceeding that of branch biomass. The precisions for P. massoniana and P. tabulaeformis were between 89%–92%. For P. yunnanensis, the precision of branch biomass estimates (about 90%) was greater than that of foliage biomass (greater than 83%).
4. Discussion
4.1. Variables Affecting Crown Biomass
Among the four main variables affecting crown biomass (D, H, crown width, and crown length), D was the most important, which was consistent with the conclusions of related literature [4,5,9,20,36]. Crown width was the next most important variable affecting crown biomass, consistent with the conclusion of Hoffmann et al. (2002) [6]. However, if we took the combined effects together with D into consideration, then the influence of H was larger than that of crown width. Thus, in a two-variable crown biomass model, the combination of D and H would be used instead of the combination of D and crown width. For the estimation of crown biomass, the commonly used combination of D and H (D2H) did not perform well, because a negative correlation was observed between crown biomass and H for a tree with the same D. Based on regression analysis, the combination (D4/H) of D and H was appropriate. Some of the crown biomass models collected by Zianis et al. (2005) had used a similar combination of D and H (D3/H) [12]. Snorrason et al. (2006) and Rock (2007) established crown biomass models using a method similar to Equation (3), in which the power parameters of H were negative, indicating a negative correlation exists between the crown biomass and H [14,15]. Affleck (2013) established multi-variable crown biomass models similar to Equation (1) for seven tree species and also concluded that H has a negative relationship with crown biomass [20]. In fact, it is very common that shorter trees with the same D typically have a larger crown while taller trees have a smaller crown. This did agree with the regression estimation results in this paper and previous findings [5,14,15,20].
If the crown biomass models such as Equation (1) contained a different number of explainable variables, then the expressions of the combined variables were not the same. When a crown biomass model contained only D and H, the suitable combination of variables was (D4/H). However, when the crown biomass model contained only crown width and length, the proper combination of variables was (Cw2Cl). In addition, when the crown biomass model contained D, H, crown width and crown length, the appropriate combinations of variables were (D2/H) and (CwCl). Through dimensional analysis of these three groups of combined variables, one could find that the sum of all power values in each situation was 3, indicating that crown biomass is related to a three-dimensional space. The real reason remains to be explored by ecologists or biologists.
The relative ratio functions of branch biomass were also related to the four variables of a tree such as D and H, but the suitable combinations of variables were different from those in crown biomass models. For example, in the multi-variable relative ratio model, the appropriate combined variables are (DCw) and (H2/Cl).
4.2. On Crown Biomass Models
This paper established a species-free fixed-effects model and a mixed-effects model of tree crown biomass, and the goodness of fit was better for the latter than the former, consistent with the conclusions of related literature [22,23,24,25]. The coefficients of determination (R2) of one-, two- and multi-variable fixed-effects models were 0.77, 0.81 and 0.83, respectively; those of the corresponding mixed-effects model were 0.84, 0.86 and 0.88, respectively, and were not as large as those reported by Tu et al. (2008) [36]. This may occur because they used modeling data collected from a single local area with a relatively small sample size (n = 12 and 15, respectively). The modeling data used in this study employed a large sample size that was representative of the large-scale region of species distribution. According to the crown biomass models for thirty-three tree species groups in Canada [11], the mean adjusted coefficients of determination for the one- and two-variable models were 0.78 and 0.80, respectively. These were basically the same as those of the one- and two-variable models for the four pine species in our study. The MPEs of one-, two- and multi-variable mixed models decreased 0.85%, 0.73% and 0.60%, respectively, than the corresponding fixed-effects models; the values of the MPEs were all less than 5%.
In this study, compatible branch and foliage biomass simultaneous equations were constructed based on the crown biomass mixed models, in which the crown biomass was divided into the two components of branch and foliage biomass. The sum of these two was equal to the crown biomass. In general, the precision of branch biomass estimates was higher than that of foliage biomass estimates, consistent with the results of previous studies [11,26]. However, for the species-specific models, the results were not completely in accordance with the above conclusion. Among the models of four species, the precisions of branch and foliage biomass estimates were very close for P. tabulaeformis, providing similar results to those of Ma (1989) [37]. Nevertheless, the precision of branch biomass estimates for P. elliottii was lower than that of the foliage biomass estimates, consistent with those of Li et al. (2006) [13]. A study focusing on branch and foliage biomass estimation for thirty-three tree species groups in Canada [11] concluded that the precisions of branch and foliage biomass estimates for three tree species were very close, but the precisions of branch biomass estimates was lower than those of the foliage biomass estimates for six species among the total thirty-three species. Therefore, the estimation precisions for branch and foliage biomass were determined by crown characteristics of the tree species, and models for branch biomass estimation usually performed better than that for foliage biomass estimation.
According to the review by Henry et al. (2014), significant variations have been observed in forest biomass estimation between different ecological zones, tree species, ages, management types and sites [5]. From the results, we found that P. tabulaeformis growing in the northern region had the largest crown biomass, followed by P. elliottii and P. massoniana growing in the southern region, while P. yunnanensis growing in the southwestern region had the smallest crown biomass. The difference of crown biomass estimates between P. elliottii and P. massoniana growing in the same region was not significant, but the differences among pine species growing in different regions were significant (Figure 2), which might be caused by the different climate conditions. In addition, the proportions of branch and foliage biomass to crown biomass increased or decreased with growing stem diameter, and also differed among different species. The differences among three native species, i.e., P. tabulaeformis, P. yunnanensis and P. massoniana, were relatively small, but the difference between native and exotic species was significant (Figure 3). According to the study by Ketterings et al. (2001), tree species may differ greatly in tree architecture and wood gravity [38]. Chmura et al. (2007) also found that crown architecture affected biomass allocation patterns [39]. From our data, the wood density or gravity of P. yunnanensis with the smallest crown biomass was really the lowest among four pine species, but that of P. tabulaeformis with the largest crown biomass was not the highest, only the second highest. Furthermore, from the authors’ experience, P. elliottii and P. massoniana growing in the same region do differ greatly in crown architecture. For a tree with the same stem diameter and tree height, P. elliottii probably has smaller branches and denser needles than P. massoniana. This might be the reason that the proportion of branch biomass for P. elliottii was obviously lower than the other three pine species. Furthermore, Jokela and Martin (2000) found that proportion of branch to aboveground biomass was smaller for P. elliottii than P. taeda, while the opposite was true for proportion of foliage biomass regardless of treatment [40]. Chmura et al. (2007) also concluded that P. elliottii produced significantly smaller crowns and also had a smaller proportion of branch to aboveground biomass than P. taeda at a given tree size [39].
5. Conclusions
In this study, crown biomass data from 754 sample trees of four pine species growing in China were used to analyze the variables affecting the estimation of crown biomass. One-, two- and multi-variable crown biomass models were constructed using nonlinear mixed-effects modeling. Compatible branch and foliage biomass models were established using nonlinear error-in-variable simultaneous equations with a dummy variable. The overall technical approach presented in this paper provided reference for the related study of crown biomass, and the findings in this study are also significant in application. Based on the findings of this study, the following conclusions could be drawn:
- (1)
- Based on the contributions of individual variables to crown biomass, the stem diameter at breast height was the most important, followed by crown width, crown length and tree height. As for the combined effects of two variables on the crown biomass, the combination of stem diameter and tree height was the most important, followed by the combination of stem diameter and crown width.
- (2)
- For one-, two- or multi-variable crown biomass model, significant differences were observed between the model parameters of different tree species. Based on the values of random effect parameters of four species, the rank of estimates of one-variable crown biomass models from small to large was P. yunnanensis, P. massoniana, P. elliottii and P. tabulaeformis, where the estimate of crown biomass for P. tabulaeformis was 60% larger than that for P. yunnanensis.
- (3)
- The proportions of branch to crown biomass and of foliage biomass increased and decreased gradually, respectively, with increasing stem diameter. The proportion of branch biomass of a tree with the same stem diameter could be ranked as: P. yunnanensis > P. massoniana > P. tabulaeformis > P. elliottii.
- (4)
- All of the crown biomass models for the four pine species in this study have average prediction precisions greater than 90%, and average precisions for compatible branch and foliage biomass models greater than 83%; models for P. elliottii, especially, achieved precisions greater than 92%. All these suggested that the models can meet the precision needs of biomass estimation.
Acknowledgments
The authors thank the National Biomass Modeling Program in Continuous Forest Inventory (NBMP-CFI), funded by the State Forestry Administration of China, for providing crown biomass measurement data of 754 sample pine trees: P. massoniana, P. yunnanensis, P. tabulaeformis and P. elliottii. Review comments made by J. H. Meng and other two referees helped to improve the presentation of this paper. The Natural Science Foundation of China (No. 31270697) also supported this study.
Author Contributions
Wen-Tao Zou conducted the data analysis and prepared the manuscript. Wei-Sheng Zeng conducted the data quality control, supervised data analysis and manuscript writing. Lian-Jin Zhang assisted in data analysis and discussion. Ming Zeng assisted in data analysis and manuscript preparation.
Conflicts of Interest
The authors declare no conflict of interest.
References
- Houghton, R.A.; Hall, F.; Goetz, S.J. Importance of biomass in the global carbon cycle. J. Geophys. Res. 2009, 114, 1–13. [Google Scholar]
- Pan, Y.D.; Birdsey, R.A.; Fang, J.Y.; Houghton, R.; Kauppi, P.E.; Kurz, W.A.; Phillips, O.L.; Shvidenko, A.; Lewis, S.L.; Canadell, J.G.; et al. A large and persistent carbon sink in the world’s forests. Science 2011, 333, 988–993. [Google Scholar] [CrossRef] [PubMed]
- IPCC. Good Practice Guidance for Land Use, Land-Use Change and Forestry; Penman, J., Gytarsky, M., Hiraishi, T., Krug, T., Kruger, D., Pipatti, R., Buendia, L., Miwa, K., Ngara, T., Tanabe, K., et al., Eds.; IPCC National Greenhouse Gas Inventories Programme: Hayama, Japan, 2003. [Google Scholar]
- Henry, M.; Picard, N.; Trotta, C.; Manlay, R.J.; Valentini, R.; Bernoux, M.; Saint-André, L. Estimating tree biomass of sub-Saharan African forests: A review of available allometric equations. Silva Fenn. 2011, 45, 477–569. [Google Scholar] [CrossRef]
- De-Miguel, S.; Pukkala, T.; Assaf, N.; Shater, Z. Intra-specific differences in allometric equations for aboveground biomass of eastern Mediterranean Pinus brutia. Ann. For. Sci. 2014, 71, 101–112. [Google Scholar] [CrossRef]
- Hoffmann, C.W.; Usoltsev, V.A. Tree-crown biomass estimation in forest species of the Ural and of Kazakhstan. For. Ecol. Manag. 2002, 158, 59–69. [Google Scholar] [CrossRef]
- Tahvanainen, T.; Forss, E. Individual tree models for the crown biomass distribution of Scots pine, Norway spruce and birch in Finland. For. Ecol. Manag. 2008, 255, 455–467. [Google Scholar] [CrossRef]
- Khosravi, S.; Namiranian, M.; Ghazanfari, H.; Shirvani, A. Crown biomass relationships of Lebanon oak in northern Zagros forests of Iran. Croat. J. For. Eng. 2012, 33, 239–247. [Google Scholar]
- Goodman, R.C.; Phillips, O.L.; Baker, T.R. The importance of crown dimensions to improve tropical tree biomass estimates. Ecol. Appl. 2014, 24, 680–698. [Google Scholar] [CrossRef] [PubMed]
- Hauglin, M.; Gobakken, T.; Astrup, R.; Ene, L.; Nӕsset, E. Estimating single-tree crown biomass of Norway spruce by airborne laser scanning: A comparison of methods with and without the use of terrestrial laser scanning to obtain the ground reference data. Forests 2014, 5, 384–403. [Google Scholar] [CrossRef]
- Lambert, M.C.; Ung, C.H.; Raulier, F. Canadian national tree aboveground biomass equations. Can. J. For. Res. 2005, 35, 1996–2018. [Google Scholar] [CrossRef]
- Zianis, D.; Muukkonen, P.; Makipaa, R.; Mencuccini, M. Biomass and stem volume equations for tree species in Europe. In Silva Fennica Monographs 4; Tammer-Paino Oy: Tampere, Finland, 2005. [Google Scholar]
- Li, X.R.; Liu, Q.J.; Chen, Y.R.; Hu, L.L.; Yang, F.T. Aboveground biomass of three conifers in Qianyanzhou plantation. Chin. J. Appl. Ecol. 2006, 17, 1382–1388. [Google Scholar]
- Snorrason, A.; Einarsson, S.F. Single-tree biomass and stem volume functions for eleven tree species used in Icelandic forestry. Icel. Agric. Sci. 2006, 19, 15–24. [Google Scholar]
- Rock, J. Suitability of published biomass equations for aspen in Central Europe-Results from a case study. Biomass Bioenergy 2007, 31, 299–307. [Google Scholar] [CrossRef]
- Zeng, W.S.; Zhang, H.R.; Tang, S.Z. Using the dummy variable model approach to construct compatible single-tree biomass equations at different scales a case study for Masson pine (Pinus massoniana) in southern China. Can. J. For. Res. 2011, 41, 1547–1554. [Google Scholar] [CrossRef]
- Ritchie, M.W.; Zhang, J.W.; Hamilton, T.A. Aboveground tree biomass for Pinus ponderosa in Northeastern California. Forests 2013, 4, 179–196. [Google Scholar] [CrossRef]
- Yu, B.; Wu, J.; Wang, B.T.; Wang, L.M. Analysis of crown growth characteristics in natural Larix gmelinii forests. Sci. Silvae Sin. 2010, 46, 41–48. [Google Scholar]
- Keyser, T.; Smith, F.W. Influence of crown biomass estimators and distribution on canopy fuel characteristics in Ponderosa Pine stands of the Black Hills. For. Sci. 2010, 56, 156–165. [Google Scholar]
- Affleck, D.; Seielstad, C.; Goodburn, J.; Queen, L.; Keane, R. Characterizing crown biomass and crown density profiles in conifer forests of the Interior Northwes. In Joint Fire Science Program Research Project Reports; University of Montana: Missoula, MT, USA, 2013. [Google Scholar]
- Zeng, W.S.; Tang, S.Z.; Huang, G.S.; Zhang, M. Population classification and sample structure on modeling of single-tree biomass equations for national biomass estimation in China. For. Resour. Manag. 2010, 3, 16–23. [Google Scholar]
- De-Miguel, S.; Mehtätalo, L.; Shater, Z.; Kraid, B.; Pukkala, T. Evaluating marginal and conditional predictions of taper models in the absence of calibration data. Can. J. For. Res. 2012, 42, 1383–1394. [Google Scholar] [CrossRef]
- Fu, L.Y.; Zeng, W.S.; Tang, S.Z.; Sharma, R.P.; Li, H.K. Using linear mixed model and dummy variable model approaches to construct compatible single-tree biomass equations at different scales—A case study for Masson pine in southern China. J. For. Sci. 2012, 58, 101–115. [Google Scholar]
- Fu, L.Y.; Zhang, H.R.; Li, C.M.; Tang, S.Z. Analysis of nonlinear mixed effects model parameter estimation methods. Sci. Silvae Sin. 2013, 49, 114–119. [Google Scholar]
- Zeng, W.S. Using nonlinear mixed model and dummy variable model approaches to construct origin-based single tree biomass equations. Trees 201 2015, 29, 275–283. [Google Scholar] [CrossRef]
- Zeng, W.S.; Tang, S.Z. Using measurement error modeling method to establish compatible single-tree biomass equations system. For. Res. 2010, 23, 797–803. [Google Scholar]
- Tang, S.Z.; Li, Y.; Wang, Y.H. Simultaneous equations, error-in-variable models, and model integration in systems ecology. Ecol. Model. 2001, 142, 285–294. [Google Scholar] [CrossRef]
- Zeng, W.S.; Tang, S.Z. Modeling compatible single-tree aboveground biomass equations of Masson pine (Pinus massoniana) in southern China. J. For. Res. 2012, 23, 593–598. [Google Scholar] [CrossRef]
- Tang, S.Z.; Lang, K.J.; Li, H.K. Statistics and Computation of Biomathematical Models (ForStat Course); Science Press: Beijing, China, 2008. [Google Scholar]
- Parresol, B.R. Assessing tree and stand biomass: A review with examples and, critical comparisons. For. Sci. 1999, 45, 573–593. [Google Scholar]
- Zeng, W.S.; Zhang, H.R.; Tang, S.Z. Methodology on Modeling of Single-Tree Biomass Equations; China Forestry Publishing House: Beijing, China, 2011. [Google Scholar]
- Zeng, W.S.; Tang, S.Z. Goodness evaluation and precision analysis of tree biomass equations. Sci. Silvae Sin. 2011, 47, 106–113. [Google Scholar]
- Zeng, W.S.; Tang, S.Z. Bias correction in logarithmic regression and comparison with weighted regression for nonlinear models. For. Res. 2011, 24, 137–143. [Google Scholar]
- Meng, S.X.; Huang, S.; Lieffers, V.J.; Nunifu, T.; Yang, Y.Q. Wind speed and crown class influence the height—Diameter relationship of lodgepole pine: Nonlinear mixed effects modeling. For. Ecol. Manag. 2008, 256, 570–577. [Google Scholar] [CrossRef]
- Li, C.M.; Zhang, H.R. Modeling dominant height for Chinese fir plantation using a nonlinear mixed-effects modeling approach. Sci. Silvae Sin. 2014, 46, 89–95. [Google Scholar]
- Tu, J.; Liu, Q.J.; Jian, M.F. Crown biomass and increment in mid-young-aged Pinus elliottii plantation from Qianyanzhou. J. Zhejiang For. Coll. 2008, 25, 206–210. [Google Scholar]
- Ma, Q.Y. A study on the biomass of Chinese pine forests. J. Beijing For. Univ. 1989, 11, 1–10. [Google Scholar]
- Ketterings, Q.M.; Coe, R.; van Noordwijk, M.; Ambagau, Y.; Palm, C.A. Reducing uncertainty in the use of allometric biomass equations for predicting above-ground tree biomass in mixed secondary forests. For. Ecol. Manag. 2001, 146, 199–209. [Google Scholar] [CrossRef]
- Chmura, D.J.; Rahman, M.S.; Tjoelker, M.G. Crown structure and biomass allocation patterns modulate aboveground productivity in young loblolly pine and slash pine. For. Ecol. Manag. 2007, 243, 219–230. [Google Scholar] [CrossRef]
- Jokela, E.J.; Martin, T.A. Effects of ontogeny and soil nutrient supply on production, allocation, and leaf area efficiency in loblolly and slash pine stands. Can. J. For. Res. 2000, 30, 1511–1524. [Google Scholar] [CrossRef]
© 2015 by the authors; licensee MDPI, Basel, Switzerland. This article is an open access article distributed under the terms and conditions of the Creative Commons Attribution license (http://creativecommons.org/licenses/by/4.0/).
Share and Cite
MDPI and ACS Style
Zou, W.-T.; Zeng, W.-S.; Zhang, L.-J.; Zeng, M. Modeling Crown Biomass for Four Pine Species in China. Forests 2015, 6, 433-449. https://doi.org/10.3390/f6020433
AMA Style
Zou W-T, Zeng W-S, Zhang L-J, Zeng M. Modeling Crown Biomass for Four Pine Species in China. Forests. 2015; 6(2):433-449. https://doi.org/10.3390/f6020433
Chicago/Turabian StyleZou, Wen-Tao, Wei-Sheng Zeng, Lian-Jin Zhang, and Ming Zeng. 2015. "Modeling Crown Biomass for Four Pine Species in China" Forests 6, no. 2: 433-449. https://doi.org/10.3390/f6020433