Article

China’s National Monitoring Program on Ecological Functions of Forests: An Analysis of the Protocol and Initial Results

1
Ministry of Education Key Laboratory for Earth System Modeling, Center for Earth System Science, Tsinghua University, Beijing 100084, China
2
Ministry of Education Key Laboratory for Silviculture and Conservation, Beijing Forestry University, Beijing 100083, China
3
Department of Forestry Engineering, Gansu Forestry Technological College, Gansu 741020, China
*
Author to whom correspondence should be addressed.
Forests 2015, 6(3), 809-826; https://doi.org/10.3390/f6030809
Submission received: 8 January 2015 / Revised: 10 March 2015 / Accepted: 16 March 2015 / Published: 19 March 2015

Abstract

:
Information on the ecological functions of forests is important for sustainable forest management. In this study, we introduced the national monitoring program which has been used in China to evaluate the overall health status and ecological functions of forests. We also compared it to similar monitoring programs operating in Europe and the United States of America. We revealed the strength and drawbacks of China’s monitoring program by analyzing the initial evaluation results. Our analysis showed that among the three programs, the European program gives the most detailed measurements of conditions of forests while the U.S. program generates the most detailed information on individual trees. In comparison, China’s monitoring program has a higher spatial resolution but is narrowly focused on trees and uses coarse classifications of indicators. The health status of forests in China suggested that more resources should be invested to improve the health of existing forests, especially plantations. The limitations in China’s monitoring program need to be addressed to improve the accuracy of future assessments.

1. Introduction

Forests can provide a multitude of ecological functions, many of which have long been valued by human beings, such as the supply of natural resource products, purification of water and air, and provision of wildlife habitats [1]. At a time of rapid climate change, functions such as carbon storage and sequestration are of increasing importance [2,3,4]. Planting and conserving forests are listed as major mitigation measures in the Kyoto Protocol and the Cancun Agreements [5,6]. The loss of healthy forests degrades these key ecological functions [7]. Therefore, one important goal of forest management is to maintain the health of forests thereby ensuring a sustainable supply of these ecological functions. As the first step, the status of the forest ecosystems must be monitored and assessed regularly. Obtained information forms the basis for designing forestry policies and programs that maintain and enhance the ecological functions of forests. The information is also needed by the responsible agencies to evaluate management effectiveness.
The statuses of forest ecosystems at or above the national level have been assessed as one-time survey programs [8], dedicated monitoring programs [9], or as a part of the national forest inventory programs [10]. For one-time survey programs, snapshots of forest ecosystems can be captured and the information can serve as the reference point for future investigations. The comprehensive monitoring program conducted in Panama is a good example. It provided baseline information about the forest ecosystem in the Panama Canal area when the management rights were transferred [8]. Compared to a one-time survey, dedicated monitoring programs and incorporation with the national forest inventories are more desirable as changes in forest ecosystems can be tracked over time. In Europe, the status of forest ecosystems in 42 countries has been assessed annually through the collaboration between the European Union and the International Co-operative Programme on Assessment and Monitoring of Air Pollution Effects on Forests (EU/ICP Forests) since 1985 [11]. The United States started Forest Health Monitoring (FHM) programs in 1990 to generate periodic reports on forest health status and trends [12]. The FHM program was integrated with the Forest Inventory and Analysis (FIA) program in 1999 [10]. Australia and Canada have also set up long-term monitoring programs [13,14].
The State Forestry Administration of China (SFA) established China’s national forest inventory system in 1973 and conducts an inventory every five years. Eight inventories have been completed to date. Information gathered in the first six inventories was largely aimed at managing the production of timber and other non-timber forest products [15]. Forest management in China has converted from timber-centered only to focus on both wood production and ecological functions at the beginning of the 21st century [16]. As a result, major changes were made in the seventh national forest inventory, conducted between 2004 and 2009, by adding components that monitored the health status and ecological functions of forest ecosystems [17].
So far, the SFA has released limited information to the general public on the health status and functions of forest ecosystems in China assessed in the seventh and the eighth national forest inventories. Except for announcing estimates of the average health status and ecological functions at the national level, the SFA does not make the protocol used by the agency to conduct the assessment available to people outside of the agency. There are questions on how to interpret the results. How are the status and functions of forest ecosystems monitored? What are the limitations of the monitoring program? What can the forestry management department learn from the results? To the authors’ knowledge, no study has been conducted to address these questions until now. Without a clear understanding of the protocol, it is difficult for researchers and policy makers worldwide to use this valuable information and to be fully informed of the status of the fifth largest forest area in the world.
In this study, we analyzed the monitoring program in China and compared it to other existing programs worldwide. Major objectives of the study included: (1) to provide an overview of China’s monitoring program; (2) to compare it to similar programs in Europe and the USA; (3) to analyze the strength and limitations of the current monitoring program and suggest improvements; and (4) to analyze the implication of the monitoring results to the forest management in China. The results of this study are not only useful for improving the evaluation and management of forest ecosystems in China but will also provide valuable information to other countries who want to implement similar forest monitoring programs.

2. Materials and Methods

2.1. Design of the National Forest Inventory

The national forest inventory was designed to cover the entire land area of China except for Hong Kong, Macao, and Taiwan. The inventory system follows a systematic sampling approach. Sample plots, including permanent ground plots and remote sensing interpretation plots, are located on 1-km grid cells. The usual size of the plots is 0.067 hectares but vary from 0.04 to 0.08 hectares in different provinces [15]. Different provinces have different number of permanent ground plots (e.g., 9076 plots on a 4 by 8 km grid in Heilongjiang Province, 12,936 plots on a 2 by 2 km grid in Ningxia Autonomous Region), which are decided by the total area of forest lands and the allowed sampling errors in each province [18]. The shapes of the permanent plots are square or rectangular [19]. The remote sensing interpretation plots are located on a 2 by 2 km grid throughout the country. The size of remote sensing interpretation plot is 90 by 90 m. In total, 41.5 × 10⁴ permanent ground plots and 284.44 × 10⁴ remote sensing interpretation plots are sampled throughout the nation. At each permanent ground plot, procedures listed in an internal publication, Technical Guide on National Forest Resource Inventory [20], are followed to collect information on trees and their growing environment. About 80 variables are collected from the permanent sample plot. Indicators used to assess the status of forest ecosystems are extracted from those variables. The quality of the data is checked by an independent team by randomly resampling 5% of all sample plots in the province. At each remote sensing interpretation plot, the land use types are interpreted visually by two technicians back-to-back from the Landsat image covering the plot. A rate of 90% of agreement between the two technicians is considered acceptable. Besides, 5% of remote sensing interpretation plots are randomly selected and the ground truth data for these plots are collected to derive the accuracy of interpretation in a province. At the national level, the SAF randomly inspects 1.5% of permanent ground plots and 2% of remote sensing interpretation plots after receiving the inventory data from each province and requires sample errors for collected variables to be lower than predefined thresholds [20].

2.2. Protocol for Monitoring Forest Health

The SFA protocol evaluates two composite indicators: health status of forests, and the ecological function index (EFI). The health status of forest ecosystems is estimated by grading the growth and development of trees, crown conditions, and forest health hazards (Table 1).
Table 1. Indicators and ratings for evaluating the health of forest ecosystems in China [20].
IndicatorRating
HealthySub-HealthyModerately HealthyUnhealthy
Tree growthTrees grow well, with strong stemsTrees grow relatively wellTrees grow fairlyTrees cannot grow and develop normally
Crown conditionSizes and colors of leaves are normalOccasionally yellow, discoloration, or early defoliation (<10%)Yellow, discoloration, or early defoliation (10%–30%)Severely yellow, discoloration, or early defoliation (>30%)
Fruiting and propagationNormalSome impacts Fruiting and propagation are restrictedFruiting and propagation failed
Hazards ratingnoNo or lightMediumSerious
The forest health hazard rating assigned to the forest is based on the types of health hazards and their impacts on standing trees (Table 2).
Table 2. Indicators and ratings for evaluating the impact of forest health hazards in China [20].
IndicatorRating
NoLightMediumSerious
Pests and diseasesAffect less than 10% of standing treesAffect 10%–29% of standing treesAffect 30%–59% of standing treesAffect more than 60% of standing trees
Forest firesNot disastrousAffect less than 20% of standing trees; regrowth is goodAffect 20%–49% of standing trees; regrowth is restrictedAffect more than 50% of standing trees, most trees are dying or dead
Meteorological disasters and othersNot disastrousAffect less than 20% of standing treesAffect 20%–59% of standing treesAffect more than 60% of standing trees
The percentages of forest areas in different health classes in a province are extrapolated linearly from the evaluation results of permanent ground plots surveyed in that province.
The EFI is estimated from eight attributes to indicate the ecological functions of forests in ground plots. All these attributes are commonly measured in forest monitoring programs except for naturalness. Naturalness here is defined as how close the current state of a forest ecosystem is to its expected natural state [21].
Grades are assigned to eight attributes of the forest stands (Table 3). The composite index is then derived from weighted grades by using an additive aggregation method.
Table 3. Grades and weights for indicators of forest ecological functions in China [20].
IndicatorsGradesWeight
123
Growing stock volume(m3 ha−1) a≥15050–149<500.2
Degree of naturalness1,23,450.15
Vertical structure1230.15
Species compositionC6, C7C3, C4, C5C1, C20.15
Total vegetation cover (%)≥7050–69<500.1
Canopy density≥0.70.4–0.690.2–0.390.1
Average tree height (m)≥15.05.0–14.9<5.00.1
Thickness of litters (cm)≥10.05.0–9.0<5.00.05
a The grade for growing stock volume of any bamboo forest was fixed as 2.
A grade of ecological functions is calculated as:
Y = i = 1 8 W i X i
where Xi is the grade of an indicator, Wi is the weight for that indicator.
The ecological function index K is calculated as the inversion of Y.
K = 1 Y
K has a value of ≤1. The larger the K the better the ecological function of a forest is.
Degree of naturalness is determined by using the indicators listed in Table 4. The community structure of a forest stand is classified into three categories using the criteria listed in Table 5. The species composition is evaluated and placed into one of seven categories using the indicators and criteria listed in Table 6.
Table 4. Criteria for judging degrees of naturalness for forests in China [20].
Degree of NaturalnessIndicators
1Primeval forests or forests with minimum anthropogenic influences
2Natural forests with obvious anthropogenic influences or secondary forests at late stages of succession; majority of species adapt well to the regional climate and climax tree species are existing
3Secondary forests with strong anthropogenic impacts, at the late stage of secondary succession; except for pioneer tree species, occasionally climax tree species can be found
4Secondary forests with very strong anthropogenic impacts, at stages of retrogressive succession
5Very strong and consistent anthropogenic impacts; forest cover is minimum, at late stages of reverse succession, include all plantations
Table 5. Criteria for classifying the vertical structure of a forest stand to the different categories [20].
CategoriesCriteriaCode
IntactWith tree layer, understory, and ground cover(include herbaceous plants, mosses, and lichens)1
Close to intactWith tree layer and one other layer2
SimpleWith only tree layer3
Table 6. Criteria for assigning the species composition of a forest stand to the different categories [20].
CategoriesIndicators
C1Single-species conifer monoculture forests (A single conifer species contributes to ≥90% of the growing stock of the stand)
C2Single-species broadleaf monoculture forests (A single broadleaf species contributes to ≥90% of the growing stock of the stand)
C3Conifer monoculture forests (A single conifer species contributes to 65%–90% of the growing stock of the stand)
C4Broadleaf monoculture forests (A single broadleaf species contributes to 65%–90% of the growing stock of the stand)
C5Mixed conifer forests (Conifer species contribute to ≥65% of the growing stock of the stand)
C6Mixed conifer-broadleaf forests (conifer or broadleaf species contribute to 35%–65% of the growing stock of the stand)
C7Mixed broadleaf forests(Broadleaf species contribute to ≥65% of the growing stock of the stand)
The values of the EFI of ground plots in a province are averaged to give the value of the index at a province scale.

2.3. Analysis of the Initial Assessment Results and Comparison with Other Monitoring Systems

We use the assessment results from the seventh national forest inventory to explore the major factors that affect the estimated health status and ecological conditions of forests at the provincial levels. The main factors examined include forest cover rates, origins of the forests, and ages of the forests. We analyze the correlation between those factors and the health status qualitatively. We then use a backward regression model to analyze their relationships with the reported values of ecological function indices.
All data analysis in this study was implemented using R statistical software (version 3.1.0) R Development Core Team, Vienna, Austria.
Finally, we compare the indicators and their investigation methods used in China, Europe and the USA.

3. Results

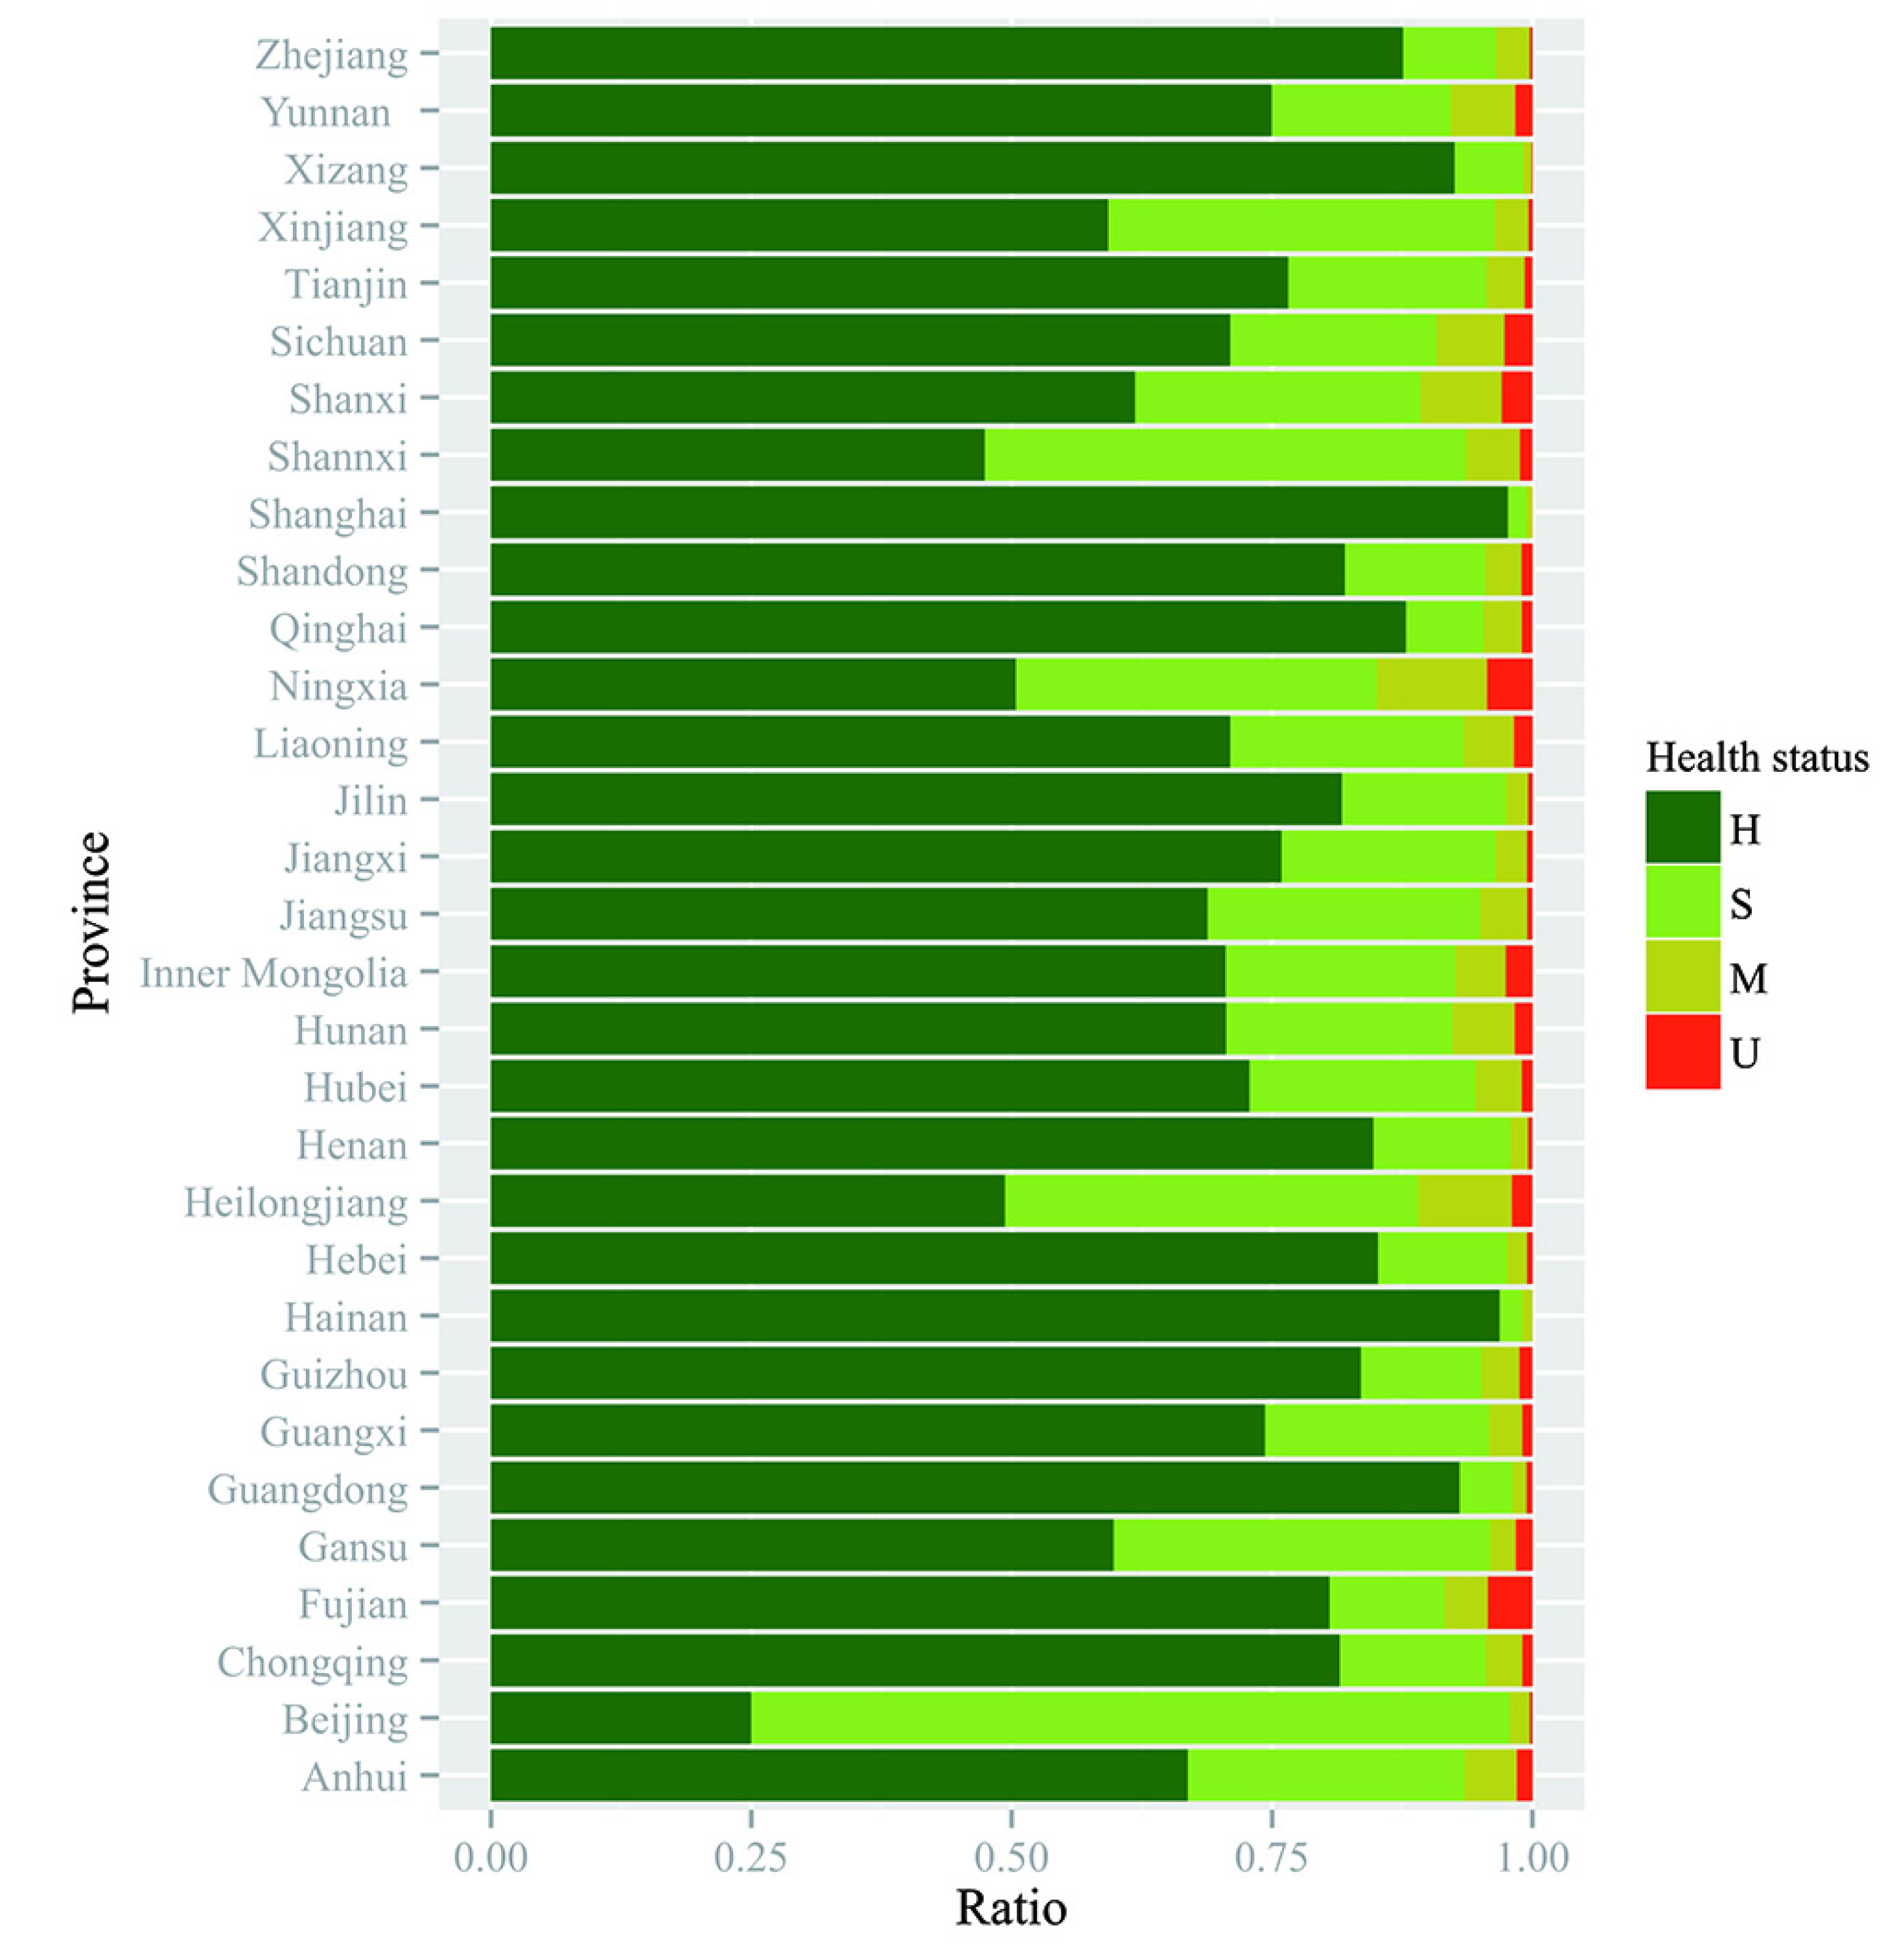
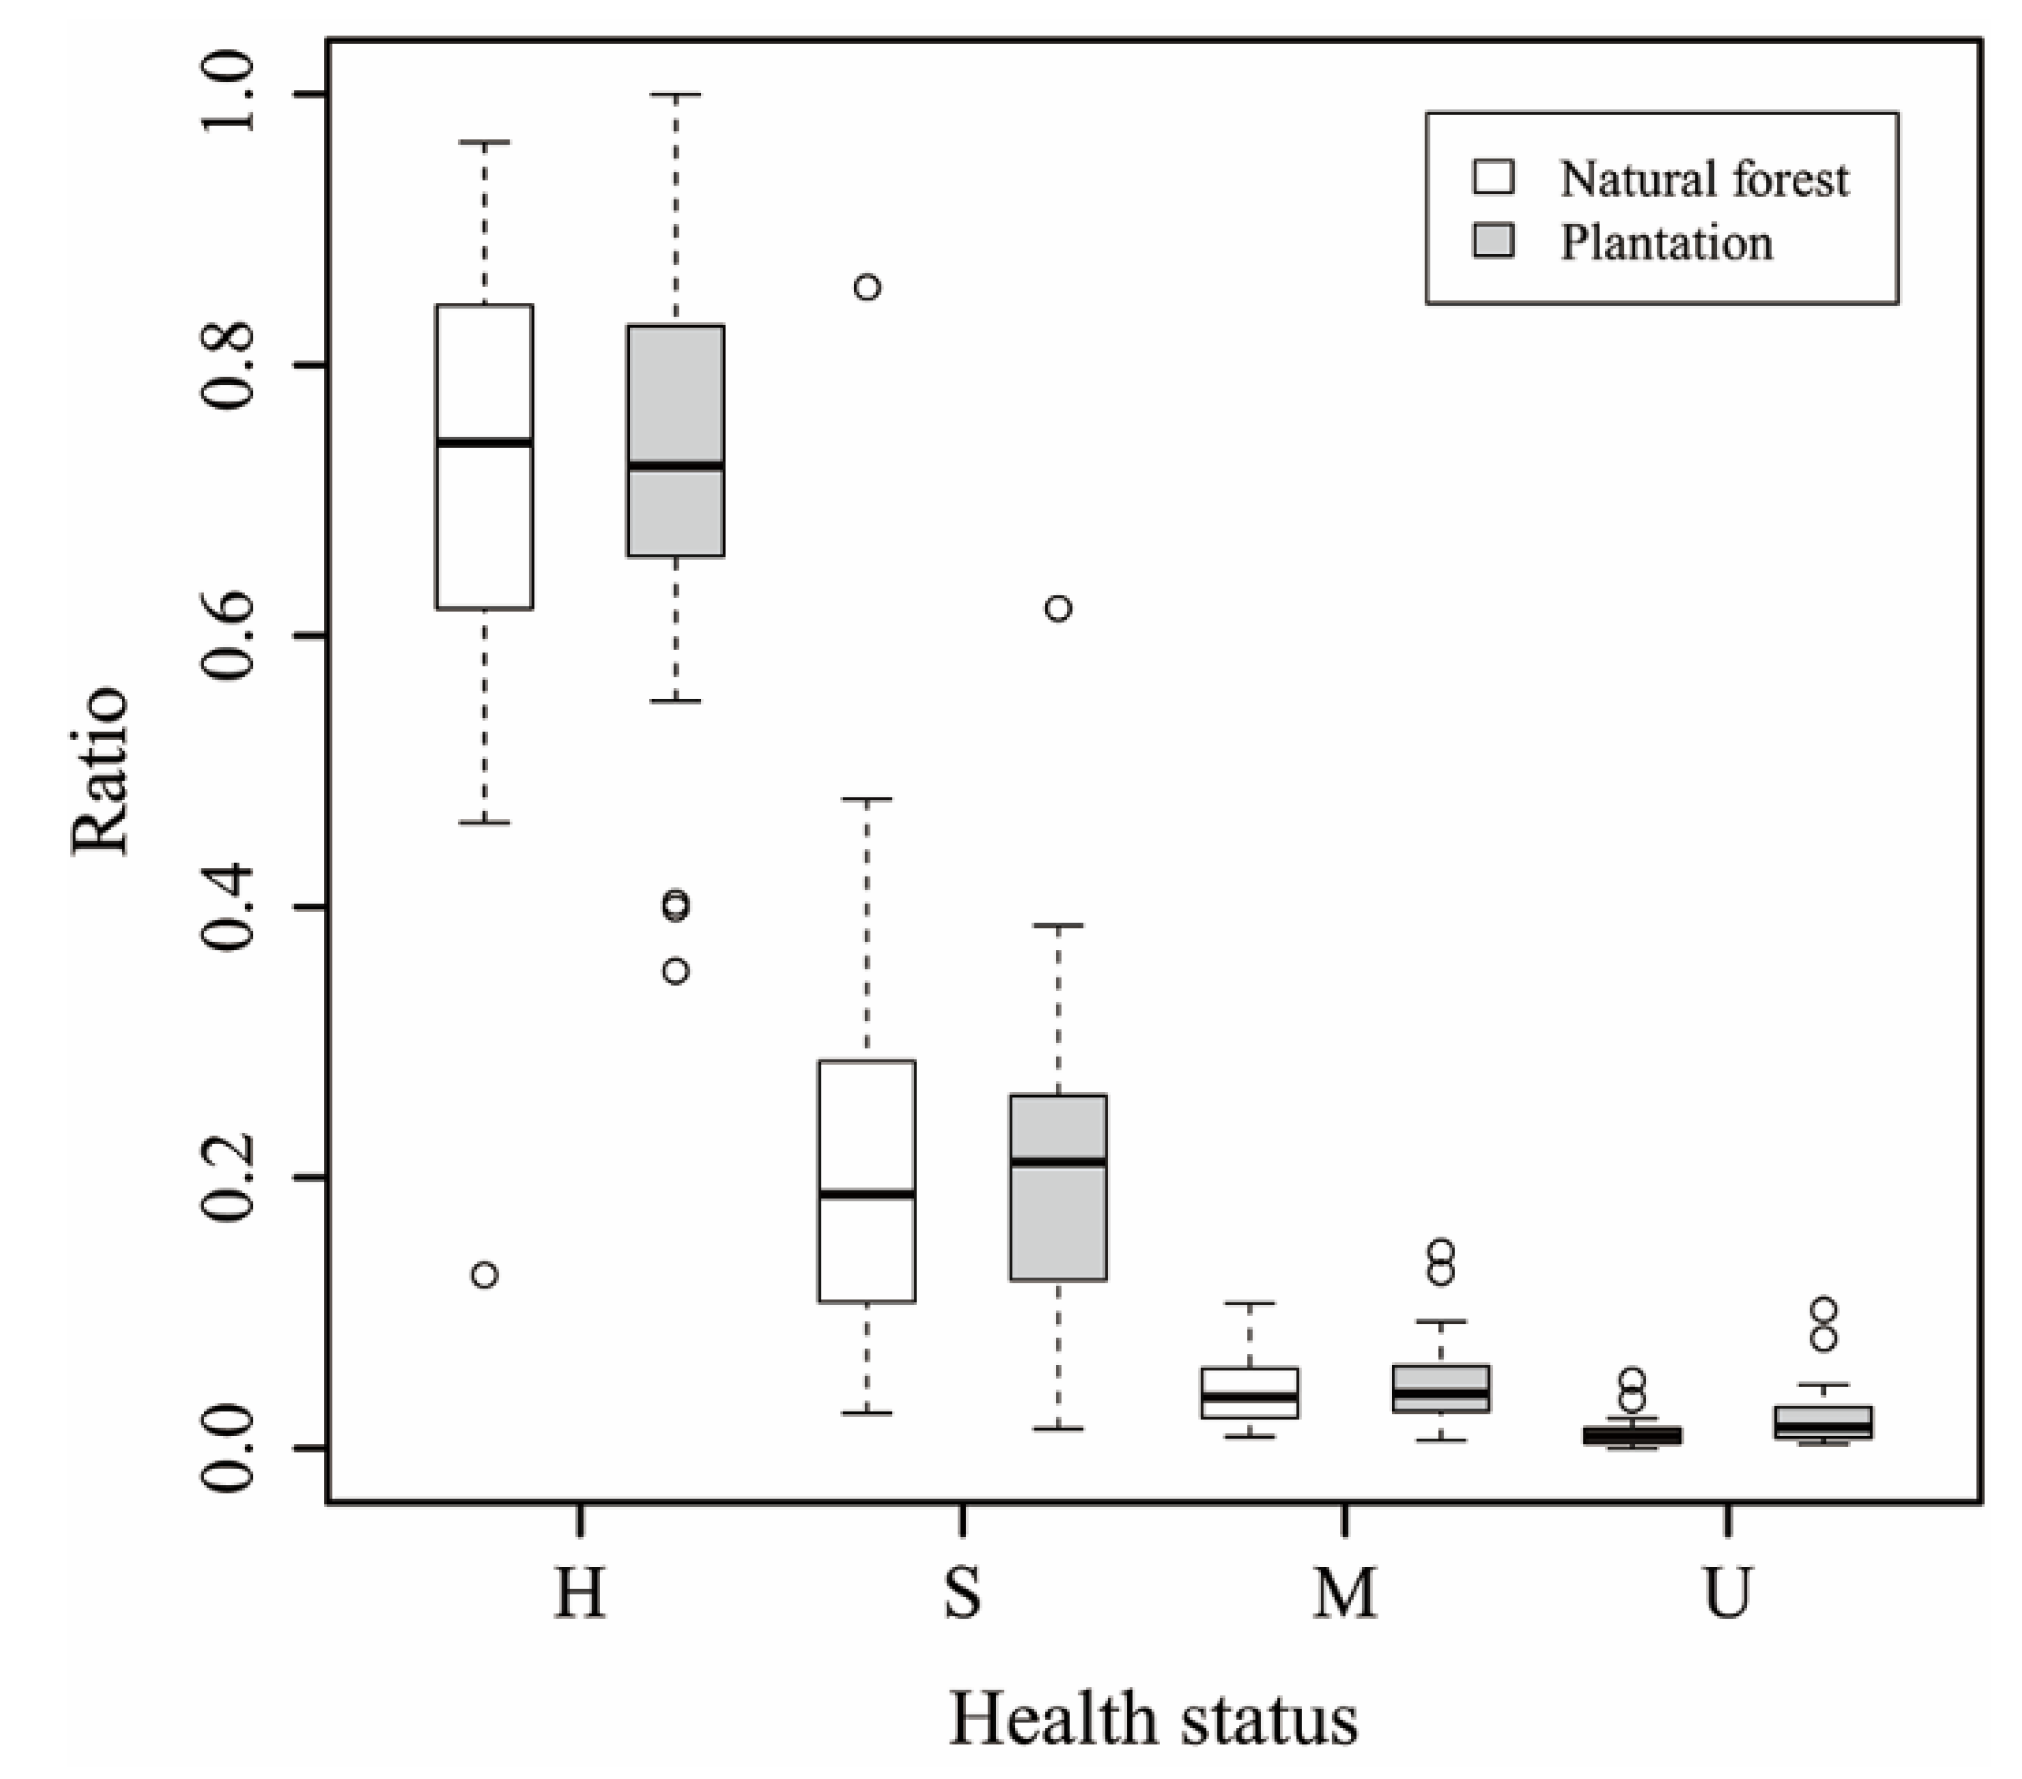
3.1. Overall Health Status and Ecological Condition of Forests in China

Results from the two recent national forest inventories showed that the most of the forests in China were healthy. In 2009, 72.3% of China’s forest areas were classified as “Healthy”, 21.4% as “Sub-healthy” class, 4.7% as “Moderately healthy” and 1.5% as “Unhealthy”. In 2014, forests classified as “Healthy” increased to 75% while 18% of forest areas were classified as “Sub-healthy” class, 5% as “Moderately healthy”, and 2% as “Unhealthy”. Forests with different origins and ages have different percentages of healthy forests (Table 7).
Table 7. Percentages of forests in different health classes by origins and age groups in 2009.
OriginHealth ClassAge Groups
Young ForestsMiddle-Aged ForestNear-Mature ForestMature ForestOvermature ForestAll
Natural forestHealthy73.669.470.177.371.172.0
Sub-healthy20.724.423.618.322.422.2
Moderately healthy4.44.95.03.45.44.6
Unhealthy1.31.31.20.91.01.2
PlantationHealthy78.473.668.062.848.573.4
Sub-healthy16.219.322.726.330.819.3
Moderately healthy3.74.96.57.212.25.0
Unhealthy1.72.22.83.78.42.3
The average EFI for forests was 0.50 and 0.55 in 2009 and 2014, respectively.

3.2. Factors Affecting the Estimated Values of Health Status and EFI

The health status of forest ecosystems in 2009 was further examined by using origins, age groups, and provinces as grouping factors. Overall, forests with natural origins, including primitive forests and natural secondary forests, had similar distribution of forests in different health conditions as those in plantations (Table 7). However, there were differences between the natural forests and plantations when the age groups of forests were considered. Age groups were designated by looking at forest uses and dominant species [22]. Forests that are used for producing timbers are considered as mature when dominant species produce the maximum amount of timber or have maximum economic value. Forests that are used for producing ecosystem services are considered as mature when dominant species reach their natural mature ages. The results showed that a high percentage of natural forests were still healthy when they reached the overmature stage while plantations had relatively low percentages of forests in the “Healthy” class at mature and overmature stages.
Ningxia Autonomous Region had the highest percentage of “Unhealthy” forests—4.3% of its forest areas—of all the provinces. Shanghai had the highest percentage of “Healthy” forests at 97.6%. However, as all the forests in Shanghai were plantations, it should be treated as an exceptional case. Hainan Province, Guangdong Province and Xizang Autonomous Region (Xizang) had the highest percentages of forests in the “Healthy” category when Shanghai was excluded (Figure 1). The ratios of different health classes in natural forests were similar to those of plantations (Figure 2). Among the 28 provinces, Hainan Province had the highest percentage of “Healthy” natural forests at 96.5%. Xizang had the highest percentage of “Healthy” plantations at 100%.
Figure 1. Status of forest health in China as measured in the seventh national forest inventory. “H” represents healthy; “S” represents sub-healthy; “M” represents moderately healthy; “U” represents unhealthy.
Forests 06 00809 g001
Figure 2. Health status of natural forests and plantations in China. “H” represents healthy; “S” represents sub-healthy; “M” represents moderately healthy; “U” represents unhealthy.
Forests 06 00809 g002
The backward regression analysis identified three significant variables: the forest cover rate of the province, the percentage of matured natural forests, and the percentage of overmature natural forests. Provinces with higher forest cover rates tended to have higher EFI (coefficient = 0.001, p-value < 0.01). Also, provinces with higher percentages of matured natural forests tended to have higher values of EFI (coefficient = 1.215, p-value < 0.01). However, provinces with higher percentages of overmature natural forests tended to have lower values of EFI (coefficient = −0.643, p-value < 0.01). For example, the percentage of matured natural forests was 38.1% in Xizang, which was the highest among all provinces. The region also had the highest value of EFI. The percentage of matured natural forests in Shanghai was 0 and it had the lowest value of EFI among all provinces. The adjusted R2 for the overall fit was 0.828, which indicated that the three variables explained a large portion of variation in the values of EFI.

3.3. Comparison with the EU and USA Programs

The EU/ICP Forest program monitors crown condition and forest damage in 7000 level I plots and around 15 indicators in 500 level II plots in 2012 [11]. The FHM program plans to monitor six forest health indicators in about 8000 permanent forest plots distributed in 50 states [10,23]. Some key ecosystem processes, such as nutrient cycling, will be continuously measured in 21 ecosystem index sites across the USA [24]. Among the three programs, the EU/ICP Forest program monitors more site factors than other two programs (Table 8).
Table 8. Comparisons of forest health indicators used by SFA [20], EU/ICP Forests [11], and FHM [23,24].
CategoriesIndicators
SFAEU/ICP Forests aFHM
VegetationTree growthTree growthCrown condition
Crown conditionCrown conditionDown woody materials
Fruiting and propagationFoliar chemistryVegetation diversity
Ground vegetationLichen communities
Deadwood
Phenology
Litterfall
SoilNASoil conditionForest soils
Soil chemistry
Environmental factorsNAAmbient air qualityNA
Deposition
Meteorology
StressesHazard ratingOzone induced injuryOzone injury
a Indicators that have been monitored in level I plots are shown in italics. All indicators are monitored in level II plots; State Forestry Administration of China, SFA; European Union and the International Co-operative Programme on Assessment and Monitoring of Air Pollution Effects on Forests, EU/ICP Forests; Forest Health Monitoring programs, FHM.
Besides the difference in types of monitored factors, the methods used to obtained factors common in all programs differed significantly in the degree of details. For example, the crown condition is a factor monitored in all three programs. The EU/ICP Forests program and FHM program both have detailed instruction on how to measure this factor while the SFA program has the most coarse evaluation procedure (Table 9).
Table 9. Metrics and methods for evaluating crown conditions used in SFA [20], EU/ICP Forests [25], and FHM [26] programs.
SystemsMetricsEvaluating Methods
SFASize of leavesVisual assessment: normal and abnormal
Leaf colorVisual assessment: 3 classes, <10%, 10%–30%, >30%
DefoliationVisual assessment: 3 classes, <10%, 10%–30%, >30%
EU/ICP Forests aDefoliationVisual assessment: in 5% steps, such as 0, 5 (>0%–5%), and so on
Specification of affected partVisual assessment: need to report the affected parts and the location in the crown
SymptomVisual assessment: use 67 codes
Causal agents or factorsVisual assessment: use a hierarchical coding system
Scientific name of causeVisual assessment: use 7-digit codes of scientific names
Extent and quantificationVisual assessment: extent classes in 10% steps
FHMVigor classVisual assessment: 3 classes, good, medium, and poor
Uncompacted live crown ratioLive crown length divided by the actual tree length
Crown light exposureVisual assessment: recorded in values from 0 to 5
Crown diameterThe arithmetic mean of two crown axes
Crown densityVisual assessment: recorded in five-percent classes
Crown diebackVisual assessment: recorded in five-percent classes
Crown positionVisual assessment: recorded in codes 1, 2, 3, 4
Foliage transparencyVisual assessment: recorded in five-percent classes
a Only the mandatory variables of crown condition are included here. State Forestry Administration of China, SFA; European Union and the International Co-operative Programme on Assessment and Monitoring of Air Pollution Effects on Forests, EU/ICP Forests; Forest Health Monitoring programs, FHM.

4. Discussion

4.1. The Strength and Limitations of China’s Monitoring Program

The comparison of three monitoring systems shows that the SFA program has some unique features. First, it has a higher spatial resolution than other two programs. The SFA program is based on data collected from 41.5 × 10⁴ ground plots every five years. The size of monitored plots was 28 times and 52 times of those monitored by EU/ICP Forests program and FHM program, respectively. Secondly, the SFA is the only program which regularly assesses ecological functions of forests at a national scale. Lastly, all the indicators used in the SFA assessment protocols are visually assessed and collected along with the national forest inventory. This practice significantly reduced costs and time. The higher spatial resolution resulted from the SFA program is necessary for China because China’s forests are more fragmented and varied than forests in the USA [27].
Nevertheless, compared with the EU/ICP Forests and FHM protocols on monitoring forest health, the SFA protocol has some obvious limitations. Of the three systems, the EU/ICP Forest program gives the most detailed measurements of these conditions by including indicators of soil and atmospheric environments. The FHM method does not measure the atmospheric system directly but the changes in the lichen community serve as an indirect measurement of air quality [24]. The SFA protocol focuses primarily on the conditions of trees which prevents it from providing a comprehensive assessment of the health of the forest ecosystem. Another limitation of the SFA protocol is the coarse classification of indicators. This can be illustrated using crown conditions as an example since this indicator is used in all three systems. The FHM method and The EU/ICP Forests method gave more detailed description of tree crown conditions than the SFA protocol does [25,26]. The SFA protocol does not have detailed instructions which allow varied interpretations and a high degree of subjectivity. Finally, in order to ensure the reliability of data, calibration and quality test of the monitoring program must be in place. EU/ICP Forests and FHM have devoted great efforts in these aspects [28,29,30] while the SFA protocol still needs to develop a more detailed procedure for calibration and quality testing.
The functional traits of the forest can be used to represent the status of the forest ecological functions as long as they are proven to affect ecosystem processes and functions [31]. Among the eight attributes that the SFA used for constructing the EFI, the indicative value of growing stock volume, species composition, average tree heights, vertical structure, canopy density and the thickness of litters are well understood [32,33,34,35,36]. The indicative value of total vegetation cover and naturalness is less clear because their relationships with ecological functions have not been widely studied [31,37].
The method used to calculate the composite indicator also has a strong influence on the soundness of the indicators. Grading criteria (Table 3) for the eight indicators were developed based on the result of the sixth national forest inventory. The use of national averaged values in SFA method neglects the natural variances in different forest types and regions. For example, structural attributes must be scored relative to the range of values occurring in a comparable vegetation community [33]. Besides, the grading criteria developed for assessing many attributes are too vague. For example, the criterion for healthy tree growth is that trees grow well. Although all field crews must receive training on how to grade the attributes and pass an exam before the survey, this vagueness still unavoidably leads to subjective judgments. The coarse and subjective grading criteria could have contributed to the “Fair” grade given to the majority of provinces. Weights for attributes were arbitrarily assigned based on the subjective judgments of the experts who designed this protocol. A more suitable way is to assign the weights through a sensitivity analysis [38].
These limitations should be addressed by revising the SFA method. There should be attributes of soils’ health. Detailed field guides for collecting each attribute should be standardized. Visual assessment methods and quality control programs for field investigations and post-processing work should be developed. The method used for estimating EFI needs to be reworked. Attributes with unclear or subjective indicative value, such as naturalness, should be dropped or measured using a carefully redesigned quantitative method similar to that of McRoberts et al. (2012). The qualitative attribute of species composition should be replaced by quantifiable variables such as species richness and species diversity. Correlation analysis should be conducted to determine the correlations among different attributes [39]. Criteria which are specific for different forest types or geographic regions should be developed to grade each indicator. The weighting system for attributes needs to be decided more objectively through sensitive analysis.

4.2. Health Status and Ecological Functions of Forests in China

China’s forest cover has experienced a rapid growth in the past two decades due to large-scale afforestation efforts—an average of 2 million ha year−1 in the 1990s and 3 million ha year−1 since 2000 [40]. The rapid expansion of forest covers in China has generated concerns about the ecological integrity of the created forest ecosystems [41,42,43]. The study provided information to address those concerns through linking the evaluation results to the growth characteristics of forests in China.
With the majority of forests classified as “Healthy”, the general condition of China’s forest ecosystems could be considered acceptable. However, the variations in health status of forest ecosystems among different groups and regions revealed potential problems. Natural forests consistently scored higher in health conditions than plantations, except for young plantations. Young plantations had better health because of the three- to five- year care after planting mandated by the government [44]. After the first three or five years, infrequent and poor maintenance practiced in most plantations contributed to their low grades in health conditions. Another factor is the common practice of using fast-growing monoculture in plantations which makes them more vulnerable to biotic and abiotic stresses than natural forests [45,46]. Plantations in Inner Mongolia and Ningxia were graded low in health conditions. A large number of plantations in those two provinces have been planted in arid regions and regions with high degrees of desertification. Two questions have been raised as the results of these observations. First, should fast-growing tree species be used in afforestation in these regions? Second, should those regions be afforested at all [42,47,48]? While this study did not allow for detailed analysis of the suitability of these regions, it did show that plantations in these regions were not in good health.
It was found that only 1.5% of forests were classified as “Unhealthy”. However, a notable 26.1% of China’s forests were classified as “Sub-healthy” and “Moderately healthy”. Forests in these two categories have been damaged by forest health hazards, including pests and diseases, forest fires, and extreme weather events. Pests and diseases killed 40 million forest trees in China annually between 2006 and 2010 and caused direct economic losses of RMB 110 billion [49]. Forest fires damaged 6.5% of forests in China annually [50]. There has also been an increase in extreme weather events, such as snowstorms and droughts [51,52]. Forestry management agencies must develop effective prevention and damage-control programs in order to prevent the further degradation of affected forests and to improve the overall health conditions of China’s forest ecosystems.
Given the average EFI of 0.5–0.55, and the fact that most provinces had a rating of “Fair”, it can be concluded that forest ecosystems in China were not optimally structured for supplying ecological functions. In general, mature forests provide more ecological functions than young forests of the same origin because of the higher structural complexity [53]. Natural forests tend to have better ecological functions than plantations due to higher species diversity and more complex structures [35]. The national inventory showed that 12 out of 31 provinces had more than 50% young forests. Plantations accounted for more than 50% of the total forest areas in eight provinces. Other factors such as lack of science-based management practices also contributed to the low EFI values [54].

4.3. Implications for Forest Management in China

The monitoring results provide important information for China’s forestry policy makers and management agencies. First, in order to improve the health and ecological functions of China’s forests, a balance must be achieved between planting new forests and after-planting care. Past forestry policies focused too heavily on adding new forests and neglected the importance of maintaining existing forests. For example, between 2004 and 2008, 99% of the central government’s funds allocated to the forestry sector were invested in afforestation. In 2009 was the first time that China’s central government specifically allocated funds for maintaining the forests, allocating 500 million RMB (80 million USD). While this seems to be a significant amount, the number is negligible when compared to the investment in afforestation at the same time, which was 70 billion RMB (11 billion USD) [55]. More resources should be invested in maintaining forests in China to improve their health and ecological functions.
Secondly, the fact that the health status of plantations decline as they mature should be of great concern. China has the largest area of plantations in the world. In 2010, the total area of plantations reached 62 million ha, 37% of the total forest areas [40]. The government considers plantations an important means for solving the timber shortage problem and reducing the country’s reliance on imported timber [56]. The poor health condition of plantations is a serious problem as it lowers the yield and quality of timber. The result of the seventh national survey showed that the average growing stock of plantations in China was 34.76 m3 ha−1. The number was only one third of the average growing stock reported for commercial species in Europe [57]. Obviously, many management measures need to be implemented to improve the productivity of the plantations.
The current policies aimed at preserving natural forests should be not only sustained but strengthened. Faced with the drastic degradation of forests caused by excessive logging, China announced a series of policies at the end of the 20th century to protect natural forests. The most important policy is the National Forest Conservation Project, implemented in 1998, which enforces a logging ban on natural forests located in ecologically sensitive areas [58]. A classification-based management system was also set up to manage forests separately for timber production or for ecosystem services, depending on their classifications as commercial forests or ecological forests [16]. This study showed that the policies should be effective. Provinces with more natural forests scored higher in EFI. Natural forests, in general, had better health than plantations. However, practices such as cutting down natural forests to make room for high-value rubber and eucalyptus plantations still happened frequently in many regions [59,60]. Considering the multiple ecological functions provided by natural forests, the central government should consider expanding the logging ban to more natural forests, especially those with high EFI value.

5. Conclusions

We analyzed the forest health monitoring program in China and the monitoring results in this study. Our results showed that China’s monitoring program has its unique strength but also limitations. The initial monitoring results revealed a significant correlation between the health status and ecological functions of forests in a given province and the overall forest cover rate, origins of forests, and the ages of forests. Provinces with high percentages of matured natural forests tended to be healthier and have optimal ecological functions. Another important discovery was the negative correlation between health conditions of plantations and maturity; older plantations were less healthy.
The results of this study provide important information for China’s forest management program. Investing more in maintaining existing forests, improving the health of plantations, and preserving natural forests will improve the health and ecological functions of China’s forest ecosystems. While the monitoring program in China contains unique features that are not present in other established programs, more studies need to be carried out to examine the selection of indicators and the methods used to construct the composite indexes. Finally, the current study only addressed the health and ecological functions of China’s forest ecosystems at the province level and above because data from the local level are still not declassified for public use. More detailed analysis that relates the health and ecological functions of forests to local-scale variations in biotic and abiotic factors and management practices is needed for designing more specific and focused forest management programs. It is our hope that the SFA will make more data available in the future to allow for further studies.

Acknowledgment

We thank Min Zhang from the State Forestry Administration of China, Guohua Huang and Weisheng Zen from the Chinese Academy of Forest Inventory and Planning, and Yongfu Chen from the Research Institute of Forest Resource Information Technology, Chinese Academy of Forestry Science for providing the data and many constructive suggestions on this study. We thank the two anonymous reviewers for their constructive comments on the manuscript. This project was supported by grants from the National Natural Science Foundation of China (Grant No. 31270678) and the State Forestry Administration of China (Grant No. 2011473).

Author Contributions

Jun Yang conceived and designed the study; Guanghui Dai and Jun Yang analyzed the data. Shurong Wang wrote the paper together with Jun Yang.

Conflict of interest

The authors declare no conflict of interest.

References

  1. Führer, E. Forest functions, ecosystem stability and management. For. Ecol. Manag. 2000, 132, 29–38. [Google Scholar] [CrossRef]
  2. Sedjo, R.A. Forests: A tool to moderate global warming? Environ. Sci. Policy Sustain. Dev. 1989, 31, 14–20. [Google Scholar] [CrossRef]
  3. Richards, K.R.; Stokes, C. A review of forest carbon sequestration cost studies: A dozen years of research. Clim. Chang. 2004, 63, 1–48. [Google Scholar] [CrossRef]
  4. Makkonen, M.; Huttunen, S.; Primmer, E.; Repo, A.; Hildén, M. Policy coherence in climate change mitigation: An ecosystem service approach to forests as carbon sinks and bioenergy sources. For. Policy Econ. 2015, 50, 153–162. [Google Scholar] [CrossRef]
  5. Schulze, E.D.; Wirth, C.; Heimann, M. Managing forests after Kyoto. Science 2000, 289, 2058–2059. [Google Scholar] [CrossRef] [PubMed]
  6. Bosetti, V.; Rose, S.K. Reducing carbon emissions from deforestation and forest degradation: Issues for policy design and implementation. Environ. Devel. Econ. 2011, 1, 1–4. [Google Scholar]
  7. Foley, J.A.; Asner, G.P.; Costa, M.H.; Coe, M.T.; DeFries, R.; Gibbs, H.K.; Howard, E.A.; Olson, S.; Patz, J.; Ramankutty, N. Amazonia revealed: Forest degradation and loss of ecosystem goods and services in the Amazon basin. Front. Ecol. Environ. 2007, 5, 25–32. [Google Scholar] [CrossRef]
  8. Ibáñez, R.; Condit, R.; Angehr, G.; Aguilar, S.; García, T.; Martínez, R.; Sanjur, A.; Stallard, R.; Wright, S.J.; Rand, A.S.; et al. An ecosystem report on the Panama Canal: Monitoring the status of the forest communities and the watershed. Environ. Monit. Assess. 2002, 80, 65–95. [Google Scholar] [CrossRef] [PubMed]
  9. De Vries, W.; Vel, E.; Reinds, G.; Deelstra, H.; Klap, J.; Leeters, E.; Hendriks, C.; Kerkvoorden, M.; Landmann, G.; Herkendell, J. Intensive monitoring of forest ecosystems in Europe: 1. Objectives, set-up and evaluation strategy. For. Ecol. Manag. 2003, 174, 77–95. [Google Scholar] [CrossRef]
  10. McRoberts, R.E.; Bechtold, W.A.; Patterson, P.L.; Scott, C.T.; Reams, G.A. The enhanced forest inventory and analysis program of the USDA forest service: Historical perspective and announcement of statistical documentation. J. For. 2005, 103, 304–308. [Google Scholar]
  11. Fischer, R.; Waldner, P.; Carnicer, J.; Coll, M.; Dobbertin, M.; Ferretti, M.; Hansen, K.; Kindermann, G.; Lasch-Born, P.; Lorenz, M.; et al. The Condition of Forests in Europe: 2012 Executive Report; ICP Forests: Hamburg, Germany, 2012; p. 24. [Google Scholar]
  12. Alexander, S.A.; Palmer, C.J. Forest health monitoring in the United States: First four years. Environ. Monit. Assess. 1999, 55, 267–277. [Google Scholar] [CrossRef]
  13. Stone, C.; Wardlaw, T.; Floyd, R.; Carnegie, A.; Wylie, R.; de Little, D. Harmonisation of methods for the assessment and reporting of forest health in Australia—A starting point. Aust. For. 2003, 66, 233–246. [Google Scholar] [CrossRef]
  14. Gillis, M.D.; Omule, A.Y.; Brierley, T. Monitoring Canada’s forests: The national forest inventory. For. Chron. 2005, 81, 214–221. [Google Scholar] [CrossRef]
  15. Xie, X.; Wang, Q.; Dai, L.; Su, D.; Wang, X.; Qi, G.; Ye, Y. Application of China’s national forest continuous inventory database. Environ. Manag. 2011, 48, 1095–1106. [Google Scholar] [CrossRef]
  16. Dai, L.; Zhao, F.; Shao, G.; Zhou, L.; Tang, L. China’s classification-based forest management: Procedures, problems, and prospects. Environ. Manag. 2009, 43, 1162–1173. [Google Scholar] [CrossRef]
  17. Lei, X.; Tang, M.; Hong, L.; LU, Y. China. In National Forest Inventories: Pathways for Common Reporting; Tomppo, E., Gschwantner, T., Lawrence, M., McRoberts, R.E., Eds.; Springer: Berlin, Germany, 2010; pp. 113–129. [Google Scholar]
  18. Dong, Z.; Li, W. Discussion on the total number of sample plots used in the national forest inventory in east China. For. Resour. Manag. 1995, 12–15. [Google Scholar]
  19. Lei, X.; Hong, L.; Lu, Y.; Tang, M. A review on ground plot design for national forest inventory in the world. World For. Res. 2008, 21, 35–40. [Google Scholar]
  20. State Forestry Administration of China. Technical Guide on National Forest Resource Inventory; State Forestry Administration of China: Beijing, China, 2004; p. 135. [Google Scholar]
  21. McRoberts, R.E.; Winter, S.; Chirici, G.; LaPoint, E. Assessing forest naturalness. For. Sci. 2012, 58, 294–309. [Google Scholar]
  22. State Forestry Administration of China. Regulations for Age-Class and Age-Group Division of Main Tree-Species; State Forestry Administration of China: Beijing, China, 2012; p. 8. [Google Scholar]
  23. Potter, K.M.; Conkling, B.L. Forest Health Monitoring: National Status, Trends, and Analysis 2012; Southern Research Station, USDA Forest Service: Arlington, VA, USA, 2014; p. 213. [Google Scholar]
  24. Woodall, C.W.; Amacher, M.C.; Bechtold, W.A.; Coulston, J.W.; Jovan, S.; Perry, C.H.; Randolph, K.C.; Schulz, B.K.; Smith, G.C.; Tkacz, B.; et al. Status and future of the forest health indicators program of the USA. Environ. Monit. Assess. 2011, 177, 419–436. [Google Scholar] [CrossRef] [PubMed]
  25. Eichhorn, J.; Roskams, P.; Ferretti, M.; Mues, V.; Durrant, D. Visual assessment of corwn condition and damaging agents. Mannual part IV. Manual on Methods and Criteria for Harmonized Sampling, Assessment, Monitoring and Analysis of the Effects of Air Pollution on Forests; UNECE ICP Forests Programme Co-Ordinating Center: Hamburg, Germany, 2010. Available online: http://www.icp-forests.org/pdf/FINAL_Crown.pdf (accessed on 8 February 2015).
  26. Randolph, K.C. Phase 3 Field Guide- Crowns: Measurements and Sampling, Version 5.0. Available online: http://fia.fs.fed.us/library/field-guides-methods-proc/docs/2011/field_guide_p3_5–0_sec23_10_2010.pdf (accessed on 12 March 2012).
  27. Li, M.; Mao, L.; Zhou, C.; Vogelmann, J.E.; Zhu, Z. Comparing forest fragmentation and its drivers in China and the USA with Globcover v2.2. J. Environ. Manag. 2010, 91, 2572–2580. [Google Scholar] [CrossRef]
  28. Johnson, J.; Jacob, M. Monitoring the effects of air pollution on forest condition in Europe: Is crown defoliation an adequate indicator? iFor.-Biogeosc. For. 2010, 3, 86–88. [Google Scholar] [CrossRef]
  29. Ferretti, M.; König, N.; Granke, O. Quality assurance within the ICP forests monitoring programme. Manual Part III: Manual on Methods and Criteria for Harmonized Sampling, Assessment, Monitoring and Analysis of the Effects of Air Pollution on Forests; UNECE ICP Forests Programme Co-Ordinating Center: Hamburg, Germany, 2010. Available online: http://www.icp-forests.org/pdf/FINAL_part3.pdf (accessed on 1 February 2015).
  30. Randolph, K.C. Development history and bibliography of the US forest service crown-condition indicator for forest health monitoring. Environ. Monit. Assess. 2013, 185, 4977–4993. [Google Scholar] [CrossRef] [PubMed]
  31. Bennett, E.M.; Peterson, G.D.; Gordon, L.J. Understanding relationships among multiple ecosystem services. Ecol. Lett. 2009, 12, 1394–1404. [Google Scholar] [CrossRef] [PubMed]
  32. McRoberts, R.E.; McWilliams, W.H.; Reams, G.A.; Schmidt, T.L.; Jenkins, J.C.; O’Neill, K.P.; Miles, P.D.; Brand, G.J. Assessing sustainability using data from the forest inventory and analysis program of the United States forest service. J. Sustain. For. 2004, 18, 23–46. [Google Scholar] [CrossRef]
  33. McElhinny, C.; Gibbons, P.; Brack, C.; Bauhus, J. Forest and woodland stand structural complexity: Its definition and measurement. For. Ecol. Manag. 2005, 218, 1–24. [Google Scholar] [CrossRef]
  34. Kaspari, M.; Yanoviak, S.P. Biogeography of litter depth in tropical forests: Evaluating the phosphorus growth rate hypothesis. Funct. Ecol. 2008, 22, 919–923. [Google Scholar] [CrossRef]
  35. Nadrowski, K.; Wirth, C.; Scherer-Lorenzen, M. Is forest diversity driving ecosystem function and service? Curr. Opin. Environ. Sustain. 2010, 2, 75–79. [Google Scholar] [CrossRef]
  36. Shugart, H.H.; Saatchi, S.; Hall, F.G. Importance of structure and its measurement in quantifying function of forest ecosystems. J. Geophys. Res. G Biogeosci. 2010, 115. [Google Scholar] [CrossRef]
  37. Eichner, T.; Tschirhart, J. Efficient ecosystem services and naturalness in an ecological/economic model. Environ. Resour. Econ. 2007, 37, 733–755. [Google Scholar] [CrossRef]
  38. Nardo, M.; Saisana, M.; Saltelli, A.; Tarantola, S. Tools for composite indicators building. Eur. Comm.-Joint Res. Cent. 2005. Available on line: http://citeseerx.ist.psu.edu/viewdoc/download?doi=10.1.1.114.4806&rep=rep1&type=pdf. (accessed on 12 December 2014).
  39. Tierney, G.L.; Faber-Langendoen, D.; Mitchell, B.R.; Shriver, W.G.; Gibbs, J.P. Monitoring and evaluating the ecological integrity of forest ecosystems. Front. Ecol. Environ. 2009, 7, 308–316. [Google Scholar] [CrossRef]
  40. He, H.S.; Shifley, S.R.; Thompson, F.R., III. Overview of contemporary issues of forest research and management in China. Environ. Manag. 2011, 48, 1061–1065. [Google Scholar] [CrossRef]
  41. Cao, S.; Chen, L.; Shankman, D.; Wang, C.; Wang, X.; Zhang, H. Excessive reliance on afforestation in China’s arid and semi-arid regions: Lessons in ecological restoration. Earth-Sci. Rev. 2011, 104, 240–245. [Google Scholar] [CrossRef]
  42. Wang, X.; Wang, Y.; Wang, Y. Use of exotic species during ecological restoration can produce effects that resemble vegetation invasions and other unintended consequences. Ecol. Eng. 2012, 52, 247–251. [Google Scholar] [CrossRef]
  43. Ma, H.; Lv, Y.; Li, H. Complexity of ecological restoration in China. Ecol. Eng. 2013, 52, 75–78. [Google Scholar] [CrossRef]
  44. Standardization Administration of China. Artificial Afforestation Technical Regulation. In GB/T15776-2006; Standardization Administration of China: Beijing, China, 2006; p. 30. [Google Scholar]
  45. Ji, L.; Wang, Z.; Wang, X.; An, L. Forest insect pest management and forest management in China: An overview. Environ. Manag. 2011, 48, 1107–1121. [Google Scholar] [CrossRef]
  46. Stone, R. Natural disasters-ecologists report huge storm losses in China’s forests. Science 2008, 319, 1318–1319. [Google Scholar] [CrossRef] [PubMed]
  47. Cao, S.; Tian, T.; Chen, L.; Dong, X.; Yu, X.; Wang, G. Damage caused to the environment by reforestation policies in arid and semi-arid areas of China. Ambio 2010, 39, 279–283. [Google Scholar] [CrossRef] [PubMed]
  48. Cao, S. Impact of china’s large-scale ecological restoration program on the environment and society in arid and semiarid areas of China: Achievements, problems, synthesis, and applications. Crit. Rev. Env. Sci. Technol. 2011, 41, 317–335. [Google Scholar] [CrossRef]
  49. Song, Y. Evaluation of economic losses caused by forest pest disasters between 2006 and 2010 in china. For. Pest Dis. 2011, 6, 1–4. [Google Scholar]
  50. Zhong, M.; Fan, W.; Liu, T.; Li, P. Statistical analysis on current status of China forest fire safety. Fire Saf. J. 2003, 38, 257–269. [Google Scholar] [CrossRef]
  51. Shao, Q.; Huang, L.; Liu, J.; Kuang, W.; Li, J. Analysis of forest damage caused by the snow and ice chaos along a transect across southern china in spring 2008. J. Geogr. Sci. 2011, 21, 219–234. [Google Scholar] [CrossRef]
  52. Jiang, F.; Yu, Z.; Zeng, D.; Zhu, J. Effects of climate change on the three-north shelter forest program and corresponding strategies. J. Ecol. 2009, 28, 1702–1705. [Google Scholar]
  53. Ishii, H.T.; van Pelt, R.; Parker, G.G.; Nadkarni, N.M. Age-related development of canopy structure and its ecological functions. In Forest Canopies, 2nd ed.; Margaret, D.L., Rinker, H.B., Eds.; Academic Press: San Diego, CA, USA, 2004; pp. 102–117. [Google Scholar]
  54. Yu, D.; Zhou, L.; Zhou, W.; Ding, H.; Wang, Q.; Wang, Y.; Wu, X.; Dai, L. Forest management in northeast China: History, problems, and challenges. Environ. Manag. 2011, 48, 1122–1135. [Google Scholar] [CrossRef]
  55. Li, Y.; Jin, J.; Fang, D.; Chunlei, M. Study on the government investment in forestry and the forest source development. Issues For. Econ. 2012, 32, 440–449. [Google Scholar]
  56. Yang, H.; Nie, Y.; Ji, C. Study on China’s timber resource shortage and import structure: Natural forest protection program outlook, 1998 to 2008. For. Prod. J. 2010, 60, 408–414. [Google Scholar]
  57. Food and Agriculture Organization of the United Nations. Global Forest Resource Assessment 2010: Main Report; Forestry Department, Food and Agriculture Organization of the United Nations: Rome, Italy, 2010; p. 340. [Google Scholar]
  58. Yu, D.; Shi, P.; Han, G.; Zhu, W.; Du, S.; Xun, B. Forest ecosystem restoration due to a national conservation plan in China. Ecol. Eng. 2011, 37, 1387–1397. [Google Scholar] [CrossRef]
  59. Li, H.; Aide, T.M.; Ma, Y.; Liu, W.; Cao, M. Demand for rubber is causing the loss of high diversity rain forest in SW China. In Plant Conservation and Biodiversity; Hawksworth, D.L., Bull, A.T., Eds.; Springer: Amsterdam, The Netherlands, 2007; pp. 157–171. [Google Scholar]
  60. Yi, Z.; Cannon, C.H.; Chen, J.; Ye, C.; Swetnam, R.D. Developing indicators of economic value and biodiversity loss for rubber plantations in Xishuangbanna, southwest China: A case study from Menglun township. Ecol. Indic. 2014, 36, 788–797. [Google Scholar] [CrossRef]

