1. Introduction
Forest resource information is collected using sampling, measurements and models [
1]. Information is often required over vast, remote areas and thus remote sensing is used in addition to pure field sampling [
2,
3]. One of the commonest practices in remote sensing-aided forest mapping is to select field plot locations using sampling, measure forest inventory attributes, such as basal-area (G), mean diameter, and height from the field plots and then link field-measured forest inventory attributes and metrics derived from remote sensing data to develop predicative models further used in deriving forest attribute maps [
2,
4]. Accuracy of these maps essentially depends on the amount and quality of field plots, quality and applicability of remote sensing data, and accuracy of models. Field plots are the whole basis of this kind of forest mapping and, thus, their importance should be highlighted.
In many jurisdictions, field plots are rather expensive to measure, mostly due to lack of road network and labor costs. Robust and inexpensive measurement devices, such as calipers, measuring tapes, and hypsometers, are still mainly used for measuring trees from sample plots [
5,
6]. Measuring field plots is thus time-consuming, labor-intensive and often includes subjective elements. Time consumption is also greatly dependent on measurer, plot size and stand structure [
6]. Terrestrial and mobile laser scanning (TLS, MLS) are seen as alternative techniques for traditional field measurements in the near future [
5,
6,
7]. In addition, different kinds of photogrammetry-based or other camera-based measurement systems and applications have been tested in order to be used in forest inventories [
6,
8,
9,
10]. TLS is usually done from a tripod with a scanner unit. The tripod is placed in the desired location and the scanner measures the 3D locations of the objects within reach of it. Scanners measuring phase-shifts are mainly used on measuring individual trees or field plots, while “pulse scanners” can be used in mapping larger areas with a maximum distance of approximately one kilometer around the scanner location. TLS produces a dense point cloud from the surrounding trees. For example, with current phase-shift scanners, it takes 2–4 minutes to measure the surrounding area with a radius of 70–120 m, as the applied pulse density at a 10-m distance is still 6.3 mm. This corresponds to 25,000 points/m
2. From this dense point cloud, tree and stand variables such as location, height, crown coverage, species, and stem curves can be measured [
11,
12,
13,
14]. In MLS, global navigation satellite system (GNSS) and inertia measurement units (IMUs) linked to the scanning system, allow a collection of point clouds during movement. MLS platforms can vary from backpack to logging machine [
15,
16]. The drawbacks of laser scanning systems are related to the price of the required equipment (20,000 € or more for TLS) and the limited number of commercial programs for data processing of the point cloud data.
Different kinds of cameras have been also tested for forest field measurement. Varjo
et al. [
10] have studied the accuracy of diameter measurements at different heights of a tree stem with a simple digital camera (Canon PowerShot, Tokyo, Japan). A method was developed, where a tapering model [
17] was used to supervise the image interpretation. A laser distance-measuring device/indicator found the distance to the tree. A reference marker stick in front of each tree and trigonometry determined the geometry of the image plane of the camera in relation to the measured tree. The accuracy (RMSE) of diameter measurements was 7.0–9.4 mm and bias 0.6–2.8 mm, when the measuring height varied from 2.5 to 6.5 m. Melkas
et al. [
9] and Vastaranta
et al. [
6] tested a laser camera under typical boreal forest conditions. It was a Canon EOS 400D digital reflex camera with an integrated Mitsubishi ML101J27 laser line generator. It measured the diameters of trees from the center of a sample plot without having to visit them. However, the processing of the images required some manual elements. The standard error of diameter observations using semiautomatic interpretation was 6 mm (5.3%). The amount of bias was 2.5 mm, meaning the results obtained with the laser camera were slightly overestimated.
Digital cameras are nowadays often linked to smartphones. There are already apps using smartphone camera data to measure a forest sample plot or a stand. Such rapid, easy-to-use forest sample plot measurement apps have gained popularity among foresters and are being tested by various forest organizations. However, as far as the authors know, no scientific research results exist on their accuracy. The aim of this study is to test the accuracy of the TRESTIMA
TM app (See [
18] for further details) in measuring species-specific basal-area and diameter and height of the median tree from sample plots.
2. Material and Methods
2.1. Study Area
The study area is in Evo, Finland (61.19° N, 25.11° E), approximately 145 km from Helsinki. The area belongs to the southern boreal forest zone and comprises approximately 2000 ha of mainly managed forest. However, Evo is also a national hiking area, and thus represents a range of stand conditions from natural to intensively managed southern boreal forests. Stands are mainly even-aged and single layer, with an average size of slightly less than 1 ha. The elevation of the area varies from 125 to 185 m above sea level. Scots pine (Pinus sylvestris L.) and Norway spruce (Picea Abies (L.) H. Karst.) are the dominant tree species in the study area, 44.7% and 33.5% of the total volume, respectively. Deciduous trees are 21.8% of the total volume.
2.2. Sampling of the Field Plots
Extensive field measurements were carried out in the study area in summer 2014. The sampling of the field plots (32 m × 32 m, 1024 m
2) was based on airborne laser scanning (ALS) data. First, a systematic grid (32 m) was placed over the area and ALS metrics describing forest height and density were calculated for each grid cell. The derived ALS metrics were mean height of vegetation calculated from the canopy height model (CHM) and vegetation density at a height of 2 meters. Altogether, 120 sample plots were then selected with varying canopy heights and densities. This study used a subsample of 25 plots selected out of the 120 plots. The subsample aimed also to represent the whole height-density variation within the study area (
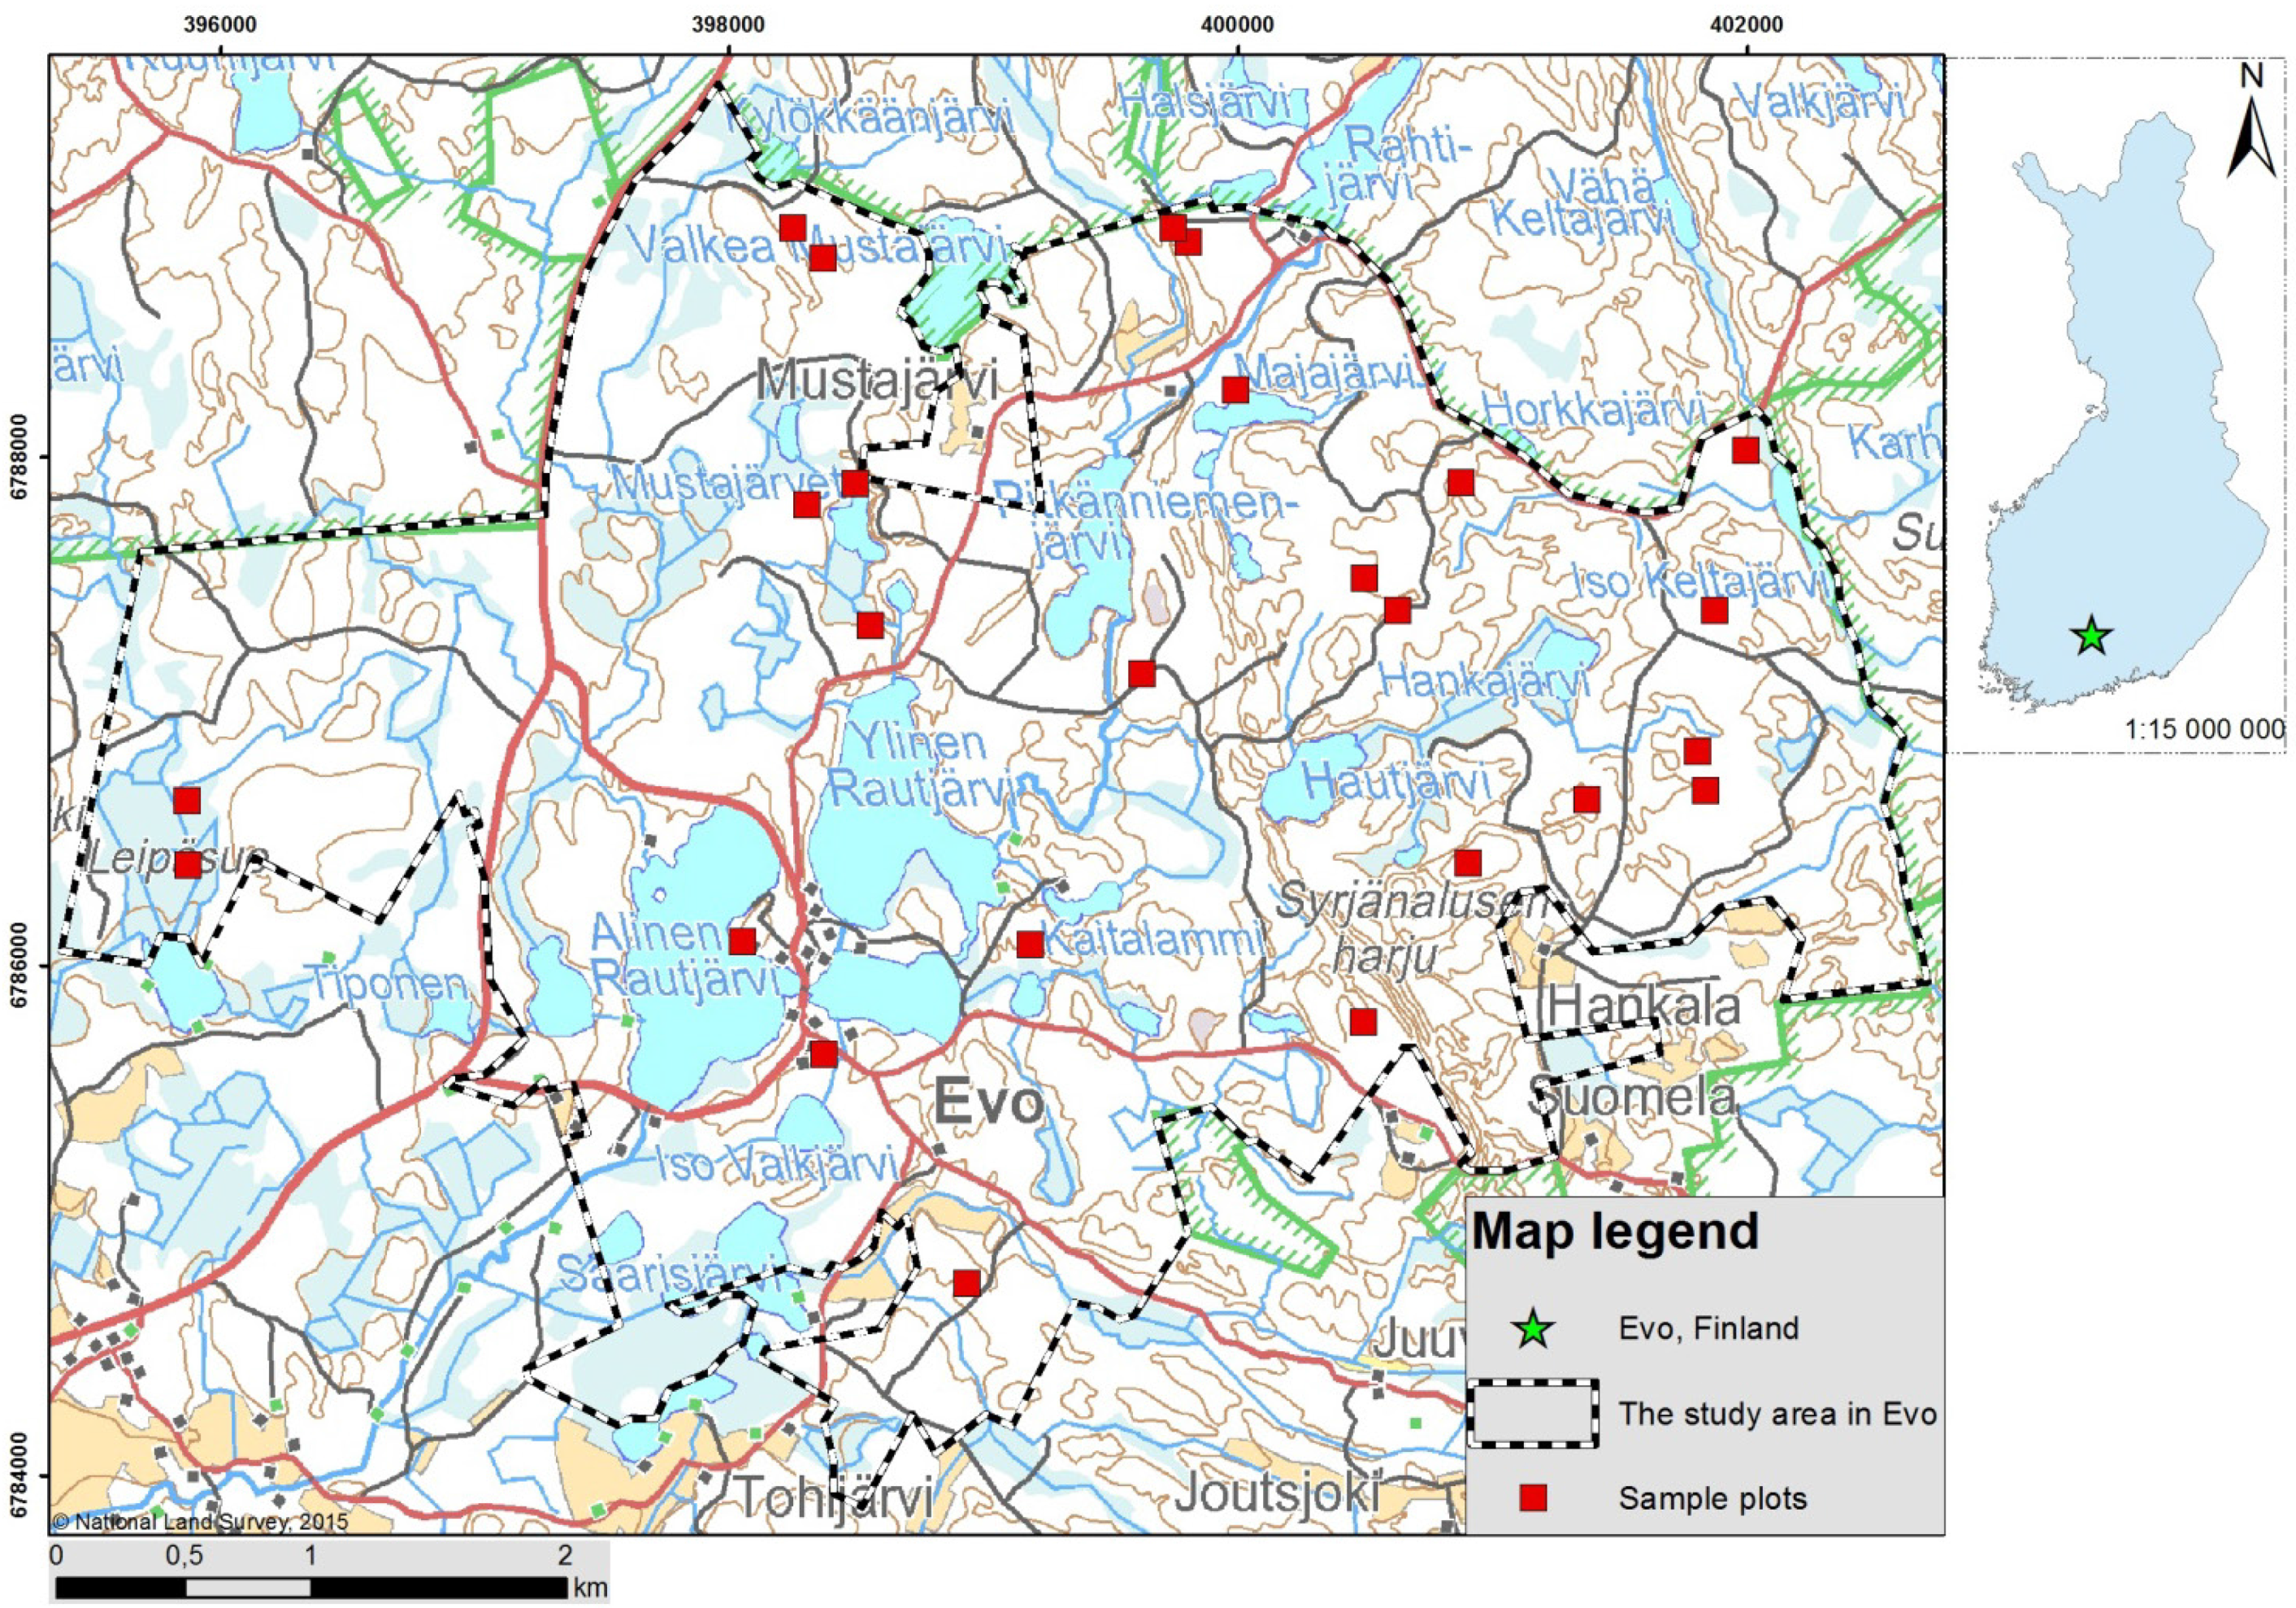
Figure 1) and covered a wide range of different forest conditions.
Figure 1.
Location of the study area and sample plots. Background map ©National Land Survey of Finland, 2015.
Figure 1.
Location of the study area and sample plots. Background map ©National Land Survey of Finland, 2015.
2.3. Reference Measurements of Sample Plots
The terrestrial laser scanner (TLS) was used to scan sample plots (1024 m2) and to obtain tree maps. TLS data from each sample plot from five scanner locations obtained dense point cloud covering the entire plot. One scanning location was in the center of the plot and four were on ordinal directions. We georeferenced TLS data to local and global coordinate systems using reference targets, GNSS, and total station measurements. Then we handled TLS point clouds to create tree maps for sample plots. Our purpose was to provide preliminary tree maps for further measurements.
Field crews checked that all trees in a sample plot were also on the tree map. When a tree was missing, its location was mapped and added to the tree map. All incorrect trees were deleted from the tree map. After mapping the trees, we determined their attributes, such as species, diameter-at-breast-height (dbh) and height. Calipers and electronic hypsometer (Haglöf Vertex, Långsele, Sweden) were used for dbh and height measurements. A stick with height of 1.3 m was used for consistent determination of the right height in the dbh measurements. Dbh was defined as the mean value of two perpendicular measurements.
The final reference data consist of 2169 measured trees from 25 sample plots. Scots pines and Norway spruces dominated sample plots. The data included 812 Scot pines, 807 Norway spruces, and 552 other tree species, of which 80% were birches (
Betula sp.). The measured
dbh varied from 5.0 cm to 57.9 cm with mean of 17.7 cm. Tree height varied between 2.3 m and 37.5 m.
Table 1 presents basic statistics from the sample plot measurements.
Table 1.
The statistics of the forest inventory attributes measured from the sample plots. Attributes included species-specific basal areas (G) and dbh (the mean value of two perpendicular measurements) and height of basal area median tree (DgM, HgM).
Table 1.
The statistics of the forest inventory attributes measured from the sample plots. Attributes included species-specific basal areas (G) and dbh (the mean value of two perpendicular measurements) and height of basal area median tree (DgM, HgM).
| | n | Minimum | Mean | Maximum | Standard deviation |
|---|
| G, m2/ha |
| Scots pine | 25 | 0 | 13.3 | 29.4 | 10.0 |
| Norway spruce | 25 | 0 | 9.7 | 35.6 | 11.4 |
| Deciduous | 25 | 0 | 3.6 | 15.5 | 4.3 |
| Total | 25 | 16.1 | 28.0 | 43.7 | 7.6 |
| DgM, cm |
| Scots pine | 20 | 19.4 | 27.1 | 47.1 | 8.2 |
| Norway spruce | 24 | 5.1 | 20.0 | 39.1 | 20.0 |
| Deciduous | 23 | 5.2 | 21.3 | 40.2 | 10.2 |
| HgM, m |
| Scots pine | 20 | 15.2 | 21.4 | 31.6 | 4.3 |
| Norway spruce | 24 | 4.5 | 16.6 | 34.1 | 16.6 |
| Deciduous | 23 | 6.8 | 19.5 | 30.2 | 6.4 |
2.4. Sample Plot Measurements Using the Smartphone and TRESTIMATM App
2.4.1. Overview of the Measurement Principles
The app has been developed following the principles of stand-wise field inventories where relascope [
19] is used to measure basal area from multiple locations within each stand as
dbh and height are measured from sample trees. Thus, the common way of using it is to take several images at different points around a forest stand for determining species-specific basal areas; and taking images of a few sample trees per species to determine D
gM and H
gM.
The measurements required for TRESTIMA
TM are based on the smartphone’s camera properties and machine vision [
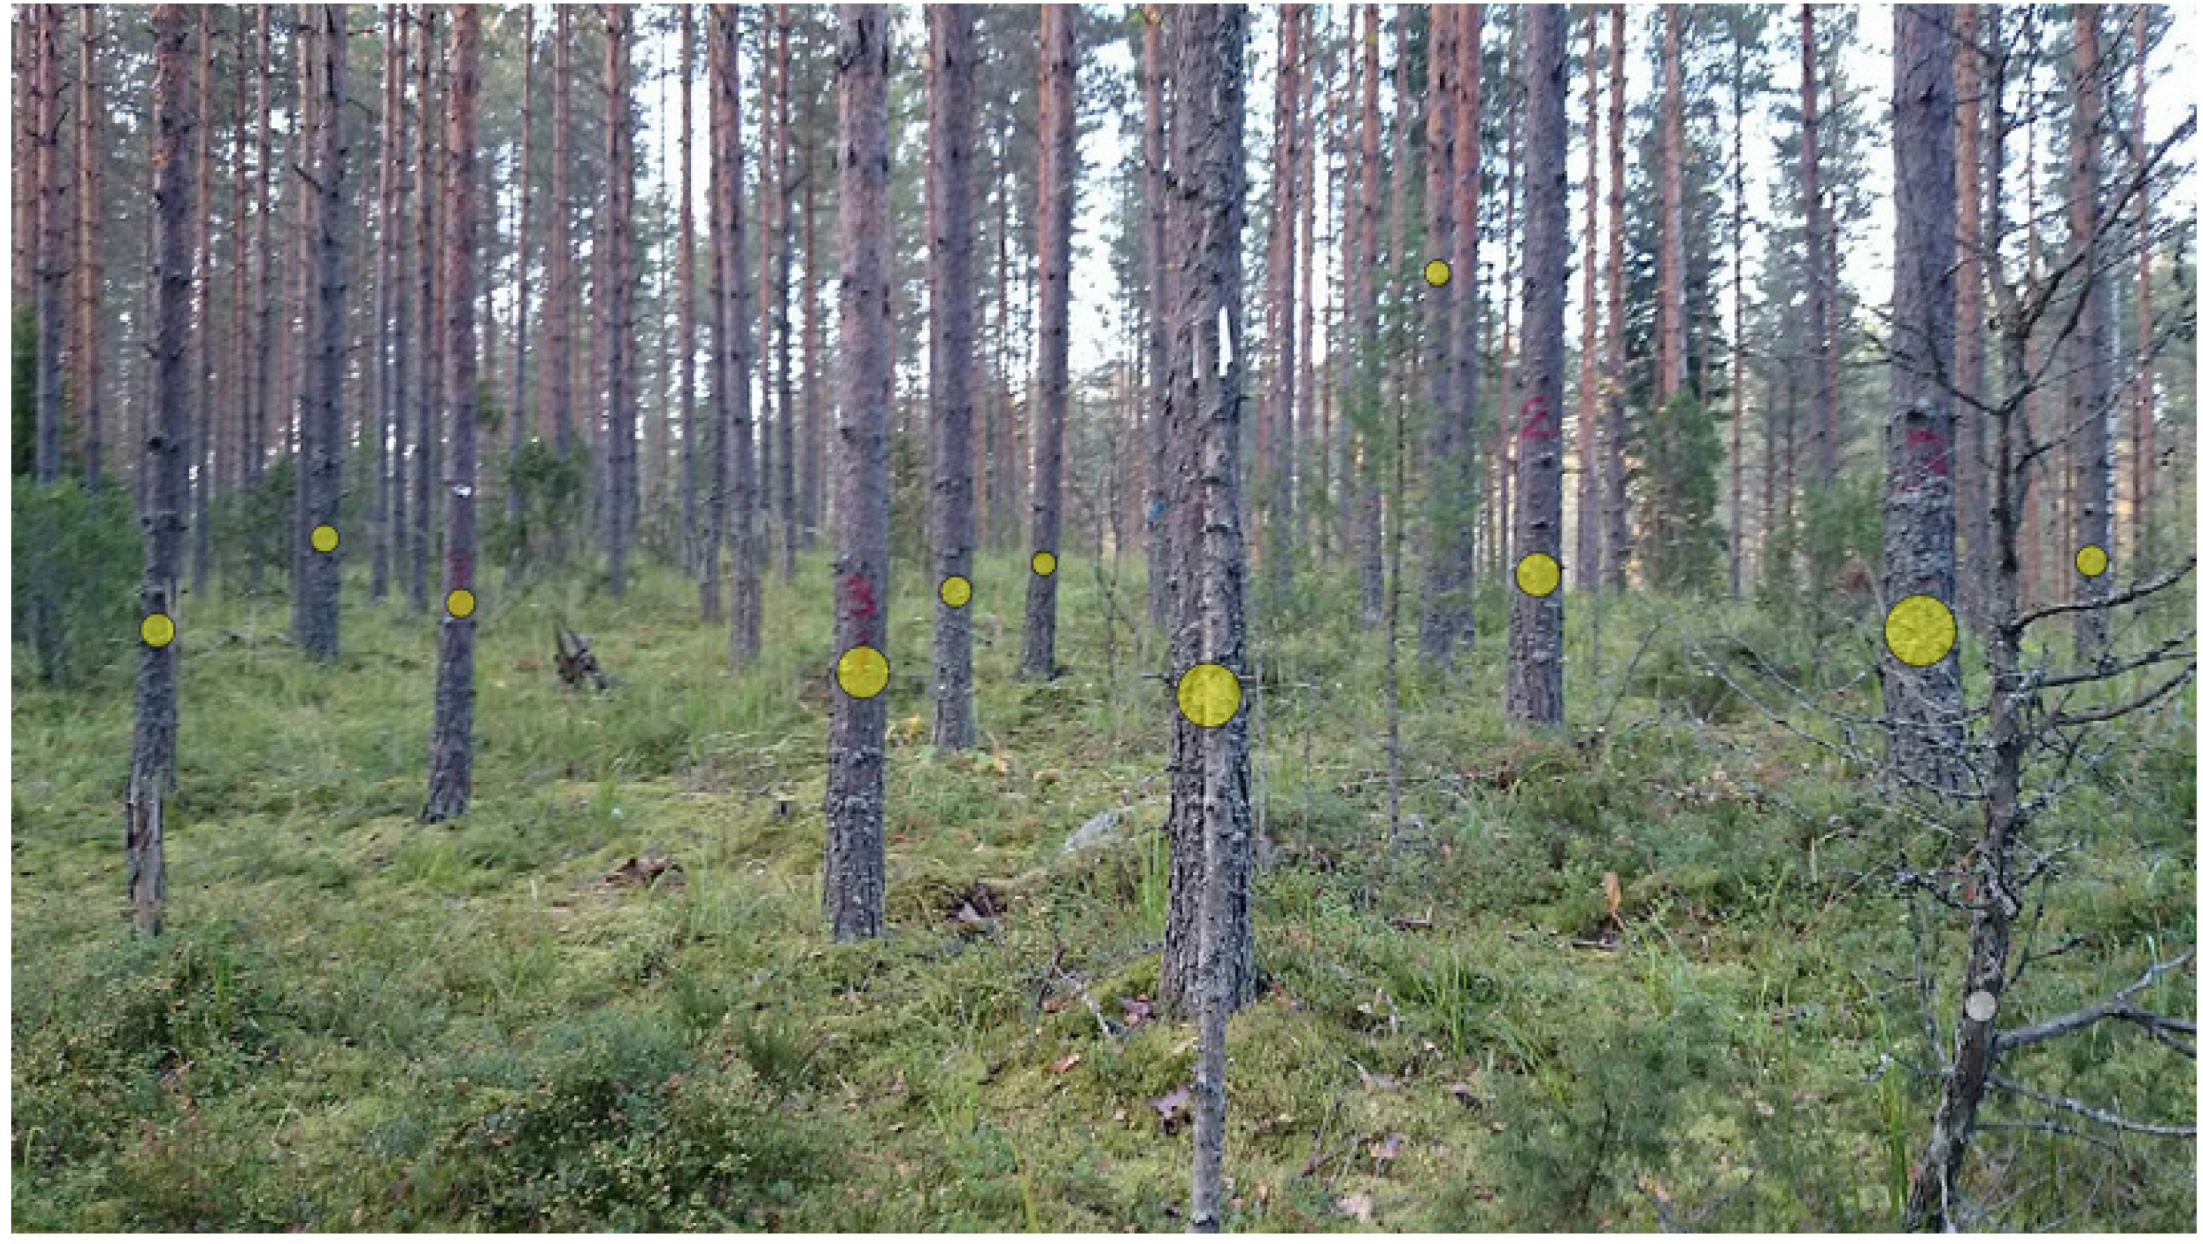
18]. It also enables the user to manually edit measured data if necessary. To estimate species-specific basal area, the user takes an image or images in landscape position with a clear view of the stand. The basal area can be estimated from each individual image or as an average over several. The app interprets the image (
Figure 2) through the following steps: (1) tree detection; (2) species identification; and (3) tree inclusion in the basal area count following the angle count sampling principles [
18]. Angle count sampling principle in the app uses a dynamic basal area factor (q) where a single tree leads to a response of G of 0.6 to 1.4 m
2/ha. The total basal area is then obtained by multiplying the number of trees by their respective q. Species-specific basal area can be calculated in a similar way but by tree species.
Figure 2.
Basal area is determined from the captured images. The measurement principle is angle count sampling.
Figure 2.
Basal area is determined from the captured images. The measurement principle is angle count sampling.
The basal area median tree diameter (D
gM) and height (H
gM) measurements require separate images including a specific measurement stick (
Figure 3). The measurement stick is then identified from the image automatically by the app (
Figure 3) and scaled. This enables automatic measurements of
dbh and height. The measurement stick has to be attached to the tree at 1.80 m above ground, which leaves its middle mark at 1.3 m, at which the
dbh is measured. The camera takes the D
gM and H
gM measurement images in portrait position so the whole measurement stick, and tree
dbh or height, are visible. The app will then identify the tree species, the stick limits and the diameter limits or the tree top.
All of the images are uploaded and stored by the app, including location and time information, and can be reviewed at any time. The uploaded images are automatically processed and species-specific results are available in real time (when connected to the Internet) via both the smartphone and web browser apps. In our study, the version of the processing software was TRESTIMATM Build 132.
Figure 3.
Measurement stick (1 m in length) is required to scale the image and measure dbh and height of the median trees.
Figure 3.
Measurement stick (1 m in length) is required to scale the image and measure dbh and height of the median trees.
2.4.2. Acquisition of the Images
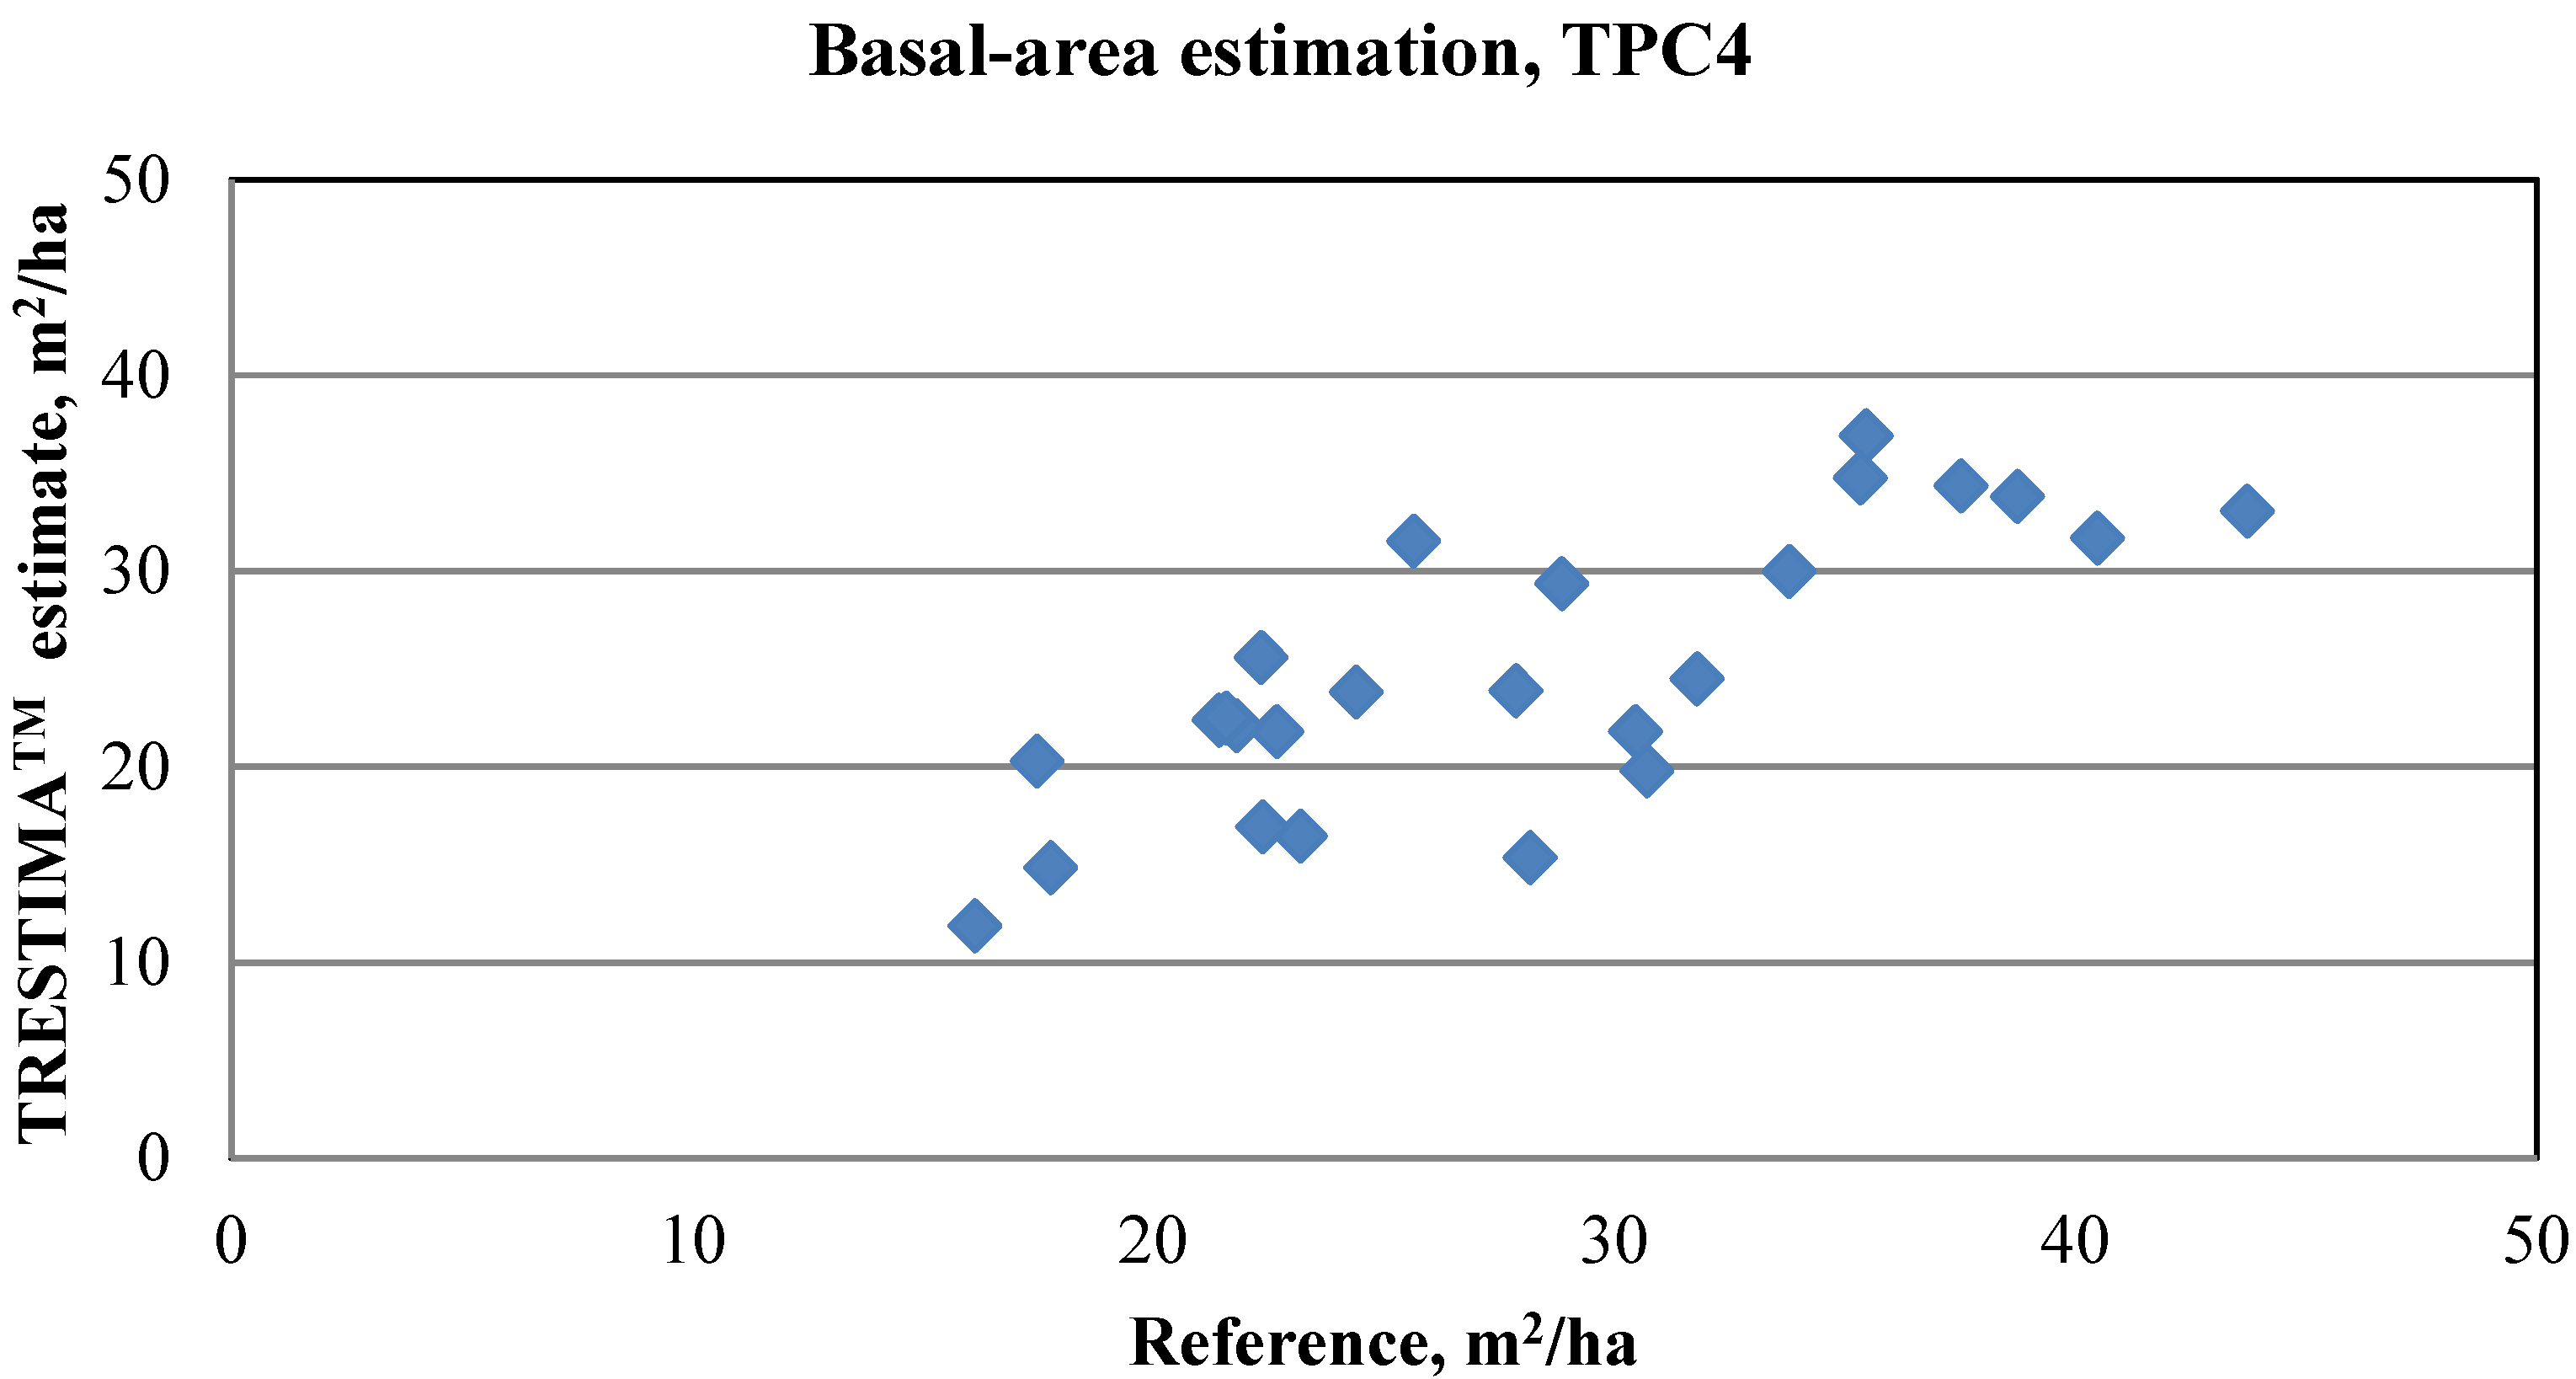
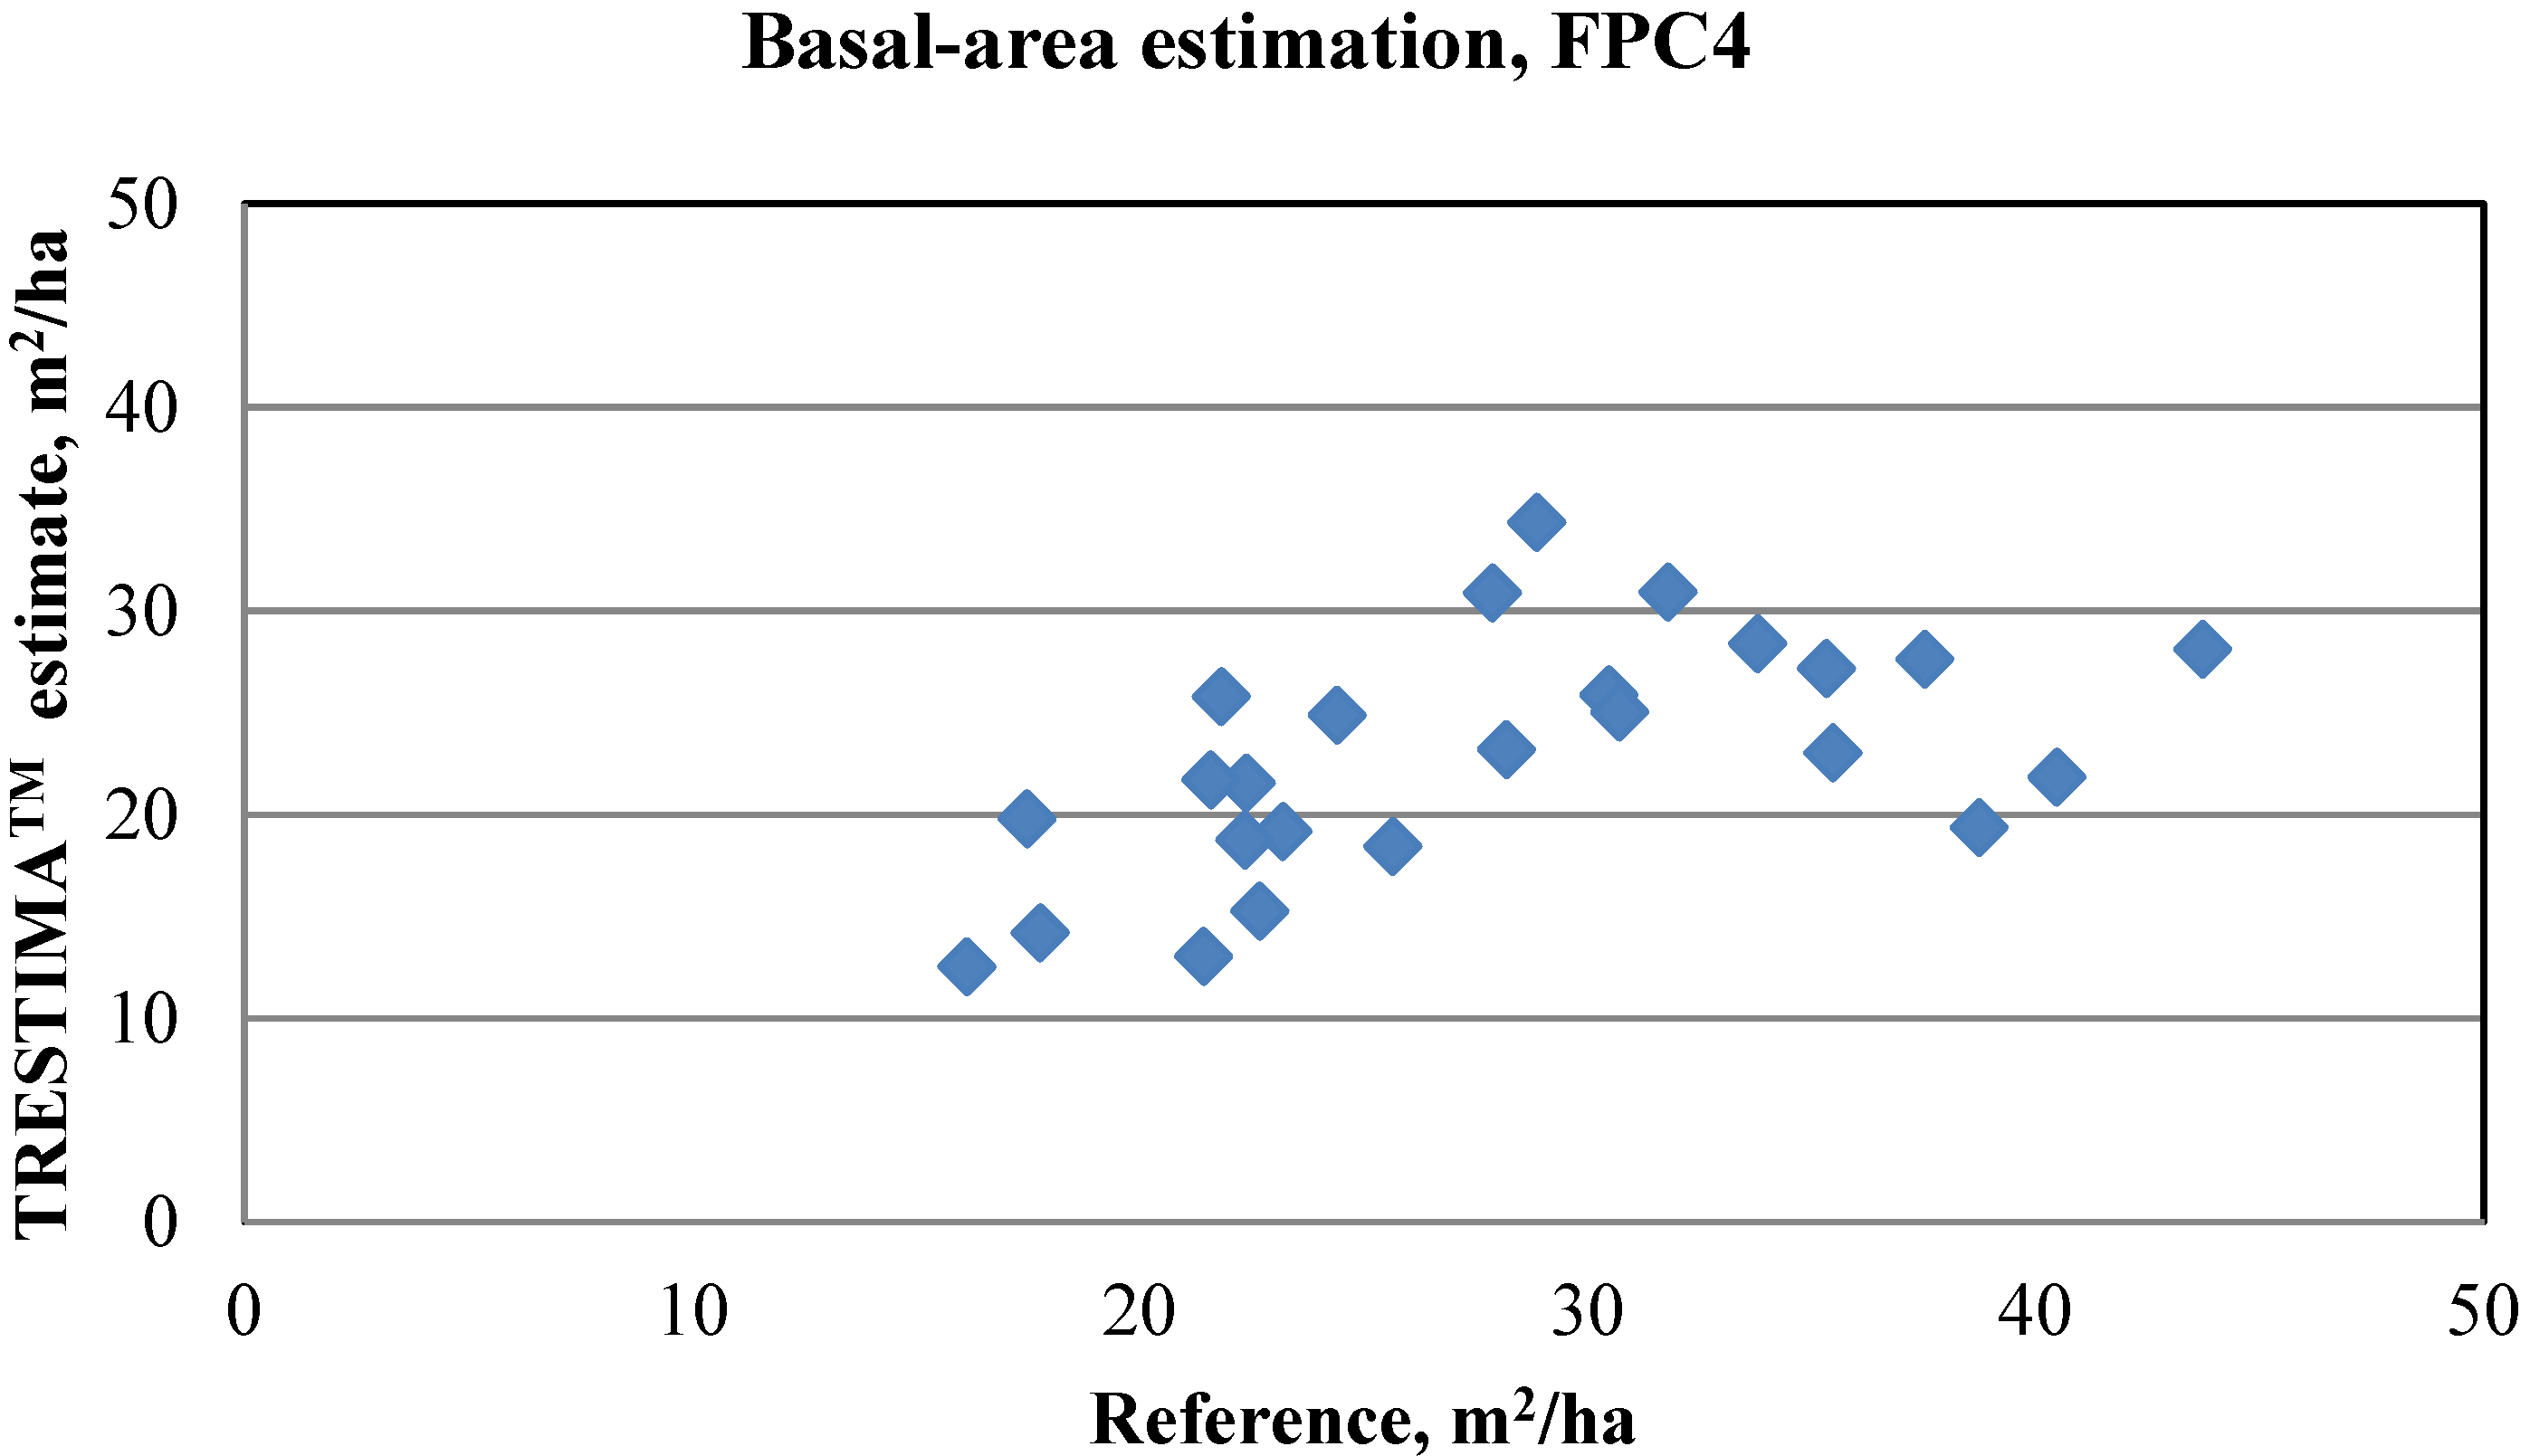
We acquired the images used to determine forest inventory attributes from multiple locations from each sample plot with a Sony Xperia Z1 (Tokyo, Japan) compact mobile phone in September and October 2014. The aim of the measurements was to obtain forest inventory attributes from sample plots (32 m × 32 m). Most were taken approximately 16 meters away from the center of the plot in four cardinal directions and four ordinal directions, measured by bearing compass. Four were taken also from the center of the plot in the four cardinal directions. In total, 12 images were taken from each plot (
Figure 4) to determine basal area. Four different kinds of image sets were formed, depending on image capture direction and location (
Table 2). The basal areas of the image sets were calculated by averaging the individual basal area value of each image.
The species-specific median trees measured to determine DgM and HgM were selected beforehand from the reference data. Thus, the error calculated for the dbh and the height measurements report the instrument’s accuracy because it does not include the error in selecting the median tree.
Table 2.
Tested image sets.
Table 2.
Tested image sets.
| Image set | Description |
|---|
| TPC4 | 4 images toward plot center in cardinal directions (N, S, E, and W) |
| TPC8 | 8 images toward plot center in cardinal and ordinal directions (N, NE, E, SE, S SW, W, NW) |
| FPC4 | 4 images taken from the center of the plot in cardinal directions (N, S, E, and W) |
| ALL | All the acquired images |
Figure 4.
Imaging locations in sample plots.
Figure 4.
Imaging locations in sample plots.
2.5. Accuracy Evaluations
The accuracy of the estimated forest inventory attributes (Species-specific Gs, D
gM and H
gM) was observed by calculating bias and root-mean-square error (RMSE):
where
n is the number of plots,
yi is the observed value (by tree-wise measurements) for plot
i,
is determined by using TRESTIMA
TM for plot
i and
is the observed mean of the forest inventory attribute in question.
4. Discussion
The availability and quality of ground reference forest data can be a bottleneck for many forest mapping and inventory applications. New measuring equipment and techniques are sought to replace calipers and clinometers. One intriguing possibility is smartphone apps. We tested an app that estimates basal area and tree species based on interpretation of digital camera images. In addition, a measurement stick can scale the images to measure D
gM and H
gM (
Figure 3).
The app is aiming for rapid and objective measurement of forest inventory attributes from the stands. Forest inventory attributes can be determined already from a single image combined with dbh and height measurements from a median tree. However, at stand level, multiple images should be acquired and forest inventory attributes should be calculated as mean values over multiple images. We used 25 sample plots (32 m × 32 m) for evaluation and tested various imaging configurations. When interpreting the results of our study, it should be taken into account that our results are obtained from one study area, required images are taken by one measurer and the number of the plots used in the analyses are still limited (e.g., the minimum basal area within our plots was 16.1 m2/ha).
The most important finding of the study was that all imaging setups included bias in basal area measurements, varying from 0.5% to 22.7%. When basal-area is measured with the TRESTIMA
TM app, the possible sources of bias include missing trees (e.g., due to occlusion), errors in defining basal-area factor (q) or measuring the basal-area from the wrong height. However, we were not able to separate these errors sources with our data. The biases in basal-area measurements with TRESTIMA
TM app are in line with previous research measuring basal area with a relascope [
20,
21]. Saari and Kangas [
21] reported biases (underestimations) in basal areas varying from 0.7% to 30.2% at the stand level. A basal area of a tree [
1] is its breast-height (1.3 m) cross-section and the basal area of a stand is the sum of these cross-sectional areas. One critical point in basal area measurements is how the height of the measurements is defined (note the varying heights of the yellow circles in
Figure 2). We used a measurement stick to define height for
dbh measurements in our reference. The TRESTIMA
TM app defines height from the captured image, which may include uncertainty respectively to relascope measurements.
Since the method studied here is based on automatic image interpretation, the quality of the images, sharpness and light as well as visibility are very important to the quality of results. Accuracies of the D
gM and H
gM measurements should be carefully interpreted. Basal area median trees were selected using the reference data before smartphone measurements. Thus, the errors reported here are actually
dbh and height measurement errors because the errors of selecting median trees are not included. In practice, subjective selection of the median tree will add some amount of error. In previous studies, laser technology has been used to measure stem
dbh in multiple ways. The accuracy in measuring
dbh has varied from 8 to 16 mm with the laser-relascope [
6,
22] and from 8.8 to 14.3 mm with laser-dendrometers [
23,
24]. With camera-based systems, the accuracies obtained have varied from 7.0 to 9.9 mm [
6,
8,
9,
10,
25,
26].
Dbh has been also measured using TLS and accuracies have varied in managed forest conditions between 0.74 to 3.25 cm (e.g., [
6,
27,
28,
29,
30] but the focus on these studies has been on single trees, fewer sample plots, or simpler forest structures with sparse understory. The accuracy of the common reference measurement device, steel calipers, has been reported to vary between 2.7 and 6.9 mm [
31,
32]. Tree heights are difficult to measure accurately in the field when based on accurate vertical angle measurements (such as the Vertex that was used to obtain reference). The problems are related to the identification of the highest branch or foliage of a tree and the possible horizontal offset from the tree base to the highest branch. When the reference was measured using the Vertex tree height measurement device, TRESTIMA
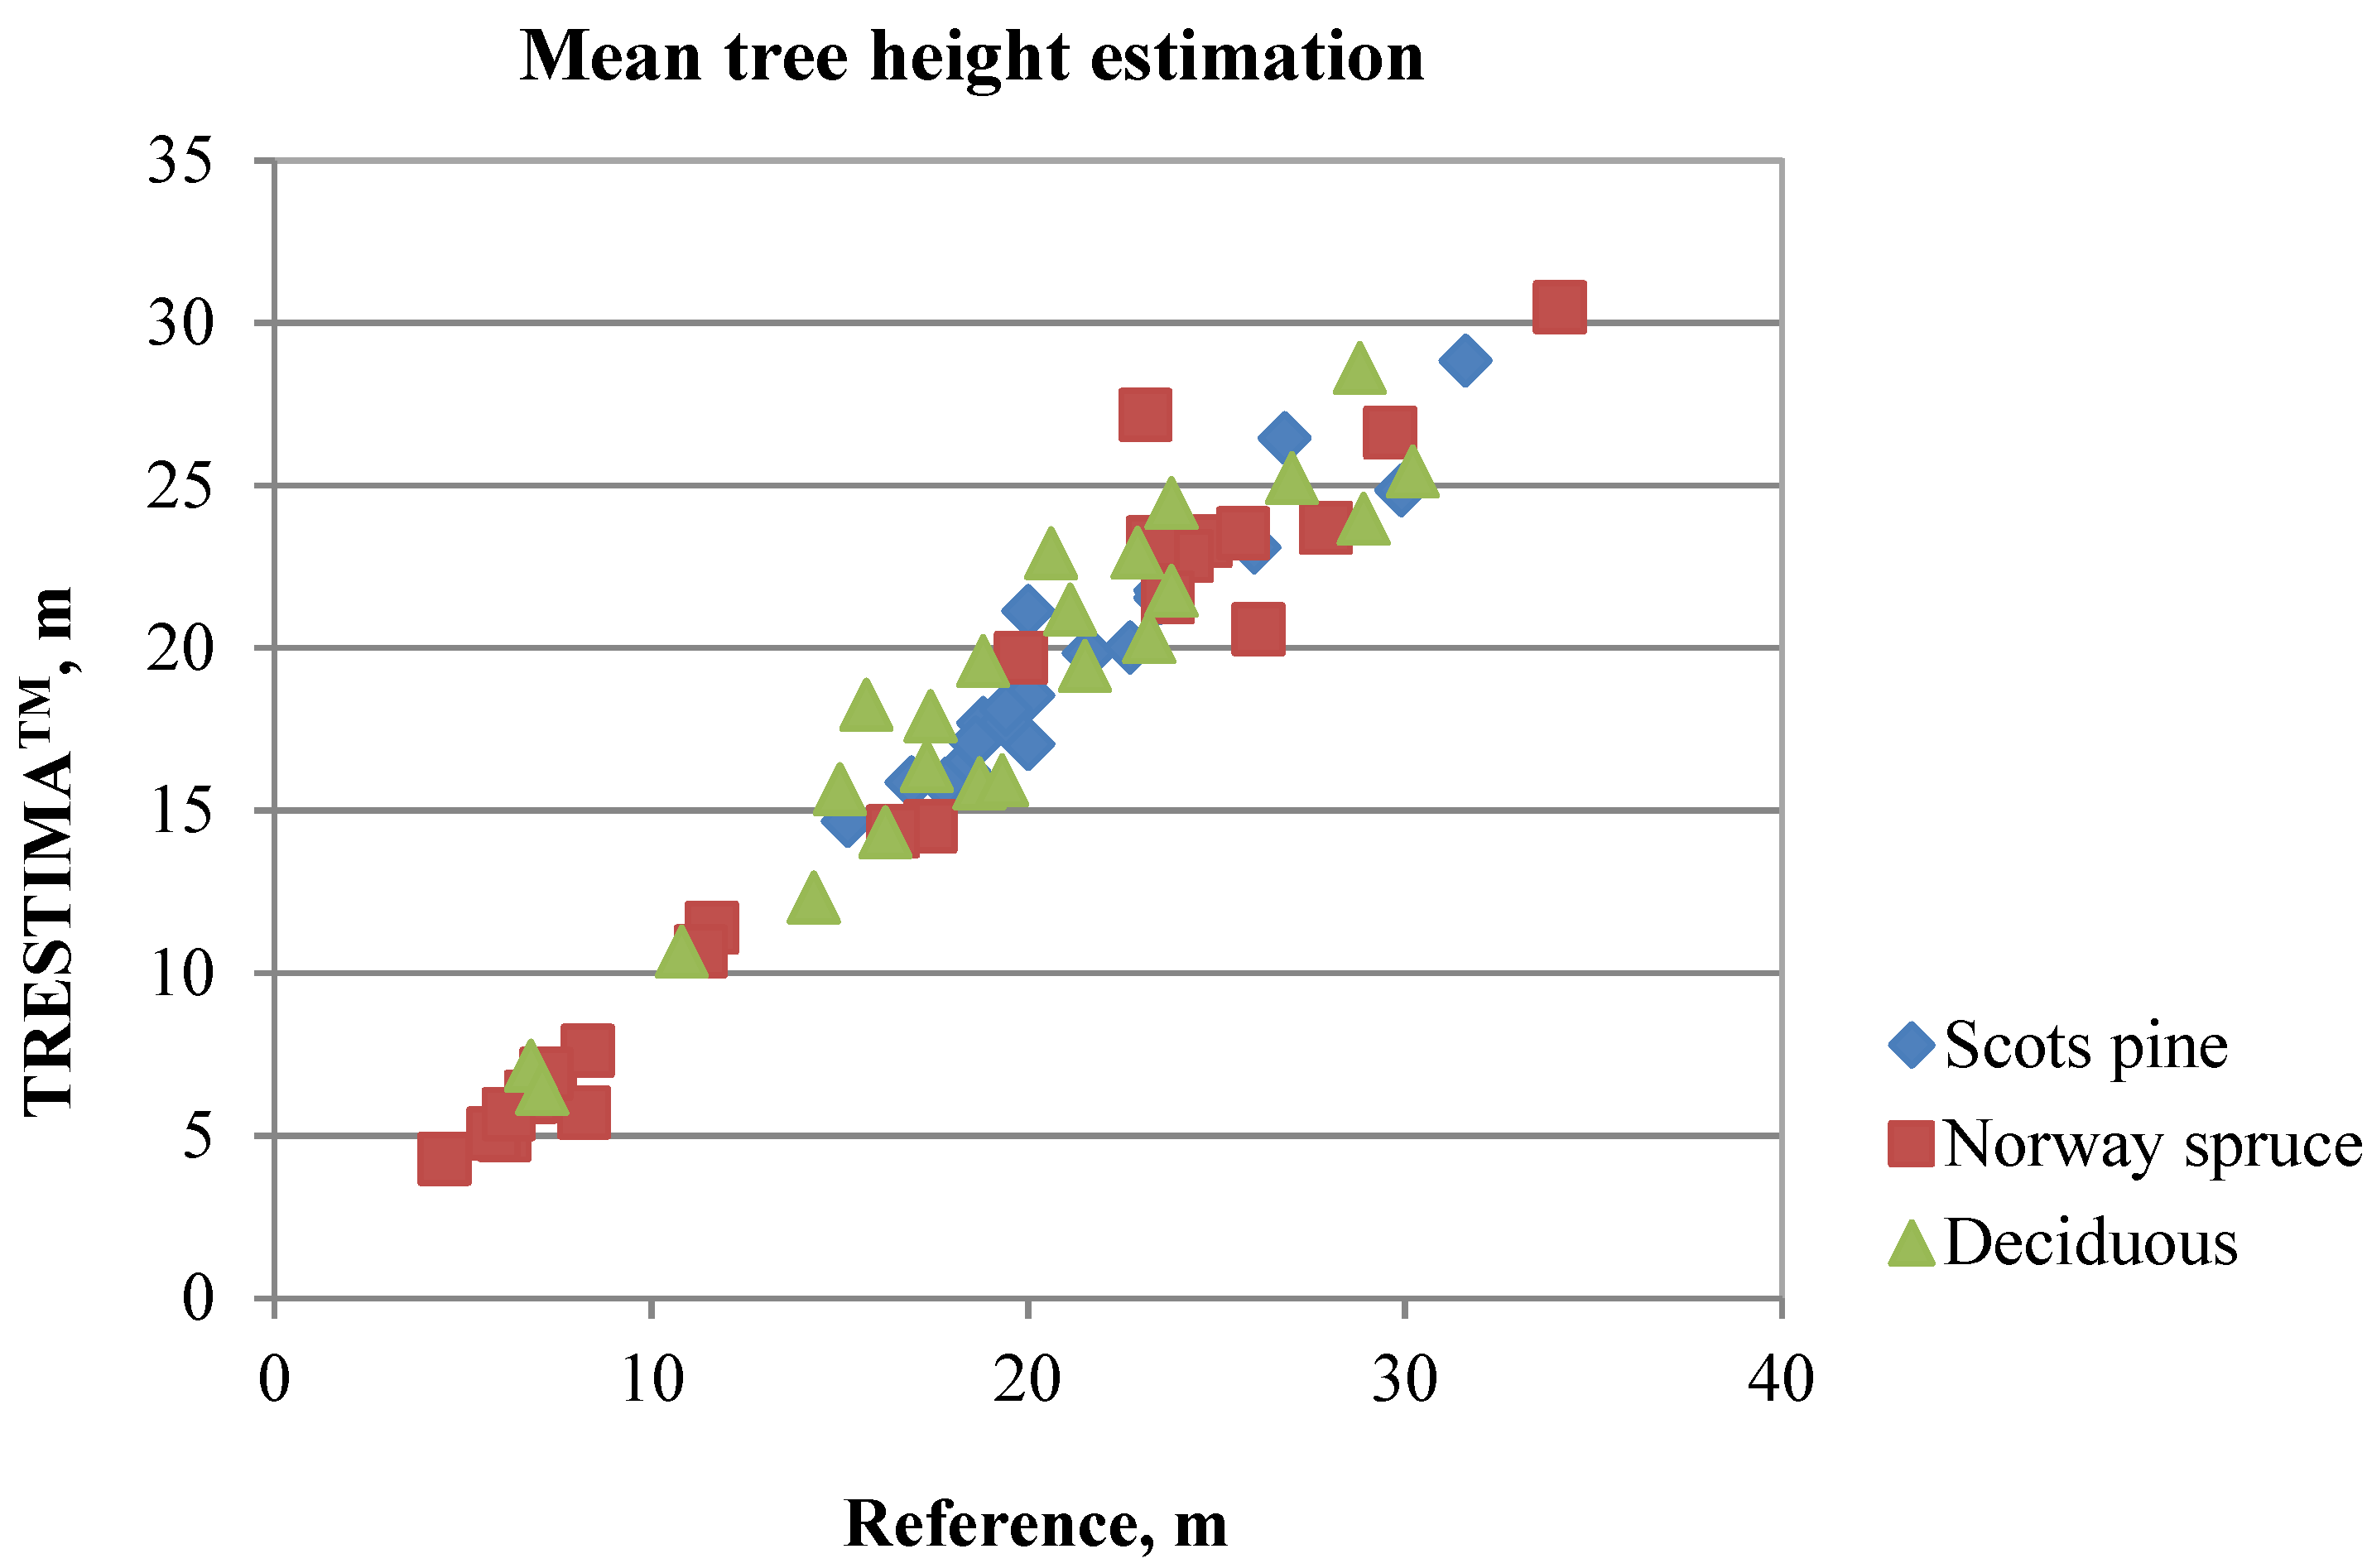
TM obtained reasonable accuracies for H
gM, varying from 10.0% to 13.6% (RMSE). Especially when the tree height is measured, the quality of the image, sharpness, light conditions, and visibility of the treetop are very important to reliable results.
In general, estimated forest inventory attributes were more accurate from images taken toward the plot center than from those taken away from it. We also noted that adding more than four images to the analyses meant no additional improvements in estimations. However, this finding may be invalid when measuring stands that are generally larger than our sample plots.


 ,
, 


