
Influence of Low Frequency Variability on Climate and Carbon Fluxes in a Temperate Pine Forest in Eastern Canada

Abstract
:1. Introduction
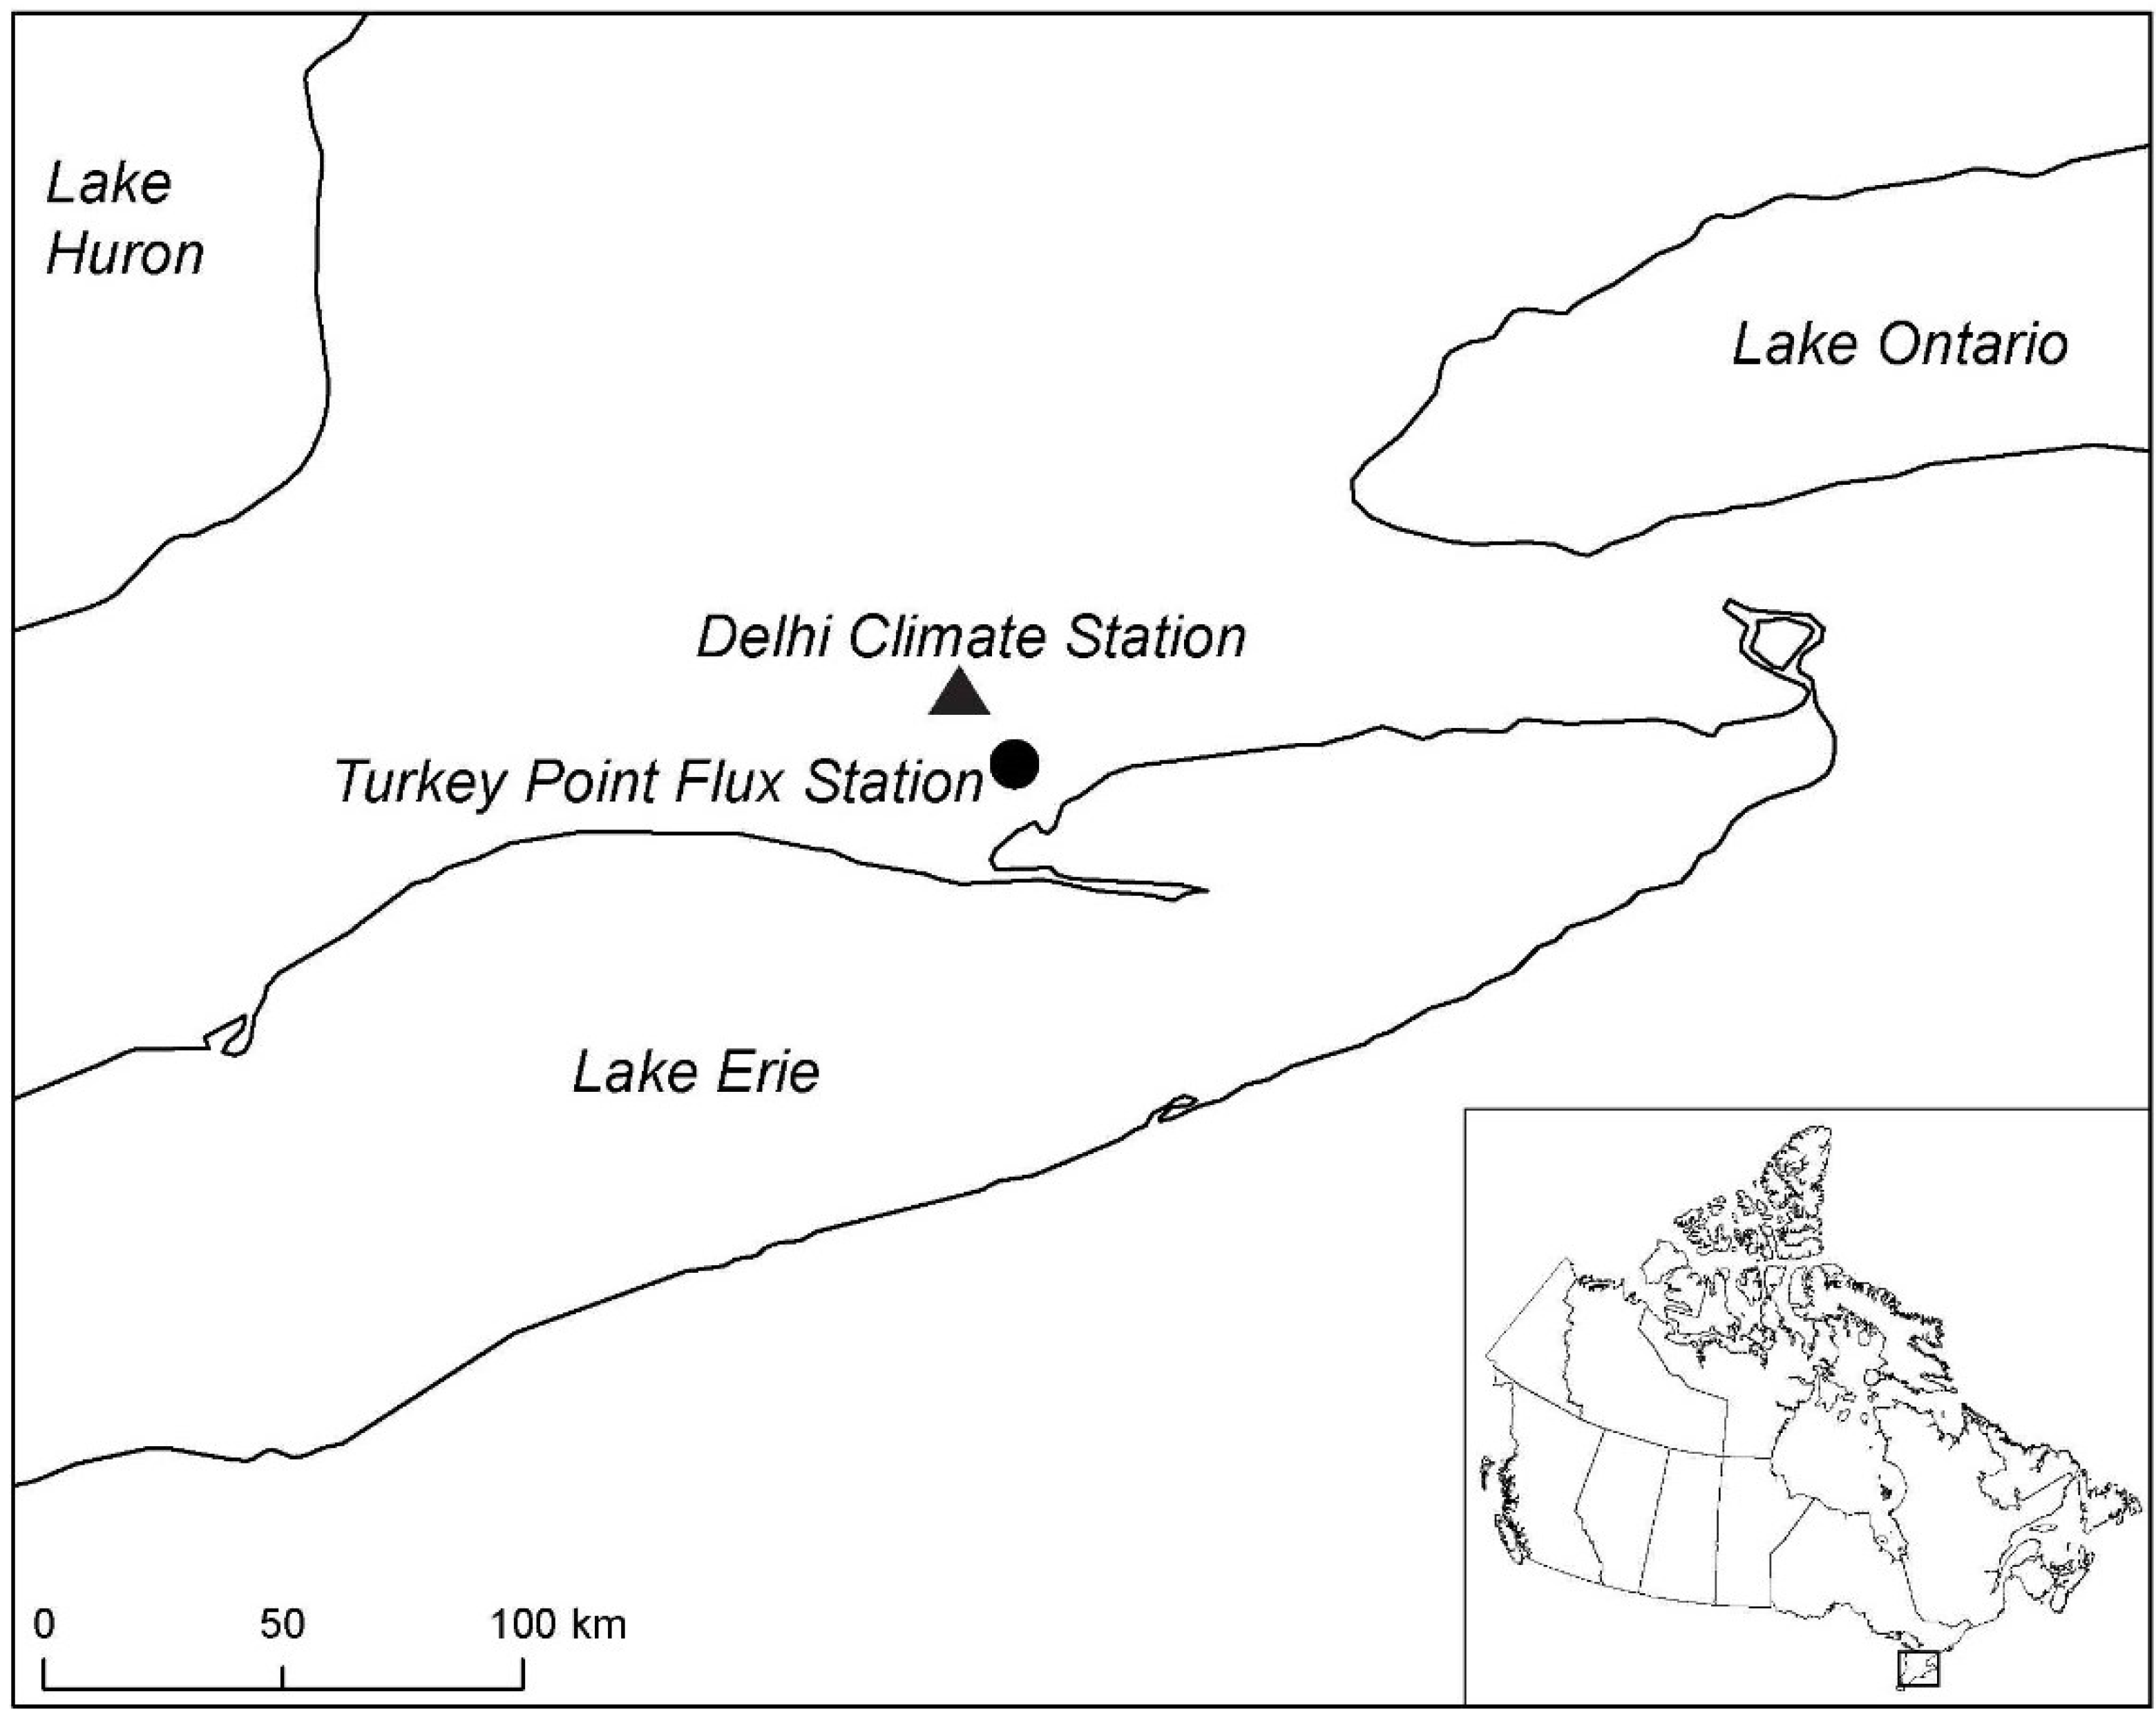
2. Study Area

3. Data and Methods
4. Results and Discussion
4.1. Long-Term Analysis

| Season | PDO | PNA | ENSO | NAO | AO | EPO |
|---|---|---|---|---|---|---|
| Temperature | ||||||
| Winter | −0.23 | −0.02 | −0.12 | 0.33 ** | 0.29 * | −0.48 ** |
| Spring | −0.18 | 0.15 | −0.05 | −0.13 | −0.23 | −0.13 |
| Summer | 0.08 | 0.12 | −0.14 | 0.19 | 0.10 | −0.19 |
| Autumn | 0.03 | 0.12 | −0.09 | −0.07 | −0.06 | −0.15 |
| Precipitation | ||||||
| Winter | −0.23 | −0.37 ** | 0.09 | 0.19 | 0.29 * | −0.13 |
| Spring | −0.08 | −0.10 | 0.08 | −0.09 | −0.12 | 0.15 |
| Summer | 0.02 | 0.06 | −0.10 | 0.20 | 0.14 | −0.13 |
| Autumn | 0.22 | 0.17 | −0.03 | 0.08 | −0.01 | 0.30 * |
| Snowfall | ||||||
| −0.15 | −0.34 ** | 0.33 ** | −0.03 | 0.08 | 0.02 | |
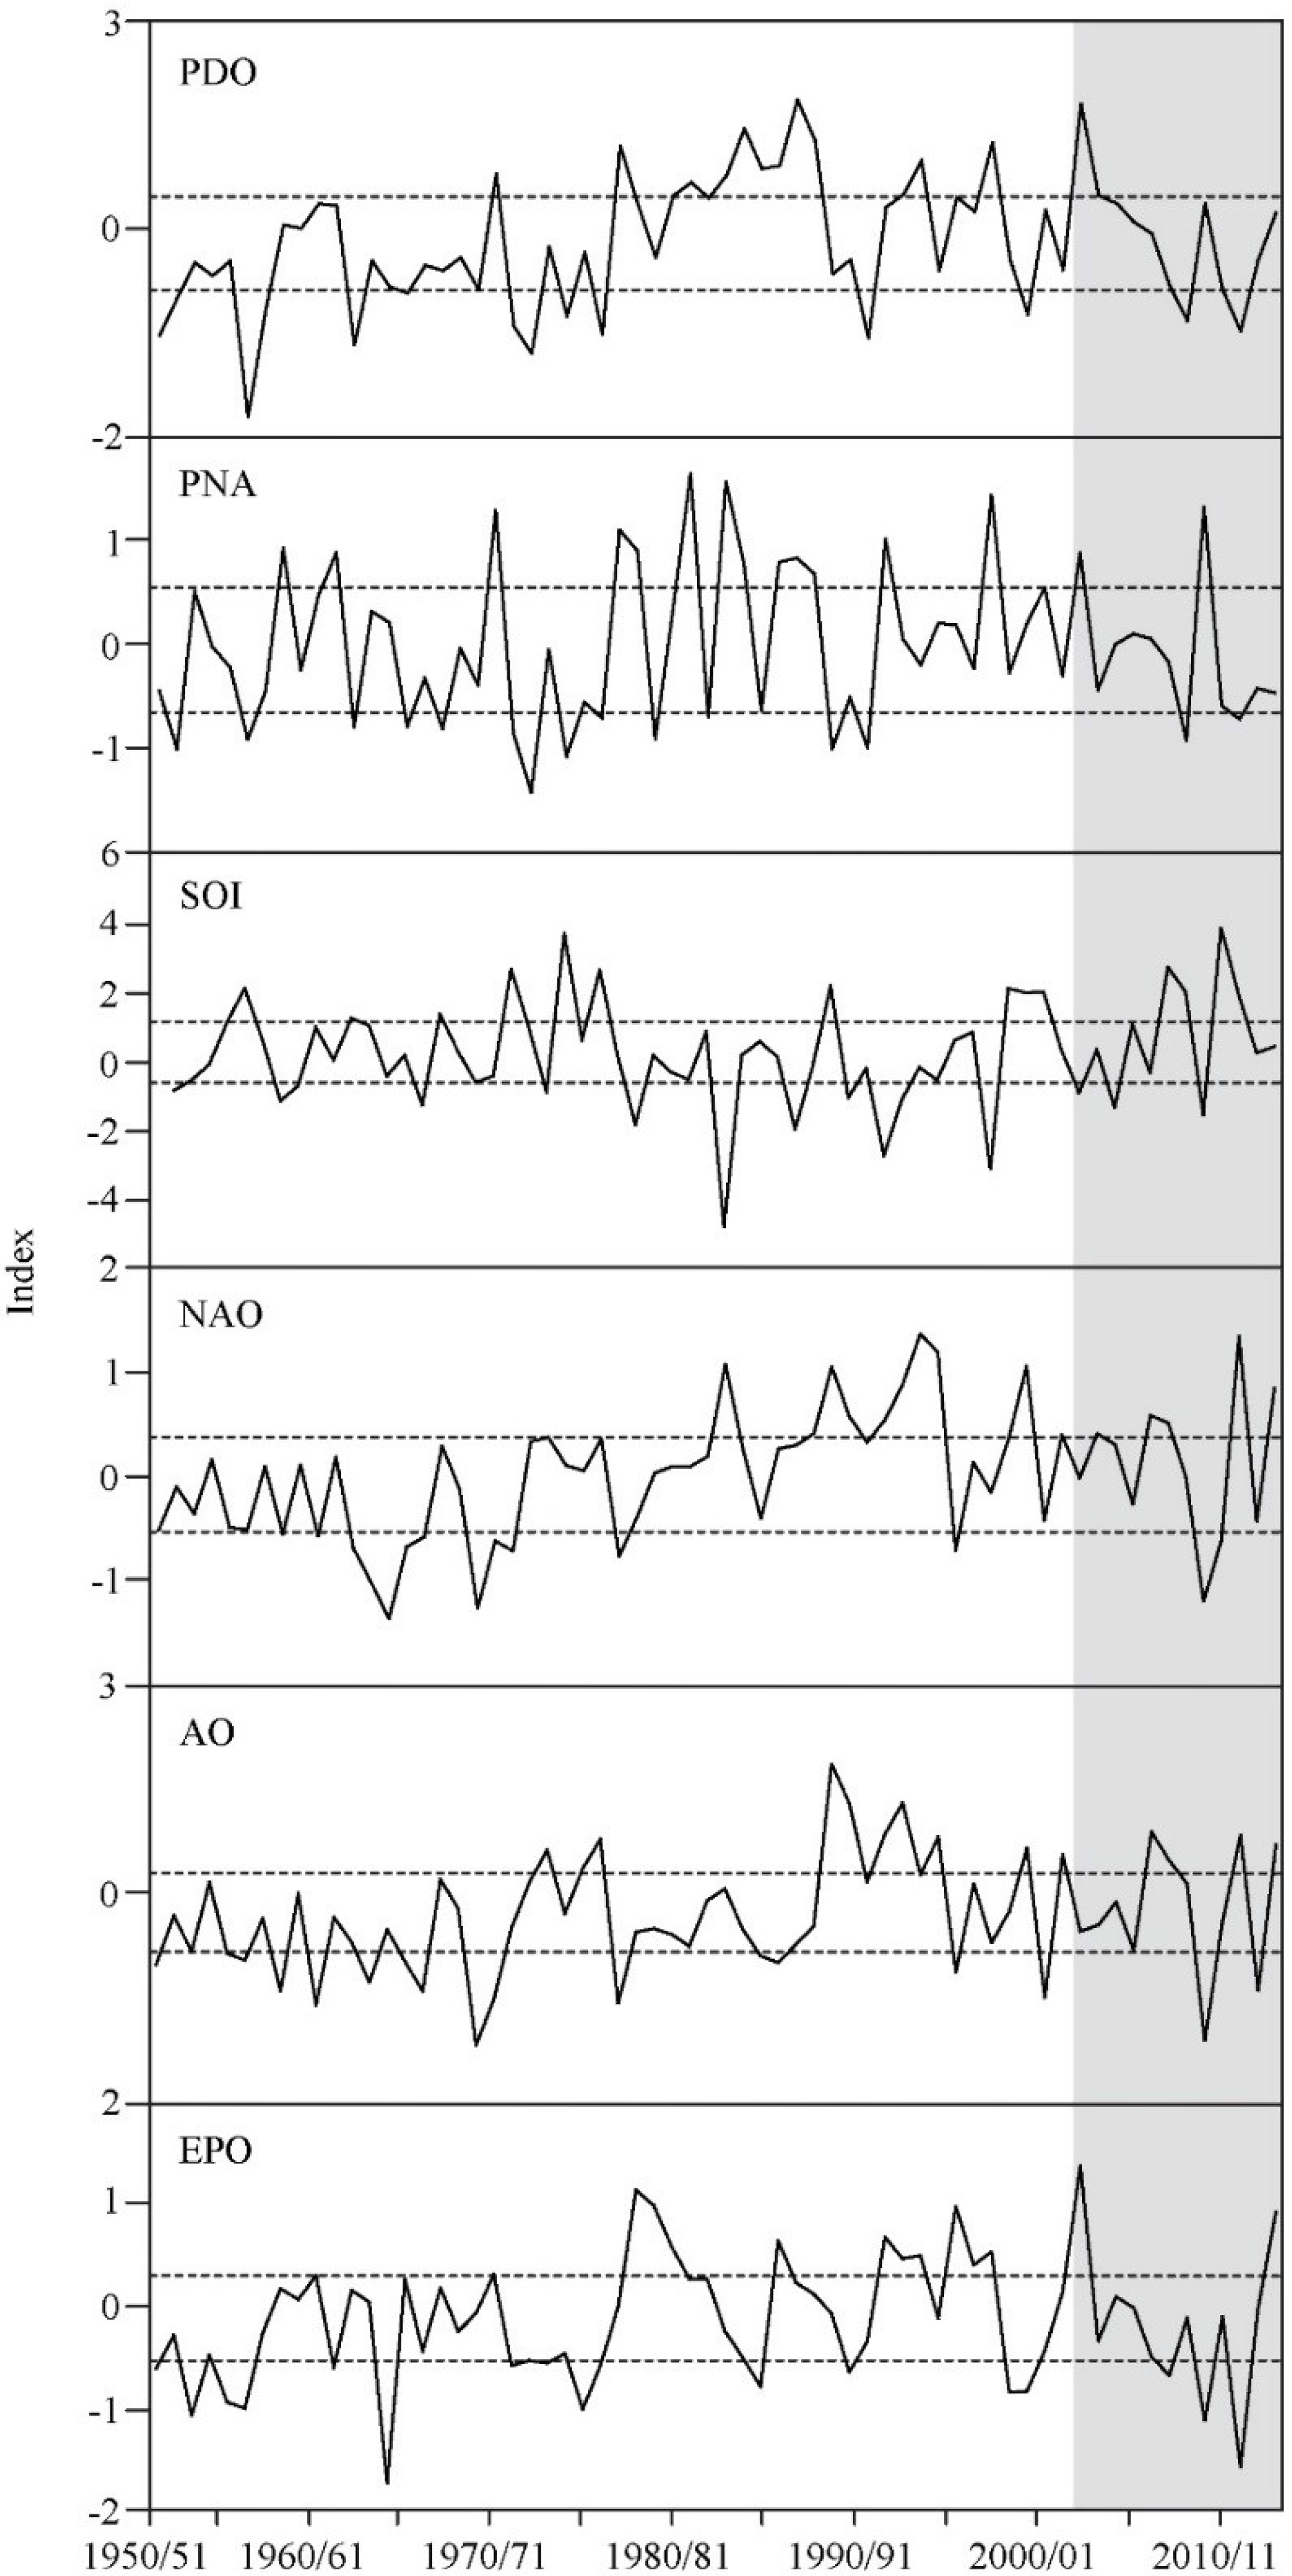
4.2. Occurrence, Strengths and Impacts of Climate Oscillations


4.3. Impacts of Teleconnections on Carbon Fluxes
| Period | GEP | Re | NEP |
|---|---|---|---|
| Temperature | |||
| Winter | 0.63 * | 0.67 * | |
| Spring | 0.86 ** | 0.88 ** | 0.25 |
| Summer | −0.22 | 0.09 | −0.45 |
| Autumn | 0.17 | 0.15 | 0.03 |
| Annual | −0.21 | 0.04 | −0.42 |
| Precipitation | |||
| Winter | −0.21 | −0.58 | |
| Spring | −0.16 | −0.10 | −0.12 |
| Summer | 0.23 | 0.33 | −0.12 |
| Autumn | −0.33 | −0.30 | −0.07 |
| Annual | 0.13 | −0.27 | 0.62 * |
| Snowfall | |||
| Winter | −0.32 | −0.66 * | |


| Period | PDO | PNA | ENSO | NAO | AO | EPO |
|---|---|---|---|---|---|---|
| GEP | ||||||
| Winter | ||||||
| Spring | −0.35 | 0.08 | 0.16 | −0.16 | −0.21 | −0.59 * |
| Summer | −0.14 | 0.06 | 0.20 | −0.22 | −0.18 | 0.13 |
| Autumn | −0.31 | −0.26 | 0.12 | 0.27 | 0.40 | 0.03 |
| Annual | −0.35 | −0.02 | 0.29 | 0.14 | −0.09 | −0.14 |
| Re | ||||||
| Winter | −0.62 * | −0.18 | 0.36 | 0.25 | 0.17 | −0.79 ** |
| Spring | −0.24 | 0.05 | 0.02 | −0.12 | −0.27 | −0.60 * |
| Summer | −0.05 | 0.37 | −0.11 | −0.07 | −0.18 | −0.16 |
| Autumn | −0.19 | −0.21 | −0.12 | 0.56 | 0.47 | −0.11 |
| Annual | −0.26 | 0.16 | −0.05 | 0.12 | −0.02 | −0.43 |
| NEP | ||||||
| Winter | −0.11 | 0.30 | −0.35 | 0.12 | −0.07 | −0.62 * |
| Spring | −0.26 | −0.09 | 0.28 | −0.13 | −0.02 | −0.18 |
| Summer | −0.15 | −0.32 | 0.44 | −0.24 | −0.06 | 0.38 |
| Autumn | −0.15 | −0.05 | 0.40 | −0.55 | −0.18 | 0.22 |
| Annual | −0.23 | −0.27 | 0.57 | −0.41 | −0.12 | 0.37 |
5. Conclusions
Acknowledgments
Author Contributions
Conflicts of Interest
References
- Heimann, M.; Reichstein, M. Terrestrial ecosystem carbon dynamics and climate feedbacks. Nature 2008, 451, 289–293. [Google Scholar] [CrossRef] [PubMed]
- Wharton, S.; Falk, M.; Bible, K.; Schroeder, M.; Paw, U.K.T. Old-growth CO2 flux measurements reveal high sensitivity to climate anomalies across seasonal, annual and decadal time scales. Agric. For. Meteorol. 2012, 161, 1–14. [Google Scholar] [CrossRef]
- Bastos, A.; Running, S.W.; Gouveia, C.; Trigo, R.M. The global NPP dependence on ENSO: La Niña and the extraordinary year of 2011. J. Geophys. Res. Atmos. 2013, 118, 1247–1255. [Google Scholar] [CrossRef]
- Piao, S.; Ciais, P.; Friedlingstein, P.; Peylin, P.; Reichstein, M.; Luyssaert, S.; Margolis, H.; Fang, J.; Barr, A.; Chen, A.; et al. Net carbon dioxide losses of northern ecosystems in response to autumn warming. Nature 2008, 451, 49–52. [Google Scholar] [CrossRef] [PubMed]
- Reay, D.; Sabine, C.; Smith, P.; Hymus, G. Climate change 2007: Spring-time for sinks. Nature 2007, 446, 727–728. [Google Scholar] [CrossRef] [PubMed]
- Black, T.A.; Chen, W.J.; Barr, A.G.; Arain, M.A.; Chen, Z.; Nesic, Z.; Hogg, E.H.; Neumann, H.H.; Yang, P.C. Increased carbon sequestration by a boreal deciduous forest in years with a warm spring. Geophys. Res. Lett. 2000, 27, 1271–1274. [Google Scholar] [CrossRef]
- Davis, R.E.; Hardy, J.P.; Ni, W.; Woodcock, C.; McKenzie, J.C.; Jordon, R.; Li, X. Variation of snow cover ablation in the boreal forest: A sensitivity study on the effects of conifer canopy. J. Geophys. Res. Atmos. 1997, 102(D24), 29389–29395. [Google Scholar] [CrossRef]
- Amiro, B.D.; Barr, A.G.; Barr, J.G.; Black, T.A.; Bracho, R.; Brown, M.; Chen, J.; Clark, K.L.; Davis, K.J.; Desai, A.R.; et al. Ecosystem carbon dioxide fluxes after disturbance in forests of North America. J. Geophys. Res. Atmos. 2010, 115. [Google Scholar] [CrossRef]
- Wullschleger, S.D.; Hanson, P.J. Sensitivity of canopy transpiration to altered precipitation in an upland oak forest: Evidence from a long-term field manipulation study. Glob. Chang. Biol. 2006, 12, 97–109. [Google Scholar] [CrossRef]
- Granier, A.; Reichstein, M.; Bréda, N.; Janssens, I.A.; Falge, E.; Ciais, P.; Grünwald, T.; Aubinet, M.; Berbigier, P.; Bernhofer, C.; et al. Evidence for soil water control on carbon and water dynamics in European forests during the extremely dry year: 2003. Agric. For. Meteorol. 2007, 143, 123–145. [Google Scholar] [CrossRef]
- Vose, R.S.; Applequist, S.; Menne, M.J.; Williams, C.N., Jr.; Thorne, P. An intercomparison of temperature trends in the U.S. Historical Climatology Network and recent atmospheric reanalyses. Geophys. Res. Lett. 2012, 39. [Google Scholar] [CrossRef]
- Reichstein, M.; Bahn, M.; Ciais, P.; Frank, D.; Mahecha, M.; Seneviratne, S.I.; Zscheischler, J.; Beer, C.; Buchmann, N.; Frank, D.C.; et al. Climate extremes and the carbon cycle. Nature 2013, 500, 287–295. [Google Scholar] [CrossRef] [PubMed]
- Shabbar, A.; Bonsal, B.; Khandekar, M. Canadian precipitation patterns associated with the Southern Oscillation. J. Clim. 1997, 10, 3016–3027. [Google Scholar] [CrossRef]
- Bonsal, B.R.; Shabbar, A.; Higuchi, K. Impacts of low frequency variability modes on Canadian winter temperature. Int. J. Climatol. 2001, 21, 95–108. [Google Scholar] [CrossRef]
- Shabbar, A.; Bonsal, B. Associations between low frequency variability modes and winter temperature extremes in Canada. Atmos. Ocean 2004, 42, 127–140. [Google Scholar] [CrossRef]
- Zhang, J.; Wu, L.; Huang, G.; Notaro, M. Relationships between large-scale circulation patterns and carbon dioxide exchange by a deciduous forest. J. Geophys. Res. Atmos. 2011, 116. [Google Scholar] [CrossRef]
- Wang, J.; Bai, X.; Leshkevich, G.; Colton, M.; Cutes, A.; Lofgren, B. Severe ice cover on Great Lakes during winter 2008–2009. Eos 2010, 91, 41–52. [Google Scholar] [CrossRef]
- Bai, X.; Wang, J.; Sellinger, C.; Clites, A.; Assel, R. Interannual variability of Great Lakes ice cover and its relationship to NAO and ENSO. J. Geophys. Res. Atmos. 2012, 117. [Google Scholar] [CrossRef]
- Bai, X.; Wang, J.; Austin, J.; Schwab, D.J.; Assel, R.; Clites, A.; Bratton, J.F.; Colton, M.; Lenters, J.; Lofgren, B.; et al. A record-breaking low ice cover over the Great Lakes during winter 2011/2012: Combined effects of a strong positive NAO and La Niña. Clim. Dynam. 2014. [Google Scholar] [CrossRef]
- Brown, L.C.; Duguay, C.R. The response and role of ice cover in lake-climate interactions. Prog. Phys. Geog. 2010, 34, 671–704. [Google Scholar] [CrossRef]
- Goodale, C.L.; Apps, M.J.; Birdsey, R.A.; Field, C.B.; Heath, L.S.; Houghton, R.A.; Jenkins, J.C.; Kohlmaier, G.H.; Kurz, W.; Liu, S.; et al. Forest carbon sinks in Northern Hemisphere. Ecol. Appl. 2002, 12, 891–899. [Google Scholar] [CrossRef]
- Woodbury, P.B.; Smith, J.E.; Heath, L.S. Carbon sequestration in the U.S. forest sector from 1990 to 2010. For. Ecol. Manag. 2007, 241, 14–27. [Google Scholar] [CrossRef]
- Fleming, S.W.; Whitfield, P.H.; Moore, R.D.; Quilty, E.J. Regime-dependent streamflow sensitivities to Pacific climate modes cross the Georgia-Puget transboundary ecoregion. Hydrol. Process. 2007, 21, 3264–3287. [Google Scholar] [CrossRef]
- Shabbar, A.; Khandekar, M. The impact of El Niño-Southern Oscillation on the temperature field over Canada. Atmos. Ocean 1996, 34, 401–416. [Google Scholar] [CrossRef]
- Higgins, R.W.; Leetmaa, A.; Kousky, V.E. Relationships between climate variability and winter temperature extremes in the United States. J. Clim. 2002, 15, 1555–1572. [Google Scholar] [CrossRef]
- Hoerling, M.P.; Kumar, A.; Zhong, M. El Niño, La Niña, and the nonlinearity of their teleconnections. J. Clim. 1997, 10, 1769–1786. [Google Scholar] [CrossRef]
- Wu, A.; Hsieh, W.W.; Shabbar, A. The nonlinear patterns of North American winter temperature and precipitation associated with ENSO. J. Clim. 2005, 18, 1736–1752. [Google Scholar] [CrossRef]
- Rodionov, S.; Assel, R.A. Winter severity in the Great Lakes region: A tale of two oscillations. Clim. Res. 2003, 24, 19–31. [Google Scholar] [CrossRef]
- Assel, R.A.; Janowiak, J.E.; Boyce, D.; O’Connors, C.; Quinn, F.H.; Norton, D.C. Laurentian Great Lakes ice and weather conditions for the 1998 El Niño winter. B. Am. Meteorol. Soc. 2000, 81, 703–717. [Google Scholar] [CrossRef]
- LaValle, P.D.; Lakhan, V.C.; Trenhaile, A.S. Short term fluctuations of Lake Erie water levels and the El Niño/Southern Oscillation. Gt. Lakes Geogr. 2000, 7, 1–8. [Google Scholar]
- Meadows, G.A.; Meadows, L.A.; Wood, W.L.; Hubertz, J.M.; Perlin, M. The relationship between Great Lakes water levels, wave energies and shoreline damage. B. Am. Meteorol. Soc. 1997, 78, 675–683. [Google Scholar] [CrossRef]
- Mantua, N.J.; Hare, S.R.; Zhang, Y.; Wallace, J.M.; Francis, R.C. A pacific interdecadal climate oscillation with impacts on salmon production. B. Am. Meteorol. Soc. 1997, 78, 1067–1079. [Google Scholar] [CrossRef]
- Mantua, N.J.; Hare, S.R. The Pacific Decadal Oscillation. J. Oceanogr. 2002, 58, 35–44. [Google Scholar] [CrossRef]
- Gershunov, A.; Barnett, T.P. Interdecadal modulation of ENSO teleconnections. B. Am. Meteorol. Soc. 1998, 79, 2715–2725. [Google Scholar] [CrossRef]
- Leathers, D.J.; Yarnal, B.; Palecki, M.A. The Pacific-North American teleconnection pattern and United States climate. Part I: Regional temperature and precipitation associations. J. Clim. 1991, 4, 517–528. [Google Scholar] [CrossRef]
- Abeysirigunawardena, D.S.; Gilleland, E.; Bronaugh, D.; Wong, P. Extreme wind regime responses to climate variability and change in the inner south coast of British Columbia, Canada. Atmos. Ocean 2009, 47, 41–61. [Google Scholar] [CrossRef]
- Angel, J.R.; Isard, S.A. The frequency and intensity of Great Lake cyclones. J. Clim. 1998, 11, 61–71. [Google Scholar] [CrossRef]
- Quiring, S.M.; Goodrich, G.B. Nature and causes of the 2002 to 2004 drought in the southwestern United States compared with the historic 1953 to 1957 drought. Clim. Res. 2008, 36, 41–52. [Google Scholar] [CrossRef]
- Barnston, A.G.; Livezey, R.E. Classification, seasonality and persistence of low-frequency atmospheric circulation patterns. Mon. Weath. Rev. 1987, 115, 1083–1126. [Google Scholar] [CrossRef]
- Mioduszewski, J.R.; Rennermalm, A.K.; Robinson, D.A.; Mote, T.L. Attribution of snowmelt onset in Northern Canada. J. Geophys. Res Atmos. 2014, 119, 9638–9653. [Google Scholar] [CrossRef]
- Hurrell, J.W.; van Loon, H. Decadal variations in climate associated with the North Atlantic Oscillation. Clim. Chang. 1997, 36, 301–326. [Google Scholar] [CrossRef]
- Thompson, D.W.J.; Wallace, J.M. The Arctic Oscillation signature in the wintertime geopotential heigh and temperature fields. Geophys. Res. Lett. 1998, 25, 1297–1300. [Google Scholar] [CrossRef]
- Kenyon, J.; Hegerl, G.C. Influence of modes of climate variability on global temperature extremes. J. Clim. 2008, 21, 3872–3889. [Google Scholar] [CrossRef]
- Kenyon, J.; Hegerl, G.C. Influence of modes of climate variability on global precipitation extremes. J. Clim. 2010, 23, 6248–6262. [Google Scholar] [CrossRef]
- Ning, L.; Bradley, R.S. Winter climate extremes over the northeastern United States and southeastern Canada and teleconnections with large-scale modes of climate variability. J. Clim. 2014, 28, 2475–2493. [Google Scholar] [CrossRef]
- Ning, L.; Bradley, R.S. Winter precipitation variability and corresponding teleconnections over the northeastern United States. J. Geophys. Res. Atmos. 2014, 119, 7931–7945. [Google Scholar] [CrossRef]
- Loikith, P.C.; Broccoli, A.J. The influence of recurrent modes of climate variability on the occurrence of winter and summer extreme temperatures over North America. J. Clim. 2014, 27, 1600–1618. [Google Scholar] [CrossRef]
- Tang, Q.; Zhang, X.; Yang, X.; Francis, J.A. Cold winter extremes in northern continents linked to Arctic sea ice loss. Environ. Res. Lett. 2013, 8, 14036. [Google Scholar] [CrossRef]
- Francis, J.A.; Chan, W.; Leathers, D.J.; Miller, J.R.; Veron, D.E. Winter Northern Hemisphere weather patterns remember summer Arctic sea-ice extent. Geophys. Res. Lett. 2009, 36. [Google Scholar] [CrossRef]
- Francis, J.A.; Vavrus, S.J. Evidence linking Arctic amplification to extreme weather in mid-latitudes. Geophys. Res. Lett. 2012, 39. [Google Scholar] [CrossRef]
- Rogers, J.C. The association between the North Atlantic Oscillation and the Southern Oscillation in the Northern Hemisphere. Mon. Weath. Rev. 1984, 112, 1999–2015. [Google Scholar] [CrossRef]
- Huang, J.; Higuchi, K.; Shabbar, A. The relationship between the North Atlantic Oscillation and El Niño-Southern Oscillation. Geophys. Res. Lett. 1998, 25, 2707–2710. [Google Scholar] [CrossRef]
- Giannini, A.; Cane, M.A.; Kushnir, Y. Interdecadal changes in the ENSO teleconnection to the Caribbean Region and the North Atlantic Oscillation. J. Clim. 2001, 14, 2867–2879. [Google Scholar] [CrossRef]
- Brown, R.D. Analysis of snow cover variability and change in Québec, 1948–2005. Hydrol. Process. 2010, 24, 1929–1954. [Google Scholar] [CrossRef]
- Zcheischler, J.; Michalak, A.M.; Schwalm, C.; Mahecha, M.D.; Huntzinger, D.N.; Reichstein, M.; Berthier, G.; Ciais, P.; Cook, R.B.; El-Masri, B.; et al. Impact of large-scale climate extremes on biospheric carbon fluxes: An intercomparison based on MsTMIP data. Glob. Biogeochem. Cy. 2014, 28, 585–600. [Google Scholar] [CrossRef]
- Arain, M.A.; Restrepo-Coupe, N. Net ecosystem production in a temperate pine plantation in southeastern Canada. Agric. For. Meteorol. 2005, 128, 223–241. [Google Scholar] [CrossRef]
- Trant, J. Effects of thinning on carbon dynamics in a temperate coniferous forest. MSc. Thesis, McMaster University, Hamilton, ON, Canada, November 2014. [Google Scholar]
- Peichl, M.; Arain, M.A.; Brodeur, J.J. Age effects on carbon fluxes in temperate pine forests. Agric. For. Meteorol. 2010, 150, 1090–1101. [Google Scholar] [CrossRef]
- Peichl, M.; Brodeur, J.J.; Khomik, M.; Arain, M.A. Biometric and eddy-covariance based estimates of carbon fluxes in an age-sequence of temperate pine forests. Agric. For. Meteorol. 2010, 150, 952–965. [Google Scholar] [CrossRef]
- Bai, X.; Wang, J.; Qinzheng, L.; Wang, D.; Liu, Y. Severe ice conditions in the Bohai Sea, China, and mild ice conditions in the Great Lakes during the 2009/10 winter: Links to El Niño and a strong negative Arctic Oscillation. J. App. Meteorol. Clim. 2011, 50, 1922–1935. [Google Scholar] [CrossRef]
- Coleman, J.S.M.; Rogers, J.C. Ohio River Valley winter moisture conditions associated with the Pacific-North American teleconnection pattern. J. Clim. 2003, 16, 969–981. [Google Scholar] [CrossRef]
- Seager, R.; Kushnir, Y.; Nakamura, J.; Ting, M.; Naik, N. Northern Hemisphere winter snow anomalies: ENSO, NAO and the winter of 2009/10. Geophys. Res. Lett. 2010, 37. [Google Scholar] [CrossRef]
- Dole, R.; Hoerling, M.; Kumar, A.; Eischeid, J.; Perlwitz, J.; Quan, X.; Kiladis, G.; Webb, R.; Murray, D.; Chen, M.; et al. The making of an extreme event: Putting the pieces together. B. Am. Meteorol. Soc. 2014, 95, 427–440. [Google Scholar] [CrossRef]
- Clites, A.H.; Wang, J.; Campbell, K.B.; Gronewold, A.D.; Assel, R.A.; Bai, X.; Leshkevich, G.A. Cold water and high ice cover on Great Lakes in spring 2014. Eos Trans. Am. Geophys. Union 2014, 95, 305–306. [Google Scholar] [CrossRef]
- Khomik, M.; Arain, M.A.; Brodeur, J.J.; Peichl, M.; Restrepo-Coupé, N.; McLaren, J.D. Relative contributions of soil, foliar, and woody tissue respiration to total ecosystem respiration in four pine forests of different ages. J. Geophys. Res. Atmos. 2010, 115. [Google Scholar] [CrossRef]
- Malhi, Y.; Baldocchi, D.; Jarvis, P.G. The carbon balance of tropical, temperate and boreal forests. Plant Cell Environ. 1999, 22, 715–740. [Google Scholar] [CrossRef]
- Grant, R.F.; Barr, A.G.; Black, T.A.; Margolis, H.A.; Dunn, A.L.; Metsaranta, J.; Wang, S.; McCaughey, J.H.; Bourque, C.A. Interannual variation in net ecosystem productivity of Canadian forests as affected by regional weather patterns—A Fluxnet-Canada synthesis. Agric. For. Meteorol. 2009, 149, 2022–2039. [Google Scholar] [CrossRef]
- Hember, R.A.; Lafleur, P.M. Effects of serial dependence and large-scale tropospheric circulation on midlatitude North American terrestrial carbon dioxide exchange. J. Clim. 2008, 21, 751–770. [Google Scholar] [CrossRef]
- IPCC. Managing the Risks of Extreme Events and Disasters to Advance Climate Change Adaptation: Special Report of Working Groups I and II of the Intergovernmental Panel on Climate Change; Cambridge University Press: Cambridge, UK; New York, NY, USA, 2012; p. 582. [Google Scholar]
© 2015 by the authors; licensee MDPI, Basel, Switzerland. This article is an open access article distributed under the terms and conditions of the Creative Commons Attribution license (http://creativecommons.org/licenses/by/4.0/).
Share and Cite
Thorne, R.; Arain, M.A. Influence of Low Frequency Variability on Climate and Carbon Fluxes in a Temperate Pine Forest in Eastern Canada. Forests 2015, 6, 2762-2784. https://doi.org/10.3390/f6082762
Thorne R, Arain MA. Influence of Low Frequency Variability on Climate and Carbon Fluxes in a Temperate Pine Forest in Eastern Canada. Forests. 2015; 6(8):2762-2784. https://doi.org/10.3390/f6082762
Chicago/Turabian StyleThorne, Robin, and M. Altaf Arain. 2015. "Influence of Low Frequency Variability on Climate and Carbon Fluxes in a Temperate Pine Forest in Eastern Canada" Forests 6, no. 8: 2762-2784. https://doi.org/10.3390/f6082762