Article

Soil Nitrogen Transformations and Availability in Upland Pine and Bottomland Alder Forests

1
Department of Environmental Science and Engineering, Ewha Womans University, Seoul 03760, Korea
2
River Basin Research Center, Gifu University, Gifu 501-1193, Japan
3
Department of Environmental Engineering, Konkuk University, Seoul 05029, Korea
4
Forest Practice Research Center, Korea Forest Research Institute, Pocheon 11186, Korea
5
Department of Environmental Science and Ecological Engineering, Graduate School, Korea University, Seoul 02841, Korea
6
Department of Biological and Environmental Science, Qatar University, Doha P.O. Box 2713, Qatar
*
Author to whom correspondence should be addressed.
These authors contributed equally to this work.
Forests 2015, 6(9), 2941-2958; https://doi.org/10.3390/f6092941
Submission received: 28 June 2015 / Revised: 23 August 2015 / Accepted: 24 August 2015 / Published: 27 August 2015
(This article belongs to the Special Issue Nitrogen and Phosphorus Nutrition of Trees and Forests)

Abstract

:
Soil nitrogen (N) processes and inorganic N availability are closely coupled with ecosystem productivity and various ecological processes. Spatio-temporal variations and environmental effects on net N transformation rates and inorganic N concentrations in bulk soil and ion exchange resin were examined in an upland pine forest (UPF) and a bottomland alder forest (BAF), which were expected to have distinguishing N properties. The annual net N mineralization rate and nitrification rate (kg N·ha−1·year−1) were within the ranges of 66.05–84.01 and 56.26–77.61 in the UPF and −17.22–72.24 and 23.98–98.74 in the BAF, respectively. In the BAF, which were assumed as N-rich conditions, the net N mineralization rate was suppressed under NH4+ accumulated soils and was independent from soil temperature. On the other hand, in the UPF, which represent moderately fertile N conditions, net N transformation rates and N availability were dependent to the generally known regulation by soil temperature and soil water content. Stand density might indirectly affect the N transformations, N availability, and ecosystem productivity through different soil moisture conditions. The differing patterns of different inorganic N indices provide useful insight into the N availability in each forest and potential applicability of ion exchange resin assay.

1. Introduction

Soil nitrogen (N) has become a focus of terrestrial ecosystem studies for two main reasons: (1) N availability is a limiting factor for terrestrial ecosystem productivity [1,2,3] and (2) N losses from terrestrial ecosystems impact the atmosphere especially by greenhouse gas emission, aquatic ecosystems by eutrophication, and drinking water by nitrate contamination [4,5]. N mineralization, the microbial conversion of organic N to inorganic N, has been intensively studied because it is believed to be the principal control of N availability to plants in terrestrial ecosystems [6]. Recent progress in the knowledge of and techniques related to organic N and the priming of rhizospheres for N availability has shaken the classical assumption that N mineralization dominates as the primary source of available N, [7,8,9,10]; nevertheless, in field N studies, N mineralization and other inorganic N indices remain meaningful standard measures which provide useful insight.
Environmental controls of N mineralization and availability, particularly temperature and soil moisture, have been investigated through a theoretical model [11], literature review [9,12], laboratory experiments [13,14,15], and field manipulations [16,17,18,19]. For example, soil moisture varies significantly in space and time, and affects various biogeochemical processes in different ways [20,21,22]. Therefore, understanding soil moisture and its effect on N and nutrient processes is essential in soil ecology. Various studies have analyzed the effect of the soil moisture gradient on N mineralization and developed empirical models that describe the response of N mineralization to soil moisture based on laboratory incubation experiments. However, these laboratory studies may insufficiently reflect the effects of soil moisture on N mineralization in nature, where differing soil moisture ranges have indirect effects on N mineralization through other variables, such as the vegetation community, soil chemistry, and substrate availability [23,24,25]. To understand the complex interactions among such environmental factors and N availability, field studies incorporating the repeated measurement on various environmental conditions are necessary since they can better reflect the temporal and spatial variation of soil moisture and substrate gradients.
Numerous N indices techniques, each with respective advantages and limitations, have been used to trace the real availability of N under various conditions [6,26]. These techniques include ascertaining net N mineralization using a buried bag or resin core, net N mineralization potential using laboratory incubation, gross N mineralization and immobilization using a stable N isotope, and the total or inorganic N concentration of bulk soil. Although ion exchange resins (IERs) that efficiently adsorb “available” inorganic N from soil would provide an alternative useful measure of N availability by imitating the N uptake processes of plant roots [6,27,28], they have been rarely applied to soil N studies, and the knowledge and insight so far gained from this measure of N availability has been limited. Furthermore, because no single N index can give complete insight into N availability [6], a measurement of multiple N indices increases the understanding of N availability and its relationship with environmental variables. Therefore, this study uses multiple N indices, including IER assays.
The aim of the current study was to investigate net N transformation and N availability in an upland pine forest and a bottomland alder forest, which are expected to have distinguishing N properties due to the different species functional type and topography. Broad-leaved deciduous and coniferous forests are generally assumed to be developed on fertile and infertile soils, respectively [29,30,31], even though several recent syntheses failed to find the general pattern and harmonized empirical evidences supporting this assumption [32,33]. Consequently, distinctive litter N properties between broad-leaved deciduous and coniferous trees respectively affect soil N availability [34]. Topography also discriminates various soil processes coupled with hydrology. Therefore, the upland pine forest and the bottomland alder forest could be assumed to represent N-moderate and N-rich environments, respectively, and the forests would exhibit distinctive N cycle processes. Specifically, our objectives were: (1) to determine the spatio-temporal patterns of net N transformation rates and N availability and their relationship with environmental factors under different stand densities or soil moisture conditions; (2) to analyze the similarities and differences of multiple N indices, including IER assays, to better understand N availability; and (3) to characterize the soil N transformation, availability, and uptake in each forest.

2. Materials and Methods

2.1. Study Sites

This study was carried out in an upland pine forest (UPF) and a bottomland alder forest (BAF) in central Korea (Table 1). The UPF is located in a rural mountainous area, 30 km north of the city Seoul at Gwangneung Experimental Forest (37°47′01″ N, 127°10′37″ E, 410–440 m a.s.l.). The canopy is dominated by Japanese red pine (Pinus densiflora Sieb. et Zucc.) with deciduous middle and understory species (e.g., Acer palmatum, Carpinus laxiflora, C. cordata, Fraxinus rhynchophylla, Quercus mongolica, Q. variabilis, and Styrax obassia). The UPF area is typical of the upland pine forest that is the most common forest type in South Korea and represents 23.1% of the total national forest by area. The BAF is located at Heonilleung Ecosystem Landscape Conservation Area (37°27′52″ N, 127°04′53″ E, 40 m a.s.l.) in a southern suburb of Seoul. The canopy is dominated by Japanese alder (Alnus japonica Steud.) with several middle and understory species (e.g., Euonymus oxyphyllus, F. rhynchophylla, Ginkgo biloba, Ligustrum obtusifolium, Q. aliena, Q. mongolica, and Rosa multiflora). Japanese alder is a typical species tolerant of hydric conditions in East Asian bottomlands [35,36], although its cover is currently small due to land use change. Interestingly, both forests have been well preserved from a harvest for hundreds of years due to the preservation of the royal tombs established within them during the 15th century [37,38]. The forests were sheltered from disturbances during the first half of the 20th century, in which the rule of Japanese Imperialism (1910–1945) and the Korean War (1950–1953) severely degraded nation-wide forests. The forests could provide reference status of the upland and bottomland forests in Korea, accompanied with abundant previous studies [25,39,40,41,42].
Table 1. Characteristics of the upland pine forest (UPF) and bottomland alder forest (BAF) study sites. Numbers in parentheses indicate the standard error of the means. Climate data was obtained from the nearest meteorological stations and site description data was taken from previous studies of the UPF [39,41] and BAF [25,42].
Upland Pine Forest (UPF)Bottomland Alder Forest (BAF)
Low Density (LD)High Density (HD)Low Moisture (LM)Middle Moisture (MM)High Moisture (HM)
Site (1980–2010 average for climate data)
 Location37°47′01″ N, 127°10′37″ E Rural area 30 km north of Seoul37°27′52″ N, 127°04′53″ E Southern suburb of Seoul
 Altitude (m)410–44040
 Aspect, slope (°)West, 13–22South, <1
 Temperature (°C)11.4 (monthly range: −5.0–26.5)13.5 (monthly range: −1.9–27.2)
 Annual precipitation (mm)14711473
Vegetation (in 2007 for the UPF and in 2009 for the BAF)
 Canopy speciesPinus densifloraAlnus japonica
 Density (trees·ha−1)9831517900575550
 Diameter at breast height (cm)20.517.632.627.124.2
 Aboveground biomass (Mg C·ha−1)88.186.7187.978.961.8
 Needle or leaf litter C:N ratio72.7 (2.0)73.2 (2.2)21.8 (0.3)20.8 (0.2)18.6 (0.2)
 Total N storage (Mg N·ha−1)0.780.781.650.740.60
Soil (0–15 cm; during the study period)
 Soil textureSilt loamSilt loamSandy loamSandy loamSilt loam
 Bulk density (g·cm−3)1.05 (0.04)1.02 (0.03)0.86 (0.06)0.81 (0.03)0.50 (0.14)
 Soil water content (kg·kg−1)0.25 (0.02)0.20 (0.03)0.35 (0.06)0.72 (0.17)1.23 (0.10)
 pH4.54 (0.03)4.56 (0.01)4.45 (0.07)5.04 (0.10)5.14 (0.04)
 Total C concentration (g·kg−1)33.4 (2.3)29.7 (2.1)20.8 (2.0)31.2 (1.8)61.7 (2.3)
 C:N ratio15.8 (0.4)17.8 (0.4)9.6 (0.3)12.4 (0.2)12.3 (0.1)
 Total N storage (0–30 cm; Mg N·ha−1)3.62 (0.24)2.98 (0.12)4.64 (0.52)5.06 (0.70)7.14 (0.20)
The sites are only 35 km apart and at the sites, precipitation was similar (Table 1). Temperature, however, differs and the UPF, due to its higher altitude, is slightly colder than the BAF. Their soils are classified into silt loam or sandy loam and are acidic (pH: 4.45–5.14) at both sites. The UPF had less soil water content (SWC) than the BAF during the all study period (Figure S1f), reflecting the topographical characteristics of each site. Moreover, the UPF and the BAF would be determined as moderately fertile (medium) and N-rich (high) conditions, respectively, based on the needle or leaf litter and soil C:N ratio, and total N (sum of organic and inorganic N) storage in vegetation and soil, using the nutrient availability criteria by Vicca et al. [43].
UPF stands were classified by stand density and BAF stands were classified by soil moisture, in order to characterize the spatial variability of stand structure and ecological processes in each type of forest (for UPF see [39,41] and for BAF see [25,42]). Stand density and soil hydrology are assumed to be the main environmental driver of upland forest and bottomland ecosystems, respectively; this assumption is generally applied to ecosystem management practices in each ecosystem. In the UPF, low density (LD; 983 trees·ha−1) and high density (HD; 1517 trees·ha−1) stands were selected and in the BAF, low moisture (LM), middle moisture (MM), and high moisture (HM) stands were selected with SWC of <0.50, 0.50–1.00, and 1.00–2.00 kg·kg−1, respectively. Note that the MM and HM stands, which were underlain with poorly drained soils, can be classified as forested wetland. Three replicate plots, each covering 400 m2 in the UPF and 100 m2 in the BAF, were established in each stand.

2.2. Field Experiment and Laboratory Analysis

Three inorganic N indices of top mineral soils, net N transformation rates, inorganic N concentrations in bulk soil and IER assays, were investigated at five points, every 2 m along a single transect across each plot from March 2008 to April 2009. Net N transformation rates including net N mineralization and net nitrification were determined using a field incubation method [44]. Two soil cores from the 0–15 cm mineral layer were sampled from the five points in each plot. The soil sample for determining soil status before field incubation was taken immediately to the laboratory at a cool temperature (<4 °C) and analyzed for inorganic N concentrations in bulk soil. The other soil sample, the field incubation sample, was put into a gas permeable polyethylene bag and returned to its original location. After 45 days, the incubated soil core was collected and also taken to the laboratory for analysis. This soil sampling and incubation procedure was repeated every 45 days, except for a 90 day winter interval due to the difficulty of sampling and incubating frozen soil.
Two IER bags, which were made of stocking nylon and contained 14 mL of either anion or cation resins (Sybron IONAC ASB-1P OH and C-251 H+, Sybron International, Birmingham, NJ, USA), were placed 10 cm below the surface of the mineral soil in each plot, near the five sampling points of the initial and incubated soils. The IER bags were retrieved and replaced every 90 days.
In the laboratory, the moist initial and incubated soil samples were subjected to an extraction process with 2 M KCl solution for 24 h, immediately upon arrival from the sites. The IERs were air-dried first, and then the inorganic N ions were extracted. The extracts were filtered through Whatman No. 42 filter paper and the NH4+ and NO3 concentrations were determined colorimetrically using a flow-injection auto analyzer (QuikChem AE, Lachat Instruments, Loveland, CO, USA). The NH4+ and NO3 concentrations extracted from moist initial and incubated soil samples were corrected to a dry soil basis using the gravimetric SWC ((moist soil weight – dry soil weight)/dry soil weight) of each soil.
The net N mineralization and net nitrification rates were calculated as the difference between the NH4+ and NO3 concentrations of the incubated and initial soil samples. Annual net N mineralization and annual net nitrification per unit area in the upper 15 cm mineral soil layer was calculated by summing the net N mineralization and net nitrification values of incubation periods spanning a year [6,45].
Annual N uptake was estimated from aboveground net primary productivity (ANPP) multiplied by the concentrations of N in woody tissues and leaves, determined using an elemental analyzer (Vario Macro CN analyzer, Elementar Analysensysteme GmbH, Hanau, Germany). ANPP was calculated as the sum of total aboveground biomass increment and litter production (See [41] for details in the UPF.). Aboveground biomass in the BAF was calculated using a DBH-based allometric equation [46] and C concentrations in each compartment determined by the elemental analyzer.

2.3. Statistical Analysis
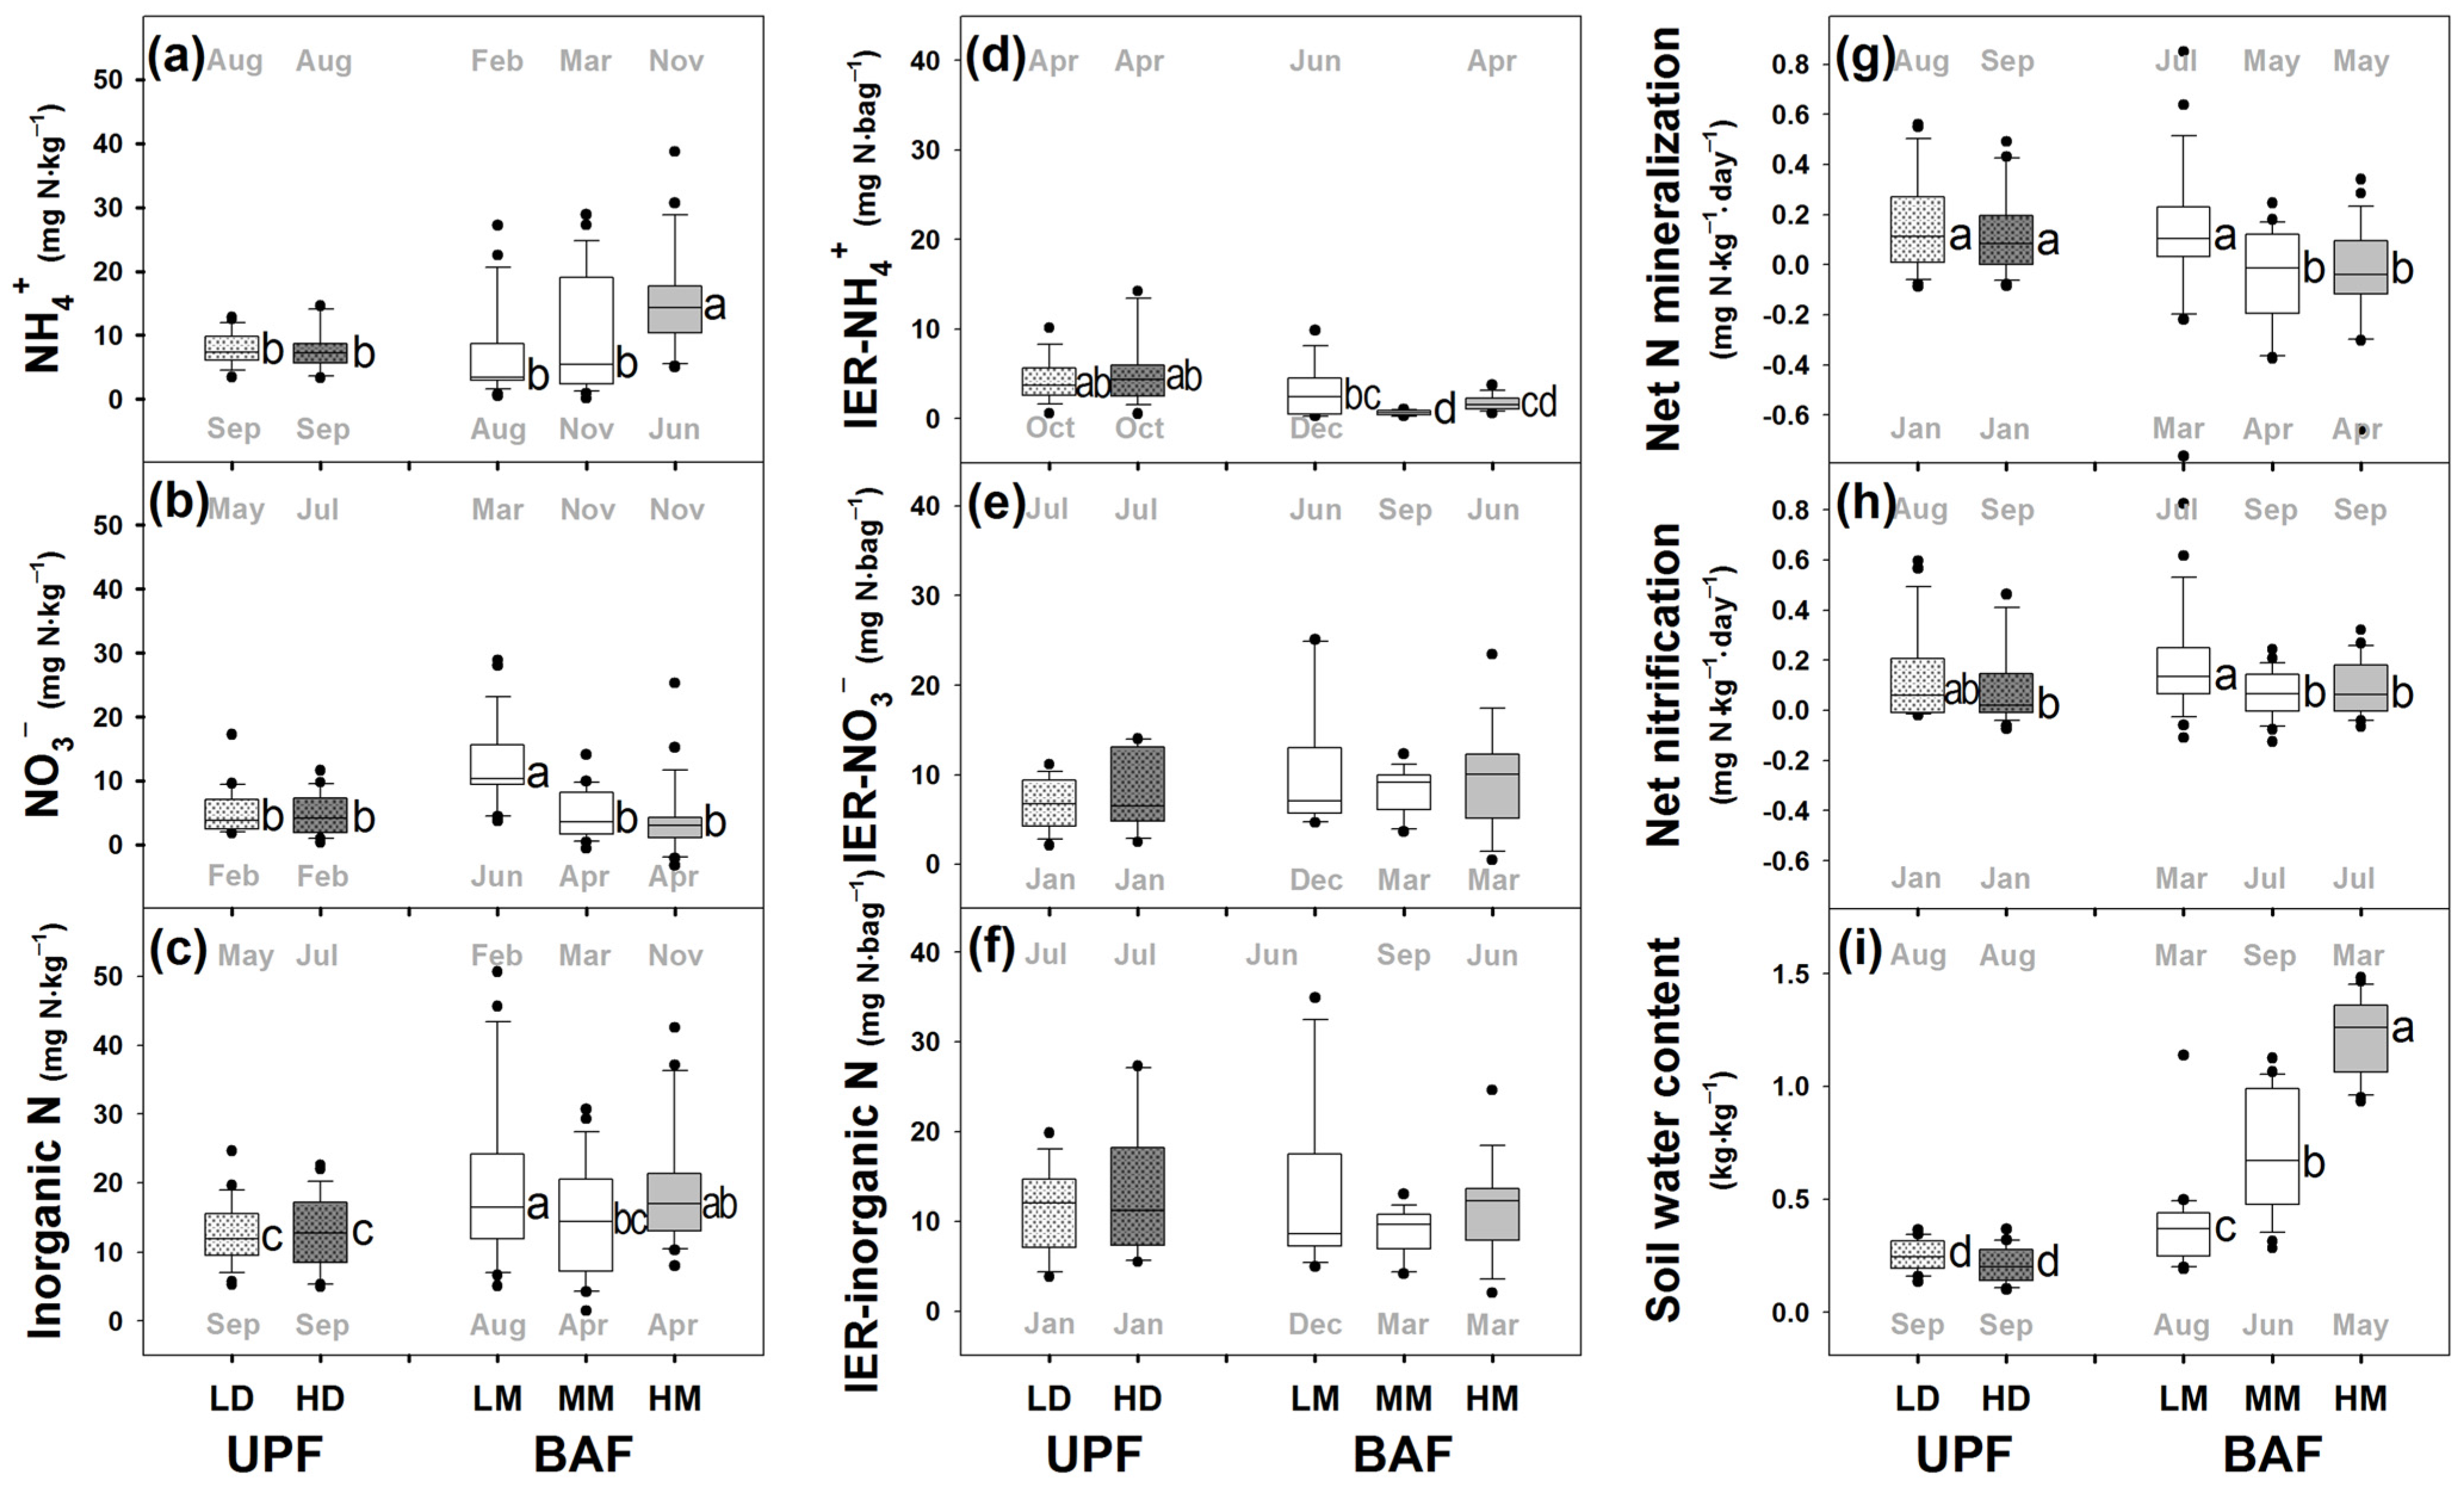
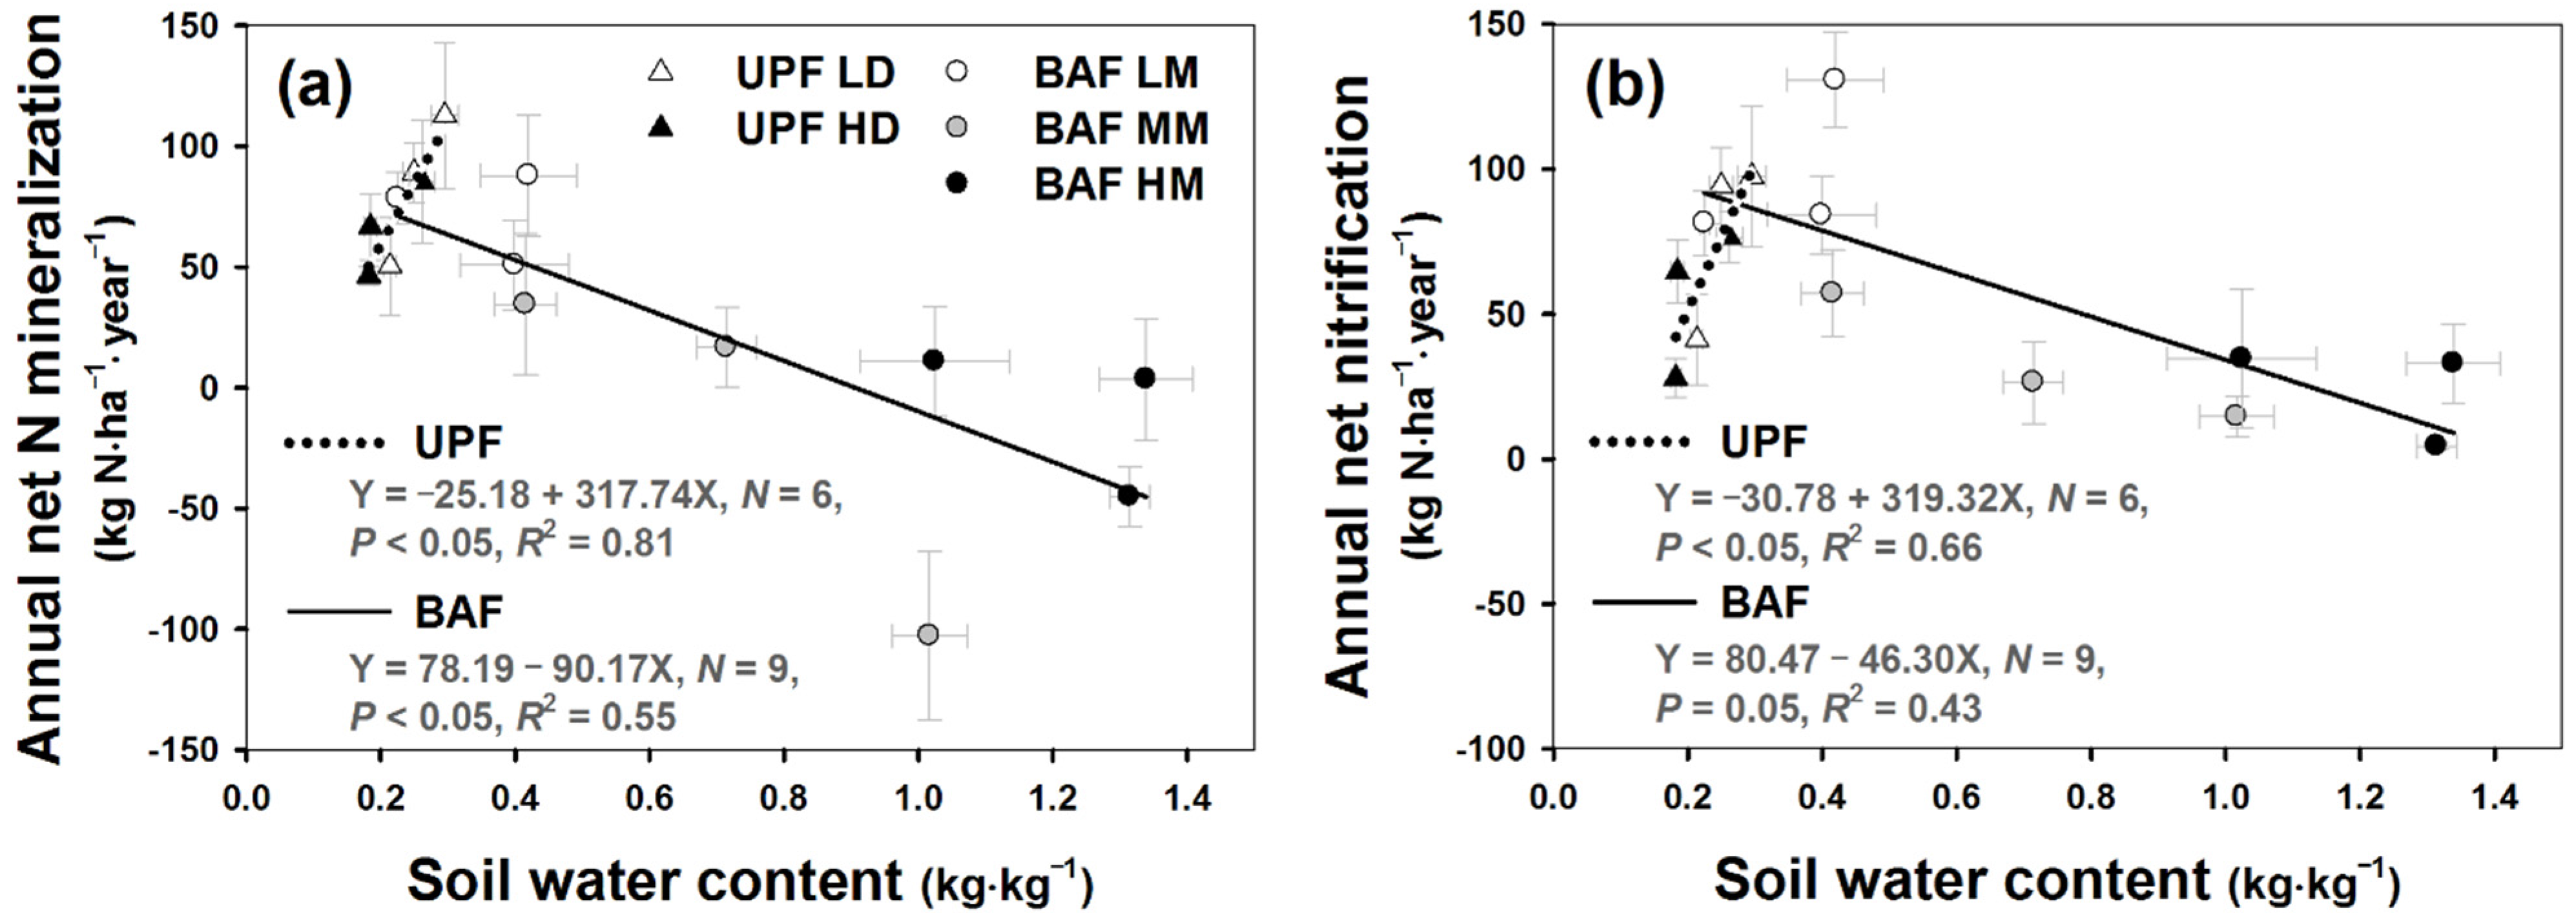
The values of the five soil samples from each plot were averaged. Thus, plots, of which there were three in each stand, were considered as true replicates. Correlation and regression analyses were conducted on the data derived from individual plots to take into account the spatial variability within each stand. Significant differences in net N transformation rates, inorganic N concentrations in bulk soil and IER, and SWC across stands and seasons were tested using the two-way analysis of variance (ANOVA). Duncan’s multiple range test was performed to determine the differences between the means of each stand, when the ANOVA model was significant (p < 0.05). Correlation and regression analyses were conducted among the N indices and soil environment variables. All statistical analyses were conducted using R [47].

3. Results

The mean NH4+, NO3, and total inorganic N concentrations in bulk soils varied significantly between the stands (Figure 1, p < 0.01). NH4+ was abundant at the HM and the MM BAF stands (Figure 1a); whereas NO3 was rich at the LM BAF stand (Figure 1b). Total inorganic N concentration was lowest at the UPF stands (Figure 1c). As a proportion of total inorganic N, the N in NH4+ form represented 61% in the LD UPF stand, 63% in the HD UPF stand, and 36%, 69%, and 78% in the LM, MM, and HM BAF stands, respectively. Conversely, as a proportion of total inorganic N, the N in NO3 form represented 39% in the LD UPF stand and 37% in the HD UPF stand and 64%, 31%, and 22% in the LM, MM, and HM BAF stands, respectively. There were also differences in the seasonal patterns of NH4+ and NO3 levels and of total inorganic N concentrations in bulk soils between the sites. Whereas in the UPF, inorganic N concentrations increased during the growing season (May to August), in the BAF, they were lower (Figure 1a–c, Figure S1).
The total IER-inorganic N and IER-NO3 concentrations did not vary significantly (Figure 1e,f). However, IER-NH4+ concentration (mg N·bag−1) did differ between the stands; it was highest at the HD UPF stand (5.17), followed by the LD UPF stand (4.29), and then the LM (3.01), HM (1.75), and MM (0.66) BAF stands in turn (Figure 1d). IER-NO3 accounted for a major portion of IER-inorganic N (61%–93%) and, conversely, IER-NH4+ accounted for a very small portion of IER-inorganic N, especially at the MM (7%) and HM (15%) BAF stands. In MM and HM, the majority proportion of IER inorganic NO3 strongly contrasted that of NH4+ in bulk soil.
The net N transformation rates were higher under the drier stands (LD and HD UPF and LM BAF) than the wetter ones (MM and HM BAF) (Figure 1g,h). Negative net N mineralization rate was observed in the MM and HM BAF stands (Figure 1g). The seasonal pattern of net N transformation rates at the UPF stands and the LM BAF stand closely followed that of soil temperature (Figure S1g,h), in that the rates increased in the growing season and decreased in the non-growing season. On the other hand, the seasonal pattern was not clear at MM and HM BAF stands; negative net N mineralization rates were observed during most seasons (Figure S1g).
Figure 1. Inorganic N indices in an upland pine forest (UPF) with different stand densities and a bottomland alder forest (BAF) with different soil moisture content. (ac) Inorganic N concentrations in bulk soil; (df) Inorganic N concentrations attached to ion exchange resin (IER); (g,h) Net N transformation rates; (i) Soil water content. Months written at the top and the bottom of each panel indicate the months corresponding to the highest and lowest values. Letters beside boxes indicate the significant difference, if there is one, among the means determined by Duncan’s multiple range tests.
Forests 06 02941 g001
Table 2 shows the correlations between inorganic N indices and environmental variables. Generally, inorganic N indices in the UPF were considerably dependent to soil temperature and SWC; meanwhile, those in the BAF were less dependent to the environmental variables. IER-NO3, IER-inorganic N, net N mineralization, and net nitrification were positively correlated with soil temperature in both the UPF and BAF. Correlation coefficients were higher in the UPF (r = 0.57–0.71) than the BAF (r = 0.24–0.47). NH4+ and inorganic N only in the UPF and IER-NH4+ only in the BAF were correlated with soil temperature. NH4+, inorganic N, net N mineralization and net nitrification in the UPF (r = 0.46–0.60) and NH4+ in the BAF (r = 0.57) were positively correlated with SWC. On the other hand, NO3 (r = −0.49), net N mineralization (r = −0.37), and net nitrification (r = −0.29) in the BAF were negatively correlated with SWC.
Table 2. Environmental dependence of inorganic N indices in an upland pine forest (UPF) and a bottomland alder forest (BAF). A correlation coefficient (r) that satisfies the statistical significance is presented (p < 0.05). A dash indicates insignificant.
Soil TemperatureSoil Water Content
UPFBAFUPFBAF
NH4+0.310.54 0.57
NO3−0.48
Inorganic N0.340.43
IER-NH4+0.37
IER-NO30.710.46
IER-inorganic N0.570.47
Net N mineralization0.580.240.56−0.37
Net nitrification0.670.320.60−0.29
Spatio-temporal variations of net N mineralization and NH4+ were related, especially in the BAF (Figure 2). In the BAF, a significant negative relationship between net N mineralization and NH4+ was observed (Figure 2b, p < 0.001, R2 = 0.45), whereas, in the UPF, the positive and weak relationship was only close to marginally significant (Figure 2a, p = 0.10, R2 = 0.06). Seasonal patterns of the net N mineralization rate and of NH4+ concentration were coupled in the UPF (Figure 2c,d), but inversely coupled in the BAF (Figure 2e–g).
Figure 2. (a,b) Relationship between NH4+ concentrations and net N mineralization rates in an upland pine forest (UPF) and a bottomland alder forest (BAF); (cg) Seasonal patterns of net N mineralization rates and NH4+ concentrations in the UPF and the BAF.
Forests 06 02941 g002
The annual net N mineralization rate (kg N·ha−1·year−1) was higher at the LD (84.01 ± 18.18) and HD (66.05 ± 11.25) UPF stands and the LM BAF stand (72.24 ± 11.13) than at the MM (−17.22 ± 43.10) and HM (−10.26 ± 17.60) BAF stands (Table 3, p < 0.01). The annual net N nitrification rate (kg N·ha−1·year−1), from highest to lowest, was LM (98.74 ± 16.01) ≥ LD (77.61 ± 18.26) = HD (56.26 ± 14.56) ≥ MM (32.69 ± 12.67) = HM (23.98 ± 9.80) (Table 3). Figure 3 describes the relationship between SWC and annual net N transformation rates. In the BAF, annual N transformation rates showed a linear inverse correlation with SWC. In contrast, in the UPF the correlation was close to being positive. Annual N uptake (kg N·ha−1·year−1) was estimated to be 73.19, 60.18, 191.77, 141.21, and 128.76 for LD, HD, LM, MM, and HM stands, respectively (Table 3).
Table 3. Summary of net N transformation rates, N availability, N uptake, and ANPP.
Annual Net N Mineralization Rate Annual Net Nitrification Rate IER-NH4+ IER-NO3 IER-Total Inorganic N Annual N Uptake ANPP §
UPF
LD84.01 ± 18.1877.61 ± 18.264.29 ± 0.496.81 ± 0.5811.10 ± 0.9773.196.17
HD66.05 ± 11.2556.26 ± 14.565.17 ± 0.798.17 ± 0.8813.34 ± 1.5360.185.03
BAF
LM72.24 ± 11.1398.74 ± 16.013.03 ± 0.5910.73 ± 1.4313.76 ± 1.98191.775.01
MM−17.22 ± 43.1032.69 ± 12.670.66 ± 0.058.14 ± 0.528.80 ± 0.54141.216.06
HM−10.26 ± 17.6023.98 ± 9.801.75 ± 0.179.62 ± 1.1311.37 ± 1.07128.764.51
IER; ion exchange resin, ANPP; aboveground net primary productivity; Unit: kg N·ha−1·year−1; mg N·bag−1; § Mg C·ha−1·year−1.
Figure 3. Relationship between gravimetric soil water content and (a) annual net N mineralization or (b) nitrification rates.
Forests 06 02941 g003

4. Discussion

The results in the UPF corresponded to the general established patterns of N availability in forest soils [12,13,14,15,16,18]. For example, net N transformation rates increased with soil temperature and SWC (Table 2, Figure 2). Net N transformation rates and inorganic N availability were higher during the growing season and lower during the non-growing season (Figure 1). Spatio-temporal patterns of three inorganic N indices, N transformation rates, IER-inorganic N, and bulk soil inorganic N concentrations, corresponded with each other (Figure 1). Results for the LM BAF stand were also similar to general established patterns.
However, some abnormal results, mainly from MM and HM BAF stands, led to some unanswered questions. Why was net N mineralization negatively related to bulk NH4+ concentration (Figure 2)? Why was IER-NH4+ low at the MM and HM BAF stands where bulk soil NH4+ concentration was high (Figure 1)? Moreover, could negative net N mineralization occur in ecosystems that require a substantial amount of N to sustain plant uptake (Figure 1, Table 3)? In addition, for the UPF stands, what was the effect of stand density on soil N transformation rates and N availability?

4.1. Restricted Net N Mineralization under NH4+ Rich Condition

Net N transformation rates were independent of soil temperature in the MM and HM BAF stands. Net N transformation rates in the wetter stands (MM and HM) were restricted by the high SWC as compared to the drier stand (LM) (Figure 1 and Figure 3, Table 2). SWC could limitedly explain the spatio-temporal variations in soil N transformation rates and inorganic N indices (Table 2), unlike the soil carbon processes and soil properties which were strongly regulated by SWC in the previous studies [25,42]. Correlation between SWC and net N mineralization and net nitrification rates were much weaker in the BAF (r = −0.29 and −0.37) than in the UPF (r = 0.56 and 0.60) (Table 2). While soil moisture strongly regulated soil properties and soil C processes in the BAF [25,42], it only weakly affected N transformations processes.
Instead, the net N mineralization rate in the BAF was best explained by the negative relationship with NH4+ concentration (Figure 2b,f,g). Ideally, NH4+ will increase as a result of a net N mineralization process even though a proportion of mineralized NH4+ can be lost by plant uptake or nitrification. However, net N mineralization rate was low for soils with a high level of NH4+ in the BAF. This unexpected result can be speculated that a high level of NH4+ in bulk soil may have reduced the microbial activities involved in the mineralization process. Theoretically, the enzyme activities involved in mineralization could be negatively affected by nutrient availability because of the cost-efficiency strategy of microbes, known as the “microbial nitrogen mining” hypothesis [48,49]. When N is less available, microbes actively mine recalcitrant organic matter to acquire it; whereas, in N rich environments, microbes can assimilate inorganic N without costly mineralization activity. Although the relationship between inorganic N availability and microbial activities have been reported to be both positive [50,51] and negative [52,53,54] in empirical studies mainly based on fertilization experiments in forests, wetlands, or agricultural land, a meta-analysis of Treseder [55] suggested that N addition reduced microbial biomass by 15% and, consequently, also microbial activities such as soil respiration. Those articles could provide a theoretical proof and empirical evidence supporting the decrease of net N mineralization under high NH4+ concentrations in the BAF. Consequently, the intensive restricting effect of NH4+ on net N mineralization probably overspread the effect of soil temperature or SWC.
Meanwhile, it could be questioned how the high soil NH4+ concentration could be supported with a deficient inorganic N supply from extremely low net N mineralization. In the wet soils of the MM and HM stands, a major source of inorganic N was not N mineralization which was nearly zero year-round due to the inhibiting effect of high soil moisture on N mineralization. Instead, inorganic N could be supplied through atmospheric N deposition [56,57], accumulation of external N through run-off from upland forests [4,58], and symbiotic and non-symbiotic N fixation [59,60]. For instance, Shin et al. [57] reported notable atmospheric N deposition in Seoul (16.5 kg N·ha−1·year−1 for NH4+ and NH3 deposits and 18.1 kg N·ha−1·year−1 for NO3, NO2 and HNO3 deposits); the BAF is located within the range of the urban effect on atmospheric N deposition [61]. N fixation of pure alder forests was known to be 37–150 kg N·ha−1·year−1 [62]. Even though lack of atmospheric N deposition and N fixation data in our study limits the certainty and depth of this implication, evidences from other studies suggest that there may be sufficient NH4+ sources without N mineralization. In addition, at MM and HM, the anaerobic conditions could have restricted the nitrification process, especially since the mean net nitrification rate at MM and HM was two to three times lower than that at LM (Figure 1), and this would tend to conserve NH4+ as the major form of inorganic N. The dominance of NH4+ in the inorganic N pool agreed with previous studies from alder forests [18,63] and wetlands [17,64].

4.2. Discrepancy among Inorganic N in Bulk Soil and IER, and Net N Transformation Rates: Which N Indices Could Describe the Real Status of N Availability?

The net N mineralization rate and IER-NH4+ were extremely low whereas soil NH4+ concentration was high at MM and HM BAF stands. Why was there a discrepancy between bulk soil and IER-NH4+ concentration? Understanding this discrepancy may elucidate the real status of N availability from the balance among microbial mineralization and immobilization, soil adsorption and desorption, and plant root uptake in the field. The low value of IER-NH4+ at MM and HM suggests that the rich NH4+ in bulk soil were not actually assimilated by plants. Due to the strong affinity of NH4+ for negatively charged soil organic matter, NH4+ may be strongly associated with soil organic matter and unavailable to plants [18] at the MM and HM stands where soil organic matter concentration was high (Table 1). This hypothesis is supported by the positive relationship between soil NH4+ and total carbon concentration (p < 0.001, R2 = 0.53). On the other hand, the pattern of NO3 concentration in soil and IER showed an opposite pattern to that of NH4+; soil NO3 concentration was low and IER-NO3 was high. The low soil NO3 concentration is likely due to its high uptake by plants, as suggested by the high IER-NO3. Abundant moisture at MM and HM could increase the availability of NO3 since it is mobilized by soil moisture.
This result implies that IER or ion exchange membranes could be comprehensive and practical indices for N availability in reality [27,65], even though the lack of standardized application remains the challenge [66]. The assumption that plant available N is mainly driven through N mineralization, was not applicable in the MM and HM BAF stands; net N transformation rates failed to meet the interest in N availability. On the other hand, IER assay data would be the best indirect measure of N availability unless the direct measure of plant uptake using stable isotope. An additional advantage of IER or ion exchange membrane assays is to determine availabilities of other nutrients such as phosphorus and cations simultaneously with inorganic N [66,67,68].

4.3. Stand Density Effects on Soil N Transformation and Availability

The annual net N mineralization rate of the UPF (84.01 and 66.05 kg N·ha−1·year−1 for LD and HD stands, respectively) was within reasonable range of the generally accepted rate for temperate pine forests (43.6–87.0 kg N·ha−1·year−1 [30,45,69,70]). The differences in net N transformation rates and N availability between LD and HD stands were insignificant according to the statistical tests (Figure 1). Nevertheless, the difference may not be negligible; annual net N mineralization rate, annual net nitrification rate, and IER-inorganic N concentration were 40%, 38%, and 20% higher, respectively, at LD than at HD (Table 3). The higher net N transformation rates and N availability at LD than at HD seem to correspond to the difference in SWC (t-test; p < 0.05). The higher SWC at LD, which was probably due to lower evaporation under the lower stand density and a less steep topography (Table 1), would promote soil N cycling. In addition, the difference of N processes matched that of ANPP in the both stands [41]. ANPP was 23% higher at the LD stands than the HD stands (Table 3). This result supports the relationship between N availability and primary production in forests [1,2,3]. It may provide an implication for stand density control (e.g., forest tending and thinning) with respect to nutrient availability. Stand density control as a management practice can be applied to improve nutrient use efficiency for tree production associated with C sequestration in unmanaged pine forests with high stand density in Korea [71,72]. In addition, this application may contribute to maintenance of stability in stand dynamics by reducing density-dependent tree mortality [73].

5. Conclusions

The UPF and BAF are presented, distinguishing net N transformation rates, availabilities, and environmental controls on those N processes. First, the UPF, which were assumed as moderately fertile environments, confirmed the generally accepted knowledge of net N transformation rates and N availability. Second, soil N transformation rates and N availability at the LM BAF stand represent active N cycling under an N-rich environment. The annual plant N uptake was the highest and the annual net N mineralization rate accounted for 37% of that uptake. The lower net N mineralization (72.24 kg N·ha−1·year−1) than net nitrification (98.74 kg N·ha−1·year−1) at the LM stand indicates that most of the mineralized NH4+ was converted to NO3 during the field incubation. Thus, the relatively low moisture condition at LM supported NO3 accumulation due to the high net nitrification rate and low NO3 loss via leaching and denitrification [19,74,75]. Third, the N-rich and wet MM and HM BAF stands exhibited restricted net N transformation rates and N availability unlike high inorganic N concentration in bulk soils and low C:N ratio in leaf litters and soils.
In the UPF, annual net N mineralization slightly exceeded the annual N uptake (Table 3). As taking account into the potential N input from atmospheric N deposition, plant N uptake did not consume the all N input. The surplus of inorganic N would not be retained in the stands; instead, it might leach to N runoff by a ground water and stream. The N saturation in the UPF agreed with other coniferous stands in this region [76]. Meanwhile, in the BAF annual net N mineralization failed to satisfy the annual N uptake (Table 3); the external N input might be retained in the stands. It suggests the importance of bottomland or riparian forests for N retention function [4,77].
The significant findings are summarized as follows. First, net N transformation rates and N availability were not regulated by SWC and soil temperature, instead regulated by initial soil NH4+ in the MM and HM BAF stands. The net N mineralization rate was inhibited under NH4+-rich soils. The NH4+ accumulation and plant uptake-N might be supplied from external N sources. Second, net N transformation rates, inorganic N concentrations in bulk soil, and those on IER corresponded in the UPF, but did not in the BAF. Discrepancies between the patterns of N availability indices in the BAF may enhance our knowledge of the real status of N availability. Third, differences in soil moisture conditions between high and low density stands might affect N transformation and N availability, and, consequently, ecosystem productivity.

Supplementary Files

Supplementary File 1

Acknowledgments

We appreciate the cooperation of Forest Practice Research Center, Korea Forest Research Institute and Heolleung Office, Culture Heritage Administration of Korea for allowing us access to the UPF and the BAF sites, respectively. We also appreciate Ah Reum Lee, Su Jin Heo, Kyung Won Seo, Sue Kyoung Lee, and Koong Yi for their assistance both in the laboratory and the field. This work was supported by research grants from the Korea Environmental Industry & Technology Institute (C314-00131-0408, G214-00181-0402).

Author Contributions

Tae Kyung Yoon and Nam Jin Noh equally led the field and laboratory work, data analyses, and manuscript writing. Tae Kyung Yoon and Nam Jin Noh have the main authorship of the results from the BAF and UPF, respectively. Haegeun Chung collaborated on discussion of the data and the manuscript writing, especially from the perspective of microbiology. A-Ram Yang contributed to the field and laboratory work and manuscript writing. Yowhan Son supervised the whole process of the study including the experimental design, discussion of the data, and manuscript writing.

Conflicts of Interest

The authors declare no conflict of interest.

References

  1. Binkley, D.; Vitousek, P. Soil nutrient availability. In Plant Physiological Ecology; Pearcy, R., Ehleringer, J., Mooney, H., Rundel, P., Eds.; Chapman and Hall Ltd.: New York, NY, USA, 1989; pp. 75–96. [Google Scholar]
  2. Vitousek, P.M.; Howarth, R.W. Nitrogen limitation on land and in the sea: How can it occur? Biogeochemistry 1991, 13, 87–115. [Google Scholar] [CrossRef]
  3. LeBauer, D.S.; Treseder, K.K. Nitrogen limitation of net primary productivity in terrestrial ecosystems is globally distributed. Ecology 2008, 89, 371–379. [Google Scholar] [CrossRef] [PubMed]
  4. Saunders, D.L.; Kalff, J. Nitrogen retention in wetlands, lakes and rivers. Hydrobiologia 2001, 443, 205–212. [Google Scholar] [CrossRef]
  5. Cameron, K.C.; Di, H.J.; Moir, J.L. Nitrogen losses from the soil/plant system: A review. Ann. Appl. Biol. 2013, 162, 145–173. [Google Scholar] [CrossRef]
  6. Binkley, D.; Hart, S.C. The components of nitrogen availability assessments in forest soils. In Advances in Soil Science; Stewart, B.A., Ed.; Springer: New York, NY, USA, 1989; Volume 10, pp. 57–112. [Google Scholar]
  7. Schimel, J.P.; Bennett, J. Nitrogen mineralization: Challenges of a changing paradigm. Ecology 2004, 85, 591–602. [Google Scholar] [CrossRef]
  8. Frank, D.A.; Groffman, P.M. Plant rhizospheric N processes: What we don’t know and why we should care. Ecology 2009, 90, 1512–1519. [Google Scholar] [CrossRef] [PubMed]
  9. Ros, G.H.; Temminghoff, E.J.M.; Hoffland, E. Nitrogen mineralization: A review and meta-analysis of the predictive value of soil tests. Eur. J. Soil Sci. 2011, 62, 162–173. [Google Scholar] [CrossRef]
  10. Zhu, B.; Gutknecht, J.L.M.; Herman, D.J.; Keck, D.C.; Firestone, M.K.; Cheng, W. Rhizosphere priming effects on soil carbon and nitrogen mineralization. Soil Biol. Biochem. 2014, 76, 183–192. [Google Scholar] [CrossRef]
  11. Manzoni, S.; Porporato, A. Soil carbon and nitrogen mineralization: Theory and models across scales. Soil Biol. Biochem. 2009, 41, 1355–1379. [Google Scholar] [CrossRef]
  12. Paul, K.I.; Polglase, P.J.; O'Connell, A.M.; Carlyle, J.C.; Smethurst, P.J.; Khanna, P.K. Defining the relation between soil water content and net nitrogen mineralization. Eur. J. Soil Sci. 2003, 54, 39–48. [Google Scholar] [CrossRef]
  13. Sierra, J. Temperature and soil moisture dependence of n mineralization in intact soil cores. Soil Biol. Biochem. 1997, 29, 1557–1563. [Google Scholar] [CrossRef]
  14. Guntiñas, M.E.; Leirós, M.C.; Trasar-Cepeda, C.; Gil-Sotres, F. Effects of moisture and temperature on net soil nitrogen mineralization: A laboratory study. Eur. J. Soil Biol. 2012, 48, 73–80. [Google Scholar] [CrossRef]
  15. Sleutel, S.; Moeskops, B.; Huybrechts, W.; Vandenbossche, A.; Salomez, J.; De Bolle, S.; Buchan, D.; de Neve, S. Modeling soil moisture effects on net nitrogen mineralization in loamy wetland soils. Wetlands 2008, 28, 724–734. [Google Scholar] [CrossRef]
  16. Zak, D.R.; Grigal, D.F. Nitrogen mineralization, nitrification and denitrification in upland and wetland ecosystems. Oecologia 1991, 88, 189–196. [Google Scholar] [CrossRef]
  17. Cartaxana, P.; Caçador, I.; Vale, C.; Falcão, M.; Catarino, F. Seasonal variation of inorganic nitrogen and net mineralization in a salt marsh ecosystem. Mangroves Salt Marshes 1999, 3, 127–134. [Google Scholar] [CrossRef]
  18. Uri, V.; Lõhmus, K.; Tullus, H. Annual net nitrogen mineralization in a grey alder (Alnus incana (L.) Moench) plantation on abandoned agricultural land. For. Ecol. Manag. 2003, 184, 167–176. [Google Scholar] [CrossRef]
  19. Hefting, M.; Clément, J.C.; Dowrick, D.; Cosandey, A.C.; Bernal, S.; Cimpian, C.; Tatur, A.; Burt, T.P.; Pinay, G. Water table elevation controls on soil nitrogen cycling in riparian wetlands along a European climatic gradient. Biogeochemistry 2004, 67, 113–134. [Google Scholar] [CrossRef]
  20. Western, A.W.; Grayson, R.B.; Bloschl, G. Scaling of soil moisture: A hydrologic perspective. Annu. Rev. Earth Pl. Sc. 2002, 30, 149–180. [Google Scholar] [CrossRef]
  21. Porporato, A.; D’Odorico, P.; Laio, F.; Rodriguez-Iturbe, I. Hydrologic controls on soil carbon and nitrogen cycles. I. Modeling scheme. Adv. Water Resour. 2003, 26, 45–58. [Google Scholar] [CrossRef]
  22. Robinson, D.A.; Campbell, C.S.; Hopmans, J.W.; Hornbuckle, B.K.; Jones, S.B.; Knight, R.; Ogden, F.; Selker, J.; Wendroth, O. Soil moisture measurement for ecological and hydrological watershed-scale observatories: A review. Vadose Zone J. 2008, 7, 358–389. [Google Scholar] [CrossRef]
  23. Updegraff, K.; Pastor, J.; Bridgham, S.D.; Johnston, C.A. Environmental and substrate controls over carbon and nitrogen mineralization in northern wetlands. Ecol. Appl. 1995, 5, 151–163. [Google Scholar] [CrossRef]
  24. Ehrenfeld, J.G.; Han, X.; Parsons, W.F.J.; Zhu, W. On the nature of environmental gradients: Temporal and spatial variability of soils and vegetation in the New Jersey pinelands. J. Ecol. 1997, 85, 785–798. [Google Scholar] [CrossRef]
  25. Yoon, T.K.; Noh, N.J.; Han, S.; Kwak, H.; Lee, W.-K.; Son, Y. Small-scale spatial variability of soil properties in a Korean swamp. Landsc. Ecol. Eng. 2015, 11, 723–734. [Google Scholar] [CrossRef]
  26. Khanna, P.K.; Raison, R.J. In situ core methods for estimating soil mineral-N fluxes: Re-evaluation based on 25 years of application and experience. Soil Biol. Biochem. 2013, 64, 203–210. [Google Scholar] [CrossRef]
  27. Friedel, J.K.; Herrmann, A.; Kleber, M. Ion exchange resin–soil mixtures as a tool in net nitrogen mineralisation studies. Soil Biol. Biochem. 2000, 32, 1529–1536. [Google Scholar] [CrossRef]
  28. Johnson, D.W.; Verburg, P.S.J.; Arnone, J.A. Soil extraction, ion exchange resin, and ion exchange membrane measures of soil mineral nitrogen during incubation of a tallgrass prairie soil. Soil Sci. Soc. Am. J. 2005, 69, 260–265. [Google Scholar] [CrossRef]
  29. Vitousek, P. Nutrient cycling and nutrient use efficiency. Am. Nat. 1982, 119, 553–572. [Google Scholar] [CrossRef]
  30. Gower, S.T.; Son, Y. Differences in soil and leaf litterfall nitrogen dynamics for five forest plantations. Soil Sci. Soc. Am. J. 1992, 56, 1959–1966. [Google Scholar] [CrossRef]
  31. Aerts, R. The advantages of being evergreen. Trends Ecol. Evol. 1995, 10, 402–407. [Google Scholar] [CrossRef]
  32. Reich, P.B.; Grigal, D.F.; Aber, J.D.; Gower, S.T. Nitrogen mineralization and productivity in 50 hardwood and conifer stands on diverse soils. Ecology 1997, 78, 335–347. [Google Scholar] [CrossRef]
  33. Mueller, K.E.; Hobbie, S.E.; Oleksyn, J.; Reich, P.B.; Eissenstat, D.M. Do evergreen and deciduous trees have different effects on net N mineralization in soil? Ecology 2012, 93, 1463–1472. [Google Scholar] [CrossRef] [PubMed]
  34. Binkley, D.; Giardina, C. Why do tree species affect soils? The warp and woof of tree-soil interactions. Biogeochemistry 1998, 42, 89–106. [Google Scholar] [CrossRef]
  35. Fujita, H.; Fujimura, Y. Distribution pattern and regeneration of swamp forest species with respect to site conditions. In Ecology of Riparian Forests in Japan; Sakio, H., Tamura, T., Eds.; Springer: Tokyo, Japan, 2008; pp. 225–236. [Google Scholar]
  36. Eom, H.J.; Chang, K.S.; Kim, H.; Chang, C.-S. Notes on a new overlooked taxon of Alnus (Betulaceae) in Korea. For. Sci. Technol. 2011, 7, 42–46. [Google Scholar]
  37. Whang, B.-C.; Lee, M.-W. Landscape ecology planning principles in korean Feng-Shui, Bi-Bo woodlands and ponds. Landsc. Ecol. Eng. 2006, 2, 147–162. [Google Scholar] [CrossRef]
  38. Yoon, T.K.; Noh, N.J.; Kim, R.-H.; Seo, K.W.; Lee, S.K.; Yi, K.; Lee, I.K.; Lim, J.-H.; Son, Y. Mass dynamics of coarse woody debris in an old-growth deciduous forest of Gwangneung, Korea. For. Sci. Technol. 2011, 7, 145–150. [Google Scholar] [CrossRef]
  39. Noh, N.J.; Son, Y.; Lee, S.K.; Yoon, T.K.; Seo, K.W.; Kim, C.; Lee, W.-K.; Bae, S.W.; Hwang, J. Influence of stand density on soil CO2 efflux for a Pinus densiflora forest in Korea. J. Plant Res. 2010, 123, 411–419. [Google Scholar] [CrossRef] [PubMed]
  40. Noh, N.J.; Son, Y.; Jo, W.; Yi, K.; Park, C.W.; Han, S. Preliminary study on estimating fine root growth in a natural Pinus densiflora forest using a minirhizotron technique. For. Sci. Technol. 2012, 8, 47–50. [Google Scholar]
  41. Noh, N.J.; Kim, C.; Bae, S.W.; Lee, W.K.; Yoon, T.K.; Muraoka, H.; Son, Y. Carbon and nitrogen dynamics in a Pinus densiflora forest with low and high stand densities. J. Plant Ecol. 2013, 6, 368–379. [Google Scholar] [CrossRef]
  42. Yoon, T.K.; Noh, N.J.; Han, S.; Lee, J.; Son, Y. Soil moisture effects on leaf litter decomposition and soil carbon dioxide efflux in wetland and upland forests. Soil Sci. Soc. Am. J. 2014, 78, 1804–1816. [Google Scholar] [CrossRef]
  43. Vicca, S.; Luyssaert, S.; Peñuelas, J.; Campioli, M.; Chapin, F.S.; Ciais, P.; Heinemeyer, A.; Högberg, P.; Kutsch, W.L.; Law, B.E.; et al. Fertile forests produce biomass more efficiently. Ecol. Lett. 2012, 15, 520–526. [Google Scholar] [CrossRef] [PubMed]
  44. Eno, C.F. Nitrate production in the field by incubating the soil in polyethylene bags. Soil Sci. Soc. Am. J. 1960, 24, 277–279. [Google Scholar] [CrossRef]
  45. Son, Y.; Lee, I.K. Soil nitrogen mineralization in adjacent stands of larch, pine and oak in central Korea. Ann. For. Sci. 1997, 54, 1–8. [Google Scholar] [CrossRef]
  46. Johansson, T. Biomass equations for determining fractions of common and grey alders growing on abandoned farmland and some practical implications. Biomass Bioenerg. 2000, 18, 147–159. [Google Scholar] [CrossRef]
  47. R Development Core Team. R: A Language and Environment for Statistical Computing; R Foundation for Statistical Computing: Vienna, Austria, 2011; Available online: http://www.r-project.org (accessed on 15 June 2015).
  48. Craine, J.M.; Morrow, C.; Fierer, N. Microbial nitrogen limitation increases decomposition. Ecology 2007, 88, 2105–2113. [Google Scholar] [CrossRef] [PubMed]
  49. Shi, W. Agricultural and ecological significance of soil enzymes: Soil carbon sequestration and nutrient cycling. In Soil Enzymology; Shukla, G., Varma, A., Eds.; Springer: Berlin-Heidelberg, Germany, 2011; Volume 22, pp. 43–60. [Google Scholar]
  50. Regina, K.; Nykänen, H.; Maljanen, M.; Silvola, J.; Martikainen, P.J. Emissions of N2O and NO and net nitrogen mineralization in a boreal forested peatland treated with different nitrogen compounds. Can. J. For. Res. 1998, 28, 132–140. [Google Scholar] [CrossRef]
  51. Höfferle, Š.; Nicol, G.W.; Pal, L.; Hacin, J.; Prosser, J.I.; Mandić-Mulec, I. Ammonium supply rate influences archaeal and bacterial ammonia oxidizers in a wetland soil vertical profile. FEMS Microbiol. Ecol. 2010, 74, 302–315. [Google Scholar]
  52. Carpenter-Boggs, L.; Pikul, J.L.; Vigil, M.F.; Riedell, W.E. Soil nitrogen mineralization influenced by crop rotation and nitrogen fertilization. Soil Sci. Soc. Am. J. 2000, 64, 2038–2045. [Google Scholar] [CrossRef]
  53. Fisk, M.; Fahey, T. Microbial biomass and nitrogen cycling responses to fertilization and litter removal in young northern hardwood forests. Biogeochemistry 2001, 53, 201–223. [Google Scholar] [CrossRef]
  54. Bowden, R.D.; Davidson, E.; Savage, K.; Arabia, C.; Steudler, P. Chronic nitrogen additions reduce total soil respiration and microbial respiration in temperate forest soils at the Harvard forest. For. Ecol. Manag. 2004, 196, 43–56. [Google Scholar] [CrossRef]
  55. Treseder, K.K. Nitrogen additions and microbial biomass: A meta-analysis of ecosystem studies. Ecol. Lett. 2008, 11, 1111–1120. [Google Scholar] [CrossRef] [PubMed]
  56. Matson, P.; Lohse, K.A.; Hall, S.J. The globalization of nitrogen deposition: Consequences for terrestrial ecosystems. AMBIO 2002, 31, 113–119. [Google Scholar] [CrossRef] [PubMed]
  57. Shin, A.Y.; Sung, M.Y.; Choi, J.S.; On, J.S.; Roh, S.A.; Ahn, J.Y.; Han, J.S.; Lee, G.W. A study on the acid deposition of inorganic ions and flux in Seoul, Gangwha, Icheon, 2008. J. Korean Soc. Urban Environ. 2012, 12, 14–22. (In Korean) [Google Scholar]
  58. Jacks, G.; Joelsson, A.; Fleischer, S. Nitrogen retention in forest wetlands. AMBIO 1994, 23, 358–362. [Google Scholar]
  59. Son, Y. Non-symbiotic nitrogen fixation in forest ecosystems. Ecol. Res. 2001, 16, 183–196. [Google Scholar] [CrossRef]
  60. Vitousek, P.; Cassman, K.; Cleveland, C.; Crews, T.; Field, C.; Grimm, N.; Howarth, R.; Marino, R.; Martinelli, L.; Rastetter, E.; et al. Towards an ecological understanding of biological nitrogen fixation. Biogeochemistry 2002, 57–58, 1–45. [Google Scholar] [CrossRef]
  61. Han, J.S.; Hong, Y.D.; Ahn, J.Y.; Chung, I.R.; Shin, A.Y.; Lim, B.K.; Noh, S.A.; Son, J.S.; Park, J.H. Acid Deposition Monitoring and Impact Assessment (V): Centered on Forest Ecosystem; National Institute of Environmental Research: Incheon, Korea, 2008. [Google Scholar]
  62. Lee, Y.; Son, Y. Diurnal and seasonal patterns of nitrogen fixation in an Alnus hirsuta plantation of central Korea. J. Plant Biol. 2005, 48, 332–337. [Google Scholar] [CrossRef]
  63. Kim, D.K. Comparisons of Physico-Chemical Properties of Soil between the Alnus japonica Wetlands and Adjacent Slope. Master’s Thesis, Kongju National University, Gongju, Korea, Febuary 2014. [Google Scholar]
  64. Bedard-Haughn, A.; Matson, A.L.; Pennock, D.J. Land use effects on gross nitrogen mineralization, nitrification, and N2O emissions in ephemeral wetlands. Soil Biol. Biochem. 2006, 38, 3398–3406. [Google Scholar] [CrossRef]
  65. Durán, J.; Delgado-Baquerizo, M.; Rodríguez, A.; Covelo, F.; Gallardo, A. Ionic exchange membranes (IEMs): A good indicator of soil inorganic N production. Soil Biol. Biochem. 2013, 57, 964–968. [Google Scholar] [CrossRef]
  66. Qian, P.; Schoenau, J.J. Practical applications of ion exchange resins in agricultural and environmental soil research. Canad. J. Soil Sci. 2002, 82, 9–21. [Google Scholar] [CrossRef]
  67. Van Raij, B. Bioavailable tests: Alternatives to standard soil extractions. Commun. Soil Sci. Plant Anal. 1998, 29, 1553–1570. [Google Scholar] [CrossRef]
  68. Meason, D.F.; Idol, T.W. Nutrient sorption dynamics of resin membranes and resin bags in a tropical forest. Soil. Sci. Soc. Am. J. 2008, 72, 1806–1814. [Google Scholar] [CrossRef]
  69. Nadelhoffer, K.J.; Aber, J.D.; Melillo, J.M. Leaf-litter production and soil organic matter dynamics along a nitrogen-availability gradient in southern Wisconsin (U.S.A.). Can. J. For. Res. 1983, 13, 12–21. [Google Scholar] [CrossRef]
  70. Binkley, D.; Valentine, D. Fifty-year biogeochemical effects of green ash, white pine, and Nrway spruce in a replicated experiment. For. Ecol. Manag. 1991, 40, 13–25. [Google Scholar] [CrossRef]
  71. Kim, C.; Son, Y.; Lee, W.-K.; Jeong, J.; Noh, N.-J.; Kim, S.-R.; Yang, A.R.; Ju, N.-G. Influence of forest tending (Soopkakkugi) works on litterfall and nutrient inputs in a Pinus densiflora stand. For. Sci. Technol. 2012, 8, 83–88. [Google Scholar]
  72. Kang, J.-S.; Shibuya, M.; Shin, C.-S. The effect of forest-thinning works on tree growth and forest environment. For. Sci. Technol. 2014, 10, 33–39. [Google Scholar] [CrossRef]
  73. Franklin, J.F.; Spies, T.A.; van Pelt, R.; Carey, A.B.; Thornburgh, D.A.; Berg, D.R.; Lindenmayer, D.B.; Harmon, M.E.; Keeton, W.S.; Shaw, D.C.; et al. Disturbances and structural development of natural forest ecosystsems with silvicultural implications, using Douglas-fir forests as an example. For. Ecol. Manag. 2002, 1–3, 399–423. [Google Scholar] [CrossRef]
  74. Zak, D.R.; Groffman, P.M.; Pregitzer, K.S.; Christensen, S.; Tiedje, J.M. The vernal dam: Plant-microbe competition for nitrogen in northern hardwood forests. Ecology 1990, 71, 651–656. [Google Scholar] [CrossRef]
  75. Aulakh, M.S.; Singh, K.; Singh, B.; Doran, J.W. Kinetics of nitrification under upland and flooded soils of varying texture. Commun. Soil Sci. Plant Anal. 1996, 27, 2079–2089. [Google Scholar] [CrossRef]
  76. Yoo, J. Hydrological Properties and Nutrient Budgets in a Coniferous Forest Catchment in Gwangneung, Gyeonggi Province, Korea. Ph.D. Thesis, Korea University, Seoul, Korea, Febuary 2010. [Google Scholar]
  77. Fisher, J.; Acreman, M.C. Wetland nutrient removal: A review of the evidence. Hydrol. Earth Syst. Sci. 2004, 8, 673–685. [Google Scholar] [CrossRef]

