Article

Environmental Factors Effect on Stem Radial Variations of Picea crassifolia in Qilian Mountains, Northwestern China

1
State Key Laboratory of Grassland and Agro-Ecosystems, School of Life Sciences, Lanzhou University, Lanzhou 730000, China
2
State Key Laboratory of Grassland and Agro-Ecosystems, College of Pastoral Agriculture Science and Technology, Lanzhou University, Lanzhou 730000, China
*
Author to whom correspondence should be addressed.
Forests 2016, 7(10), 210; https://doi.org/10.3390/f7100210
Submission received: 24 July 2016 / Revised: 6 September 2016 / Accepted: 12 September 2016 / Published: 23 September 2016

Abstract

:
Picea crassifolia Komarov (Qinghai spruce) is an endemic tree species in China and is widespread in the Qilian Mountains, in northwestern China. High temporal resolution changes of Qinghai spruce tree stem growth remain poorly investigated and the relationships between the species growth and climate are still not completely understood. In this study, we assessed the daily and seasonal stem radial variations, and analyzed the relationships between stem radial increment of Qinghai spruce and environmental factors during the main growing period (June–August). We have found that the stem radial variations of Qinghai spruce can be divided into three phases according to the air temperature and that Qinghai spruce has two diurnal cycle patterns. The main growing period of Qinghai spruce is 30 May–31 August according to micro-core measurements, in conformity with the daily mean air temperature keeping above 5 °C. Precipitation and relative humidity have positive effects on the growth of Qinghai spruce, and we develop a multiple linear regression model that can explain 63% of the stem radial increment over the main growing period.

1. Introduction

Qinghai spruce is an endemic tree species in China and is widespread on the northeastern Tibetan Plateau, its distribution center is in the Qilian Mountains, in northwestern China. Forests dominated by the species in the Qilian Mountains play an important role in ecosystem services, such as water regulation, soil protection, climate regulation, carbon sequestration, etc. [1]. Special attention has been given to the impact of forests on water supply among the numerous services, due to the water severe shortage in this region [2]. Interest in water conservation of the Qinghai spruce forests in recent years has led to numerous and diverse studies focused on ecological and hydrological processes of the forests. Hydrological processes, like canopy interception of precipitation and evapotranspiration, have received much attention because of the prominent role in the discussion about the water yields of the forests [2,3,4]. Ecological processes like plant photosynthesis, soil respiration in the forest stands, biomass accumulation, etc. have been focused upon in order to assess carbon exchange fluxes between different carbon pools at the regional scale, which is helpful for accurately predicting future climate change [5,6,7,8,9,10]. Ecological processes and hydrological processes interact to generate ecosystem functions which underlie ecosystem services [11]. Furthermore, growing processes represent a core component in considering ecosystem interactions because they are a key linkage between ecological and hydrological processes.
At present, the studies on the growing process of Qinghai spruce still adopt some old methods. The first is the anatomical analysis of trees by cutting down sample trees in order to understand tree ring structures and morphological characteristics; and the other is tree-ring width chronologies method; dendroecological techniques are used in order to examine the relationships between environmental factors and the radial growth of trees [12,13,14,15,16]. These methods have many disadvantages, for example, the former is time-consuming, laborious, and destructive [17], more importantly, both methods lack high temporal resolution measurements. Therefore, it is difficult to understand physiological mechanisms of tree growth by these methods, due to on the failure of the methods in detecting the trees’ reaction to high temporal resolution changes of environmental factors. Now, high temporal resolution data of environmental factors can be easily achieved by automatic meteorological stations and automatic soil monitoring systems, but high temporal resolution data for tree stem growth are urgently needed. Fortunately, dendrometer techniques have been developed that help meet the demand.
An electronic dendrometer is a highly precise sensor for measurements of stem radial variation. It can provide long-term and continuous measurements of stem radial variation with high temporal resolution (e.g., minutes to hours) without aggressive sampling [18,19]. Because of its advantages, in the past decade it has been widely used with different tree species to describe the relationship between stem radial variations and environmental factors [20,21,22,23,24]. Various insights into tree growth can be obtained by using high-resolution dendrometers, including the understanding of short-term growth responses to changing environmental conditions [18]. Although the advantages of dendrometers are very notable, it is difficult to determine the initiation and cessation of wood formation by the method [25] because the measurements obtained from dendrometers are composed of reversible diurnal rhythms of water depletion and replenishment (i.e., the overall shrinking and expanding of xylem, phloem, and periderm) [26,27,28], and irreversible seasonal tree growth (i.e., the new cell formation and development) [20,29,30,31,32]. Here, we name stem radial increment by the reversible diurnal change as the false growth, and stem radial increment by the irreversible diurnal change as the true growth. To date, it is unclear how to distinguish the false and true growth of a tree’s stem radius [33,34]. Alternatively, the true wood growth can be monitored by directly extracting a wood sample at a finer time scale using the micro-coring technique [35,36,37]. Although the method is considered to be the most reliable for monitoring wood formation, it is complicated to manipulate all the processes involved, including sampling, preprocessing, and analyzing [35], which restricts its applicability. Combining high resolution dendrometer measurements and micro-coring techniques in order to find a representative indicator to distinguish the wood formation period is a challenging issue [35,37,38].
Many studies about the annual scale environment-growth relationships of Qinghai spruce have been conducted in the Qilian Mountains [12,13,14,15,16,39,40,41]. However, high temporal resolution changes of Qinghai spruce tree stem growth remain poorly investigated and the relationships between the species growth and environmental factors are still not completely understood. Given the above, measurements with high temporal resolution were conducted by four point dendrometers in 2014. The dendrometer measurements in combination with weather data were used to analyze the intra-annual response of the stem radial variations of Qinghai spruce to environmental factors in the Qilian Mountains. Our objectives were to: (1) assess the daily and seasonal stem radial variation; (2) define the main growing period; and (3) determine the relationship between stem radial increments and environmental factors in the main growing period (i.e., air temperature, relative humidity, precipitation, solar radiation, photosynthetically active radiation, soil temperature, and soil water content). This study helps provide a better understanding of the environmental factors driving Qinghai spruce tree growth patterns and also helps to understand the predictability of Qinghai spruce growth under global climate change.

2. Materials and Methods
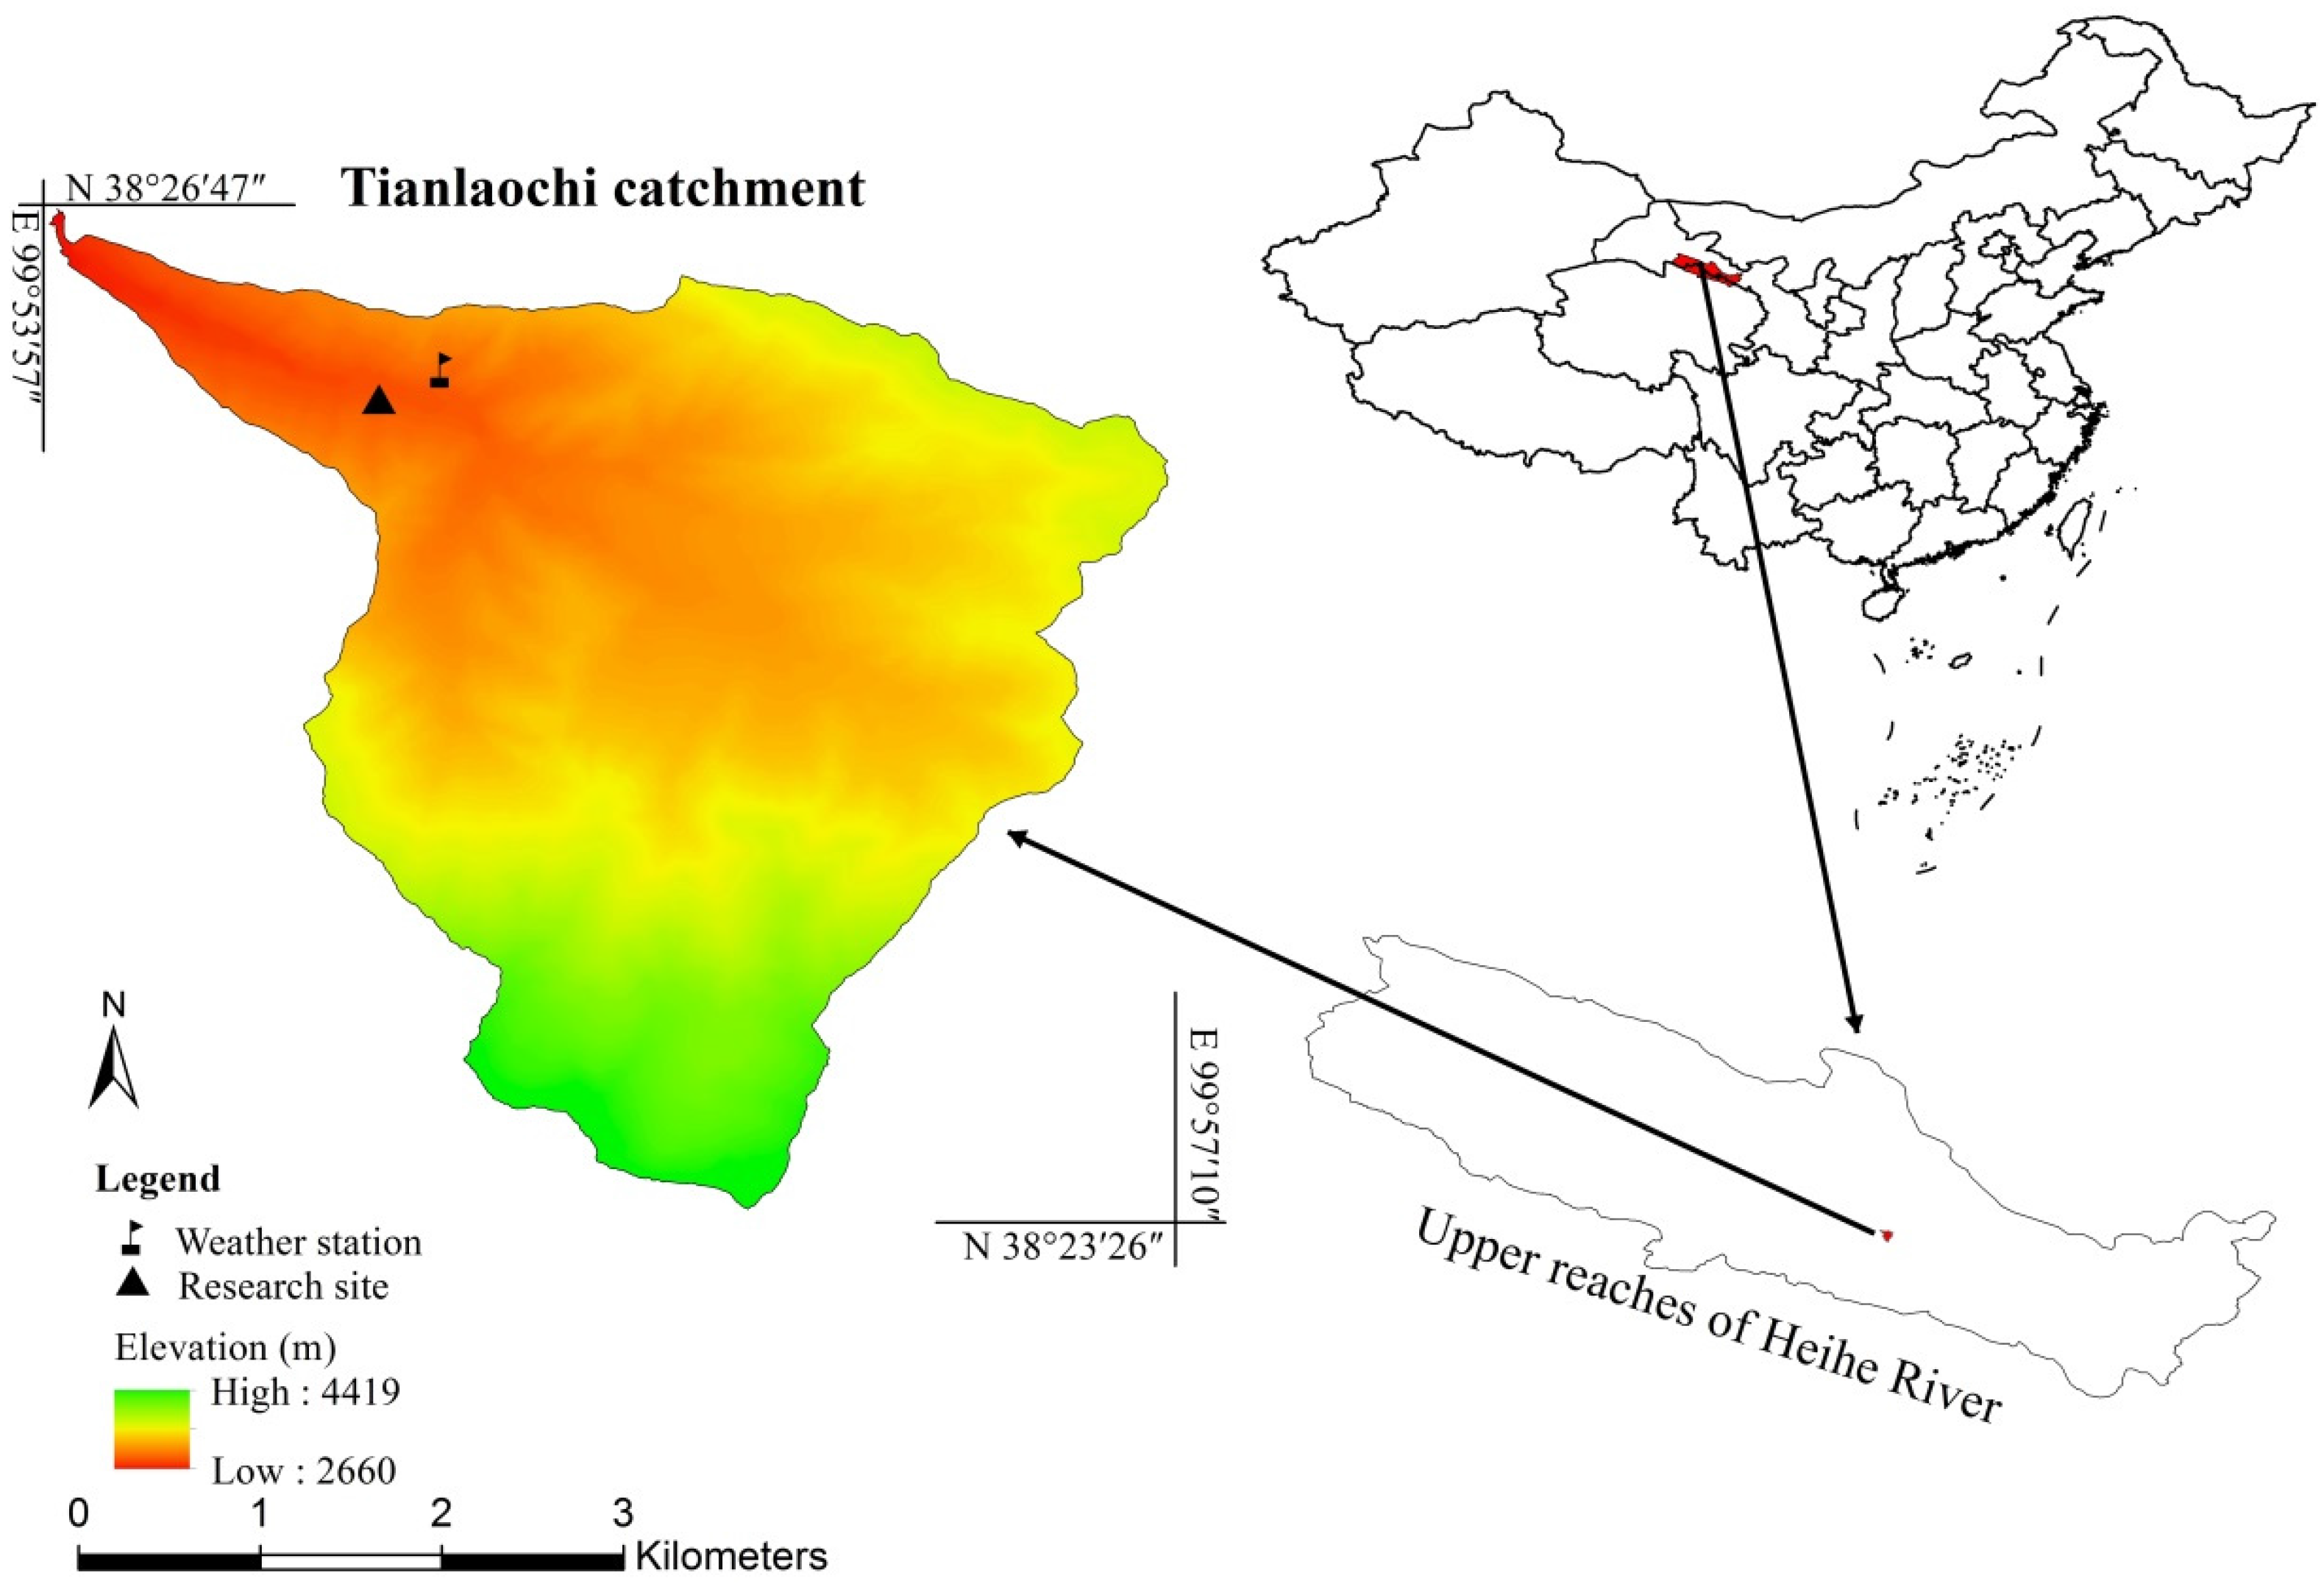
2.1. Study Area

Our study was conducted in the Tianlaochi catchment (38°23′56″–38°26′47″ N; 99°53′57″–99°57′10″ E) with the elevation ranging from 2660 to 4419 m above sea level (a.s.l.) (Figure 1), located in the middle part of the Qilian Mountains, in the upper reaches of the Heihe River. The study area is characterized by a mountainous primeval forest ecosystem with little anthropogenic influence. Qinghai spruce is the dominant species and mainly distributes on the north-facing slopes; it is tolerant to poor soil and cold and dry conditions. It can grow up to 35 m, and its longevity is reported to be 250 years. It usually forms pure forest stands and has a more suitable niche space from 2650 to 3100 m a.s.l. [10]. The ground vegetation in the forest stand consists of moss dominated by Abietinella abietina (Hedw.) Fleisch. and a few low herbs, such as Plantago asiatica Linnaeus, Potentilla anserine Linnaeus, etc. Soil under the forest is mainly mountain grey cinnamon soil with 30–50 cm of depth.
The climate in the study area is a typical alpine semi-arid climate, characterized by long and cold winters, and short and warm summers. The annual average temperature is 0.6 °C with mean January and July temperature being −13.1 °C and 12.1 °C, respectively. Mean annual evaporation is 1066.2 mm, mean annual relative humidity is 59%, and the average annual precipitation is 437.2 mm with 84.2% of the precipitation falling from May to September.

2.2. Data Collection

2.2.1. Dendrometer Records

Automatic point dendrometers (Ecomatik, Munich, Germany; type DR, accuracy ±2 μm, temperature coefficient <0.1 μm/K.) were installed on four Qinghai spruce trees in the study area in August 2013 (Figure 2). The instrument incorporates a linear voltage difference transducer, which is used to alternate current within a solenoid to discern movement with ~2 μm precision, and transfers stem diameter changes into an electrical signal with a resolution of 4.4 μm per millivolt over a range of 11,000 μm. As explained by Biondi and Hartsough [42], the point dendrometer has a sensing rod about 10 cm long, which has thermal expansion and contraction phenomena being about 1.7 μm for 1 °C of temperature change. The trunk of a living tree also has thermal contraction and expansion being −3 to −4 μm·m−1·°C−1 [43]. Such thermal-driven errors (i.e., thermal contraction and expansion of a sensing rod and living trunk) are small compared to water-driven stem radial changes.
Four healthy trees (PG 1, PG 2, PG 3, and PG 4) were selected (Figure 2). Their biological characteristics are shown in Table 1. Each dendrometer was installed at breast height and the south-facing side of each tree. In order to guarantee a close contact between the plate of dendrometer and the trunk, the loose bark was carefully removed without wounding the cambial zone before installing the dendrometer. The dendrometers were connected to a data logger (Ecomatik, Munich, Germany; type DL 15), which was set to record data at 0.5 h intervals.

2.2.2. Environmental Data Collection

A 2-m high automatic weather station (HOBO U30-NRC, Onset, Pocasset, Bourne, MA, USA) was installed at an exposed and flat space near the four sample trees (Figure 1). Environmental parameters (i.e., soil water content and soil temperature at 20 cm and 40 cm depth, air temperature, relative humidity, photosynthetically active radiation, solar radiation, and precipitation) were automatically measured at 30 min intervals, and stored in a data logger (Delta-T Devices Ltd., Cambridge, UK, Type DL2e); the hourly values were obtained by averaging half hour data. These environmental parameters measurements were synchronous to that of the dendrometers. The vapor pressure deficit (VPD, kPa) was calculated from air temperature (T) and relative humidity (RH) using the Magnus equation [44]:
VPD   =   6.10   ×   e 17.08   ×   T 234.2   +   T   ×   ( 1     RH 100 )

2.2.3. Micro-Core Sampling

We selected four other healthy Qinghai spruce trees (M 1, M 2, M 3, and M 4) near the sample trees for micro-core sampling. Their biological characteristics were also shown in Table 1. Micro-core samples were taken at breast height using a Trephor corer (Costruzioni Meccaniche Carabin Co., Belluno, Italy) from late April to early October with one week intervals. In order to minimize the harmful effect of sampling on trees, we adopted the method of spiral sampling and plugged the cores with toothpicks after sampling. All samples included the periderm, phloem, cambial zone, xylem, and the preceding three to four rings. After sampling, the micro-cores were placed in micro tubes filled with absolute alcohol immediately. After being taken back to the laboratory, each sample was oriented by marking the transversal side with a pencil under a stereo-microscope, and embedded in paraffin (Leica, Wetzlar, Germany, EG1150 H), then immersed in water. After 24 h, the processed samples were cut into cross sections of about 8–12 μm thickness by rotary microtome (Leica, Wetzlar, Germany, RM 2245). The sections were placed on microscopic slides, and stained with Safranin (0.5% in 95% alcohol) and Astra blue (0.5% in 95% alcohol), dehydrated in an ascending series of ethanol, and mounted into neutral balsam. Images were taken with a digital microscope system (Sunny Optical, EX30, Zhejiang, China).
We observed the slides to distinguish the cambial zone and xylem differentiation phases (i.e., enlargement, secondary wall thickening, and lignification). In spring, when at least one cell row can be observed in the enlargement phase in the post-cambial zone, the growing season is considered to have begun, and in the late summer, when cambial cells division have terminated and no cell can be observed in the xylem differentiation phases, the growing season is considered to have finished.

2.3. Data Analysis

In general, variation in stem radius displays a conspicuous diurnal pattern, containing three distinct phases: (1) contraction phase (CP), i.e., the period from the first maximum radius recorded to the subsequent minimum radius; (2) expansion phase (EP), i.e., the period from the minimum radius during a day to the subsequent maximum radius; and (3) stem radial increment (SRI) phase, i.e., part of the expansion phase (the difference between the prior maximum radius to the posterior maximum radius) [20,21,29,33,45]. The daily SRI is determined by calculating the difference between maximum values of two consecutive days [29]. Some days do not experience any SRI phase, if the second maximum value is less than the first maximum. In this case, daily SRI is considered equal to zero [20]; no data are transformed (or standardized) when calculating.
In order to compare radial increments among four trees, the first value recorded in the first day of 2014 was arbitrarily set to zero for all trees [30]. The ratio (R) of hourly radial increment value to the maximum in the year was calculated to minimize the effect of age, vigor, and competition among trees [30,46]. Then, the cumulative daily radial increment curves were plotted using the ratio (R). We also calculated the radial index to evaluate daily changes of mean cumulative radial increment and eliminate the intrinsic trend in the cumulative curve. The radial index (RI) means the difference between the daily average ratios (R) for two consecutive days [30]. In our study, the hourly data of stem radial increments were obtained by averaging raw data recorded at half hour intervals. The daily amplitude of stem radius was achieved by calculating differences between the daily maximum and minimum values. In addition, according to the observations of the micro-cores, we found the main growing period. Next, we used the radial index (RI) and daily amplitude to identify the main growing period, and extracted the SRI during the main growing period (June–August). Afterwards, we determined the relation between SRI and single environmental factors, based on the Pearson’s correlation analysis.
We used the method of backward multiple linear regression analysis to develop the SRI model in the main growing period in order to quantify the relationship between the stem radial variation and the environmental factors. Precipitation data were log transformed to ensure normality prior to analysis. Simultaneously, considering the lag effect of environmental factors, we also brought data from the previous one or two days concerning the environmental factors into the SRI model. The model was used to simulate SRI, and then was evaluated by linear regressive analysis.
All data were processed using Excel 2010. Pearson’s correlation analysis and multiple linear regression analysis were performed by SPSS 19.0 software (SPSS Inc., Chicago, IL, USA). The figures were drawn by Matlab 2008a.

3. Results

3.1. Variations of Environment Factors

The range of daily mean (Tmean), maximum (Tmax), and minimum (Tmin) air temperature during the study period was −18.5 to 16.9 °C, −10.4 to 28.9 °C, and −23.6 to 9.4 °C, respectively (Figure 3). The changing range of daily mean soil temperature at 20 cm (ST20) and 40 cm (ST40) depth was smaller than that of air temperature, and the range of ST20 and ST40 was −3.1 to 16.5 °C and −1.0 to 15.7 °C, respectively. A high correlation coefficient (r = 0.994, N = 8760, p < 0.01) was found between hourly mean ST20 and ST40. The correlation coefficients between hourly mean air temperature and mean soil temperature at 20 cm and 40 cm depth were 0.795, p < 0.01 and 0.783, p < 0.01, respectively. The precipitation (P) during the study period was 571.8 mm, higher than the average annual precipitation (437.2 mm), with the highest and lowest amounts of monthly precipitation recorded in June (136.4 mm) and January (0.6 mm), respectively. The precipitation was mainly in the form of light rain; daily precipitation of more than 10 mm happened only on 13 days, and the highest amount of daily precipitation was recorded on 2 August (22.2 mm). The soil water content (SWC) showed a strong variation with large fluctuations. In early spring, the SWC increased significantly with the rising temperature. In summer and autumn, the SWC showed fluctuation related to the occurrence of precipitation. In winter, the SWC decreased sharply with the temperature falling. The vapor pressure deficit (VPD) presented large fluctuations and its highest value occurred in May, while the relative humidity (RH) showed a significant negative correlation with VPD (r = −0.622, N = 8760, p < 0.01).

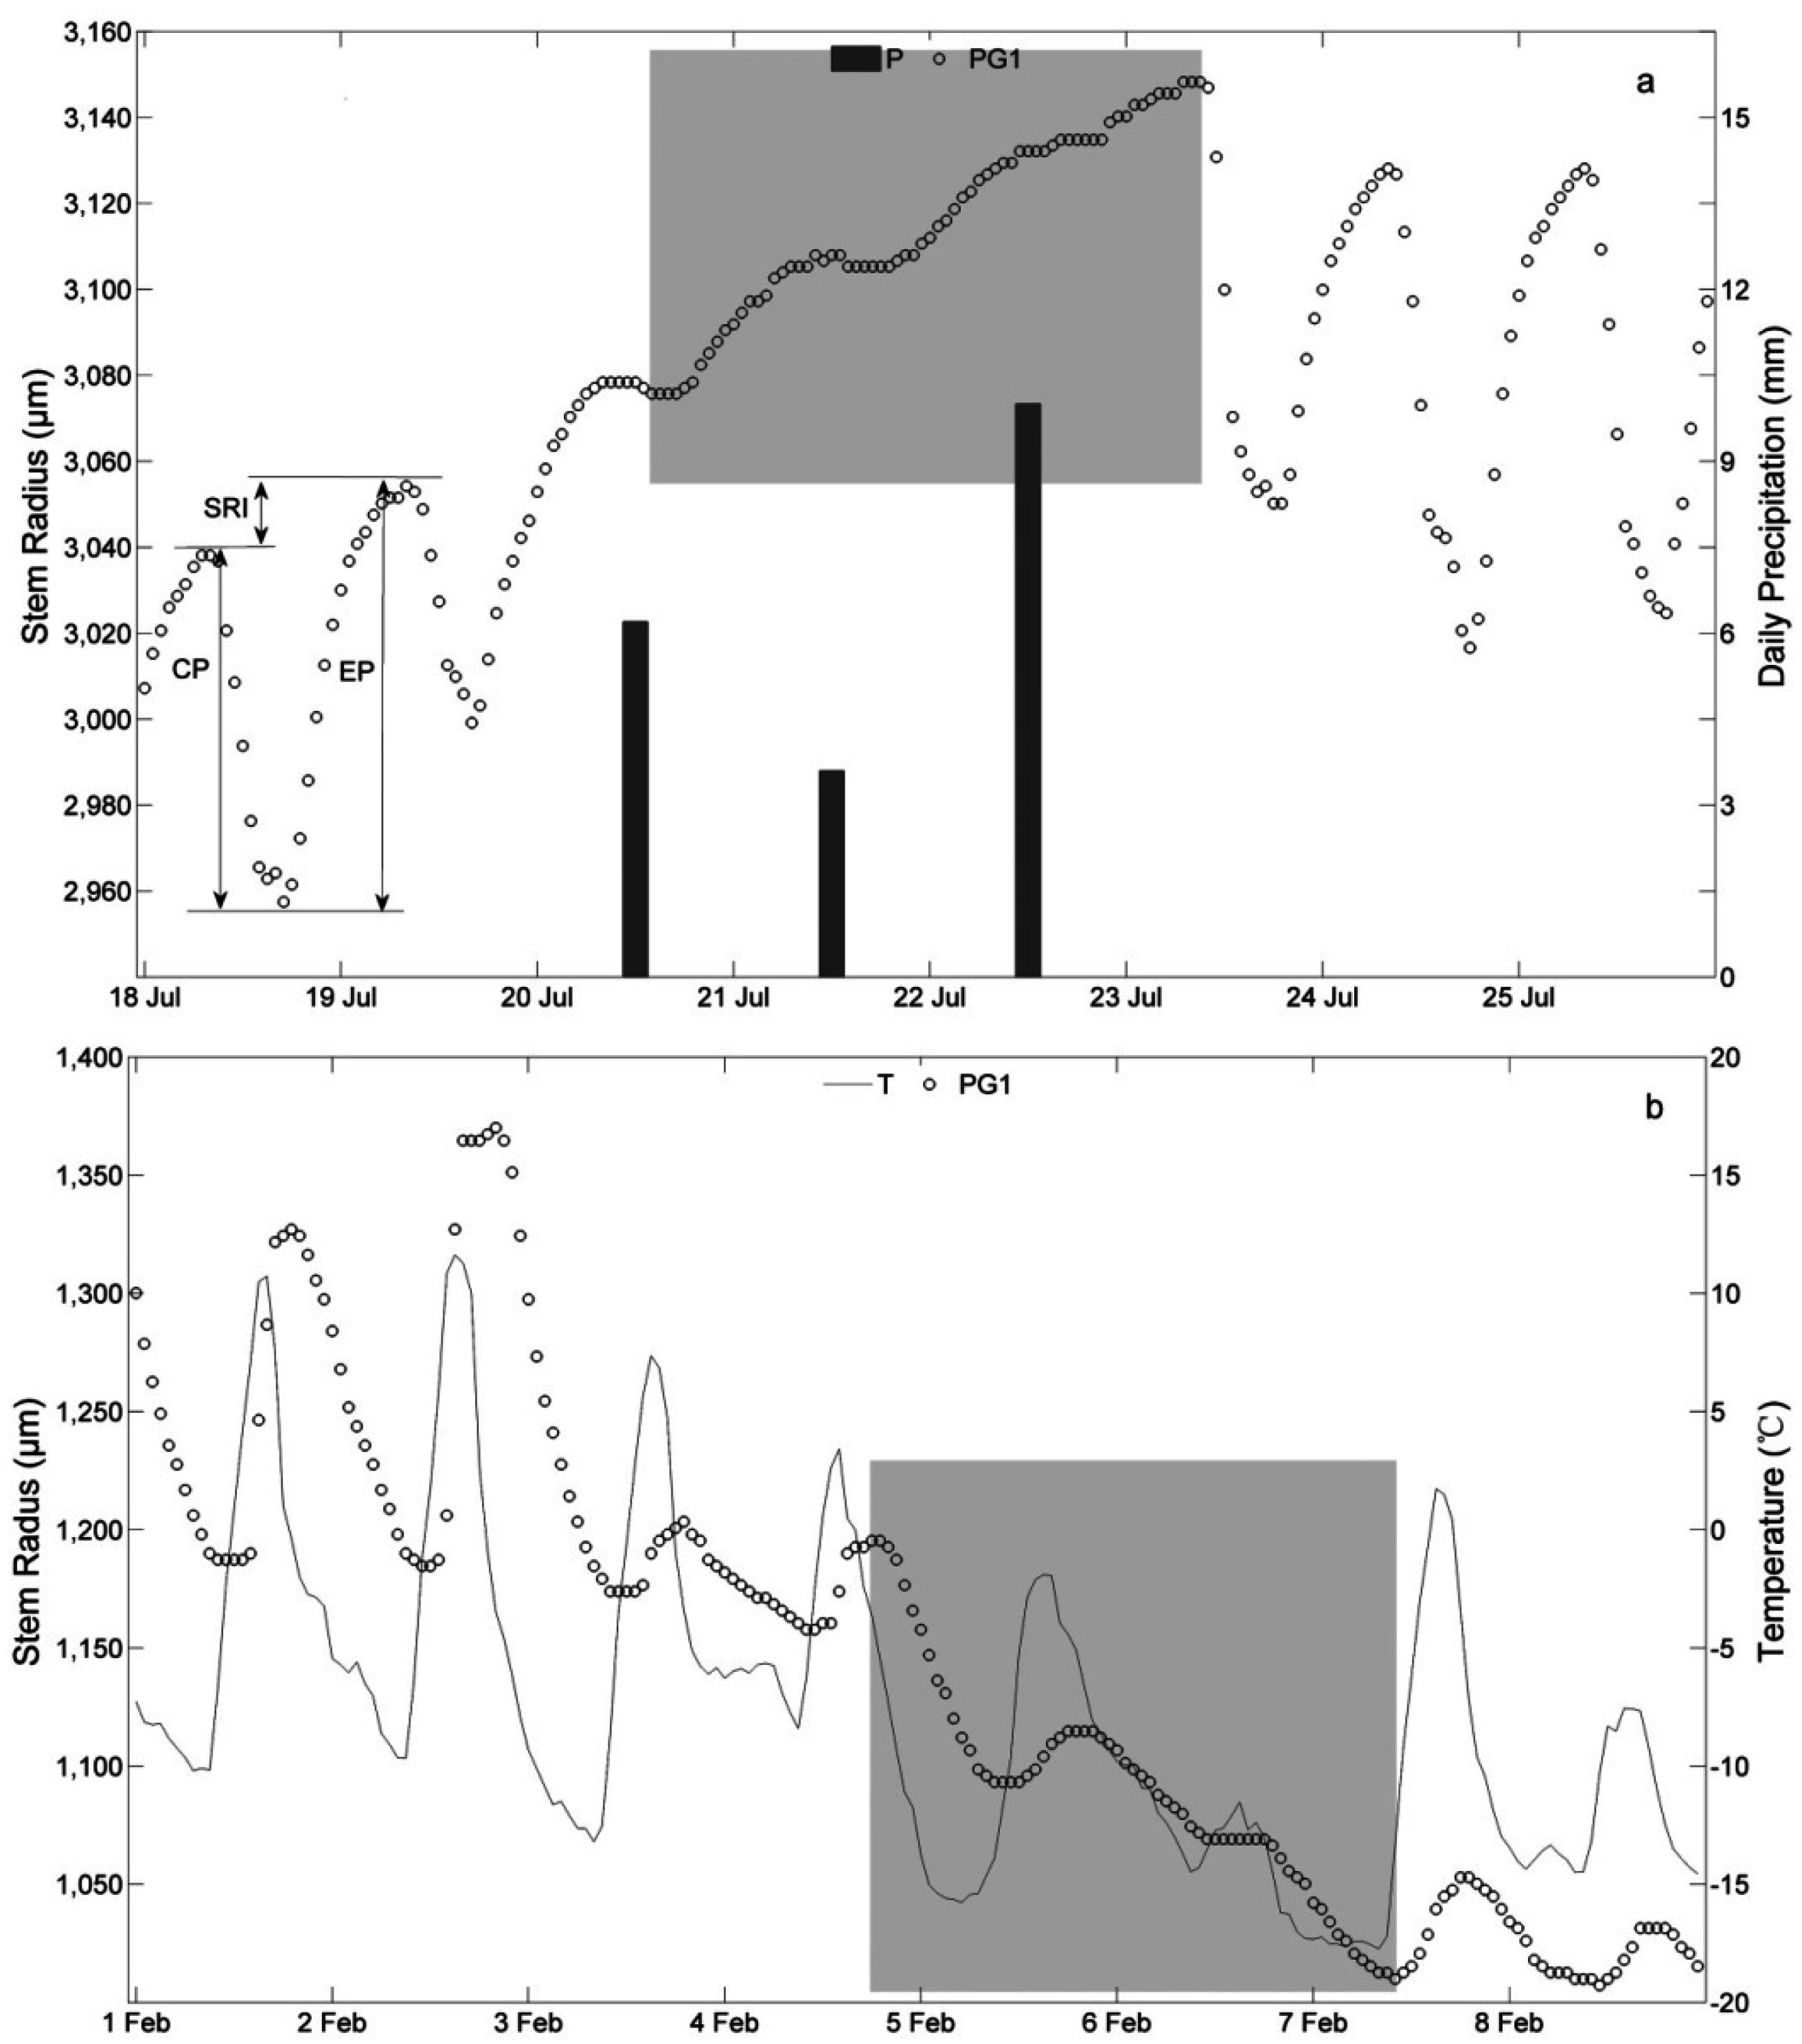
3.2. Stem Radial Variations

During the study period, the stem radial variation curves of the four sample trees displayed a synchronous response (Figure 4). A high mean correlation coefficient (r = 0.977, N = 8760, p < 0.01) was found between hourly mean values of PG 1, PG 2, PG 3, and PG 4. The annual variation was characterized by a sharp decrease and increase of stem radius in spring (day of year (DOY) 29–107), a stable phase in late spring and early summer (DOY 108–152), a progressive increase in summer (DOY 151–223), a plateau phase in autumn (DOY 224–302), and a decrease in winter (DOY 303–365, DOY 1–28). The magnitude of the ratio (R) of daily radius increment value to the maximum in the main growing period among the four sample trees displayed little differences, but there were obvious differences within specific points of time.
In viewing the daily scale, the stem radial variations show a remarkably diurnal cycle (Figure 5). In the growing period, the stem radius first increased before decreasing and then increasing again—we name the pattern as ‘up-down-up—and three conspicuous phases (CP, EP, and SRI) can be easily observed (Figure 5a). However, the daily cycle pattern disappears and the uninterrupted increase of stem radius happens at some times, for example, 20 July–23 July; the uninterrupted increase contains false growth, which corresponds to continuous precipitation (the rainfall of the four days is 6.2, 3.6, 10, and 0 mm, respectively). In the non-growing period, a distinct diurnal cycle also can be observed (Figure 5b), but the change tendency of stem radius is opposite to that of the growing period (i.e., decreasing first before increasing and then decreasing again—we name the pattern as ‘down-up-down’). However, the daily cycle pattern disappears and the uninterrupted decrease of stem radius occurs at some points in time, for example, 6 February–7 February. The uninterrupted decrease corresponds to continuous decrease of air temperature.
To depict patterns of diurnal cycles, monthly mean hourly data of stem radial increments were obtained by averaging the hourly data during one month. Monthly mean diurnal cycles of stem radii in each month are shown in Figure 6. From the form of the cycle pattern observed, we can distinguish between three types (i.e., type one: including January, February, and December; type two: April–September; and type three: including October, November, and March). Type one has a typical pattern of a non-growing period, the daily maxima of stem radii appear in the afternoon, while the daily minima are in the morning. Type two has a representative pattern of the growing period, the daily maxima appear in the morning followed by the minima in the afternoon. However, Type three has no formal pattern without any stable time when maxima and minima appear.

3.3. Determination of the Main Growing Period

According to measurements of micro-cores from Qinghai spruce, we determined the starting time of the growing period was about 30 May, and the ending time was between 24 and 31 August in 2014 The main growing period lasted about 94 days. In fact, cambial cell divisions terminated on 10 August, but the thickening of xylem cells can be observed until 30 August. From Figure 7, we can observe that the cambial zone was still dormant on 17 May (DOY 137), in the non-growing period, cambial cells were dividing and enlarging on 15 June (DOY 166), in the growing period, and the cambial zone was dormant again, but lignifying cells wall were thickening on 10 August (DOY 222), in the end of the growing period.
Overall, the variations of RI and daily amplitude of stem radial increments for the four sample trees show the strong similarities and big fluctuations with time (Figure 8 and Figure 9). We can divide the whole year into three phases depending on the magnitude of variation (Table 2). That is, the strong variation phase, the weak variation phase, and the moderate variation phase. The three phases correspond to air temperature characteristics (Figure 3). During the strong variation phase, the absolute values of RI and amplitude were very high, indicating that the stem radii had strong intra-day and inter-day variations; at the time, the mean daily air temperature was above 0 °C, and the maximum air temperature was above 5 °C and the minimum air temperature was below 0 °C. During the weak variation phase, the absolute values of RI and amplitude were very low, indicating that the stem radii had little intra-day and inter-day variations; at the time, mean daily air temperature was below 0 °C, and the maximum air temperature was below 5 °C. During the moderate variation phase, the absolute values of RI and amplitude were between the values observed in the strong variation phase and weak variation phase, indicating that the stem radii had moderate intra-day and inter-day variations: during this period, the mean air temperature was above 5 °C and the minimum air temperature was above 0 °C. However, during the weak variation phase some days presented high values of amplitude and absolute values of RI, and during the strong variation phase some days showed low values of amplitude and absolute values of RI. According to measurements of micro-cores from Qinghai spruce, the moderate variation phase is the main growing period, which is 18 days longer than the results observed from our micro-core measurements.

3.4. SRI and Its Relation to Environmental Factors

As mentioned above, the main growing period was from late May to late August. June and July were the most productive months (see Figure 4). We extracted the SRI of Qinghai spruce during the main growing period, and analyzed if for its relation to environmental factors (Figure 10). Figure 10 shows that SRI exhibits significant positive correlation with P (r = 0.459, p < 0.01) and RH (r = 0.459, p < 0.01), significantly negative correlation with Tmax (r = −0.485, p < 0.01), daily mean photosynthetically active radiation (PAR) (r = −0.484, p < 0.01), daily mean solar radiation (SR) (r = −0.475, p < 0.01), VPD (r = −0.433, p < 0.01), and Tmean (r = −0.348, p < 0.01), and non-significant correlation with ST and SWC20, ST40, and Tmin. However, the SWC40 had a significantly negative effect on SRI.

3.5. Model Development

Tmax, RH, PAR, and SWC40 were included in the model, which explained above 63% of the SRI (negative values are retained) over the main growing period (June to August). All factors were significantly correlated with SRI. The model is expressed as follows:
SRI = 31.930 − 1.391Tmax + 1.496RH + 0.052PAR − 1.441RH(t − 2) − 1.213SWC40(t − 2)
where RH(t − 2) is the RH of the previous two days and SWC40(t − 2) is the SWC of the previous two days. The accuracy of the model is shown in Table 3. Figure 11 shows that all values almost fall on the 95% confidence interval, and the simulated value is smaller than the observed value during the main growing period. The Pearson’s correlations coefficient between simulated and observed values is 0.794.

4. Discussion

4.1. Stem Radius Variation

In the study, the daily and yearly stem radial variations are shown via the high-resolution measurements (Figure 4 and Figure 5). The radial variations measured using point dendrometers represent a combination of stem radial growth with water transport and storage [27,47]. Thus, the stem radial variations are not only caused by wood formation, but also by the water status in the stems [48], and growth initiation in the early spring may be readily confused with rehydration of internal stem tissues prior to the beginning of cambial growth [26].
From the viewpoint of the yearly timescale, in the spring (DOY 51–147), the air temperature changes dramatically intra-day and inter-day. Generally, the mean air temperature is above 0 °C, and the minimum air temperature is below 0 °C. The extracellular liquid will be frozen when the air temperature falls below 0 °C [49]. Thus, the water potential of the extracellular space will be lower than the intracellular, cytosol water will be withdrawn from the living cells by permeation, and this process will lead to the reduction in the cell volume, which makes the contraction phase happen [33,50]. The frozen liquid will thaw when the air temperature rises above 0 °C, in which case the water will enter the living cells again, make the cell volume swell rapidly, and this process ultimately results in an expansion of the stem radius [33]. Because of the temperature changing frequently above and below 0 °C in the spring, the radius index and the amplitude values present large variations. From the beginning of the main growing period (i.e., moderate phase), the air temperature has increased. Generally, during this phase the minimum air temperature is above 0 °C and the mean air temperature is above 5 °C. The cambial cells start to divide, differentiate, and enlarge. The stem radius increases progressively with the wood formation, and the radius index and the amplitude values present moderate variations. From the late summer (DOY 260), the air temperature decreases. Generally, during this phase the minimum air temperature is below 0 °C, the mean air temperature is above 0 °C, and the maximum air temperature is still above 5 °C. The stem grows progressively slower and eventually halts before the end of the period. Thus, the stem radial increment curve presents a plateau in this period, but the radius index and the amplitude values present strong variations. In winter and early spring (DOY 303–365 and DOY 1–50), the air temperature is low; the minimum air temperature reaches the lowest value (−23.6 °C) on January 8, and daily maximum air temperature keeps below 0 °C. During this time the extracellular liquid is frozen again, consequently, the stem radius decreases gradually (only producing a small amplitude of change) [50], and the radius index also change very little, being in the weak variation phase in this period. Our results are supported by Turcotte et al. [33]; they split the year into three parts according to the pattern of diurnal cycle: winter shrinkage corresponding to the weak variation in our study, spring rehydration corresponding to the strong variation in our study, and summer transpiration corresponding to the moderate variation in our study. King et al. [51] also found that there existed a plateau of stem radial increment after a period of marked growth; the plateau revealed cellular division and expansion being reduced, and having the stem radius decrease in winter suggested stem desiccation.
In considering the diurnal scale, stem radial variations are closely linked to a tree’s water status [18], and they have two daily cycle patterns (Figure 5). Devine and Harrington [52] suggested the daily cycles were results of the tradeoff between water loss (e.g., transpiration) and water uptake (e.g., soil water absorption) during the growing period. We found that the contraction phase of the stem radius usually starts in the morning and lasts in the evening. On the contrary, the expansion phase commonly starts in the evening and continues until the next morning. The contraction phase suggests water loss to the atmosphere is surpassing water uptake—that is, the water amount used for transpiration is more than the water amount absorbed through the roots [27,53]. Meanwhile, the expansion phase reveals water loss is less than water absorption [51]. In the non-growing period, the pattern of daily cycles is inversed compared to that in the growing period. The minimum stem radius value appears in the morning, and the maximum value occurs in the afternoon. The result shows that water loss and uptake is no longer the most important role in stem radius daily cycles [51]; the air temperature becomes the first driving force of stem radial variations [49]. Zweifel and Häsler [50] reported that the effect of air temperature on stem radial variations was significant around the freezing point of the sap. Overall, temperature increase can result in stem radius expansion, and temperature decrease can lead to stem radius contraction.

4.2. Determination of the Main Growing Period

The main growing period refers to the period of time from when the cambial cells start to divide, differentiate, and enlarge to the end of these processes [23]. At present, the starting and ending times have accurately been determined by micro-core measurements [23,54,55], but this method is laborious [35].
The main growing period can be considered to begin when the cambial cells start to enlarge and divide, and to finish when the cambial cell division terminates [54]. In our study, the main growing period of Qinghai spruce was from 30 May to 31 August, which basically aligns with the moderate variation phase. We consider that the moderate variation phase can be defined as the main growing period of Qinghai spruce, and we suggest that the period with daily mean air temperatures sustained above 5 °C is the main growing period of Qinghai spruce, which is supported by micro-core measurements. Körner [56] reported that the lower threshold temperature for tissue growth and development appears to be higher than 3 °C and lower than 10 °C, possibly in the range of 5.5–7.5 °C. Rossi et al. also found a 4–5 °C threshold for xylogenesis in tree line conifers of cold temperate climates [57,58]. Lenz et al. [59] investigated the relationship between early season temperature and cambial activity at the alpine tree line and found that cambial activity in cold-adapted plants is generally initiated at temperatures around 5 °C. These are consistent with our results. Therefore, in future research the main growing period can be identified by the air temperature characteristics rather than by micro-core measurements.

4.3. The Relationship between SRI and Environmental Factors

During the main growing period, we found that the SRI of Qinghai spruce was strongly associated with the tree’s water status. Previous studies have demonstrated that the enlargement of a cell depends on the water content; this is because water content can change the turgor pressure which can drive reversible cell expansion and contraction [60]. Deslauriers et al. [20] regarded the cell enlargement as the primary driver of the daily radial increment.
In our study, there is a significant positive correlation relationship between SRI and precipitation and relative humidity (Figure 10). The canopy of a tree will get wet during rainfall processes, which can result in the reduction of leaf water potential, which in turn can lead to a cambial turgor increase due to water entering into the cambial cells by osmosis—ultimately, enlargement of cells occur [61]. When relative humidity is higher, the transpiration rate will reduce. The reduction of transpiration brings down the negative pressure in the water transportation system and promotes the inflation in the stem cambial cells—consequently, this will be a benefit to cell expansion [62]. Liang et al. [12] used dendroecological techniques to examine the relationships between radial growth of Qinghai spruce and climatic variation on the northeast Tibetan Plateau, and found that the radial growth of Qinghai spruce was positively related to relative humidity and precipitation. The findings are agreeable with ours. It was reported that relative humidity and monthly precipitation were the primary limiting factors for the radial growth of Chinese pine during the growing season in semi-arid areas of northern China [63].
The SRI of Qinghai spruce has a significant negative correlation with daily Tmax, daily mean PAR, daily mean SR, VPD, and daily mean Tmean. This indicates that high VPD, T, PAR, and SR can raise the rate of transpiration, which results in increasing the negative pressure in the water transportation system; in turn, the turgor in the stem cambial cells will decrease, and consequently, cell expansion will be reduced [62]. Meanwhile, the stomata will close with the high value of these factors [64]. Stomatal closure has an influence on the tree’s carbon uptake and photosynthesis, and the synthesis of carbohydrate will subsequently be restrained, so, the radial growth will be inhibited [65].
There are no significant correlations between SRI and soil temperature and soil water content except for SWC at 40 cm depth. SWC at 40 cm is significantly negatively related to SRI, which is clearly different from Jiang et al. [66], as they found the SRI of Platycladus orientalis (L.) Franco was significantly positively related to SWC. We consider that the result may be caused by the soil conditions. In the study area, the soil water content is high within the forest land in the growing season [3]. When soil water content is high due to precipitation, soil temperature will be decreased, and root respiration will be inhibited, which may affect the root activities.
Additionally, ozone is recognized as one of the main damaging air pollutants affecting forest growth [67,68]. Some previous research has suggested that there are relative sensitivities of different species and species groups to O3 concentrations [69]. For example, ozone fumigation induced a shift in the resource allocation into height growth at the expense of diameter growth of Norway spruce, but European beech changed its stem shape the other way around [70]. Assis et al. [71] showed that there is a significant relationship between leaf abscission and ozone induced stress in Psidium guajava L. ‘Paluma’, which may have great importance both to the plant restricting the translocation of nutrients and to the surrounding ecosystem. Paoletti et al. [67] reported that O3 influences phytochemical composition by altering substrate availability and biochemical/physiological processes such as photosynthesis and defense signaling pathways. Ozone concentration is very high in Western China due to high levels of emission precursors occurring in recent years [72]. However, the effects of O3 on the Qinghai spruce growth are little understood, and further research is needed.
In recent years, there have been many researchers focused on the relationship between SRI and environmental factors [20,29,30,46,61,66]; however, these previous studies did not take into account the effects of many environmental factors together on SRI. Duchesne and Houle [73] built a model with data from three growing seasons that included SR, RH, T, and P that explained 84% of the variance in day-to-day stem diameter variations from June to September. The variation of stem diameter they used was the difference between average values of two consecutive days. In this study, we built the multiple linear regression model of the SRI (μm) in relation to daily environmental factors, with Tmax, RH, PAR, and SWC40 included in the model. Although this model could explain only 63% of the observed SRI, it is a new attempt to explore the relationship between SRI and environmental factors.

5. Conclusions

From the study, we can draw several conclusions:
1. The stem radius variations of Qinghai spruce can be divided into three phases according to the air temperature, namely, the weak variation, the moderate variation, and the strong variation. The weak variation corresponded to the non-growing period, the moderate variation corresponded to the main growing period and the period with a plateau of the stem radius increments curve, and the strong variation corresponded to the false growing period resulting from rehydration.
2. Qinghai spruce has two diurnal cycle patterns—one that is ‘up-down-up’ and the other that is ‘down-up-down’. The pattern of ‘up-down-up’ occurs in the main growing period, and is mainly affected by water loss and water uptake. The pattern of ‘down-up-down’ occurs in the non-growing season, and is primarily affected by the temperature.
3. The main growing period of Qinghai spruce is 30 May–31 August. The period with daily mean air temperatures keeping above 5 °C can be considered to be the main growing period of Qinghai spruce in our study area. The daily mean air temperature above 5 °C can be considered to be a representative indicator to identify the main growing period of Qinghai spruce. We consider that the moderate variation phase can be defined as the main growing period of Qinghai spruce, and the main growing period can be identified by the air temperature characteristics in future research rather than by micro-core measurements.
4. Precipitation and relative humidity have positive effects on the growth of Qinghai spruce, while other factors mentioned in the study have negative effects or have no effects on the growth of the species. A multiple linear regression model explained more than 63% of the SRI over the main growing period.

Acknowledgments

We are grateful to Shouzhang Peng, Yapeng Yuan, and Yahua Mao for help during experiments. This work was supported by Nation Natural Science Foundation of China (No. 91025015, No. 91425301).

Author Contributions

Wenbin Wang and Qingtao Wang conceived and designed the experiments; Wenbin Wang and Liming Yuan performed the experiments; Wenbin Wang, Fen Zhang, and Kai Zheng analyzed the data; Wenbin Wang and Chuanyan Zhao wrote the paper. Chuanyan Zhao, Fen Zhang, and Wenbin Wang reviewed and edited the manuscript.

Conflicts of Interest

The authors declare no conflict of interest. The founding sponsors had no role in the design of the study; in the collection, analyses, or interpretation of data; in the writing of the manuscript, and in the decision to publish the results.

References

  1. Wang, Y.; Guo, S.; Wang, J.; Hong, Y.; Bolin, X.; Duoyao, W. Estimation of forest ecosystem service value in the Qilian Mountains national nature reserve in Gansu of China. J. Desert Res. 2013, 33, 1905–1911. [Google Scholar]
  2. Tian, F.X.; Zhao, C.Y.; Feng, Z.D. Simulating evapotranspiration of Qinghai spruce (Picea crassifolia) forest in the Qilian Mountains, Northwestern China. J. Arid Environ. 2011, 75, 648–655. [Google Scholar] [CrossRef]
  3. Chang, X.; Zhao, W.; He, Z. Radial pattern of sap flow and response to microclimate and soil moisture in Qinghai spruce (Picea crassifolia) in the upper Heihe River basin of arid Northwestern China. Agric. For. Meteorol. 2014, 187, 14–21. [Google Scholar] [CrossRef]
  4. Peng, H.; Zhao, C.; Feng, Z.; Xu, Z.; Wang, C.; Zhao, Y. Canopy interception by a spruce forest in the upper reach of Heihe River basin, Northwestern China. Hydrol. Process 2014, 28, 1734–1741. [Google Scholar] [CrossRef]
  5. Zheng, X.; Zhao, C.; Peng, S.; Jian, S.; Liang, B.; Wang, X.; Yang, S.; Wang, C.; Peng, H.; Wang, Y. Soil CO2 efflux along an elevation gradient in Qinghai spruce forests in the upper reaches of the Heihe River, Northwest China. Environ. Earth Sci. 2013, 71, 2065–2076. [Google Scholar] [CrossRef]
  6. Peng, S.; Zhao, C.; Xu, Z. Modeling stem volume growth of Qinghai spruce (Picea crassifoliakom.) in Qilian Mountains of Northwest China. Scand. J. For. Res. 2015, 30, 1–9. [Google Scholar] [CrossRef]
  7. Peng, S.; Zhao, C.; Xu, Z.; Ashiq, M.W. Restoration and conservation potential of destroyed Qinghai spruce (Picea crassifolia) forests in the Qilian Mountains of Northwest China. Mitig. Adapt. Strateg. Glob. Chang. 2014, 21, 153–165. [Google Scholar] [CrossRef]
  8. Xu, Z.; Zhao, C.; Feng, Z. Species distribution models to estimate the deforested area of Picea crassifolia in arid region recently protected: Qilian Mts. National natural reserve (China). Pol. J. Ecol. 2012, 60, 515–524. [Google Scholar]
  9. Xu, Z.; Zhao, C.; Feng, Z.; Zhang, F.; Sher, H.; Wang, C.; Peng, H.; Wang, Y.; Zhao, Y.; Wang, Y.; et al. Estimating realized and potential carbon storage benefits from reforestation and afforestation under climate change: A case study of the Qinghai spruce forests in the Qilian Mountains, Northwestern China. Mitig. Adapt. Strateg. Glob. Chang. 2012, 18, 1257–1268. [Google Scholar] [CrossRef]
  10. Zhao, C.; Nan, Z.; Cheng, G.; Zhang, J.; Feng, Z. Gis-assisted modelling of the spatial distribution of Qinghai spruce (Picea crassifolia) in the Qilian Mountains, Northwestern China based on biophysical parameters. Ecol. Model. 2006, 191, 487–500. [Google Scholar] [CrossRef]
  11. Fu, B.; Wang, S.; Su, C.; Forsius, M. Linking ecosystem processes and ecosystem services. Curr. Opin. Environ. Sustain. 2013, 5, 4–10. [Google Scholar] [CrossRef]
  12. Liang, E.; Shao, X.; Eckstein, D.; Huang, L.; Liu, X. Topography- and species-dependent growth responses of Sabina przewalskii and Picea crassifolia to climate on the Northeast Tibetan Plateau. For. Ecol. Manag. 2006, 236, 268–277. [Google Scholar] [CrossRef]
  13. Zhang, Y.; Wilmking, M.; Gou, X. Changing relationships between tree growth and climate in Northwest China. Plant Ecol. 2008, 201, 39–50. [Google Scholar] [CrossRef]
  14. Zhang, Y.; Wilmking, M. Divergent growth responses and increasing temperature limitation of Qinghai spruce growth along an elevation gradient at the Northeast Tibet Plateau. For. Ecol. Manag. 2010, 260, 1076–1082. [Google Scholar] [CrossRef]
  15. Zhang, Y.; Shao, X.; Wilmking, M. Dynamic relationships between Picea crassifolia growth and climate at upper treeline in the Qilian Mts., Northeast Tibetan Plateau, China. Dendrochronologia 2011, 29, 185–199. [Google Scholar] [CrossRef]
  16. Wang, B.; Chen, T.; Wu, G.; Xu, G.; Zhang, Y.; Gao, H.; Zhang, Y.; Feng, Q. Qinghai spruce (Picea crassifolia) growth–climate response between lower and upper elevation gradient limits: A case study along a consistent slope in the mid-Qilian Mountains region. Environ. Earth Sci. 2016. [Google Scholar] [CrossRef]
  17. Cao, Z. Study on Nondestructive Measurement and Modeling Methods for Standing Tree Volume. Ph.D. Thesis, Beijing Forestry University, Beijing, China, 2015. [Google Scholar]
  18. Drew, D.M.; Downes, G.M. The use of precision dendrometers in research on daily stem size and wood property variation: A review. Dendrochronologia 2009, 27, 159–172. [Google Scholar] [CrossRef]
  19. Wang, Z.; Yang, B.; Qin, C.; Shi, F. Research progress in monitoring and simulating stem radius growth: An overview. Sci. Cold Arid Reg. 2012, 4, 175–183. [Google Scholar]
  20. Deslauriers, A.; Morin, H.; Urbinati, C.; Carrer, M. Daily weather response of balsam fir (Abies balsamea (L.) Mill.) stem radius increment from dendrometer analysis in the boreal forests of Québec (Canada). Trees 2003, 17, 477–484. [Google Scholar] [CrossRef]
  21. Deslauriers, A.; Rossi, S.; Anfodillo, T. Dendrometer and intra-annual tree growth: What kind of information can be inferred? Dendrochronologia 2007, 25, 113–124. [Google Scholar] [CrossRef]
  22. Duchesne, L.; Houle, D.; D’Orangeville, L. Influence of climate on seasonal patterns of stem increment of balsam fir in a boreal forest of Québec, Canada. Agric. For. Meteorol. 2012, 162–163, 108–114. [Google Scholar] [CrossRef]
  23. Mäkinen, H.; Nöjd, P.; Saranpää, P. Seasonal changes in stem radius and production of new tracheids in Norway spruce. Tree Physiol. 2003, 23, 959–968. [Google Scholar] [CrossRef] [PubMed]
  24. Wang, Z.; Yang, B.; Deslauriers, A.; Bräuning, A. Intra-annual stem radial increment response of Qilian juniper to temperature and precipitation along an altitudinal gradient in Northwestern China. Trees 2014, 29, 25–34. [Google Scholar] [CrossRef]
  25. Korpela, M.; Mäkinen, H.; Nöjd, P.; Hollmén, J.; Sulkava, M. Automatic detection of onset and cessation of tree stem radius increase using dendrometer data. Neurocomputing 2010, 73, 2039–2046. [Google Scholar] [CrossRef]
  26. Kozlowski, T.T.; Winget, C.H. Diurnal and seasonal variation in radii of tree stems. Ecology 1964, 45, 149–155. [Google Scholar] [CrossRef]
  27. Herzog, K.M.; Häsler, R.; Thum, R. Diurnal changes in the radius of a subalpine Norway spruce stem: Their relation to the sap flow and their use to estimate transpiration. Trees 1995, 10, 94–101. [Google Scholar] [CrossRef]
  28. Offenthaler, I.; Hietz, P.; Richter, H. Wood diameter indicates diurnal and long-term patterns of xylem water potential in Norway spruce. Trees 2001, 15, 215–221. [Google Scholar] [CrossRef]
  29. Downes, G.; Beadle, C.; Worledge, D. Daily stem growth patterns in irrigated Eucalyptus globulus and E. nitens in relation to climate. Trees 1999, 14, 102–111. [Google Scholar] [CrossRef]
  30. Tardif, J.; Flannigan, M.; Bergeron, Y. An analysis of the daily radial activity of 7 boreal tree species, Northwestern Québec. Environ. Monit. Assess. 2001, 67, 141–160. [Google Scholar] [CrossRef] [PubMed]
  31. Fedör Tatarinov, J.Č. Daily and seasonal variation of stem radius in oak. Ann. For. Sci. 1999, 56, 579–590. [Google Scholar] [CrossRef]
  32. Bouriaud, O.; Leban, J.M.; Bert, D.; Deleuze, C. Intra-annual variations in climate influence growth and wood density of Norway spruce. Tree Physiol. 2005, 25, 651–660. [Google Scholar] [CrossRef] [PubMed]
  33. Turcotte, A.; Morin, H.; Krause, C.; Deslauriers, A.; Martel, M.T. The timing of spring rehydration and its relation with the onset of wood formation in black spruce. Agric. For. Meteorol. 2009, 149, 1403–1409. [Google Scholar] [CrossRef]
  34. Sulkava, M.; Mäkinen, H.; Nöjd, P.; Hollmén, J. Automatic detection of onset and cessation of tree stem radius increase using dendrometer data and CUSUM charts. In Proceedings of European Symposium on Time Series Prediction–ESTSP; Helsinki University of Technology: Helsinki, Finland, 2008; pp. 77–86. Available online: http://research.ics.aalto.fi/publications/sulkava/Sulkava2008b.pdf (accessed on 13th September 2016). [Google Scholar]
  35. Mäkinen, H.; Seo, J.-W.; Nöjd, P.; Schmitt, U.; Jalkanen, R. Seasonal dynamics of wood formation: A comparison between pinning, microcoring and dendrometer measurements. Eur. J. For. Res. 2008, 127, 235–245. [Google Scholar] [CrossRef]
  36. Camarero, J.J.; Olano, J.M.; Parras, A. Plastic bimodal xylogenesis in conifers from continental Mediterranean climates. New Phytol. 2010, 185, 471–480. [Google Scholar] [CrossRef] [PubMed]
  37. Chan, T.; Holtta, T.; Berninger, F.; Makinen, H.; Nojd, P.; Mencuccini, M.; Nikinmaa, E. Separating water-potential induced swelling and shrinking from measured radial stem variations reveals a cambial growth and osmotic concentration signal. Plant Cell Environ. 2016, 39, 233–244. [Google Scholar] [CrossRef] [PubMed]
  38. Cocozza, C.; Palombo, C.; Tognetti, R.; La Porta, N.; Anichini, M.; Giovannelli, A.; Emiliani, G. Monitoring intra-annual dynamics of wood formation with microcores and dendrometers in Picea abies at two different altitudes. Tree Physiol. 2016, 36, 832–846. [Google Scholar] [CrossRef] [PubMed]
  39. Chen, F.; Yuan, Y.J.; Wei, W.S.; Yu, S.L.; Fan, Z.A.; Zhang, R.B.; Zhang, T.W.; Li, Q.; Shang, H.M. Temperature reconstruction from tree-ring maximum latewood density of Qinghai spruce in middle Hexi Corridor, China. Theor. Appl. Climatol. 2011, 107, 633–643. [Google Scholar] [CrossRef]
  40. Zhang, Z.; Wu, X. Utilizing two Qinghai tree-ring chronologies to reconstruct and analyze local historical precipitation. Q. J. Appl. Meteorol. 1992, 3, 61–69. [Google Scholar]
  41. Gou, X.-H.; Chen, F.-H.; Yang, M.-X.; Peng, J.-F.; Qiang, W.-Y.; Tuo, C. Analysis of the tree-ring width chronology of Qilian Mountains at different elevation. Acta Ecol. Sin. 2004, 24, 172–176. [Google Scholar]
  42. Biondi, F.; Hartsough, P. Using automated point dendrometers to analyze tropical treeline stem growth at Nevado de Colima, Mexico. Sensors 2010, 10, 5827–5844. [Google Scholar] [CrossRef] [PubMed]
  43. Irvine, J.; Grace, J. Continuous measurements of water tensions in the xylem of trees based on the elastic properties of wood. Planta 1997, 202, 455–461. [Google Scholar] [CrossRef]
  44. Murray, F.W. On the computation of saturation vapor pressure. J. Appl. Meteorol. 1967, 6, 203–204. [Google Scholar] [CrossRef]
  45. Deslauriers, A.; Rossi, S.; Turcotte, A.; Morin, H.; Krause, C. A three-step procedure in SAS to analyze the time series from automatic dendrometers. Dendrochronologia 2011, 29, 151–161. [Google Scholar] [CrossRef]
  46. Wang, Z.; Yang, B.; Deslauriers, A.; Qin, C.; He, M.; Shi, F.; Liu, J. Two phases of seasonal stem radius variations of Sabina przewalskii kom. in Northwestern China inferred from sub-diurnal shrinkage and expansion patterns. Trees 2012, 26, 1747–1757. [Google Scholar] [CrossRef]
  47. Zweifel, R.; Item, H.; Häsler, R. Link between diurnal stem radius changes and tree water relations. Tree Physiol. 2001, 21, 869–877. [Google Scholar] [CrossRef] [PubMed]
  48. Abe, H.; Nakai, T. Effect of the water status within a tree on tracheid morphogenesis in Cryptomeria japonica D. Don. Trees 1999, 14, 124–129. [Google Scholar]
  49. Sevanto, S.; Suni, T.; Pumpanen, J.; Grönholm, T.; Kolari, P.; Nikinmaa, E.; Hari, P.; Vesala, T. Wintertime photosynthesis and water uptake in a boreal forest. Tree Physiol. 2005, 26, 749–757. [Google Scholar] [CrossRef]
  50. Zweifel, R.; Häsler, R. Frost-induced reversible shrinkage of bark of mature subalpine conifers. Agric. For. Meteorol. 2000, 102, 213–222. [Google Scholar] [CrossRef]
  51. King, G.; Fonti, P.; Nievergelt, D.; Büntgen, U.; Frank, D. Climatic drivers of hourly to yearly tree radius variations along a 6 °C natural warming gradient. Agric. For. Meteorol. 2013, 168, 36–46. [Google Scholar] [CrossRef]
  52. Devine, W.D.; Harrington, C.A. Factors affecting diurnal stem contraction in young Douglas-fir. Agric. For. Meteorol. 2011, 151, 414–419. [Google Scholar] [CrossRef]
  53. Zweifel, R.; Häsler, R. Dynamics of water storage in mature subalpine Picea abies: Tempotal and spatial patterns of change in stem radius. Tree Physiol. 2001, 21, 561–569. [Google Scholar] [CrossRef] [PubMed]
  54. Rossi, S.; Deslauriers, A.; Anfodillo, T. Assessment of cambial activity and xylogenesis by microsampling tree species: An example at the alpine timberline. IAWA J. 2006, 27, 383–394. [Google Scholar] [CrossRef]
  55. Bäucker, E.; Bues, C.-T.; Vogel, M. Radial growth dynamics of spruce (Picea abies) measured by micro-cores. IAWA J. 1998, 19, 301–309. [Google Scholar] [CrossRef]
  56. Körner, C. A re-assessment of high elevation treeline positions and their explanation. Oecologia 1998, 115, 445–459. [Google Scholar] [CrossRef]
  57. Rossi, S.; Deslauriers, A.; Anfodillo, T.; Carraro, V. Evidence of threshold temperatures for xylogenesis in conifers at high altitudes. Oecologia 2007, 152, 1–12. [Google Scholar] [CrossRef] [PubMed]
  58. Rossi, S.; Deslauriers, A.; Griçar, J.; Seo, J.-W.; Rathgeber, C.B.K.; Anfodillo, T.; Morin, H.; Levanic, T.; Oven, P.; Jalkanen, R. Critical temperatures for xylogenesis in conifers of cold climates. Glob. Ecol. Biogeogr. 2008, 17, 696–707. [Google Scholar] [CrossRef]
  59. Lenz, A.; Hoch, G.; Körner, C. Early season temperature controls cambial activity and total tree ring width at the alpine treeline. Plant Ecol. Divers. 2013, 6, 365–375. [Google Scholar] [CrossRef]
  60. Proseus, T.E.; Boyer, J.S. Turgor pressure moves polysaccharides into growing cell walls of Chara corallina. Ann. Bot. 2005, 95, 967–979. [Google Scholar] [CrossRef] [PubMed]
  61. Zweifel, R.; Zimmermann, L.; Zeugin, F.; Newbery, D.M. Intra-annual radial growth and water relations of trees: Implications towards a growth mechanism. J. Exp. Bot. 2006, 57, 1445–1459. [Google Scholar] [CrossRef] [PubMed]
  62. Köcher, P.; Horna, V.; Leuschner, C. Environmental control of daily stem growth patterns in five temperate broad-leaved tree species. Tree Physiol. 2012, 32, 1021–1032. [Google Scholar] [CrossRef] [PubMed]
  63. Liang, E.; Eckstein, D.; Liu, H. Climate-growth relationships of relict Pinus tabulaeformis at the northern limit of its natural distribution in Northern China. J. Veg. Sci. 2008, 19, 393–406. [Google Scholar] [CrossRef]
  64. Ripullone, F.; Guerrieri, M.R.; Nole’, A.; Magnani, F.; Borghetti, M. Stomatal conductance and leaf water potential responses to hydraulic conductance variation in Pinus pinaster seedlings. Trees 2007, 21, 371–378. [Google Scholar] [CrossRef]
  65. Michelot, A.; Simard, S.; Rathgeber, C.; Dufrene, E.; Damesin, C. Comparing the intra-annual wood formation of three european species (Fagus sylvatica, Quercus petraea and Pinus sylvestris) as related to leaf phenology and non-structural carbohydrate dynamics. Tree Physiol. 2012, 32, 1033–1045. [Google Scholar] [CrossRef] [PubMed]
  66. Jiang, Y.; Wang, B.-Q.; Dong, M.-Y.; Huang, Y.-M.; Wang, M.-C.; Wang, B. Response of daily stem radial growth of Platycladus orientalis to environmental factors in a semi-arid area of North China. Trees 2014, 29, 87–96. [Google Scholar] [CrossRef]
  67. Paoletti, E.; Bytnerowicz, A.; Andersen, C.; Augustaitis, A.; Ferretti, M.; Grulke, N.; Gunthardt-Goerg, M.S.; Innes, J.; Johnson, D.; Karnosky, D.; et al. Impacts of air pollution and climate change on forest ecosystems–emerging research needs. Sci. World J. 2007, 7, 1–8. [Google Scholar] [CrossRef] [PubMed]
  68. Matyssek, R.; Bytnerowicz, A.; Karlsson, P.E.; Paoletti, E.; Sanz, M.; Schaub, M.; Wieser, G. Promoting the O3 flux concept for European forest trees. Environ. Pollut. 2007, 146, 587–607. [Google Scholar] [CrossRef] [PubMed]
  69. Buker, P.; Feng, Z.; Uddling, J.; Briolat, A.; Alonso, R.; Braun, S.; Elvira, S.; Gerosa, G.; Karlsson, P.E.; Le Thiec, D.; et al. New flux based dose-response relationships for ozone for European forest tree species. Environ. Pollut. 2015, 206, 163–174. [Google Scholar] [CrossRef] [PubMed]
  70. Pretzsch, H.; Dieler, J.; Matyssek, R.; Wipfler, P. Tree and stand growth of mature Norway spruce and European beech under long-term ozone fumigation. Environ. Pollut. 2010, 158, 1061–1070. [Google Scholar] [CrossRef] [PubMed]
  71. Assis, P.I.; Alonso, R.; Meirelles, S.T.; Moraes, R.M. DO3SE model applicability and O3 flux performance compared to AOT40 for an O3-sensitive tropical tree species (Psidium guajava L. ‘Paluma’). Environ. Sci. Pollut. Res. Int. 2015, 22, 10873–10881. [Google Scholar] [CrossRef] [PubMed]
  72. Li, X.; Liu, J.; Mauzerall, D.L.; Emmons, L.K.; Walters, S.; Horowitz, L.W.; Tao, S. Effects of trans-eurasian transport of air pollutants on surface ozone concentrations over Western China. J. Geophys. Res. Atmos. 2014, 119, 12338–12354. [Google Scholar] [CrossRef]
  73. Duchesne, L.; Houle, D. Modelling day-to-day stem diameter variation and annual growth of balsam fir (Abies balsamea (L.) Mill.) from daily climate. For. Ecol. Manag. 2011, 262, 863–872. [Google Scholar] [CrossRef]
Figure 1. Location of study area and the digital elevation model (DEM).
Forests 07 00210 g001
Figure 2. Photograph of four sample trees and the instruments.
Forests 07 00210 g002
Figure 3. Variations of daily temperature and daily precipitation in 2014 (P is precipitation; Tmean, daily mean temperature; Tmax, daily maximum temperature; Tmin, daily minimum temperature, DOY, day of year). The dash area represents the days mean air temperature above 5 °C.
Forests 07 00210 g003
Figure 4. Variation curves of the stem radii for the four sample trees in 2014.
Forests 07 00210 g004
Figure 5. Three phases and patterns of diurnal changes in the stem radius of PG 1: (a) in a growing period; (b) in a non-growing period. (CP means contraction phase; EP, expansion phase; SRI, stem radial increment phase).
Forests 07 00210 g005
Figure 6. Monthly mean diurnal cycles of stem radii (the thin dotted line represents four sample trees respectively, and the thick solid line represents the mean value of the four sample trees).
Forests 07 00210 g006
Figure 7. The radial growth process of Qinghai spruce on different sampling dates in 2014. (CZ means cambial zone; PR, previous ring; EL, enlarging cells; LG, lignifying cells; MC, mature cells). (a) CZ was still dormant on 17 May (DOY 137); (b) EL cells on 15 June (DOY 166), cells were dividing and enlarging; (c) LG cells (gradual change from blue color to red) and MC (red colored) cells on 10 August (DOY 222), CZ cell division had terminated, but LG cell wall thickening was not completed.
Forests 07 00210 g007
Figure 8. Variations of daily amplitude of stem radial increments for the sample trees and the variations of mean amplitude.
Forests 07 00210 g008
Figure 9. Curves of radial index for sample trees and the mean radial index.
Forests 07 00210 g009
Figure 10. Pearson’s correlations between the SRI of Qinghai spruce and environmental factors during the main growing period.
Forests 07 00210 g010
Figure 11. Linear regressive analysis on the simulated and observed values of stem radial increments. The solid blue line is the regression line and the dotted green lines are envelope curves of the 95% confidence interval.
Forests 07 00210 g011
Table 1. Summary of biological characteristics for four sample trees (DBH, diameter at breast height).
No.Height (m)DBH (cm)Age (Year)Crown Diameter (m)
PG 113.623.401014.43
PG 2 14.427.341265.21
PG 3 22.837.501304.69
PG 419.037.111634.55
M 120.534.381394.78
M 222.133.101254.59
M 314.028.581234.32
M 415.928.231184.07
Table 2. Summary of characteristics in the three phases (RI is radial index).
PhasesDOYTemperature CharacteristicsAmplitude (μm)Absolute Values of RI (%)
Strong variation phase51–147
260–302
Tmax > 5 °C
Tmin < 0 °C
Tmean > 0 °C
114.32 ± 5.101.86 ± 0.13
Weak variation phase1–50
303–365
Tmax < 5 °C
Tmin < 0 °C
Tmean < 0 °C
33.08 ± 3.940.71 ± 0.11
Moderate variation phase148–259Tmax > 5 °C
Tmin > 0 °C
Tmean > 5 °C
84.75 ± 4.071.44 ± 0.11
Table 3. The multiple linear regression model of the SRI (μm) in relation to daily environmental factors.
Model Summary
RR SquareAdjusted R SquareStd. Error of the Estimatep-ValueDurbin-Watson
0.808 0.653 0.633 17.367 <0.01 2.05
Coefficients
VariableBStd. Errortp-ValueVIF
Constant31.930 32.023 0.997 0.322
Tmax−1.391 0.854 −1.630 0.107 4.37
RH1.496 0.276 5.419 <0.01 3.81
PAR0.052 0.022 2.375 0.020 3.92
RH(t − 2)−1.441 0.159 −9.075 <0.01 1.35
SWC40(t − 2)−1.213 0.506 −2.397 0.019 1.41
B means coefficient of regression, t means the value of t-test for regression parameters, VIF means Variance Inflation Factor.

