Article

How Biotic Differentiation of Human Impacted Nutrient Poor Deciduous Forests Can Affect the Preservation Status of Mountain Forest Vegetation

1
Department of Botany, University of Rzeszów, Zelwerowicza 4, PL-35-601 Rzeszów, Poland
2
Department of Zoology, University of Rzeszów, ul. Zelwerowicza 4, PL-35-601 Rzeszów, Poland
*
Author to whom correspondence should be addressed.
Forests 2016, 7(10), 241; https://doi.org/10.3390/f7100241
Submission received: 18 August 2016 / Revised: 10 October 2016 / Accepted: 12 October 2016 / Published: 19 October 2016

Abstract

:
A significant loss of biodiversity resulting from human activity has caused biotic homogenisation to become the dominant process shaping forest communities. In this paper, we present a rare case of biotic differentiation in European temperate deciduous forest herb layer vegetation. The process is occurring in nutrient poor oak-hornbeam forests in mountain areas (Polish Eastern Carpathians, Central Europe) where non-timber use was converted into conventional forest management practice. This change contributed to increases in the nitrogen content and pH reaction of the soil that, contrary to predominant beliefs on the negative impact of habitat eutrophication on diversity, did not result in a decrease in the latter. We discuss possible reasons for this phenomenon that indicate the important role of tree stand composition (an increasing admixture of beech worsening the trophic properties of the soil). The second issue considered involves the effect of the changes in herb species composition of oak-hornbeam forest on its distinctiveness from the beech forest predominating in the Polish Eastern Carpathians. Unfortunately, despite the increase in the species compositional dissimilarity of oak-hornbeam forest, a reduction in their distinctiveness in relation to the herb species composition of beech forest was found. Such a phenomenon is an effect of the major fragmentation of oak-hornbeam forests, a spread of beech forest-type species, and forest management that gives preference to beech trees. Consequently, it can be expected that changes occurring in oak-hornbeam forest vegetation will contribute to a decrease in the forest vegetation variability at the regional scale.

1. Introduction

Scientists emphasise the great significance of biological diversity in the functioning of ecosystems, but they are still far from obtaining a complete understanding of this topic [1,2,3]. Such knowledge is essential, particularly in the context of the remarkable decrease in biodiversity observed across the human-dominated globe [4,5,6]. The decrease in diversity is often associated with a non-random regrouping of species, e.g., with the disappearance of more specialised native species and/or the spreading of alien species or a group of native species showing the properties of generalists [7,8]. The process was termed 'biotic homogenisation' [7,8,9]. Many reports highlight the progressive process of the biotic homogenisation of European forest plant communities [10,11,12]. A serious gap in the application of the theory of diversity is provided by the frequent lack of the possibility of referring to the state of diversity of natural ecological systems. The latter could have decreased or alternatively increased as a result of long-term human activities. It is equally difficult to predict how the change in diversity at the level of one forest community will affect the diversity of forests at the regional scale.
One of the most important factors that determine biodiversity in forests is their human management [13,14,15]. In the past, European forests were used by the local people as a source of the reserves needed to maintain households on a large scale, e.g., raking the litter for bedding, pasturing cattle, cutting branches and gathering nuts for fodder, as well as collecting and cutting wood for fuel [16,17]. In the so-called ‘non-timber use’, the utilisation of forests had a variable impact on forest ecosystems and the diversity of vegetation [16,18]. On the one hand, it contributed to the emergence of semi-natural plant communities and to an increase in the spatial diversity of forest vegetation at the regional scale. On the other hand, it could result in uniformity among the biocoenoses subjected to the same management regime, causing a decrease in their diversity, which is particularly observable in nutrient poor forest communities [19,20]. Traditional forest management, still intensive at the beginning of the 20th century, disappeared completely in the second half of the century. As an outcome of the accumulation of organic material which had previously been removed, and of the decrease in mechanical disturbance, a process of succession was triggered resulting in habitat and vegetation changes. In the course of the development of civilisation, this process may often have been enhanced by the deposition of atmospheric pollutants. At present, an increase in the fertility of forest habitats is universally noted, which results in the disappearance of oligotrophic species and the spread of those with higher trophic requirements, all of which are being identified as one of the chief causes of biotic homogenisation [21]. It should be noted, however, that some of the transformed phytocoenoses could originally have been associated with fertile habitats whose trophic status has deteriorated because of their use. In such cases, the above-described changes in species composition should not come as a surprise. Nevertheless, some seemingly essential questions emerge: (1) how will changes in habitat conditions affect the biodiversity of forest vegetation on various levels of spatial organisation, and (2) will they contribute to its homogenisation? The results of some studies show the phenomenon of differentiation within those forest communities that are poorer in terms of habitat conditions [22]. It is not known whether or not this kind of process will finally result in the homogenisation of communities [23]. Additionally, from the point of view of nature conservation, it is particularly important to recognise the possible impact of changes in species composition upon the maintenance of the distinctiveness of plant communities.
Oak-hornbeam (Quercus robur L. and Carpinus betulus L.) forests were selected for study, which, along with beech (Fagus sylvatica L.) forests, constitute the predominant type of potential forest vegetation in Central Europe [24]. Their habitats are chiefly associated with lowlands, but they also occur in the foothill zone and in the lower parts of mountains where they reach the vertical limit of their range. Unfortunately, because of deforestation and preferential forest management, the actual surface area of oak-hornbeam is small [25]. The oak-hornbeam forests in mountain regions have been exposed to particularly strong pressure. The present study has utilised data pertaining to the Western Bieszczady Mountains (Eastern Carpathians). In this mountain region exist nutrient poor oak-hornbeam forests with a natural admixture of beech. This forests grow on the moderately dry leached brown soils with mean pH = 4.8 (A-horizon, in aqueous solution) and total nitrogen (TN) (%) = 0.45 [26]. Oak-hornbeam forests are limited to the lowest locations (from approx. 450 m to 650 m above sea level (a.s.l.)) that in the past were most densely populated (with approx. 80–100 persons per 100 hectares in the 1920s [27]), which must have resulted in particularly intensive use of these forests and the major fragmentation. One can presume that this high intensity was also affected by the major attractiveness of oak-hornbeam forests, i.e., the greater diversity of woody species and a more abundant herb layer than seen in beech forests typically growing at a higher altitude, which predominate in the region. The almost complete depopulation of the Western Bieszczady Mountains after WWII created a unique opportunity to track changes in the species composition and diversity of the forest vegetation under the conditions of discontinued traditional non-timber forest uses. Assuming that non-timber forest use before the depopulation event resulted in a particularly high level of disturbance, the drop in the level of disturbance after depopulation should result in an increase in the diversity of oak-hornbeam forests, which is in line with the intermediate disturbance hypothesis [28].
The objective of this study was to learn about the effect of changes in species composition occurring over the last 50 years in nutrient poor oak-hornbeam forests freed from non-timber uses upon the spatial and temporal variability of mountain forest vegetation. The following subjects were particularly relevant: (1) the characteristics of changes in the species composition of oak-hornbeam forests, and (2) temporal changes in their biotic diversities at the level of plot and plant communities, and (3) the impact of changes in oak‑hornbeam forest species composition on their distinctiveness in relation to beech forests and, therefore, to the biological heterogeneity of the forest vegetation in the whole region.

2. Materials and Methods

2.1. The Study Site and Data Collection

The data used in this study were collected in the Polish Eastern Carpathians (part of the International Biosphere Reserve ‘Eastern Carpathians’). The study plots were situated within the Western Bieszczady Mountains (1560 km2 with maximum elevations varying from 902 to 1346 m a.s.l., 49°03′ N–49°21′ N, 22°05′ E–22°47′ E). The Western Bieszczady Mountain area is built of Carpathian flysch, which consist predominantly of sandstones, upon which acidic brown soils (i.e., Dystric Cambisols), have formed [29]. The average annual temperature and the annual rainfall in the studied montane region are 5.2 °C and 1100 mm, respectively [30]. The Western Bieszczady Mountains are a very heavily forested region (approx. 80% is occupied by forests). It is mainly beech forest with admixtures of fir (Abies alba Mill.) and sycamore (Acer pseudoplatanus L.), and less extensive areas are covered with riparian and oak-hornbeam forests [31].
Prior to WWII, the forests of this region of the Carpathians were mostly in private hands. The wood was felled in large clearcuts without proper care being taken of the right forms of afforestation. The forests were also commonly used for farming purposes. After WWII, the local population was displaced, the forests were taken over by the state, and they were subjected to more rational forest management based chiefly on shelterwood systems.
In this study, two sets of phytosociological relevés performed during 1950–1955 (hereinafter termed 1950s) and 2000–2005 (hereinafter 2000s) were used. The first set represented the state of forest vegetation in the Western Bieszczady Mountains in the first half of the 20th century [31]. The set included 71 relevés describing the beech forest predominating in the region, and only 12 relevés describing the rarely occurring oak-hornbeam forests. Because of the strong anthropogenic pressure and more complex mountain conditions, only the nutrient poor form of oak-hornbeam forests were found (defined as Tilio-Carpinetum caricetosum in the phytosociological classification). The beech forests included the full variety of habitat conditions appropriate for the Carpathian beech forests. Based upon the information provided by Zarzycki [31] on the locations where the relevés in the archives were recorded (a description of the location and small-scale map), the coarse coordinates of semi-permanent plots were identified and the studies repeated there. In order to increase the comparability of data, the relevés were performed following the Braun-Blanquet approach [32], using the same sampling methods as in the past with regard to the size of the relevés (usually 300 or 400 m2), topographic conditions, and the dates of studies. We assume that study plots were in the same vegetation patches as in the past. This uncertainty in study plot relocation may be used as an argument potentially generating bias in the estimation of temporal changes in vegetation [33]. However, the studies based on semi-permanent plots often provide the sole opportunity to evaluate forest vegetation changes, and they are conducted in many regions [12,21,34]. Comparative study made by Kopecký and Macek [35] revealed that the resurvey of forest semi-permanent plots can supply and estimate vegetation change that is comparable to this based on permanent plots. Since the relevés were only repeated in sites with permanently preserved tree stands, a total of nine and 62 relevés were finally repeated in oak-hornbeam forests and beech forests, respectively.

2.2. Data Analysis

The assessment of changes in species composition in the 1950s and 2000s study plots was conducted separately for the herb and woody species (of the tree layer and undergrowth). In the analyses pertaining to the quantitative proportions of species, the percentage mid-points of the cover-abundance values of particular species were used. Taking into account the high dependency with seminal years, the seedlings of woody species were excluded from the analyses. In the multidimensional analyses, the construction of dissimilarity matrices was founded on the Bray-Curtis dissimilarity indicator of species abundance data commonly applied in estimates of compositional dissimilarity. To present the general patterns of changes in the vegetation of oak-hornbeam forests, non‑metric multidimensional scaling (NMDS) analysis was applied. The permutational multivariate analysis of variance PERMANOVA [36] was used to find the significance of changes in species composition, while the Bonferroni correction factor was used in the determination of the level of significance.
The ecological groups of species were used to interpret the patterns of change in species composition obtained through multi-dimensional analyses of herb vegetation. Ecological groups of species were distinguished based on species requirements for habitat conditions determined using Ellenberg indicator values (EIV, [37]). The indicators of light, soil moisture, nitrogen and soil reaction (in turn: L, F, N, and R) were used [37]. Based on these indicator values, groups of species were distinguished with low (L) and high (H) habitat requirements for light, soil moisture, nitrogen and soil reaction (groups of species with EIV ≤ 3; LL, FL, RL, NL, and those with EIV ≥ 7; LH, FH, RH, NH). Next, the sum of all occurrences of species was calculated for each group of species in the 1950s and 2000s, and the result was correlated with the NMDS axis scores (Spearman test with Monte Carlo procedure (n = 9999)) representing the changes in species compositions. In order to estimate changes on the plant species level, the difference in the number of occurrences in the 2000s and 1950s was calculated for each species. Changes in relative frequency of at least 10% were assumed to be important. The mean Ellenberg indicator values calculated based on of qualitative data were analysed for each of the study periods [37] and were used in order to estimate the changes in habitat conditions on the study plots.
The changes in α diversity at the plot level (expressed by the number of herb species) and in β diversity at the plant community level (expressing the variability of the species composition among communities) were analysed. In order to estimate β diversity, the value of the Bray-Curtis indicator of dissimilarity, recommended for the estimation of biotic homogenisation [8], was calculated between all possible pairs of study plots for the 1950s and 2000s. Then, the mean values of dissimilarity between the study plots in the two periods of research were compared [10,38].
In order to analyse the state of preservation of oak-hornbeam forest vegetation, the changes in the proportion of species typical of fertile deciduous forests (based on the sum of herb species occurrences) were calculated. These species represent the group of species considered diagnostic of eutrophic and mesotrophic Central European deciduous forests in the phytosociological classification (the species characteristic of class Querco-Fagetea and order Fagetalia according to Matuszkiewicz [25]). Because the species composition of a tree stand plays an important role in determining the forest floor vegetation, the share (mean coverage) of the principal woody species was compared between both study periods.
In order to determine the degree of distinctiveness of oak-hornbeam forests (in relation to neighbouring beech forests), those relevés performed in the zone immediately above the upper limit of occurrence of the oak-hornbeam forests (from 600 m to 700 m a.s.l.) were selected from the set of data representing beech forests. The analysis involved the data pertaining to acidic beech forests as well as the poor and typical forms of fertile beech forests (nine plots) that were the closest to the oak-hornbeam forests in terms of habitat. The differences between species compositions of oak-hornbeam and beech forests, both in the past and in the present, were tested with a PERMANOVA analysis [36].
All the analyses were performed with the use of the PAST v. 2.17 software package [39]. The differences between the two periods of study were tested using the Wilcoxon signed rank test with a Monte Carlo procedure (n = 9999).

3. Results

3.1. Changes in Species Abundance and Frequency

The number of herb species did not change significantly between the study plots of the 1950s and 2000s; in the two study periods, the means were 28 and 30. The frequency of 20 species increased, whereas that of 13 species decreased (Supplementary Table S1). The greatest increase in frequency was found in the case of species associated with fertile deciduous forests (chiefly Mercurialis perennis L., Dryopteris filix-mas (L.) Schott and Dentaria bulbifera L.). Moreover, shade-tolerant species (e.g., Oxalis acetosella L.) were more frequent as well as those preferring cleared areas associated with tree felling (e.g., Rubus idaeus L.). Some of the more frequently occurring species were characterized by moderately acidic soil requirements (e.g., Oxalis acetosella, Calamagrostis arundinacea (L.) Roth). The highest decrease in frequency was noted in the case of Maianthemum bifolium (L.) F. W. Schmidt, which is a forest species associated with low nutrient and acidic soils.
When determined per study plot, the mean number of herb species of the group showing a decrease in frequency dropped by a mean of three species (from 6.7 to 3.7; Z = 2.46, p = 0.016); whereas, the number of herb species of the group showing an increase in frequency was higher by a mean of 5.9 species (from 2.7 to 8.6; Z = 2.67, p = 0.004). The mean values of Ellenberg indicator of light (L) was lower, and soil moisture (F), soil reaction (R), and nitrogen content (N) were higher for the group of species with higher frequencies of occurrence than the group of species whose frequencies of occurrence decreased (Supplementary Table S1).
The number of woody species in the study plots of the 1950s and 2000s did not change significantly, and it amounted to a mean of between eight and nine. No significant changes in the closure of tree and shrub layers were found either; although, the mean closure of the tree layer was higher in the 2000s (67% in the 1950s vs. 74% in the 2000s), whereas that in shrub layer was lower (53% in the 1950s vs. 32% in the 2000s). A much higher frequency was found in the 2000s (22% in the 1950s vs. 67% in the 2000s) as well as a higher abundance of beech trees and lower abundance of hazel (Corylus avellana L.) in the shrub layer (Figure 1).

3.2. Changes in the Species Composition

Both in the case of herb species (pseudo-F = 1.97, p = 0.017) and woody species (pseudo-F = 2.82, p = 0.047), the multidimensional analyses revealed significant changes in species composition between the 1950s and 2000s.
The changes in the composition of herb species were linked to an increase in the distinctness of oak-hornbeam phytocoenoses. It was clearly reflected in greater distances between the plots in the 2000s than in the 1950s on the graph presenting the results of NMDS analyses (Figure 2). The higher distinctness is primarily associated with a shift between the corresponding plots of the years 1950s and 2000s that occur along both directions of the 1st axis of the NMDS (Figure 2). The correlation analysis between the 1st axis of the NMDS and the ecological groups of species indicates that the changes in the composition of herb species pertain to decreasing or increasing share of shade-tolerant species as well as to those that require soils richer in nitrogen and with high pH (Table 1). Along the 2nd axis, a smaller shift is observed between the plots of the years 1950s and 2000s. This shift is associated chiefly with changes in the share of species that require nitrogen poor and acidic soils (Table 1).
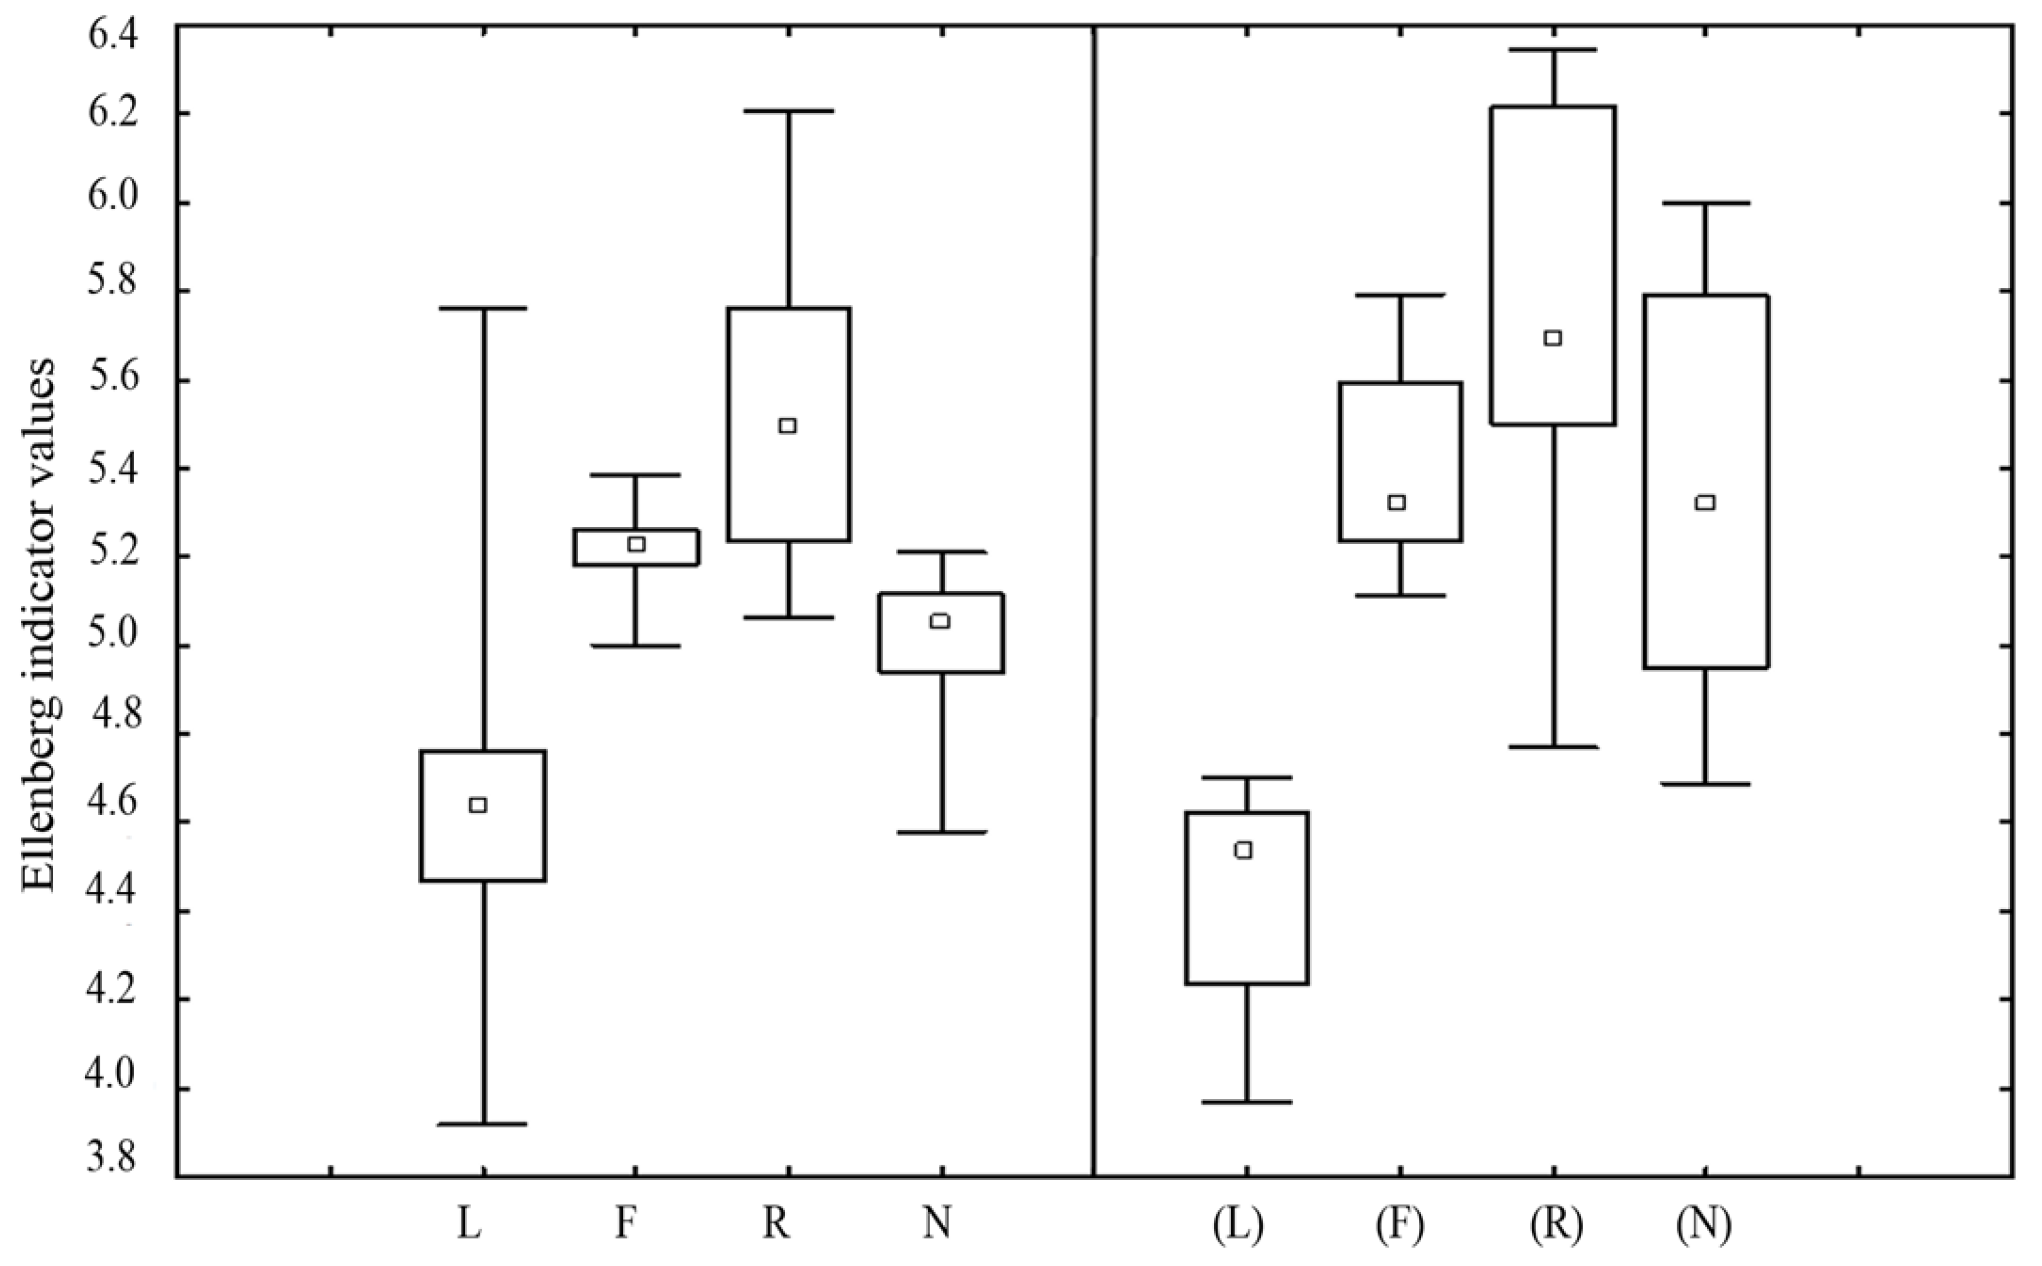
The comparison of box plot distributions of Ellenberg indicators points to a decrease and lower variability of light (L) values, as well as to an increase of indicator values and the variability connected to soil conditions (soil moisture (F), soil reaction (R), and nitrogen content (N). Their variability increased, particularly in the case of soil moisture and nitrogen content indicators. In the past, light conditions showed the greatest variability; however, at present, that is found in the soil reaction and nitrogen content of the soil (Figure 3).
Between the 1950s and 2000s, a process of inter-plot herb layer differentiation occurred, and the average dissimilarity of herb species composition between the study sites (β diversity) increased on average from 0.47 to 0.55 (Z = 2.55; p = 0.008).

3.3. Changes in the Differences between Oak-Hornbeam Forests and Beech Forests

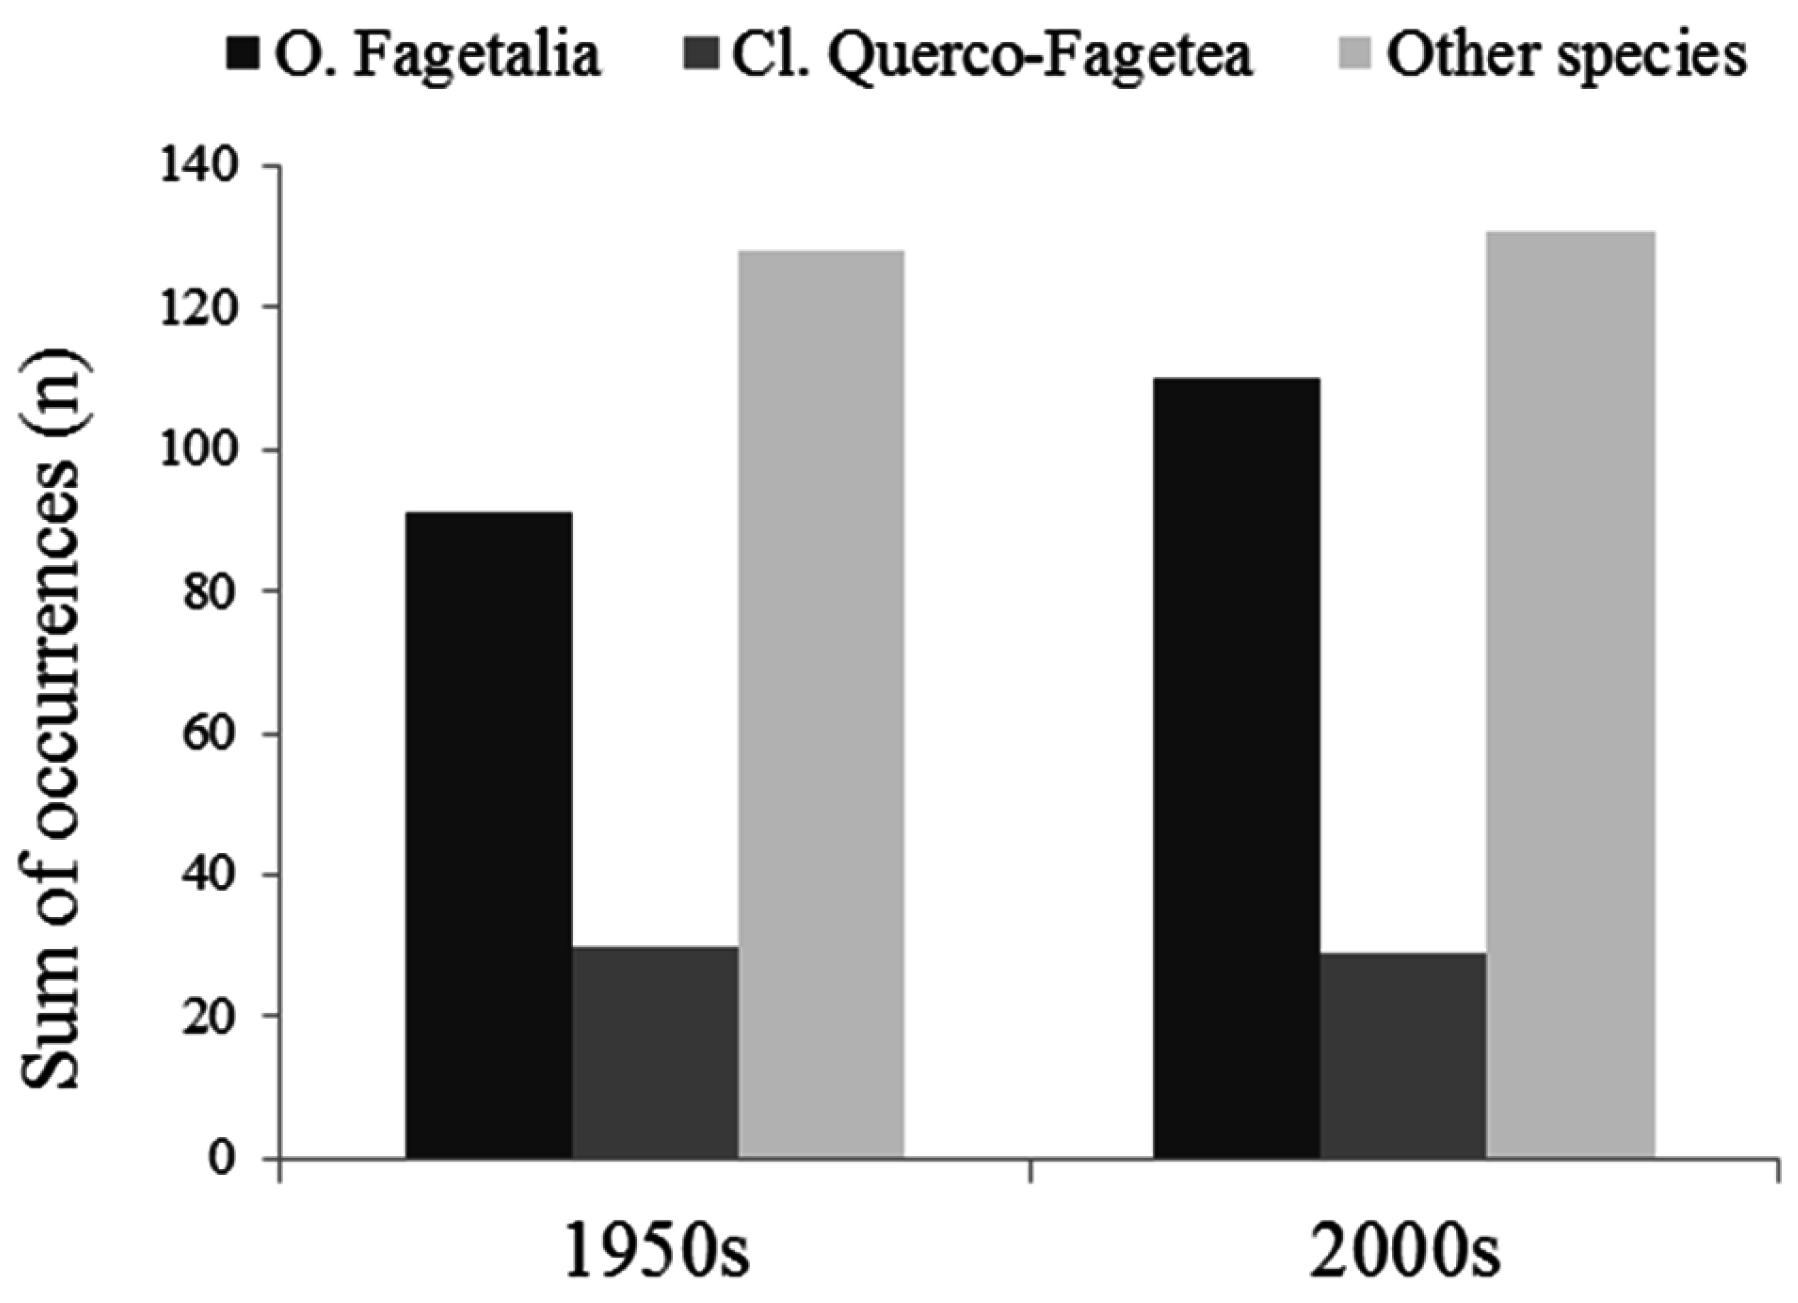
The sum of occurrences of herb species characteristic for mesophytic and eutrophic forests of the order Fagetalia increased from 91 in the 1950s to 110 in the 2000s (Figure 4). The greatest increases were noted for Mercurialis perennis and Dryopteris filix-mas. However, some of the species such as, for example, Aposeris foetida (L.) Less. and Scrophularia nodosa L. as well as a diagnostic species for oak-hornbeam forests (forests belonging to the order Fagetalia)–Carex pilosa Scop., recorded decreases. More frequent occurrences of species diagnostic for the beech forests, likewise belonging to the order Fagetalia (Dentaria bulbifera and Symphytum cordatum Waldst. & Kit. ex Willd.), were also noteworthy. No major changes were found in the group of species diagnostic for the Central European mesophytic and eutrophic deciduous and mixed forests of the Querco-Fagetea class as well as in the cumulative group of ‘other', which contain species not associated with the above phytosociological units (Figure 4).
In both these periods, the PERMANOWA analysis indicated significant differences between oak-hornbeam and beech forests species compositions; although, in the 2000s, the differences were less evident (pseudo-F = 7, p = 0.0003 in the 1950s and pseudo-F = 2.02, p = 0.03 in the 2000s).

4. Discussion

4.1. Changes in Variability of Species Composition

The results of the studies indicated the changes in the species composition of nutrient poor oak-hornbeam forests over the last 50 years. The fairly minor changes in species abundance on study plots indicate that the observed changes in composition of both herbs and woody plants result chiefly from the species turnover between the plots. This causes the increases in β diversity and the differences in taxonomic identities between the plots, stemming from increased differences between the compositions of herb species, noted on the NMDS diagram. In recent decades, attention has most often been focused on the homogenisation of forest plant communities that are associated with the increased shading and fertility of habitats [11]. The increase in the variability in species composition (the process of biotic differentiation) is rarely described in European temperate deciduous forest (e.g., [22]). The results of our studies indicate that this phenomenon can occur in forests that had previously been subjected to strong disturbance which resulted in the impoverishment of their habitats and which makes their phytocoenoses resemble each other more closely.
The numerous group of species that increase their relative frequency suggest that they are the first line contributors to the changes in species composition and increased β diversity in the oak-hornbeam forest vegetation. These ‘winners’ are, above all, shade-tolerant species as well as those which prefer soils rich in nitrogen and with a high pH (e.g., Oxalis acetosella, Dryopteris filix-mas, Mercurialis perennis, and Dentaria bulbifera). To a lesser extent, the changes in species composition are an outcome of those species whose spread is associated with canopy openings and with poor acidic soils (e.g., Rubus idaeus, Cardaminopsis halleri (L.) Hayek, and Deschampsia caespitose (L.) P. Beauv.).
The multidimensional analysis confirmed that the changes in species composition were associated with a group of species that preferred soils with high nitrogen contents and reaction. It confirmed that the increased distinctiveness of oak-hornbeam forests resulted from either the disappearance or the spread of these species. Therefore, the increase in the distinctiveness of oak-hornbeam forest phytocoenoses is not only a result of their spread among, but it is also a result of their disappearance from, the species of fertile habitats (e.g., Melandrium rubrum (Weigel) Garcke, Scrophularia nodosa) and, to a lesser extent, the species of poor and open-canopy habitats (e.g., Fragaria vesca L., Maianthemum bifolium, and Sedum fabaria W. D. J. Koch).
The reasons for the changes in species composition as well as for the increase in β diversity should be linked to the increase in the heterogeneity of site conditions [cf. 18]. The intensive non-timber forest use predominating in the past resulted in a drop in fertility and pH reaction of soils [16]. The phenomenon of the worsening of soil properties must have been particularly acute in the case of those habitats richer in nutrients [40]. As a consequence, species having higher trophic requirements tended to disappear. It can be expected that the species composition was also strongly influenced by preferential selection during browsing by pastured domesticated animals that could contribute to the spread of species of grasses and sedges—more resistant to browsing, e.g., Carex pilosa [41]. The discontinuation of non-timber forest use contributed to a reduction in the disturbance in the lower layers of forest and to an increase in the quantity of dead organic matter on the forest floor; the forest sites became more shaded, and both the humidity and nutrient content in the soil increased. As a consequence, some of the principal habitat factors that determined the differentiation of forest plant communities had changed. For example, the great variation in light conditions (the effect of cutting branches and pasturing animals), which prevailed in the past, was now replaced by a great variability in soil trophic status and soil reaction (which resulted from the accumulation of litter, an increased proportion of beech trees, and a lowered proportion of hazel) induced by forest management and natural dynamic processes. In conclusion, the lowered level of disturbance in a forest ecosystem stemming from the change of use can result in either a homogenisation [38,42] or a differentiation of forest plant communities. In particular, the differentiation can be observed during the recovery of forest phytocoenoses that previously underwent intensive non-timber forest use.

4.2. Why Did the Increase in Fertility not Lower the Diversity?

The eutrophication of habitats is considered to be one of the chief factors that determine changes in species composition that fairly often results in homogenisation [11,43,44]. In accordance with the main pattern of change in vegetation occurring under the effect of eutrophication, the number of oligotrophic species decreases, whereas both the number and proportion of species preferring fertile habitats increases. Together with the enhanced competition, increasing in line with improved habitat resources, the latter species finally bring about a decline in diversity [45].
In the Bieszczady Mountains, the accumulation of nitrogen was a combined effect of the decomposition of organic matter and its deposition, but, in the past, the amount of the latter in south-eastern Poland was relatively low [46], and, since the 1990s, it has decreased systematically throughout the whole country [47]. In line with the results obtained by Dzwonko and Gawroński [48] and Vild et al. [49], when non-timber forest use is discontinued, the most important factor for maintaining the trophic properties of soil is the accumulation of litter, and the nitrogen load involved is several times larger than the nitrogen received from the deposit.
When the trophic properties of soil depend primarily on litter, the species and spatial composition of tree stands are the most important factors in their development [50]. In the oak-hornbeam forests studied, the proportion of hazel decreased and that of beech increased. In contrast to hazel leaves, beech leaves decompose slowly. Therefore, in places where beech increased its proportion, the improvement in soil trophic properties could not be great, because the beech leaves contributed to the increased thickness of the litter layer, lower rates of decomposition and cycling of C and N, as well as to a decrease in the proportions of available nutrients and to a decrease in soil pH [50,51]. Thus, paradoxically, the beech contributed, by the inhibition of the litter decomposition rate and by the specific properties of the beech litter, to the differentiation among habitats undergoing eutrophication (via increased thickness of the litter layer, and to the decreases in pH and nutrient availability). In effect, the combination of the spontaneous recovery of habitats and the impact of forest management resulted in the increased diversity of vegetation.
Finally, the practical application of the results obtained can be presented. These indicate that it may be possible to use those tree species (which are natural components of a forest stand) whose leaves have an adverse effect on the rate of decomposition and trophic parameters of the litter. Increasing the proportions of such species in the forest can neutralise the negative effect exerted by the increasing fertility of habitats on the diversity of deciduous forests.

4.3. Changes in Distinctiveness between Oak-Hornbeam and Beech Forests

Beech forests are the predominant type of natural vegetation in the lower altitude zones of the Carpathians. In addition to riparian forests, they are also accompanied by oak-hornbeam that, although occupying small areas, markedly adds to the differentiation of forest vegetation at the level of the whole region [31,52].
On the one hand, the results of herb species compositional dissimilarity analysis indicate that the distinction between the oak-hornbeam and beech forests still persists in the 2000s. On the other hand, the much lower pseudo F-ratio (the test statistic for PERMANOVA analysis) in the 2000s indicates that plots from oak-hornbeam forest are closer to beech forest in multivariate space than in the 1950s and, thus, the differences between the composition of these forest communities decreased. It is indicative of the ongoing process whereby the oak-hornbeam and beech phytocoenoses come increasingly to resemble each other. The increased proportion of beech and other species typical of beech forest, along with the disappearance of Carex pilosa, a species typical of oak-hornbeam forests, indicate that the latter forests have become more and more similar to the neighbouring beech forests. This seems surprising when considered against the background of the results indicating the biotic differentiation of herb layer vegetation in oak-hornbeam forests in the 2000s. Nevertheless, one should remember that the oak-hornbeam forests under study were the poorest forms. In the 2000s, their habitats manifested clear increases in the differentiation of soil humidity and nitrogen contents that thus favoured differentiation among oak-hornbeam forests. Unfortunately, the area of oak-hornbeam forests that is too small and the presence in the immediate vicinity of vast areas of beech forests surrounding the oak-hornbeam forests had caused that changes in soil conditions occurring in the oak-hornbeam forests were advantageous to the spread of beech forest-related species requiring fertile habitats. Additionally, the process was further encouraged by forest management prioritising beech because of the higher commercial value of its wood. As a consequence, the variability in species composition of oak-hornbeam forests did indeed increase; however, at the scale of the region, these forests have slowly lost their former distinctiveness and now contribute to the reduced differentiation of forest vegetation.

5. Conclusions

This work demonstrated that changes in species composition of temperate European forests can lead not only to biotic homogenization but also to biotic differentiation. The results indicated the possibility of counteracting eutrophication of forest habitats that causes a decrease in forest diversity by adjusting the tree species composition. Additionally, this work revealed the effects of changes in the variability in the species composition of oak-hornbeam forests and preferential forest management that favours beech. They contributed to a decrease in the forest vegetation variability at the regional scale.

Supplementary Materials

The following are available online at www.mdpi.com/1999-4907/7/10/241/s1, Table S1. Changes in the frequency of occurrence of herbaceous plants between sampling periods. Only those species with frequencies changed by at least 10% are shown. For the groups composed of disappearing and of spreading species, the mean values of Ellenberg indicators (EIV) are given.

Acknowledgments

We would like to thank the Regional Directorate of the State Forests in Krosno for granting access to the management and administrative specification documentation. Financial support for these studies was provided by the statutory fund of the University of Rzeszów.

Author Contributions

Tomasz Durak conceived, designed and implemented the study, performed data analysis and prepared the manuscript. Roma Durak contributed to data analysis and manuscript preparation.

Conflicts of Interest

The authors declare no conflict of interest.

References

  1. Loreau, M.; Naeem, S.; Inchausti, P.; Bengtsson, J.; Grime, J.P.; Hector, A.; Hooper, D.U.; Huston, M.A.; Raffaelli, D.; Schmid, B.; et al. Biodiversity and ecosystem functioning: Current knowledge and future challenges. Science 2001, 294, 804–808. [Google Scholar] [CrossRef] [PubMed]
  2. Hooper, D.U.; Chapin, F.S., III; Ewel, J.J.; Hector, A.; Inchausti, P.; Lavorel, S.; Lawton, J.H.; Lodge, D.M.; Loreau, M.; Naeem, S.; et al. Effects of biodiversity on ecosystem functioning: A consensus of current knowledge. Ecol. Monogr. 2005, 75, 3–35. [Google Scholar] [CrossRef] [Green Version]
  3. Balvanera, P.; Pfisterer, A.B.; Buchmann, N.; He, J.-S.; Nakashizuka, T.; Raffaelli, D.; Schmid, B. Quantifying the evidence for biodiversity effects on ecosystem functioning and services. Ecol. Lett. 2006, 9, 1146–1156. [Google Scholar] [CrossRef] [PubMed] [Green Version]
  4. Vitousek, P.M.; Mooney, H.A.; Lubchenco, J.; Melillo, J.M. Human domination of earth’s ecosystems. Science 1997, 277, 494–499. [Google Scholar] [CrossRef]
  5. Sax, D.F.; Gaines, S.D. Species diversity: From global decreases to local increases. Trends Ecol. Evol. 2003, 18, 561–566. [Google Scholar] [CrossRef]
  6. Butchart, S.H.M.; Walpole, M.; Collen, B.; Van Strien, A.; Scharlemann, J.P.W.; Almond, R.E.A.; Baillie, J.E.M.; Bomhard, B.; Brown, C.; Bruno, J.; et al. Global biodiversity: Indicators of recent declines. Science 2010, 328, 1164–1168. [Google Scholar] [CrossRef] [PubMed]
  7. McKinney, M.L.; Lockwood, J.L. Biotic homogenization: A few winners replacing many losers in the next mass extinction. Trends Ecol. Evol. 1999, 14, 450–453. [Google Scholar] [CrossRef]
  8. Olden, J.D.; Rooney, T.P. On defining and quantifying biotic homogenization. Global Ecol. Biogeogr. 2006, 15, 113–120. [Google Scholar] [CrossRef]
  9. Smart, S.M.; Thompson, K.; Marrs, R.H.; Le Duc, M.G.; Maskell, L.C.; Firbank, L.G. Biotic homogenization and changes in species diversity across human-modified ecosystems. Proc. R. Soc. B 2006, 273, 2659–2665. [Google Scholar] [CrossRef] [PubMed]
  10. Naaf, T.; Wulf, M. Habitat specialists and generalists drive homogenization and differentiation of temperate forest plant communities at the regional scale. Biol. Conserv. 2010, 143, 848–855. [Google Scholar] [CrossRef]
  11. Keith, S.A.; Newton, A.C.; Morecroft, M.D.; Bealey, C.E.; Bullock, J.M. Taxonomic homogenization of woodland plant communities over 70 years. Proc. R. Soc. B 2009, 276, 3539–3544. [Google Scholar] [CrossRef] [PubMed]
  12. Durak, T.; Durak, R. Vegetation changes in meso- and eutrophic submontane oak–hornbeam forests under long-term high forest management. For. Ecol. Manag. 2015, 354, 206–216. [Google Scholar] [CrossRef]
  13. Ledig, F.T. Human impacts on genetic diversity in forest ecosystems. Oikos 1992, 63, 87–108. [Google Scholar] [CrossRef]
  14. Bengtsson, J.; Nilsson, S.G.; Franc, A.; Menozzi, P. Biodiversity, disturbances, ecosystem function and management of European forests. For. Ecol. Manag. 2000, 132, 39–50. [Google Scholar] [CrossRef]
  15. Morris, R.J. Anthropogenic impacts on tropical forest biodiversity: A network tructure and ecosystem functioning perspective. Philos. Trans. R. Soc. B Biol. Sci. 2010, 365, 3709–3718. [Google Scholar] [CrossRef] [PubMed]
  16. Glatzel, G. The Impact of historic land use and modern forestry on nutrient relations of Central European forest ecosystems. Fertil. Res. 1991, 27, 1–8. [Google Scholar] [CrossRef]
  17. Bürgi, M.; Gimmi, U. Three objectives of historical ecology: The case of litter collecting in Central European forests. Landsc. Ecol. 2007, 22, 77–87. [Google Scholar] [CrossRef]
  18. Paudel, S.; Sah, J.P. Effects of different management practices on stand composition and species diversity in subtropical forests in Nepal: Implications of community participation in biodiversity conservation. J. Sustain. For. 2015, 34, 738–760. [Google Scholar] [CrossRef]
  19. Fleischner, T.L. Ecological costs of livestock grazing in western North America. Conserv. Biol. 1994, 8, 629–644. [Google Scholar] [CrossRef]
  20. Foster, D.R.; Motzkin, G.; Slater, B. Land-use history as long-term broad-scale disturbance: Regional forest dynamics in Central New England. Ecosystems 1998, 1, 96–119. [Google Scholar] [CrossRef]
  21. Verheyen, K.; Baeten, L.; De Frenne, P.; Bernhardt-Römermann, M.; Brunet, J.; Cornelis, J.; Decocq, G.; Dierschke, H.; Eriksson, O.; Hédl, R.; Heinken, T.; et al. Driving factors behind the eutrophication signal in understorey plant communities of deciduous temperate forests. J. Ecol. 2012, 100, 352–365. [Google Scholar] [CrossRef]
  22. Durak, T.; Holeksa, J. Biotic homogenisation and differentiation along a habitat gradient resulting from the ageing of managed beech stands. For. Ecol. Manag. 2015, 351, 47–56. [Google Scholar] [CrossRef]
  23. Rooney, T.P.; Olden, J.D.; Leach, M.K.; Rogers, D.A. Biotic homogenization and conservation prioritization. Biol. Conserv. 2007, 134, 447–450. [Google Scholar] [CrossRef]
  24. Bohn, U.; Gollub, G.; Hettwer, C.; Neuhäuslová, Z.; Raus, Th.; Schlüter, H.; Weber, H. Karte Der Natürlichen Vegetation Europas. Map of the Natural Vegetation of Europe, Maßstab/Scale 1:2.500.000, Interaktive/Interactive CD-ROM - Erläuterungstext, Legende, Karten / Explanatory Text, Legend, Maps; Landwirtschaftsverlag: Münster, Germany, 2004. [Google Scholar]
  25. Matuszkiewicz, W. Przewodnik Do Oznaczania Zbiorowisk Roślinnych Polski; Scientific Publishers PWN: Warszawa, Poland, 2001. [Google Scholar]
  26. Adamczyk, B.; Zarzycki, K. Gleby bieszczadzkich zbiorowisk leśnych. Acta Agrar. Silv. Ser. Silv. 1963, 3, 133–175. [Google Scholar]
  27. Kubijowicz, W. Życie Pasterskie W Beskidach Wschodnich; Prace Instytutu Geograficznego UJ 5: Kraków, Poland, 1926. [Google Scholar]
  28. Connell, J.H. Diversity in tropical rain forests and coral reefs. Science 1978, 199, 1302–1310. [Google Scholar] [CrossRef] [PubMed]
  29. Skiba, S.; Drewnik, M. Soil Map of the Polish Carpathian Mountains. Rocz. Bieszcz. 2003, 11, 15–20. [Google Scholar]
  30. Nowosad, M. Outlines of climate of the Bieszczady National Park and its buffer zone in the light of previous studies. Rocz. Bieszcz. 1995, 4, 163–183. [Google Scholar]
  31. Zarzycki, K. Lasy Bieszczadów Zachodnich. Acta Agrar. Silv. Ser. Silv. 1963, 3, 1–132. [Google Scholar]
  32. Braun-Blanquet, J. Pflanzensoziologie, Grundzüge Der Vegetationskunde; Springer-Verlag: Vienna, Austria; New York, NY, USA, 1964. [Google Scholar]
  33. Fischer, M.; Stöcklin, J. Local extinctions of plants in remnants of extensively used calcareous grasslands 1950–1985. Conserv. Biol. 1997, 11, 727–737. [Google Scholar] [CrossRef]
  34. Durak, T. Changes in vegetation of fertile Carpathian beech forests with perennial honesty Lunaria rediviva based on analysis of the herb layer (Słonne Mountains, Eastern Carpathians). Sylwan 2011, 155, 120–128. [Google Scholar]
  35. Kopecký, M.; Macek, M. Vegetation resurvey is robust to plot location uncertainty. Divers. Distrib. 2015, 21, 322–330. [Google Scholar] [CrossRef]
  36. Anderson, M.J. A new method for non-parametric multivariate analysis of variance. Aust. Ecol. 2001, 26, 32–46. [Google Scholar]
  37. Ellenberg, H.; Weber, H.E.; Düll, R.; Wirth, V.; Werner, W.; Paulissen, D. Zeigerwerte von Pflanzen in Mitteleuropa. Scr. Geobot. 1992, 18, 1–248. [Google Scholar]
  38. Van Calster, H.; Baeten, L.; De Schrijver, A.; De Keersmaeker, L.; Register, J.E.; Verheyen, K.; Hermy, M. Management driven changes (1967–2005) in soil acidity and the understorey plant community following conversion of a coppice-with-standards forest. For. Ecol. Manag. 2007, 241, 258–271. [Google Scholar] [CrossRef]
  39. Hammer, O.; Harper, D.A.T.; Ryan, P.D. PAST: Paleontological statistics software package for education and data analysis. Palaeontol. Electron. 2001, 4, 1–9. [Google Scholar]
  40. Sayer, E.J. Using experimental manipulation to assess the roles of leaf litter in the functioning of forest ecosystems. Biol. Rev. 2005, 80, 1–31. [Google Scholar] [CrossRef] [PubMed]
  41. Rooney, T.P.; Waller, D.M. Direct and indirect effects of white-tailed deer in forest ecosystems. For. Ecol. Manag. 2003, 181, 165–176. [Google Scholar] [CrossRef]
  42. Decocq, G.; Aubert, M.; Dupont, F.; Bardat, J.; Wattez-Franger, A.; Saguez, R.; De Foucault, B.; Alard, D.; Delelis-Dusollier, A. Silviculture-driven vegetation change in a European temperate deciduous forest. Ann. For. Sci. 2005, 62, 313–323. [Google Scholar] [CrossRef]
  43. Bobbink, R.; Hicks, K.; Galloway, J.; Spranger, T.; Alkemade, R.; Ashmore, M.; Bustamante, M.; Cinderby, S.; Davidson, E.; Dentener, F.; et al. Global assessment of nitrogen deposition effects on terrestrial plant diversity: A synthesis. Ecol. Appl. 2010, 20, 30–59. [Google Scholar] [CrossRef] [PubMed] [Green Version]
  44. Duprè, C.; Stevens, C.J.; Ranke, T.; Bleeker, A.; Peppler-Lisbach, C.; Gowing, D.J.G.; Dise, N.B.; Dorland, E.; Bobbink, R.; Diekmann, M. Changes in species richness and composition in European acidic grasslands over the past 70 years: The contribution of cumulative atmospheric nitrogen deposition. Glob. Chang. Biol. 2010, 16, 344–357. [Google Scholar] [CrossRef]
  45. Gilliam, F.S. Response of the herbaceous layer of forest ecosystems to excess nitrogen deposition. J. Ecol. 2006, 94, 1176–1191. [Google Scholar] [CrossRef]
  46. Grodzińska, K.; Szarek-Łukaszewska, G. Polish mountain forests: past, present and future. Environ. Pollut. 1997, 98, 369–374. [Google Scholar] [CrossRef]
  47. Główny Inspektorat Ochrony Środowiska (Chief Inspectorate of Environmental Protection). Available online: http://www.gios.gov.pl/chemizm2010/index.html (accessed on 5 June 2016).
  48. Dzwonko, Z.; Gawronski, S. Effect of litter removal on species richness and acidification of a mixed oak-pine woodland. Biol. Conserv. 2002, 106, 389–398. [Google Scholar] [CrossRef]
  49. Vild, O.; Kalwij, J.M.; Hédl, R. Effects of simulated historical tree litter raking on the understorey vegetation in a central European forest. Appl. Veg. Sci. 2015, 18, 569–578. [Google Scholar] [CrossRef]
  50. Augusto, L.; Jacques, R.; Binkley, D.; Andreas, R. Impact of several common tree species of European temperate forests on soil fertility. Ann. For. Sci. 2002, 59, 233–253. [Google Scholar] [CrossRef]
  51. Jacob, M.; Weland, N.; Platner, C.; Schaefer, M.; Leuschner, C.; Thomas, F.M. Nutrient release from decomposing leaf litter of temperate deciduous forest trees along a gradient of increasing tree species diversity. Soil Biol. Biochem. 2009, 41, 2122–2130. [Google Scholar] [CrossRef]
  52. Grodzińska, K.; Godzik, B.; Frączek, W.; Badea, O.; Oszlányi, J.; Postelnicu, D.; Shparyk, Y. Vegetation of the selected forest stands and land use in the Carpathian Mountains. Environ. Pollut. 2004, 130, 17–32. [Google Scholar] [CrossRef] [PubMed]
Figure 1. Changes in abundance of the tree and shrub layer species between sampling periods.
Forests 07 00241 g001
Figure 2. Two-dimensional NMDS diagram of the shift in herb layer composition of oak-hornbeam forests in the Western Bieszczady Mountains between the 1950s and 2000s. The shifts between sampling periods are indicated by the arrows. Dashed vectors indicate ecological groups of species with a high relationship with NMDS scores. See Table 1 for details of the dashed vectors.
Forests 07 00241 g002
Figure 3. Changes in Ellenberg indicator values between the 1950s (left part of the diagram) and 2000s (right part of diagram, indicators shown in parentheses). Squares indicate median values, and open boxes indicate the interquartile range (25%–75%), whiskers extend to the min/max of the dataset range. The standard deviation (± SD) of the EIV in the 1950s and 2000s was (L) 0.46 and 0.26, (F) 0.12 and 0.22, (R) 0.36 and 0.51, and (N) 0.18 and 0.34.
Forests 07 00241 g003
Figure 4. Changes in the occurrence of herbaceous plants typical of the phytosociological units between sampling periods. In the case of diagnostic species for mesophytic and eutrophic forests of the order Fagetalia, the sums of occurrences in study plots from the 1950s were increased by the 2000s as a result of the spread of species typical of beech forests (more details in the text).
Forests 07 00241 g004
Table 1. Spearman rank correlations (n = 18) between 1 and 2 axes of non metric multidimensional scaling (NMDS) analysis of herb species and ecological groups of species (groups of species with EIV ≤ 3; LL, FL, RL, NL, and with EIV ≥ 7; LH, FH, RH, NH; for full explanation of abbreviations refer to Section 2.2.).
Axis 1 Axis 2
Spearman's rho correlation coefficientspSpearman's rho correlation coefficientsp
LL0.81<0.00010.070.775
LH0.190.446−0.380.117
FL−0.210.409−0.490.039
FH0.040.8670.030.920
RL−0.420.087-0.580.010
RH0.74<0.0010.240.332
NL0.150.557−0.550.017
NH0.480.0420.220.374