Article

De Novo Assembly and Characterization of Bud, Leaf and Flowers Transcriptome from Juglans Regia L. for the Identification and Characterization of New EST-SSRs

1
Key Laboratory of Resource Biology and Biotechnology in Western China, Ministry of Education, College of Life Sciences, Northwest University, Xi’an, Shanxi 710069, China
2
USDA Forest Service Hardwood Tree Improvement and Regeneration Center (HTIRC), Department of Forestry and Natural Resources, Purdue University, 715 West State Street, West Lafayette, IN 47907, USA
*
Authors to whom correspondence should be addressed.
These authors contributed equally to this work.
Forests 2016, 7(10), 247; https://doi.org/10.3390/f7100247
Submission received: 24 August 2016 / Revised: 13 October 2016 / Accepted: 18 October 2016 / Published: 21 October 2016

Abstract

:
Persian walnut (Juglans regia L.), valued for both its nut and wood, is an ecologically important temperate tree species native to the mountainous regions of central Asia. Despite its importance, there are still few transcriptomic resources in public databases for J. regia, limiting gene discovery and breeding. Here, more than 49.9 million sequencing reads were generated using Illumina sequencing technology in the characterization of the transcriptome of four J. regia organs (bud, leaf, female flowers, and male flowers). De novo assembly yielded 117,229 unigenes with an N50 of 1955 bp. Based on sequence similarity searches against known proteins, a total of 20,413 (17.41%) genes were identified and annotated. A set of 27,584 unigenes with SSR (simple sequence repeats) motifs were identified as potential molecular markers, and a sample of 77 of these EST-SSRs (express sequence tags) were further evaluated to validate their amplification and assess their polymorphism. Next, we developed 39 polymorphic microsatellite markers to screen 88 Persian walnut individuals collected from 11 populations. These markers and transcriptomic resources will be useful for future studies of population genetic structure, evolutionary ecology, and breeding of Persian walnut and other Juglans species.

1. Introduction

Juglans regia L., a diploid (2n = 32) walnut species, is known as Persian, English, or common walnut. It is native to the mountainous regions of central Asia [1,2,3]. It is an ecologically important tree species valued for both its nuts and wood since ancient times [4,5,6]. Walnut is cultivated commercially in nearly every nation with a temperate climate. World production of whole walnut (in-shell) was around 1.5 × 10⁶ tons in 2008 [7]. Despite its huge value, genomic resources for Persian walnut are limited.
The most abundant genetic resource for Persian walnut is microsatellites (simple sequence repeat, SSRs), which can be neutral or genic (expressed sequence tags, EST-SSRs). Recently, 185 polymorphic genomic, non-genic SSRs from J. regia were published and 398 EST-SSRs were identified by Zhang et al. through data mining, of which 41 were shown to be polymorphic [8,9]. In general, EST-SSRs are more conserved than noncoding sequences; therefore, EST-SSR markers have a relatively high transferability to closely related species [10,11]. A total of 21,294 EST sequences of J. regia have been deposited in the NCBI (National Center for Biotechnology Information) GenBank database. This represents an estimated 99.6% of all Juglans ESTs (21,375, as of October 2015). Zhang et al. identified 805 loci containing EST-SSRs, although only 13 EST-SSRs (2.5%) were tested extensively [9,12]. Previous methods for developing SSRs from genomic DNA required costly and time-consuming approaches involving cDNA library construction, cloning, and labor intensive Sanger sequencing.
Next generation sequencing (NGS) of transcriptomes has proved an attractive alternative to whole genome sequencing [13,14,15]. The transcriptome provides information on gene expression, gene regulation, and amino acid content of proteins. Therefore, transcriptome analysis is essential to interpret the functional elements of the genome and to provide insight into the proteins present in cells and tissues [10,16,17]. Moreover, with traditional methods, sequencing of randomly selected cDNA clones often resulted in insufficient coverage of less-abundant transcripts, which potentially have essential functions [18,19]. Transcriptome data generated by high-throughput sequencing has been an excellent resource for SSR marker development [20] and gene discovery [21,22].
In this study, we utilized Illumina paired-end sequencing to characterize the pooled transcriptome of buds, leaves, female flowers, and male flowers of Persian walnut. The resulting sequence data was used to develop EST-derived SSR markers. This study involved the: (1) characterization of the frequency and distribution of putative SSRs obtained from J. regia transcriptome and analysis of polymorphism in the EST-SSR markers derived from expressed sequences, and (2) exploration of the population structure of 88 individuals from 11 Chinese populations using the EST-SSR markers. These markers will be useful for genetic mapping, population genetic studies, evolutionary ecology, and breeding of Juglans species.

2. Materials and Methods

2.1. Sample Collections, DNA Extraction and RNA Extraction

For transcriptome sequencing, fresh leaves, buds, female flowers, and male flowers were collected on 28 April 2014 from a single, mature, healthy-appearing J. regia tree growing in the Qingling Mountains of western China and immediately frozen in liquid nitrogen prior to storage at −80 °C. Total RNA was extracted using OMEGA Bio-Tek’s Plant RNA Kit (Norcross, GA, USA). RNA degradation and contamination was monitored on 1% agarose gels. RNA purity was assayed using the Nano Photometer® spectro photometer (IMPLEN, Westlake Village, CA, USA) and RNA concentration was measured using the Qubit® 2.0 Flurometer (Life Technologies, Carlsbad, CA, USA). RNA integrity was assessed using the Agilent Bioanalyzer 2100 system (Agilent Technologies, Santa Clara, CA, USA). We pooled equivalent amounts of all RNA from fresh leaves, buds, female flowers, and male flowers.
To verify the polymorphism of EST-SSRs sequenced for subsequent population genetic studies, we extracted DNA from 88 leaf samples collected from 11 locations in 2013 from J. regia trees in natural populations and “populations” of cultivars (MT, GZ, BS, YC, and CL) in China (Table 1). Each sampled wild tree was an autochthonous, healthy adult from a mountain forest orin some cases from a roadside in a primary forest. All sampled trees were growing at least 1000 m from any orchard, cultivated land, or human dwelling. Sampled trees were separated by at least 50 m. “Populations” of cultivated trees were collected from farm land, villages, or near a house. Fresh leaves were collected and dried with silica gel. Genomic DNA was extracted following the methods of Doyle and Doyle [23] and Zhao and Woeste [24] and was resuspended in 50 μL of water, diluted to 10 ng/μL and then stored at −20 °C.

2.2. RNA-seq Library Preparation for Transcriptome Sequencing

RNA-seq libraries were generated using NEBNext Ultra™ RNA Library Prep Kit for Illumina (NEB, Beverly, MA, USA) following manufacturer’s recommendations, and index codes were added to attribute sequences to each sample. Briefly, mRNA was purified from 3 μg total RNA using poly-T oligo-attached magnetic beads. Remaining overhangs were converted into blunt ends via exonuclease/polymerase activities of DNA polymerase and RNase H. After adenylation of 3’ ends of DNA fragments, the NEBNext Adaptor with hairpin loop structure was ligated to prepare for hybridization. To enrich for 150–200 bp cDNA fragments, the library was first purified using the AMPure XP system (Beckman Coulter, Beverly, MA, USA). Afterward, 3 μL USER Enzyme (NEB, Beverly, MA, USA) was used with size-selected adaptor-ligated cDNA at 37 °C for 15 min followed by 5 min at 95 °C. Next, PCR was performed using the Phusion High-Fidelity DNA polymerase, universal PCR primers and an index primer. Finally, PCR products were purified (AMPure XP system) and library quality was assessed on the DNA high sensitivity chips using the Agilent Bioanalyzer 2100 system (Agilent, Santa Clara, UT, USA).

2.3. Transcriptome Assembling and Gene Annotation

Illumina HiSeq2000 sequencing was performed by Novogene Bioinformatics Technology Co., Ltd., Beijing, China [25]. De novo transcriptome assembly was accomplished using Trinity [26] with default parameters. The Blast2GO version 2.5 program [27] was first used to analyze GO annotation of the assembled unigenes. Afterwards, GO functional classifications of the unigenes were performed using the WEGO version 1.0 software [28]. Unigenes of the transcriptome were annotated based on data from the NCBI non-redundant protein sequences (Nr) database, and NCBI non-redundant nucleotide sequences (Nt) database, Clusters of Orthologous Group of proteins (KOG/COG) database, KEGG ortholog (KO) database, a manually annotated and reviewed protein sequence (Swiss-Prot protein) database, Gene Ontology (GO) database, and protein family (Pfam) database. The COGs protein database phylogenetically classifies the complete complement of protein sencoded in a genome. Each COG is a group of three or more proteins that are inferred to be orthologs. To further analyze the transcriptome of J. regia, all of the unigenes were submitted to the KEGG pathway database. The KEGG pathway database is a knowledge base for the systematic analysis of gene functions [29]. KOG, Nr, Nt, and SwissProt database used NCBI Blast version 2.2.28+ [27,30]. Afterwards, GO functional classifications of the unigenes were performed using the WEGO software [28]. All BLAST searches were performed with an e-value of 1e−5. Pfam protein domain prediction was performed using HMMER version 3 software [31]. GO annotations using Blast2GO version 2.5 were performed using the cutoff e-value of 1e−6 [27,32].

2.4. Discovery of EST-SSRs, Primer Design, Amplification Conditions, and Marker Validation

Microsatellites were identified using Micro Satellite identification tool (MISA) [33] and sequences with ≥5 uninterrupted motifs were randomly selected for primer design by Primer 3 [34]. For primer design, 77 unigenes were randomly selected from 16,699 sequences (unigenes) containing microsatellites that were not single nucleotide repeats. Primers were designed so that the predicted product size was 150–280 bp based on cDNA sequences and assuming no introns. Primer design parameters were set as follows: length range = 18–23 nucleotides with 21 as optimum, optimum annealing temperature = 55 °C and GC content 40%–60% with 50% as optimum. The PCR was programmed for 3 min at 94 °C followed by 35 cycles of 15 s at 93 °C, 1 min at annealing temperature (Tm) (Table 2), 30 s at 72 °C and extension for 10 min at 72 °C. PCR reactions contained 5 μL 2 × PCR Master Mix (Tiangen, Beijing, China) including 0.1 U Taq polymerase/μL; 500 µM each dNTP; 20 mM Tris-HCl (pH 8.3); 100 mM KCl; 3.0 mM MgCl2, 0.2 μM each primer (Shagon Biotech, Shanghai, China), 0.1 mg/mL bovine serum albumin, (Sigma, St. Louis, MO, USA, 1 ng/μL DNA, and 2.6 μL ddH2O to produce a total reaction volume of 10 μL. PCR amplification was carried out on a PTC-200 Thermal Cycler (MJ Research, Waltham, MA, USA) in 10 μL reaction volumes (5 μL 2 × PCR Master Mix, 0.2 μL each primer, 1 μL BSA, 1 μL of 10 ng/μL DNA). Genomic DNA from 88 samples of J. regia was used for PCR amplification and analysis of polymorphism. All 88 genotypes were tested at all 77 loci for polymorphisms. PCR products were resolved on 8% polyacrylamide gels and visualized by silver staining. Fragment sizes of each locus were estimated using Quantity One version 4.62 Software (Bio-Rad Laboratories, Drive Hercules, CA, USA) and compared to a 50 bp ladder size standard.

2.5. Population Genetics Data Analysis

Genetic diversity per locus and population were evaluated based on the following descriptive summary statistics: number of alleles (NA), observed (HO) and expected (HE) heterozygosity using the program GenAlEx version 6.5 [35]. GENEPOP version 4.2 [36] and Arlequin version 3.5 [37] were used to test the Hardy-Weinberg equilibrium (HWE) and linkage disequilibrium (LD) for all loci. The significance of deviations from HWE and extent of LD was assessed with 1500 permutations using the program GENEPOP version 4.2 [36]. The program CERVUS version 3.0 [38] was used to calculate polymorphic information content (PIC) and the program MICRO-CHECKER version 2.2.3 [39] was used to detect null alleles. Genetic differentiation among the five wild populations (FST) was tested using the program GENEPOP version 4.2 [36]. The significance of variation in the FST observed between the two populations was determined by permutation tests (10,000) using Arlequin version 3.5 [37]. The software STRUCTURE version 2.3.4 [40] was used to derive a most likely number of ancestral populations represented by the samples and to determine the probability of assignment for each sample. We assumed independent allele frequencies with a burn-in length of 100,000 iterations, program run length of 1,000,000 iterations, and ten replicates per run for K = 2–8 clusters with the admixture model [35]. The program STRUCTURE HARVESTER [41] was used to calculate the optimal value of K using the delta K criterion [41], the inferred clusters were drawn as colored box-plots using program DISTRUCT version 1.1 [42]. The overall pattern of genetic variation among cultivated and wild trees was determined by principal coordinates analysis (PCoA) using GenALEx version 6.5 [35]. The software IBD [43] was used to perform Mantel tests comparing matrices of geographic distance and genetic distance based on the isolation by distance web service (IBDWS) method [44]. The UPGMA (unweighted pair-group method with arithmetic averaging) analysis based on Nei’s genetic distance [45] was performed using GENEPOP version 4.2 [36].

2.6. Data Deposit

The transcriptome was submitted to the National Center for Biotechnology Information, the accession number was SRR3499221 for raw reads.

3. Results

3.1. Sequence Assembly

To increase the likelihood of recovering rare transcripts, to obtain a broad sample of the transcriptome, and to observe potential tissue-specific splice variants, we used normalized RNA pools from leaves, buds, female and male flowers for sequencing. A total of 4.98 G high quality reads were used to assemble the J. regia transcriptome de novo based on the expression of genes from four plant organs. The raw transcript data included 49,929,297 reads, 250,222 transcripts, and 117,229 unigenes. As a result, 250,222 transcripts were obtained with an average length of 503 bp (N90) and a N50 of 1955 bp. The length of the unigenes varied from 201 bp to 17,048 bp, with an average of 725 bp and N50 value of 1226 bp (Figure 1). Transcripts over 500 bp accounted for about 62.4% of the total (Figure S1).

3.2. Gene Annotation of J. regia Transcriptomes

In total, 45,029 of 117, 229 unigenes were annotated to 55 functional sub-categories distributed under three main categories including biological process, cellular component, and molecular function (Figure 2). Nine functional sub-categories included few unigenes (Figure 2b). Within the biological process category, “cellular process” and “metabolic process” were the top two GO classes among 19 sub-categories (Figure 2a) while the smallest sub-categories were “growth”, “rhythmic process”, and “cell death” (Figure 2b). Within the cellular component category, “cell”, “cell part”, and “organelle” were the most common among the 19 sub-categories (Figure 3a; five categories shown in Figure 2b); “synapse part” and “synapse” were among the least represented. Within the molecular function category, the most highly represented sub-categories were “binding” and “catalytic activity” (Figure 2a), whereas the least represented were “receptor regulator activity” and “metallochaperone activity” (Figure 2b).

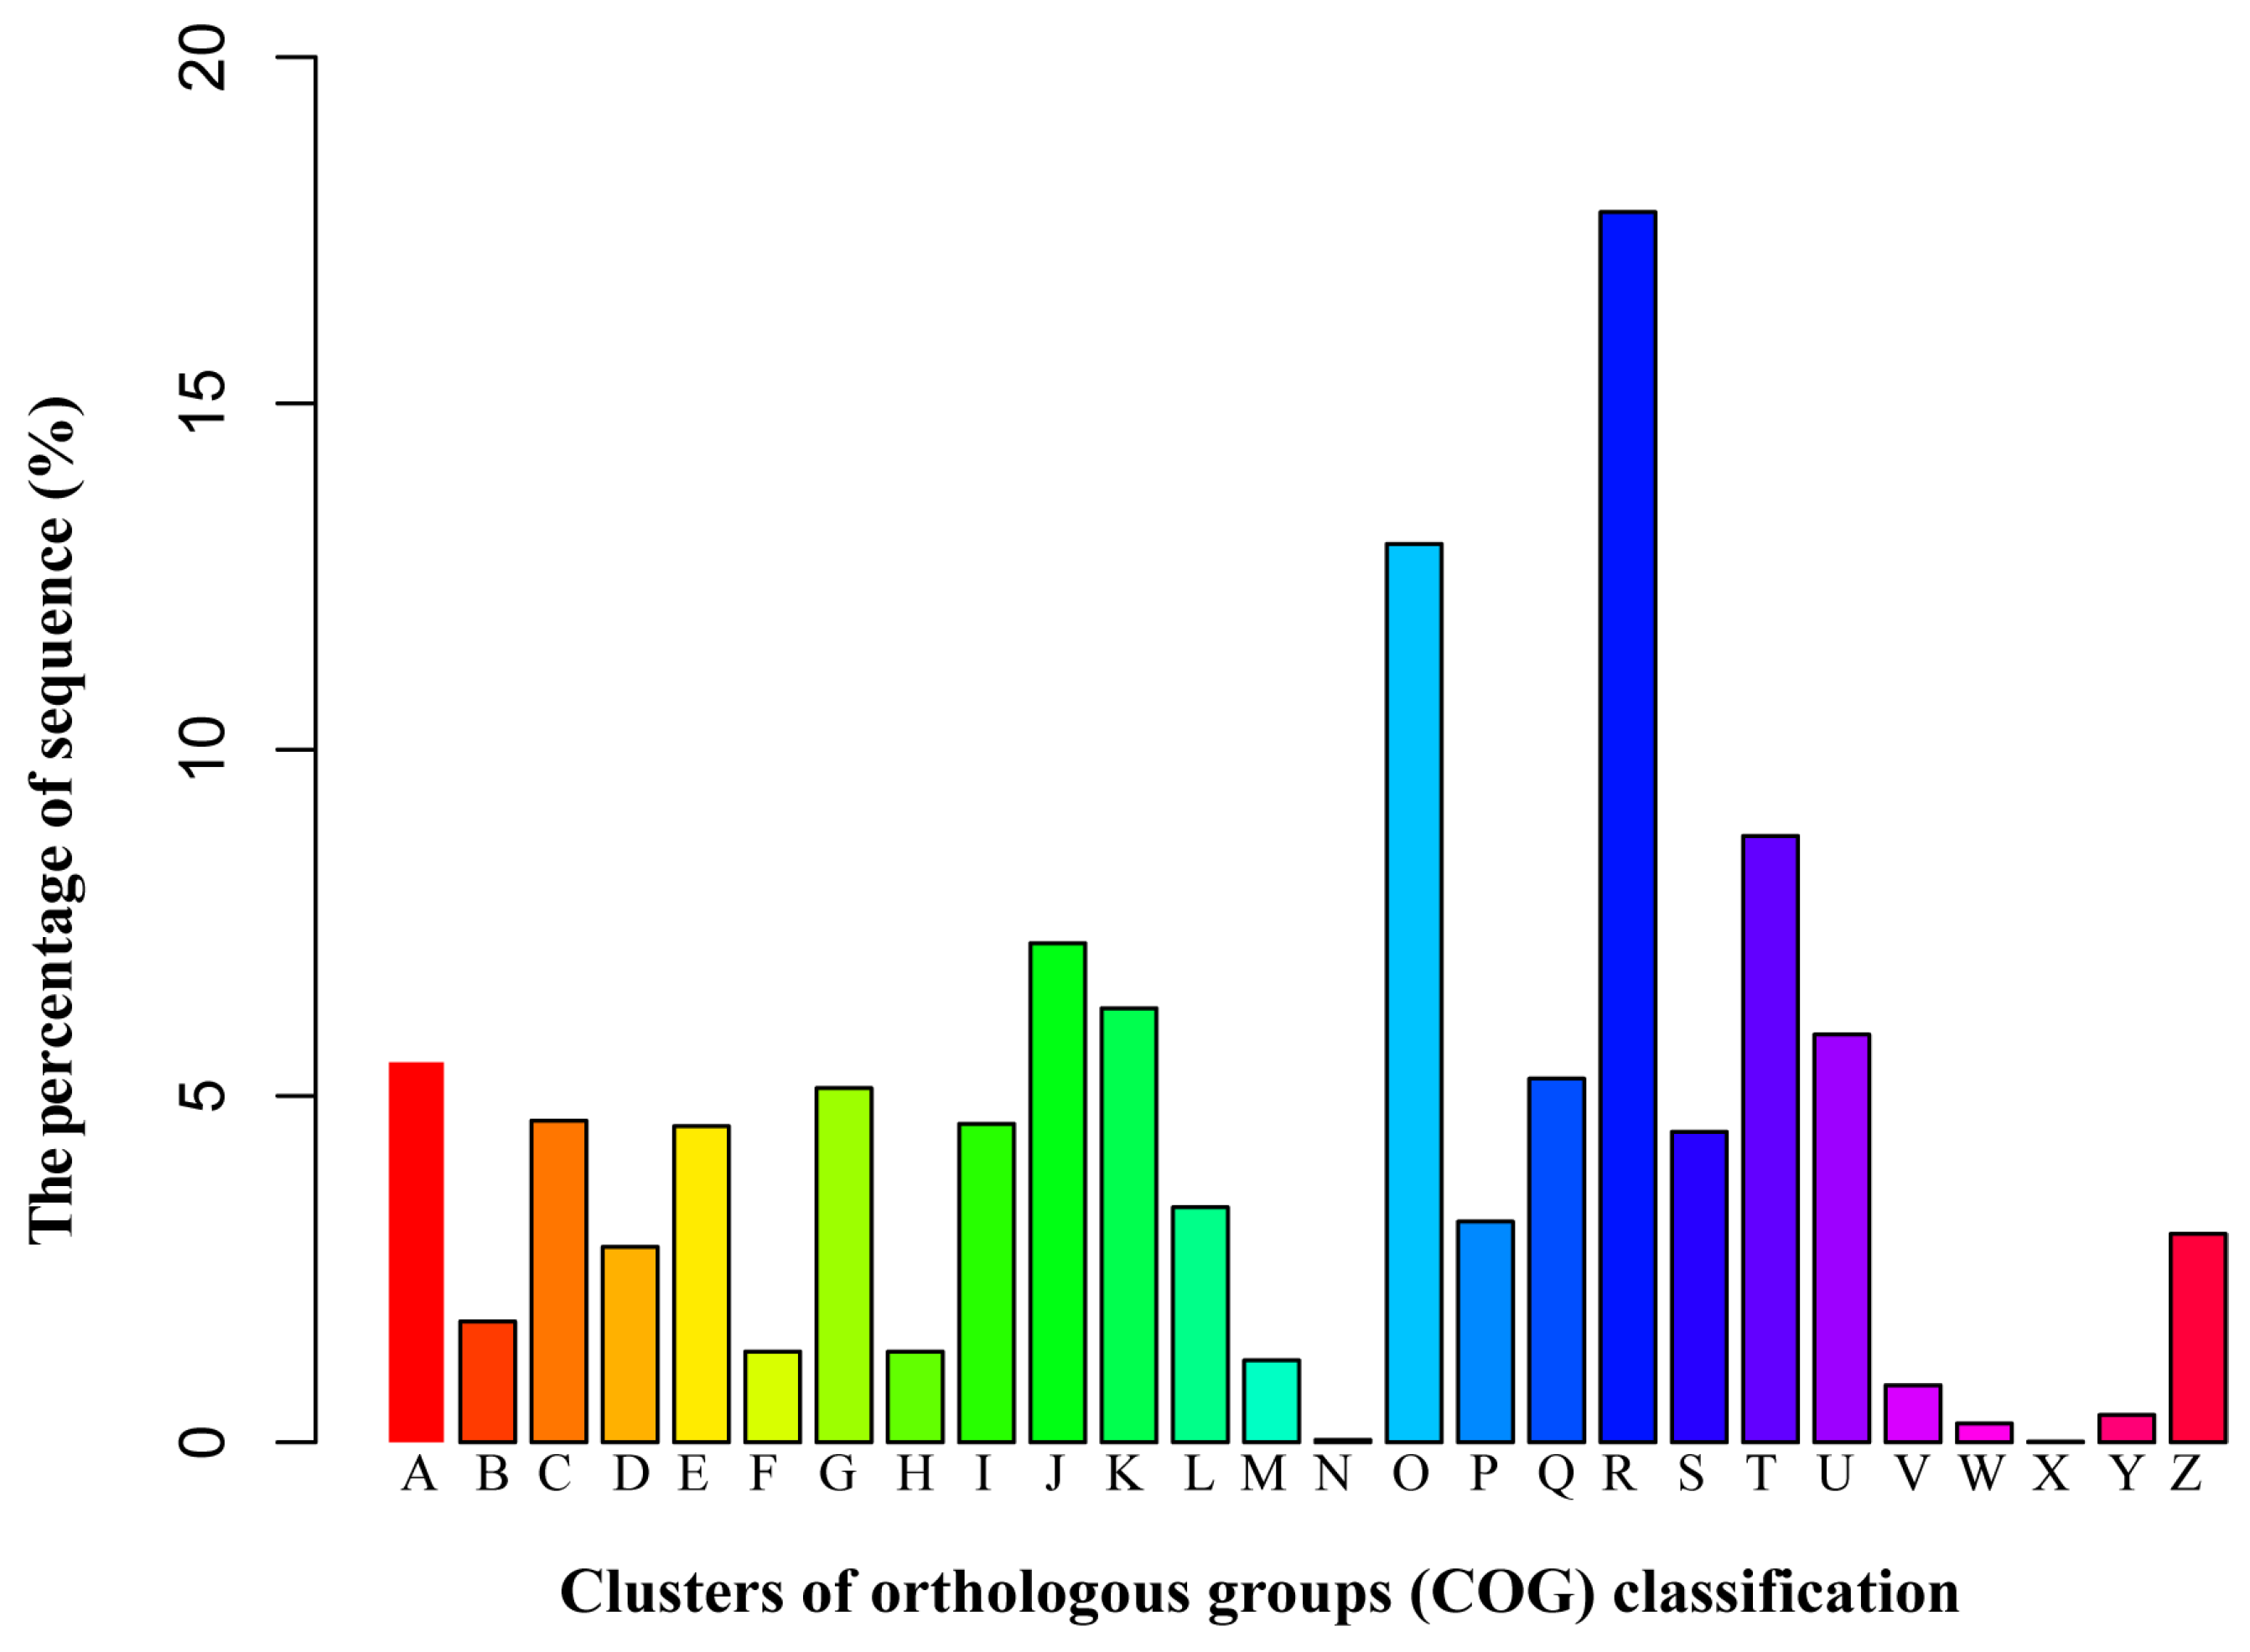
3.3. Functional Classification by the Orthologous Groups (COG)

All unigenes were aligned to the COG database to predict and classify possible functions. Out of 27,435 Nr hits, 11,983 sequences were assigned to COG classifications (Figure 3). Among the 26 COG categories, the cluster for general function (3432; 17.0%) represented the largest group, followed by transcription (1789; 8.9%), replication, recombination and repair (1665; 8.3%). Post-translational modification, protein turnover and chaperones (1577; 7.8%), signal transduction mechanisms (1487; 7.4%), carbohydrate transport and metabolism (1200; 6.0%) and translation, ribosomal structure and biogenesis (1161; 5.8%) were the largest sub-categories, whereas, only a few unigenes were assigned to nuclear structure and extracellular structure. In addition, 619 unigenes were assigned to secondary metabolite biosynthesis, transport, and catabolism (Figure 3).

3.4. Functional Classification by the KEGG Pathway

To further analyze the transcriptome of J. regia, all of the unigenes were analyzed in the KEGG pathway database. The KEGG pathway database is a knowledge-based site for the systematic analysis of gene functions in terms of networks of genes and molecules in cells and their variants specific to particular organisms. In total, 19,526 of 117,229 unigenes had significant matches in the database were assigned to 32 KEGG pathways in five main categories (Figure 4). Among these five main categories, translation was the largest (1738; 8.9%), followed by carbohydrate metabolism (1660; 8.5%), signal transduction (1434; 7.3%), folding, sorting and degradation (1402; 7.2%), and overview (1134; 5.8%) (Figure 4).

3.5. Distribution of the SSRs in Transcriptomes, SSR Primer Screening and Verification

In total, 26,088 unigenes contained SSRs, which represented 22.3% of all unigenes from the four organ types from which we extracted RNA. The EST-SSRs were present at a density of 141.97 per Mb. The number of sequences containing more than one SSR was 4148 (18.5%) and the number of SSRs that included multiple motifs was 1497 (6.7%). The most abundant type of repeat motif was mononucleotide (50.2%), followed by dinucleotide (35.8%), trinucleotide (12.1%), tetranucleotide (8.3%), hexanucleotide (0.1%), and pentanucleotide (0.1%) repeats (Figure 2a; Supplemental Table S1). SSRs (not including mononucleotide repeat SSRs) with six tandem repeats (2058; 24.7%) were the most common, followed by seven tandem repeats (2316; 16.9%), nine tandem repeats (2188; 16.0%), five tandem repeats (2058; 15.0%), eight tandem repeats (1928; 14.0%), and ten tandem repeats (1530; 11.1%) (Figure 2b; Table S1). The dominant repeat motif in EST-SSRs was AG/CT (7929; 57.7%), followed by AT/AT (1315; 9.6%), AAG/CCT (1046; 7.6%), AC/GT (785; 5.7%), and AGG/CCT (441; 3.2%). Very few (three; 0.04%) CG/CG repeats were identified (Figure 2c; Table S2).
We designed 13,947 pairs of SSR primers from 27,584 SSR sequences (Table S3). In order to verify the design of primers and to determine how many of the 13,947 SSR-containing unigenes could be amplified as scorable SSR markers, primers were designed to amplify a sample of 77 representative SSR-containing unigenes (Table S4). These 77 unigenes were chosen to include mono-nucleotide, dinucleotide, trinucleotide, tetranucleotide, pentanucleotide, and hexanucleotide repeats (Table 2; Figure 5d; Table S4). Of these 77 EST-SSRs, 39 were amplified bands with high specificity from walnut DNA (Table 2; Figure S2). Using the NCBI nucleotide database BLAST, we found that 23 of the 39 sequences matched previously submitted sequences with high similarity (e-value = 0). These 23 sequences were associated with a wide variety of functional genes: 17 of 23 (73.9%) were linked to disease-resistance, insect and pest resistance, or immunity, two were related to metabolism (JR2018 and JR3608), JR2600 was associated with salt tolerance, and JR6714 was associated with environment stress (Table S4). The remaining 39 of 77 primer pairs were excluded from further analysis due to lack of specificity or weak amplification. All 39 EST-SSRs that amplified specific products were also polymorphic (Figure S2) when used to analyze DNA from 88 Persian walnuts in 11 Chinese populations (Table 2, for sequences, see Table S5). Alleles per locus (NA) ranged from two to seven with a mean of 3.64. Using MICRO-CHECKER 2.2.3 (Van et al.; 2004), we did not detect null alleles at any locus. The observed heterozygosity (HO) and expected heterozygosity (HE) varied from 0.016 to 0.929 ( χ ¯ = 0.404) and from 0.052 to 0.715 ( χ ¯ = 0.491), respectively. Polymorphic information content (PIC) ranged from 0.150 to 0.695, with a mean of 0.433. Loci that showed significant departure from Hardy-Weinberg equilibrium (HWE) were JR0082; JR1739; JR2465; JR2600; JR3434; JR4616; JR6226; JR6439; JR6742; JR6926; JR7171; JR7363; JR7544; JR8815 (Table 2). Annotations of these loci were shown in Table S4.

3.6. Assessment of Genetic Diversity and Population Structure of J. regia in China Using 39 EST-SSRs

Analysis using STRUCTURE software revealed that the J. regia trees we sampled from 11 sites represented five populations. Using ΔK as the criterion, K = 5 showed the highest likelihood (Figure 6). Samples from two sites in southern China, GZ (cultivar) and YW (wild), comprised cluster I (green color block). Cluster II (blue color block) was comprised of wild population SC (Sichuan province) and some members sampled at (wild) site YW. Samples from three (wild) sites located in western and northwestern China comprised cluster III (yellow color block), XZ (Tibet), GS (Gansu province), and XJ (Sinkiang). Cultivated trees from two locations (MT and LS) comprised cluster IV (red color block of Figure 6). Cluster V (purple color group) was comprised of cultivated trees sampled from three locations (BS, CL, and YC) (Figure 6).
The first two coordinates in the principal coordinate analyses (PCoA) (Supplemental Figure S3, accounted for 80.8% of the observed variance). PCoA partitioned the samples into groups similar to those identified by the Bayesian software STRUCTURE (Figure 6; Figure S3). Based on PCoA, samples from the 11 sampled locations were divided into four groups: LS and MT as a group, BS, YC, and CL as a group, XZ, XJ, and GS as a group, and unlike the results from the Bayesian analysis, SC was assigned to a group with GZ and YW (Figure S3).

4. Discussion

Transcriptome sequencing is an effective method to obtain EST sequences [46] for developing molecular markers and identifying novel genes. Transcriptome sequencing also provides raw data for data mining studies, including the identification of SSRs [9,12,47]. The transcriptome data we generated included over 26,000 sequences that contained SSRs, so 22.3% of all unigenes contained a microsatellite. Excluding mononucleotide repeats, dinucleotide repeats were the most frequent SSR motif type (35.8%), consistent with results previously reported for J. regia, cabbage (Brassica oleracea L. var. capitata L.), sweet potato (Ipomoea batatas L.), and white poplar (Populus tomentosa Carr.) [9,13,14,48,49], but different from coconut tree (Cocos nucifera L.), field pea (Pisum sativum L.) and fava bean (Vicia faba L.), species in which tri-nucleotides were the most abundant EST-SSR markers [14,49,50].
It is well-known that EST-SSR markers are useful for the assessment of genetic diversity, the development of genetic maps, comparative genomics, and marker assisted selection in J. regia [51,52], and because EST-SSRs often have conserved primer sites, they are usually readily transferable to closely related species [53,54]. EST-SSRs typically amplify more successfully than non-genic SSRs, and because they reside in genes, they are expected to reflect artificial and natural selection [11], but whether EST-SSRs are more sensitive than allozymes to selection is not certain [51]. We designed primers and tested amplification for 77 unigenes containing SSRs. A total of 39 amplified with high specificity; of these, 23 (~68%) were polymorphic and highly similar to sequences previously submitted to NCBI (e-value = 0) (Supplemental Table S4). BLAST searches showed 30 of 77 unigenes (42.85%) had no significant match to known proteins. Many of the ESTs may indeed have been non-coding transcribed regions, which could explain the large number of unigenes that contained SSRs. Some shorter sequences from our transcriptome data that contained SSRs may have lacked a characterized protein domain, or may have contained a known protein domain but did not show a BLAST match because the query sequence was too short, resulting in a false-negative search result. The polymorphism information content (PIC) values of the EST-SSR markers ranged from 0.390 to 0.870 (mean = 0.681 ± 0.18), similar to PIC values reported by Zhang et al. [54], which ranged from 0.47 to 0.88. The number of polymorphic alleles ranged from 3 to 10, with a mean of 5.87; the number of alleles reported by Zhang et al. [54] was 2–4, and 2–25 in Zhang et al. [9].
Based on data from 39 EST-SSRs, STRUTURE, PCoA, and UPGMA produced similar genetic clusters of common walnut samples (Figure 6; Figure S3).The PCoA analysis pooled the blue (SC) and green (GZ and YW) populations that STRUCTURE separated (Figure 6; Figure S3). It is possible that YW represents admixture between SC and GZ, but the details of population structure in this region of China will require additional sampling.
Despite their importance, relatively little is known about the genetic diversity and structure of wild populations of common walnut in China. Most studies of J. regia in China have focused on cultivar development [55], and the ancient history of the crop [3]. The genetic diversity of common walnut cultivars and seedlings used for breeding in China was described as rich and complex [56,57]. In the Qinling Mountains of central China, the genetic variation of J. regia was mainly within populations, with low genetic differentiation among sampled sites based on ITS (internal transcribed spacer) sequences [58].
In our study, genetically similar Persian walnut samples (based on EST-SSR genotypes) were geographically clustered with the exception of sample locations BS, CL, and YC, which comprised STRUCTURE group V (Figure 6, Supplemental Figure S3). This result corresponded with a previous study of the genetic diversity and structure of nine common walnut populations in central and southwestern China that showed their genetic structure was in agreement with their geographic distribution [59]. The non-geographically clustered genotypic group V (mentioned above) was comprised of cultivated trees, likely reflecting propagation by humans of types selected for commercial and horticultural properties [60,61,62].
The pattern of genetic diversity and structure we observed for common walnut in China is probably a consequence of a complex interaction of evolutionary forces such as adaptation/ecotype differentiation and human dispersal. Because J. regia is an important cultivated species and wild trees are not isolated from cultivated trees, gene flow between wild and cultivated populations is likely high. Cultivated walnuts have been moved over long distances for several millennia [3]; the resulting interactions between cultivated genotypes and wild trees presumably reduces genetic differentiation locally and on larger scales as well. Samples from cold and arid regions of China were genetically distinct (XJ, XZ, and GS), more likely reflecting adaptation than isolation because our analysis of isolation by distance (IBD) showed that the correlations between genetic distance and geographic distance were not significant.

5. Conclusions

This study provides the comprehensive, Illumina-based transcriptome sequence data used for the development of EST-SSRs in common walnut (J. regia). We generated more than 49.9 million paired-end reads comprising 117,229 unigenes with an average length of 725 bp from four different tissues of a single individual using de novo assembly. We identified 27,584 unigenes with SSR motifs as potential molecular markers. We tested 77 primer pairs in detail and found that 39 were polymorphic. These were used to screen 88 common walnut individuals collected from 11 populations. Our results further demonstrated that there is high allelic variation in Chinese J. regia. The transcriptome and markers we characterized provide additional tools for research on population genetics, evolutionary ecology, and breeding of Juglans, Juglandaceae, and other non-model species.

Supplementary Materials

The following are available online at www.mdpi.com/1999-4907/7/10/247/s1. Figure S1: Length distribution of assembled transcripts and unigenes, Figure S2: PCR products and polymorphic characteristics of three EST-SSR markers across 48 Juglans regia samples, Figure S3: Principal coordinate analyses (PCoA) of 11 Chinese Persian walnut (Juglans regia) populations resolved into four genotype groups based on 39 microsatellite loci, Figure S4: Bayesian inference of the number of clusters (K), Table S1: The EST-SSR frequency type of Juglans regia, Table S2: The number of repeat motif in EST-SSRs, Table S3: The total of 13,947 pairs of SSR primers for Juglans regia, Table S4: BLAST search results for 77 SSR-containing ESTs from a pool of RNA from four walnut tissues, Table S5: Sequences for 39 microsatellite loci of Juglans regia.

Acknowledgments

The authors wish to thank Jia Yang, Li Feng, Hailong Xia, Qiang Zhang, and Tao Zhou for sample collection. Mention of a trademark, proprietary product, or vendor does not constitute a guarantee or warranty of the product by the U.S. Department of Agriculture and does not imply its approval to the exclusion of other products or vendors that also may be suitable. This work was supported by the National Natural Science Foundation of China (Grant No. 31200500; Grant No. 41471038; Grant No. J1210063), Changjiang Scholars and Innovative Research Team in University (No. IRT1174), the Program for Excellent Young Academic Backbones funding by Northwest University (Grant No. 338050070), and the Northwest University Training Programs of Innovation and Entrepreneurship for Undergraduates (Grant No. 2015159 and Grand No. 2016171).

Author Contributions

Conceived and designed the experiments: Peng Zhao, Keith E. Woeste; Performed the experiments: Peng Zhao, Meng Dang, Tian Zhang, Yiheng Hu, Huijuan Zhou; Analyzed the data: Peng Zhao, Tian Zhang, Keith E. Woeste, Meng Dang, Huijuan Zhou, Yiheng Hu; Contributed materials/analysistools: Peng Zhao, Keith E. Woeste; Wrote the paper: Peng Zhao, Keith E. Woeste, Meng Dang, Tian Zhang, Huijuan Zhou.

Conflicts of Interest

The authors declare no conflict of interest.

References

  1. Woeste, K.; Michler, C. Genomic and breeding resources. In Wild Crop Relatives; Chittaranjan, K., Ed.; Springer: Berlin/Heidelberg, Germany, 2011. [Google Scholar]
  2. Kodad, O.; Sindic, M. Kernel quality in a local walnut (Juglans regia) population grown under different ecological conditions in Morocco. Nucis Newsl. 2014, 16, 27–31. [Google Scholar]
  3. Pollegioni, P.; Woeste, K.E.; Chiocchini, F.; Del Lungo, S.; Olimpieri, I.; Tortolano, V.; Clark, J.; Hemery, E.G.; Mapelli, S.; Malvolti, M.E. Ancient humans influenced the current spatial genetic structure of common walnut populations in Asia. PLoS ONE 2015, 10, e0135980. [Google Scholar] [CrossRef] [PubMed]
  4. Martínez, M.L.; Labuckas, D.O.; Lamarque, A.L.; Maestri, D.M. Walnut (Juglans regia L.): Genetic resources, chemistry, by-products. J. Sci. Food Agric. 2010, 90, 1959–1967. [Google Scholar] [CrossRef] [PubMed]
  5. Rorabaugh, J.M.; Singh, A.P.; Sherrell, I.M.; Freeman, M.R.; Vorsa, N.; Fitschen, P.; Malone, C.; Maher, M.A.; Wilson, T. English and Black Walnut phenolic antioxidant activity in vitro and following human nut consumption. Food Nutr. Sci. 2011, 2, 193–200. [Google Scholar] [CrossRef]
  6. Vinson, J.A.; Cai, Y. Nuts, especially walnuts, have both antioxidant quantity and efficacy and exhibit significant potential health benefits. Food Funct. 2012, 3, 134–140. [Google Scholar] [CrossRef] [PubMed]
  7. Food and Agriculture Organisation; FAOSTAT Data; FAO: Rome, Italy, 2008.
  8. Topçu, H.; Ikhsan, A.S.; Sütyemez, M.; Çoban, N.; Güney, M.; Kafkas, S. Development of 185 polymorphic simple sequence repeat (SSR) markers from walnut (Juglans regia L.). Sci. Hortic. 2015, 194, 160–167. [Google Scholar] [CrossRef]
  9. Zhang, R.; Zhu, A.; Wang, X.; Yu, J.; Zhang, H.; Gao, J.; Deng, X. Development of Juglans regia SSR markers by data mining of the EST database. Plant Mol. Biol. Rep. 2010, 28, 646–653. [Google Scholar] [CrossRef]
  10. Wei, W.; Qi, X.; Wang, L.; Zhang, Y.; Hua, W.; Li, D.; Lv, H.; Zhang, X. Characterization of the sesame (Sesamum indicum L.) global transcriptome using Illumina paired-end sequencing and development of EST-SSR markers. BMC Genom. 2011, 12, 451. [Google Scholar] [CrossRef] [PubMed]
  11. Varshney, R.K.; Sigmund, R.; Börner, A.; Korzun, V.; Stein, N.; Sorrells, M.E.; Langridge, P.; Graner, A. Interspecific transferability and comparative mapping of barley EST-SSR markers in wheat, rye and rice. Plant Sci. 2005, 168, 195–202. [Google Scholar] [CrossRef]
  12. Zhang, Z.Y.; Han, J.W.; Jin, Q.; Wang, Y.; Pang, X.M.; Li, Y.Y. Development and characterization of new microsatellites for walnut (Juglans regia). Genet. Mol. Res. 2013, 12, 4723–4734. [Google Scholar] [CrossRef] [PubMed]
  13. Kaur, S.; Pembleton, L.W.; Cogan, N.O.; Savin, K.W.; Leonforte, T.; Paull, J.; Materne, M.; Forster, J.W. Transcriptome sequencing of field pea and faba bean for discovery and validation of SSR genetic markers. BMC Genom. 2012, 13, 104. [Google Scholar] [CrossRef] [PubMed]
  14. Izzah, N.K.; Lee, J.; Jayakodi, M.; Perumal, S.; Jin, M.; Park, B.S.; Ahn, K.; Yang, T.J. Transcriptome sequencing of two parental lines of cabbage (Brassica oleracea L. var. capitata L.) and construction of an EST-based genetic map. BMC Genom. 2014, 15, 149. [Google Scholar] [CrossRef] [PubMed]
  15. Yates, S.A.; Swain, M.T.; Hegarty, M.J.; Chernukin, I.; Lowe, M.; Allison, G.G.; Skøt, L. De novo assembly of red clover transcriptome based on RNA–Seq data provides insight into drought response, gene discovery and marker identification. BMC Genom. 2014, 15, 453. [Google Scholar] [CrossRef] [PubMed] [Green Version]
  16. Liu, M.; Qiao, G.; Jiang, J.; Yang, H.; Xie, L.; Xie, J.; Zhuo, R. Transcriptome sequencing and de novo analysis for ma bamboo (Dendrocalamus latiflorus Munro) using the Illumina platform. PLoS ONE 2012, 7, e46766. [Google Scholar] [CrossRef] [PubMed]
  17. Chakrabarti, M.; Dinkins, R.D.; Hunt, A.G. De novo transcriptome assembly and dynamic spatial gene expression analysis in red clover. Plant Gen. 2016, 9. [Google Scholar] [CrossRef]
  18. Wang, X.W.; Luan, J.B.; Li, J.M.; Bao, Y.Y.; Zhang, C.X.; Liu, S.S. De novo characterization of a whitefly transcriptome and analysis of its gene expression during development. BMC Genom. 2010, 11, 400. [Google Scholar] [CrossRef] [PubMed]
  19. Tai, Y.; Wei, C.; Yang, H.; Zhang, L.; Chen, Q.; Deng, W.; Zhang, J.; Fang, C.; Ho, C.; Wan, X. Transcriptomic and phytochemical analysis of the biosynthesis of characteristic constituents in tea (Camellia sinensis) compared with oil tea (Camellia oleifera). BMC Plant Biol. 2015, 15, 190. [Google Scholar] [CrossRef] [PubMed]
  20. Dang, M.; Liu, Z.X.; Chen, X.; Zhang, T.; Zhou, H.J.; Hu, Y.H.; Zhao, P. Identification, development, and application of 12 polymorphic EST-SSR markers for an endemic Chinese walnut (Juglans cathayensis L.) using next-generation sequencing technology. Biochem. Syst. Ecol. 2015, 60, 74–80. [Google Scholar] [CrossRef]
  21. Jiang, Q.; Wang, F.; Tan, H.W.; Li, M.Y.; Xu, Z.S.; Tan, G.F.; Xiong, A.S. De novo transcriptome assembly, gene annotation, marker development, and miRNA potential target genes validation under abiotic stresses in Oenanthe javanica. Mol. Genet. Genom. 2015, 290, 671–683. [Google Scholar] [CrossRef] [PubMed]
  22. Hu, Z.; Zhang, T.; Gao, X.X.; Wang, Y.; Zhang, Q.; Zhou, H.J.; Zhao, G.F.; Wang, M.L.; Zhao, P. De novo assembly and characterization of the leaf, bud, and fruit transcriptome from the vulnerable tree Juglans mandshurica for the development of 20 new microsatellite markers using Illumina sequencing. Mol. Genet. Genom. 2016, 291, 849–862. [Google Scholar] [CrossRef] [PubMed]
  23. Doyle, J.; Doyle, J.L. Genomic plant DNA preparation from fresh tissue-CTAB method. Phytochem. Bull. 1987, 19, 11–15. [Google Scholar]
  24. Zhao, P.; Woeste, K.E. DNA markers identify hybrids between butternut (Juglans cinerea L.) and Japanese walnut (Juglans ailantifolia Carr.). Tree Genet. Genomes 2011, 7, 511–533. [Google Scholar] [CrossRef]
  25. Novogene Bioinformatics Technology Co. Available online: http://www.novogene.cn (accessed on 28 August 2016).
  26. Grabherr, M.G.; Haas, B.J.; Yassour, M.; Levin, J.Z.; Thompson, D.A.; Amit, I.; Chen, Z. Full-length transcriptome assembly from RNA-Seq data without a reference genome. Nat. Biotechnol. 2011, 29, 644–652. [Google Scholar] [CrossRef] [PubMed]
  27. Conesa, A.; Götz, S.; García-Gómez, J.M.; Terol, J.; Talón, M.; Robles, M. Blast2GO: A universal tool for annotation, visualization and analysis in functional genomics research. Bioinformatics 2005, 21, 3674–3676. [Google Scholar] [CrossRef] [PubMed]
  28. Ye, J.; Fang, L.; Zheng, H.; Zhang, Y.; Chen, J.; Zhang, Z.; Wang, J. WEGO: A web tool for plotting GO annotations. Nucleic. Acids. Res. 2006, 34, W293–W297. [Google Scholar] [CrossRef] [PubMed]
  29. Long, Y.; Zhang, J.; Tian, X.; Wu, S.; Zhang, Q.; Zhang, J.; Dang, Z.; Pei, X.W. De novo assembly of the desert tree Haloxylon ammodendron (C. A. Mey.) based on RNA-Seq data provides insight into drought response, gene discovery and marker identification. BMC Genom. 2014, 15, 1111. [Google Scholar] [CrossRef] [PubMed]
  30. Boeckmann, B.; Bairoch, A.; Apweiler, R.; Blatter, M.C.; Estreicher, A.; Gasteiger, E.; Martin, M.J.; Michoud, K.O.; Donovan, C.; Phan, I.; et al. The SWISSPROT protein knowledgebase and its supplement TrEMBL. Nucleic Acids Res. 2003, 31, 365–370. [Google Scholar] [CrossRef] [PubMed]
  31. Finn, R.D.; Clements, J.; Eddy, S.R. HMMER web server: Interactive sequence similarity searching. Nucleic Acids Res. 2011, 39, 29–37. [Google Scholar] [CrossRef] [PubMed]
  32. Götz, S.; García-Gómez, J.M.; Terol, J.; Williams, T.D.; Nagaraj, S.H.; Nueda, M.J.; Robles, M.; Talón, M.; Dopazo, J.; Conesa, A. High-through put functional annotation and data mining with the Blast2GO suite. Nucleic Acids Res. 2008, 36, 3420–3435. [Google Scholar]
  33. Thiel, T.; Michalek, W.; Varshney, R.K.; Graner, A. Exploiting EST databases for the development and characterization of gene-derived SSR-markers in barley (Hordeum vulgare L.). Theor. Appl. Genet. 2013, 106, 411–422. [Google Scholar]
  34. Rozen, S.; Skaletsky, H.J. Primer3. Code. 1998. Available online: http://www-genome.wi.mit.edu/genome_software/other/primer3.html (accessed on 28 August 2016).
  35. Peakall, R.O.D.; Smouse, P.E. GenAlEx 6.5: Genetic analysis in Excel. Population genetic software for teaching and research—An update. Bioinformatics 2012, 28, 2537–2539. [Google Scholar] [CrossRef] [PubMed]
  36. Raymond, M.; Rousset, F. GENEPOP (version 1.2): Population genetics software for exact tests and ecumenicism. J. Hered. 1995, 86, 248–249. [Google Scholar]
  37. Excoffier, L.; Lischer, H.E. Arlequin suite ver 3.5: A new series of programs to perform population genetics analyses under Linux and Windows. Mol. Ecol. Resour. 2010, 10, 564–567. [Google Scholar] [CrossRef] [PubMed]
  38. Kalinowski, S.T.; Taper, M.L.; Marshall, T.C. Revising how the computer program CERVUS accommodates genotyping error increases success in paternity assignment. Mol. Ecol. 2007, 16, 1099–1106. [Google Scholar] [CrossRef] [PubMed]
  39. Van Oosterhout, C.; Hutchinson, W.F.; Wills, D.P.; Shipley, P. MICRO-CHECKER: Software for identifying and correcting genotyping errors in microsatellite data. Mol. Ecol. Notes 2004, 4, 535–538. [Google Scholar] [CrossRef]
  40. Evanno, G.; Regnaut, S.; Goudet, J. Detecting the number of clusters of individuals using the software STRUCTURE: A simulation study. Mol. Ecol. 2005, 14, 2611–2620. [Google Scholar] [CrossRef] [PubMed]
  41. Earl, D.A. STRUCTURE HARVESTER: A website and program for visualizing STRUCTURE output and implementing the Evanno method. Conserv. Genet. Resour. 2012, 4, 359–361. [Google Scholar] [CrossRef]
  42. Rosenberg, N.A. DISTRUCT: A program for the graphical display of population structure. Mol. Ecol. Notes 2004, 4, 137–138. [Google Scholar] [CrossRef]
  43. Bohonak, A.J. IBD (isolation by distance): A program for analyses of isolation by distance. J. Hered. 2002, 93, 153–154. [Google Scholar] [CrossRef] [PubMed]
  44. Jensen, J.L.; Bohonak, A.J.; Kelley, S.T. Isolation by distance, web service. BMC Genet. 2005, 6, 13. [Google Scholar] [CrossRef] [PubMed]
  45. Nei, M. Molecular Evolutionary Genetics; Columbia University Press: New York, NY, USA, 1987. [Google Scholar]
  46. Li, D.; Deng, Z.; Qin, B.; Liu, X.; Men, Z. De novo assembly and characterization of bark transcriptome using Illumina sequencing and development of EST-SSR markers in rubber tree (Hevea brasiliensis Muell. Arg.). BMC Genom. 2012, 13, 192. [Google Scholar] [CrossRef] [PubMed]
  47. Najafi, F.; Mardi, M.; Fakheri, B.; Pirseyedi, S.M.; Mehdinejad, N.; Farsi, M. Isolation and characterization of novel microsatellite markers in walnut (Juglans regia L.). Am. J. Plant Sci. 2014, 5, 409. [Google Scholar] [CrossRef]
  48. Du, Q.; Gong, C.; Pan, W.; Zhang, D. Development and application of microsatellites in candidate genes related to wood properties in the Chinese white poplar (Populus tomentosa Carr.). DNA Res. 2012, 20, 31–44. [Google Scholar] [CrossRef] [PubMed]
  49. Xia, W.; Xiao, Y.; Liu, Z.; Luo, Y.; Mason, A.S.; Fan, H.; Yang, Y.; Zhao, S.; Peng, M. Development of gene-based simple sequence repeat markers for association analysis in Cocos nucifera. Mol. Breed. 2014, 34, 525–535. [Google Scholar] [CrossRef]
  50. Hou, X.J.; Liu, S.R.; Khan, M.R.G.; Hu, C.G.; Zhang, J.Z. Genome-wide identification, classification expression profiling and SSR marker development of the MADS-box gene family in Citrus. Plant Mol. Biol. Rep. 2014, 32, 28–41. [Google Scholar] [CrossRef]
  51. Ellis, J.R.; Burke, J.M. EST-SSRs as a resource for population genetic analyses. Heredity 2007, 99, 125–132. [Google Scholar] [CrossRef] [PubMed]
  52. Bodénès, C.; Chancerel, E.; Gailing, O.; Vendramin, G.G.; Bagnoli, F.; Durand, J.; Goicoechea, P.G.; Villani, F.; Mattioni, C.; Koelewijn, H.P.; et al. Comparative mapping in the Fagaceae and beyond with EST-SSRs. BMC Plant Biol. 2012, 12, 153. [Google Scholar] [CrossRef] [PubMed]
  53. Barbara, T.; Palma-Silva, C.; Paggi, G.M.; Bered, F.; Fay, M.F.; Lexer, C. Cross-species transfer of nuclear microsatellite markers: Potential and limitations. Mol. Ecol. 2007, 16, 3759–3767. [Google Scholar] [CrossRef] [PubMed]
  54. Zhang, M.Y.; Fan, L.; Liu, Q.Z.; Song, Y.; Wei, S.W.; Zhang, S.L.; Wu, J. A novel set of EST-derived SSR markers for pear and cross-species transferability in Rosaceae. Plant Mol. Biol. Rep. 2014, 32, 290–302. [Google Scholar] [CrossRef]
  55. Chen, L.; Ma, Q.; Chen, Y.; Wang, B.; Pei, D. Identification of major walnut cultivars grown in China based on nut phenotypes and SSR markers. Sci. Hortic. 2014, 168, 240–248. [Google Scholar] [CrossRef]
  56. Li, G.T.; Ai, C.X.; Zhang, L.S.; Wei, H.R.; Liu, Q.Z. ISSR analysis of genetic diversity among seedling walnut (Juglans spp.) populations. J. Plant Genet. Resour. 2011, 12, 640–645. (In Chinese) [Google Scholar]
  57. Ning, D.; Ma, Q.; Zhang, Y.; Wang, H.; Liu, B.; Pei, D. FISH-AFLP analysis of genetic diversity on walnut cultivars in Yunnan Province. For. Res. 2011, 24, 189–193. (In Chinese) [Google Scholar]
  58. Hu, Y.H.; Dang, M.; Zhang, T.; Luo, G.C.; Xia, H.L.; Zhou, H.J.; Hu, D.F.; He, L.; Ma, Z.H.; Zhao, P. Genetic diversity and evolutionary relationship of Juglans regia Wild and domesticated populations in Qinling Mountains based on nrDNA ITS sequences. Scientia Silvae Sinicae 2014, 50, 47–55. (In Chinese) [Google Scholar]
  59. Wang, H.; Pei, D.; Gu, R.S.; Wang, B.Q. Genetic diversity and structure of walnut populations in central and southwestern China revealed by microsatellite markers. J. Am. Soc. Hortic. Sci. 2008, 133, 197–203. [Google Scholar]
  60. Gunn, B.F.; Aradhya, M.; Salick, J.M.; Miller, A.J.; Yongping, Y.; Lin, L.; Xian, H. Genetic variation in walnuts (Juglans regia and J. Sigillata; Juglandaceae): Species distinctions, human impacts, and the conservation of agrobiodiversity in Yunnan, China. Am. J. Bot. 2010, 97, 660–671. [Google Scholar] [CrossRef] [PubMed]
  61. Pollegioni, P.; Woeste, K.E.; Chiocchini, F.; Olimpieri, I.; Tortolano, V.; Clark, J.; Hemery, E.G.; Mapelli, S.; Malvolti, M.E. Long-term human impacts on genetic structure of Italian walnut inferred by SSR markers. Tree Genet. Genomes 2011, 7, 707–723. [Google Scholar] [CrossRef]
  62. Wang, H.; Pan, G.; Ma, Q.; Zhang, J.; Pei, D. The genetic diversity and introgression of Juglans regia and Juglans sigillata in Tibet as revealed by SSR markers. Tree Genet. Genomes 2015, 11, 1–11. [Google Scholar] [CrossRef]
Figure 1. The transcript (a) and unigene (b) length distribution of Juglans regia.
Forests 07 00247 g001
Figure 2. Gene Ontology classifications of assembled unigenes. The results are summarized in three main categories: Biological process, Cellular component, and Molecular function. (a) In total, 259,423 unigenes with BLAST matches to known proteins were assigned to gene ontology; (b) In total, 179 unigenes with BLAST matches to known proteins were assigned to gene ontology which are not list in Figure 2a.
Forests 07 00247 g002
Figure 3. Histogram presentation of clusters of orthologous groups (COG) classification. All unigenes were aligned to COG database to predict and classify possible functions. Out of 27,435 Nr hits, 11,983 sequences were assigned to 26 COG classifications. (A) RNA processing and modification; (B) chromatin structure and dynamics; (C) energy production and conversion; (D) cell cycle control, cell division, chromosome partitioning; (E) amino acid transport and metabolism; (F) nucleotide transport and metabolism; (G) carbohydrate transport and metabolism; (H) coenzyme transport and metabolism; (I) lipid transport and metabolism; (J) transition, ribosomal structure and biogenesis; (K) transcription; (L) replication, recombination and repair; (M) cell wall/membrane/envelope biogenesis; (N) cell motility; (O) posttranslational modification, protein turnover, chaperones; (P) inorganic ion transport and metabolism; (Q) secondary metabolites biosynthesis, transport and catabolism; (R) general function prediction only; (S)function unknown; (T) signal transduction mechanisms; (U) intracellular trafficking, secretion, and vesicular transport; (V) defense mechanisms; (W) extracellular structures; (X) unnamed protein; (Y) nuclear structure; (Z) cytoskeleton.
Forests 07 00247 g003
Figure 4. Pathway assignment based on the Kyoto Encyclopedia of Genes and Genomes (KEGG). (A) Classification based on cellular process categories; (B) classification based on environmental information processing categories; (C) classification based on genetic information processing categories; (D) classification based on metabolism categories; (E) classification based on organismal systems categories.
Forests 07 00247 g004
Figure 5. Characterization of simple sequence repeats (SSRs) in the common walnut (Juglans regia) transcriptome. (a) Distribution of different SSR repeat motif types; (b) number of different repeat motif; (c) frequency distribution of major SSRs based on main motif type; (d) Distribution of 77 SSR motifs in the J. regia transcriptome.
Forests 07 00247 g005
Figure 6. (a) Geographical distribution and cluster analysis of 11 J. regia populations using 39 EST-SSR markers in China. Pie charts represent total percentage of each of the five genotypic clusters found among all samples at each sampled site; (b) UPGMA cluster analysis of 11 populations of Chinese Persian walnut using 39 SSRs; (c) Results of the Bayesian model-based clustering STRUCTURE analysis of 88 individuals of Persian walnut (K = 5) (Supplemental Figure S4).
Forests 07 00247 g006
Table 1. Sources of samples of Juglans regia used for genotyping based on EST-SSRs.
Collection SitePopulation IDTypeSample SizeLongitude (E)Latitude (N)Elevation (m)
Zunyi, GuizhouYWWild8106°47′35.22″27°18′18.29″684
Nanchong, SichuanSCWild8105°55′30.52″30°52′33.19″437
Linzhi, XizangXZWild894°21′42.94″29°38′50.75″2995
Tianshui, GansuGSWild8106°00′35.96″34°20′55.10″1579
Akesu, XinjiangXJWild882°57′43.26″41°43′04.46″1072
Longshan, HunanLSWild8109°30′16.83″29°13′21.52″479
Nanchang, JiangxiMTCultivated8115°27′21.8″28°44′32.38″1235
GuizhouGZCultivated8104°40′37.64″26°30′32.88″1084
Baoshan, YunnanBSCultivated898°47′8.29″25°17′31.08″1800
Yuncheng, ShanxiYCCultivated8110°59′40.34″35°01′59.86″370
Cili, HunanCLCultivated8110°55′28.5″29°23′41.65″98
Table 2. Characterization of 39 polymorphic microsatellite loci of 77 tested EST-SSRs of Juglans regia.
LocusRepeatsPrimer Sequence (5′–3′)GenBank AccessionNASize Range (bp)Tm (°C)PICHoHeHW
JR0082(AAAC)5F: AATTGCCACCAACGAACACGJZ8449475144–160530.6420.6940.694**
R: TCGTTCCCCAGAAACTCTCCCCCAA
JR0160(TC)10F: TCTCGGATTTGGGCTGTGACJZ8449486276–282530.6950.4760.662NS
R: TCCGGGACCCTCGTCTAATT
JR1165(AGAT)6F: CACGTAGCGTCCGTAATCGAJZ8449495482–502550.5290.3580.615NS
R: CAGCACCTCCACTAACTGCA
JR1739(GAGCCG)8F: GGATGTGGAGACGGCAAAGAJZ8449507270–302530.5600.9240.632***
R: CGTCCACCCAAACCAAGAGA
JR1817(AC)11F: CCTCAGAGCCAACCATCCTTJZ8449515371–381550.6060.5760.660NS
R: AGAACAGAACCAGCGTCACA
JR2018(TC)10F: TCTCAACCTTGGCCTGCATTJZ8449524268–278550.5830.7620.661NS
R: CGAAAAGCCAACCTTCGCAA
JR2465(TC)10F: GTTCCTCTTTCCCCAGCCTCJZ8449534309–317530.5180.0210.607***
R: TCTGGCCACCATTGTAGCTG
JR2510(ATTAT)5F: GGGGATGTTGGGGGTTGATTJZ8449542315–320520.2820.4350.344ND
R: ACTTGTGGAGGGGAGGAAGA
JR2600(GA)10F: TTGGGGAATCTGCAGCAGAGJZ8449554135–141510.5240.8720.601***
R: TATTACACATGCCGCAGCCA
JR2873(GGGGCG)5F: GGTTAGGGTAGCGGGTTCGJZ8449564231–249550.5720.9290.651*
R: AGCGACGATGGAAACGAACT
JR3147(CTAT)6F: CAGCACCTCCACTAACTGCAJZ8449573480–488550.4790.5130.575NS
R: CACGTAGCGTCCGTAATCGA
JR3434(GTAT)5F: CCGCCCAGCAGATTGTCATAJZ8449582276–280550.3420.1420.441***
R:CGTCCCCTCAAGTTCTTGCT
JR3608(ATTA)5F: CCCCTCCCCCATTTCTTGACJZ8449594276–288550.4360.4110.525NS
R: TCATGTAACATCATTCACCAACCA
JR3773(CTGT)5F: GGTGGTTTGACCCTTAATTCTGTJZ8449603173–181550.3450.2990.379ND
R: ACCCTGCCACAATGACCAAA
JR4051(TCTT)5F: TGAGGCTATAACCACCCCCTJZ8449614206–218550.4830.5590.543NS
R: GGCAACCAAGAGAAGCAAGG
JR4324(AT)10F: AGTGGCTTCTTGATTGTGCCTJZ8449624266–274550.2480.2600.275ND
R: GCTGTCCTCATCGTTTGTGC
JR4616(AGAC)5F: AGCCCTTTTGCATCGGCTATJZ8449632160–164550.3200.2030.403**
R: AGCTGACCGATCGATCAACA
JR4964(GGGA)5F: CTCGATCTGAACTCGGCTCCJZ8449654214–226520.4610.3140.515NS
R:TCTACTCTCTCCGCACCACA
JR4965(AC)10F: TGTGGCTTCGTTAGTGTTGTGJZ8449664288–298550.3370.2410.387ND
R: TCTTTTCCCTGAGTGGAGTTACA
JR49652(TG)10F: GCGCAGATCAATGAAAAGAGGGJZ8449673266–270550.2680.2340.306ND
R: TGTGGCTTCGTTAGTGTTGTG
JR5538(TG)10F: AGCTCACATCCAATCCAGCGJZ8449684558–564520.6560.4720.715NS
R:CCCCATCCCAAGAATCTCCC
JR5574(ATTT)5F:TGGTTAGTGACAGACCGCAGJZ8449864200–296550.5300.5220.609NS
R:CAGCAGCAGCAGTAGCAATG
JR6160(GA)10F: ACTTCAGGTTCCCAACGCAAJZ8449696198–208550.6460.6910.696NS
R: TAGAGGGAAGGTCTCCGGTG
JR6226(T)11g(A)10(AAT)5F: TGAGATGTTTGGCACGCTGAJZ8449703238–244550.4020.8810.515***
R: AATGCCGTCGCCTACTTGAA
JR6439(TGCG)5F: TCGATGCGATCATCTCCGTGJZ8449713148–156520.3930.2240.515***
R: CGGCACCAAAACAGAACTCG
JR6508(TCTT)5F: CGTCGATGACAAGTCCGGATJZ8449724267–279550.4430.4170.517NS
R: CAGCTCTCAGACACACAGGG
JR6638(T)12cgtt(A)10F: CTGACAGACATGGAGGGTCGJZ8449732222–224550.2800.0160.339ND
R: ACAAACTATATTGTGCAAGAATCCAGT
JR6714(AT)6aa(AT)10F: TGGGGGCTCTTTCTTCCAAAJZ8449742185–193520.2300.1260.135ND
R: CCTTGCAAACATCATCCACACT
JR6742(TGTC)6F: AGCTCTAGCCTCTAGGGGTTCJZ8449753247–255550.5840.3940.663*
R: TCCCCAATTAATTGCAAACACCA
JR6926(CAAC)5F: GGAAAGGCATTGCAGAGCACJZ8449762176–180550.3410.1160.438***
R: GGCAGAGCAAGAGACTTCGT
JR7171((TCCC)5F: ACCTAATCCACGTGCGACAGJZ8449774327–339530.3730.7120.473***
R: GCTCTTCCTCCGTCCTCAAC
JR7363(AT)10F: GGCCATCGAAAATAGCAAACGAJZ8449784162–168550.5260.1320.592***
R: AGTGGCTTCTTGATTGTGCCT
JR7495(GTTG)5F: GGCAGAGCAAGAGACTTCGTJZ8449792248–254550.3750.7850.503***
R: GGAAAGGCATTGCAGAGCAC
JR74952(A)10c(AT)7F:ACGATCCCCTTTGCTTGCATJZ8449802174–176550.1680.1220.138ND
R:AGGGCAGCCACATATGATCA
JR7544(ATACG)5F: CCTCGGGTCCACCTTTCTTCJZ8449814192–207550.4550.1870.506***
R: TCGCTGCGAAACTCTTGAGT
JR8058(AG)10F: TTGTGTTGCTGGGTCTTCGTJZ8449823172–184550.1500.0530.052ND
R: AGAAAAGGTGCGCAGTGAGA
JR8815(AGTCT)5F: TTCTGGGATGAGGAGGAGGGJZ8449833221–231550.4080.0770.504***
R: CCGAAATCACGCAGGAAAGC
JR9306(GA)11F: GGTGACCACAACACGCTACTJZ8449843218–224520.2130.2550.231ND
R: ACCTCTTGTGCCTCTGAACG
JR9632(CGAGCA)8F: CCGTCTCCGCCTTTTACCTTJZ8449855254–272520.4710.3700.519NS
R: AGCTCAACGGTCAAGGAAGG
NA = Number of alleles, PIC = Polymorphic information content, NS = Not significant (with Bonferroni correction), ND = Not analyzed, *** p < 0.0001, ** p < 0.01, * p < 0.05.

