
Modeling Anthropogenic Fire Occurrence in the Boreal Forest of China Using Logistic Regression and Random Forests


Abstract
:1. Introduction
2. Materials and Methods
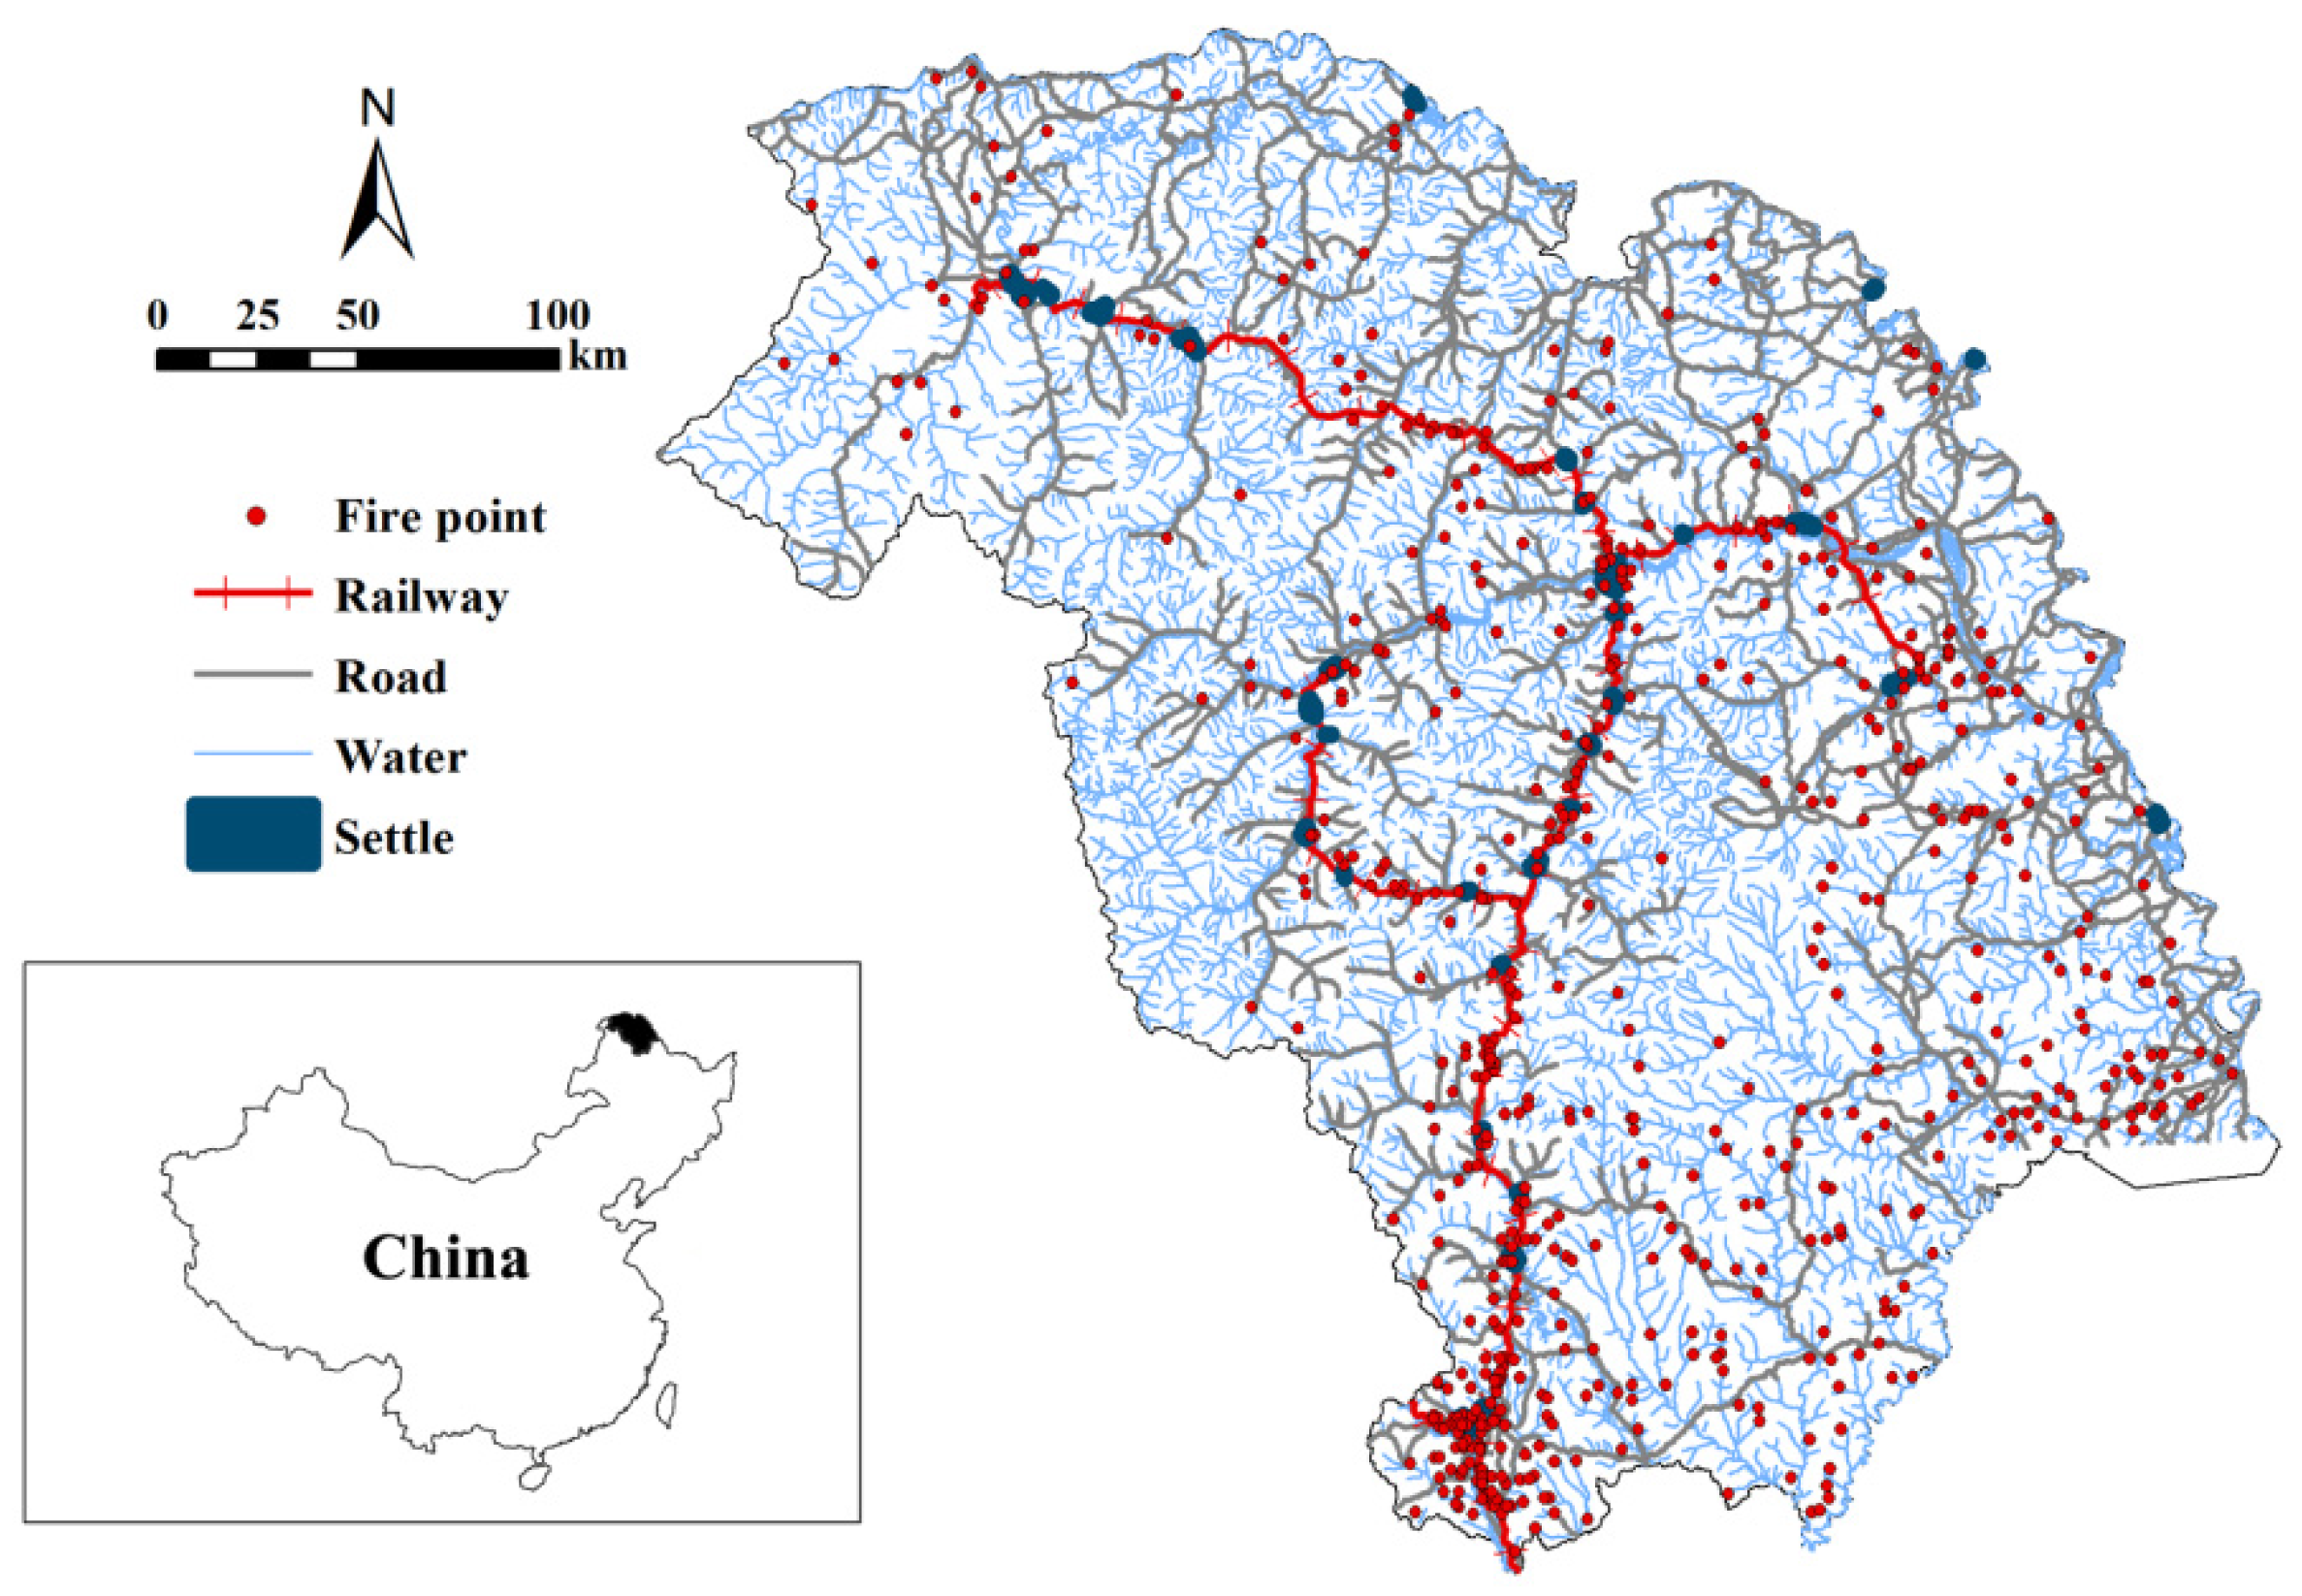
2.1. Study Site
2.2. Data Collection and Processing
2.2.1. Climate Factors
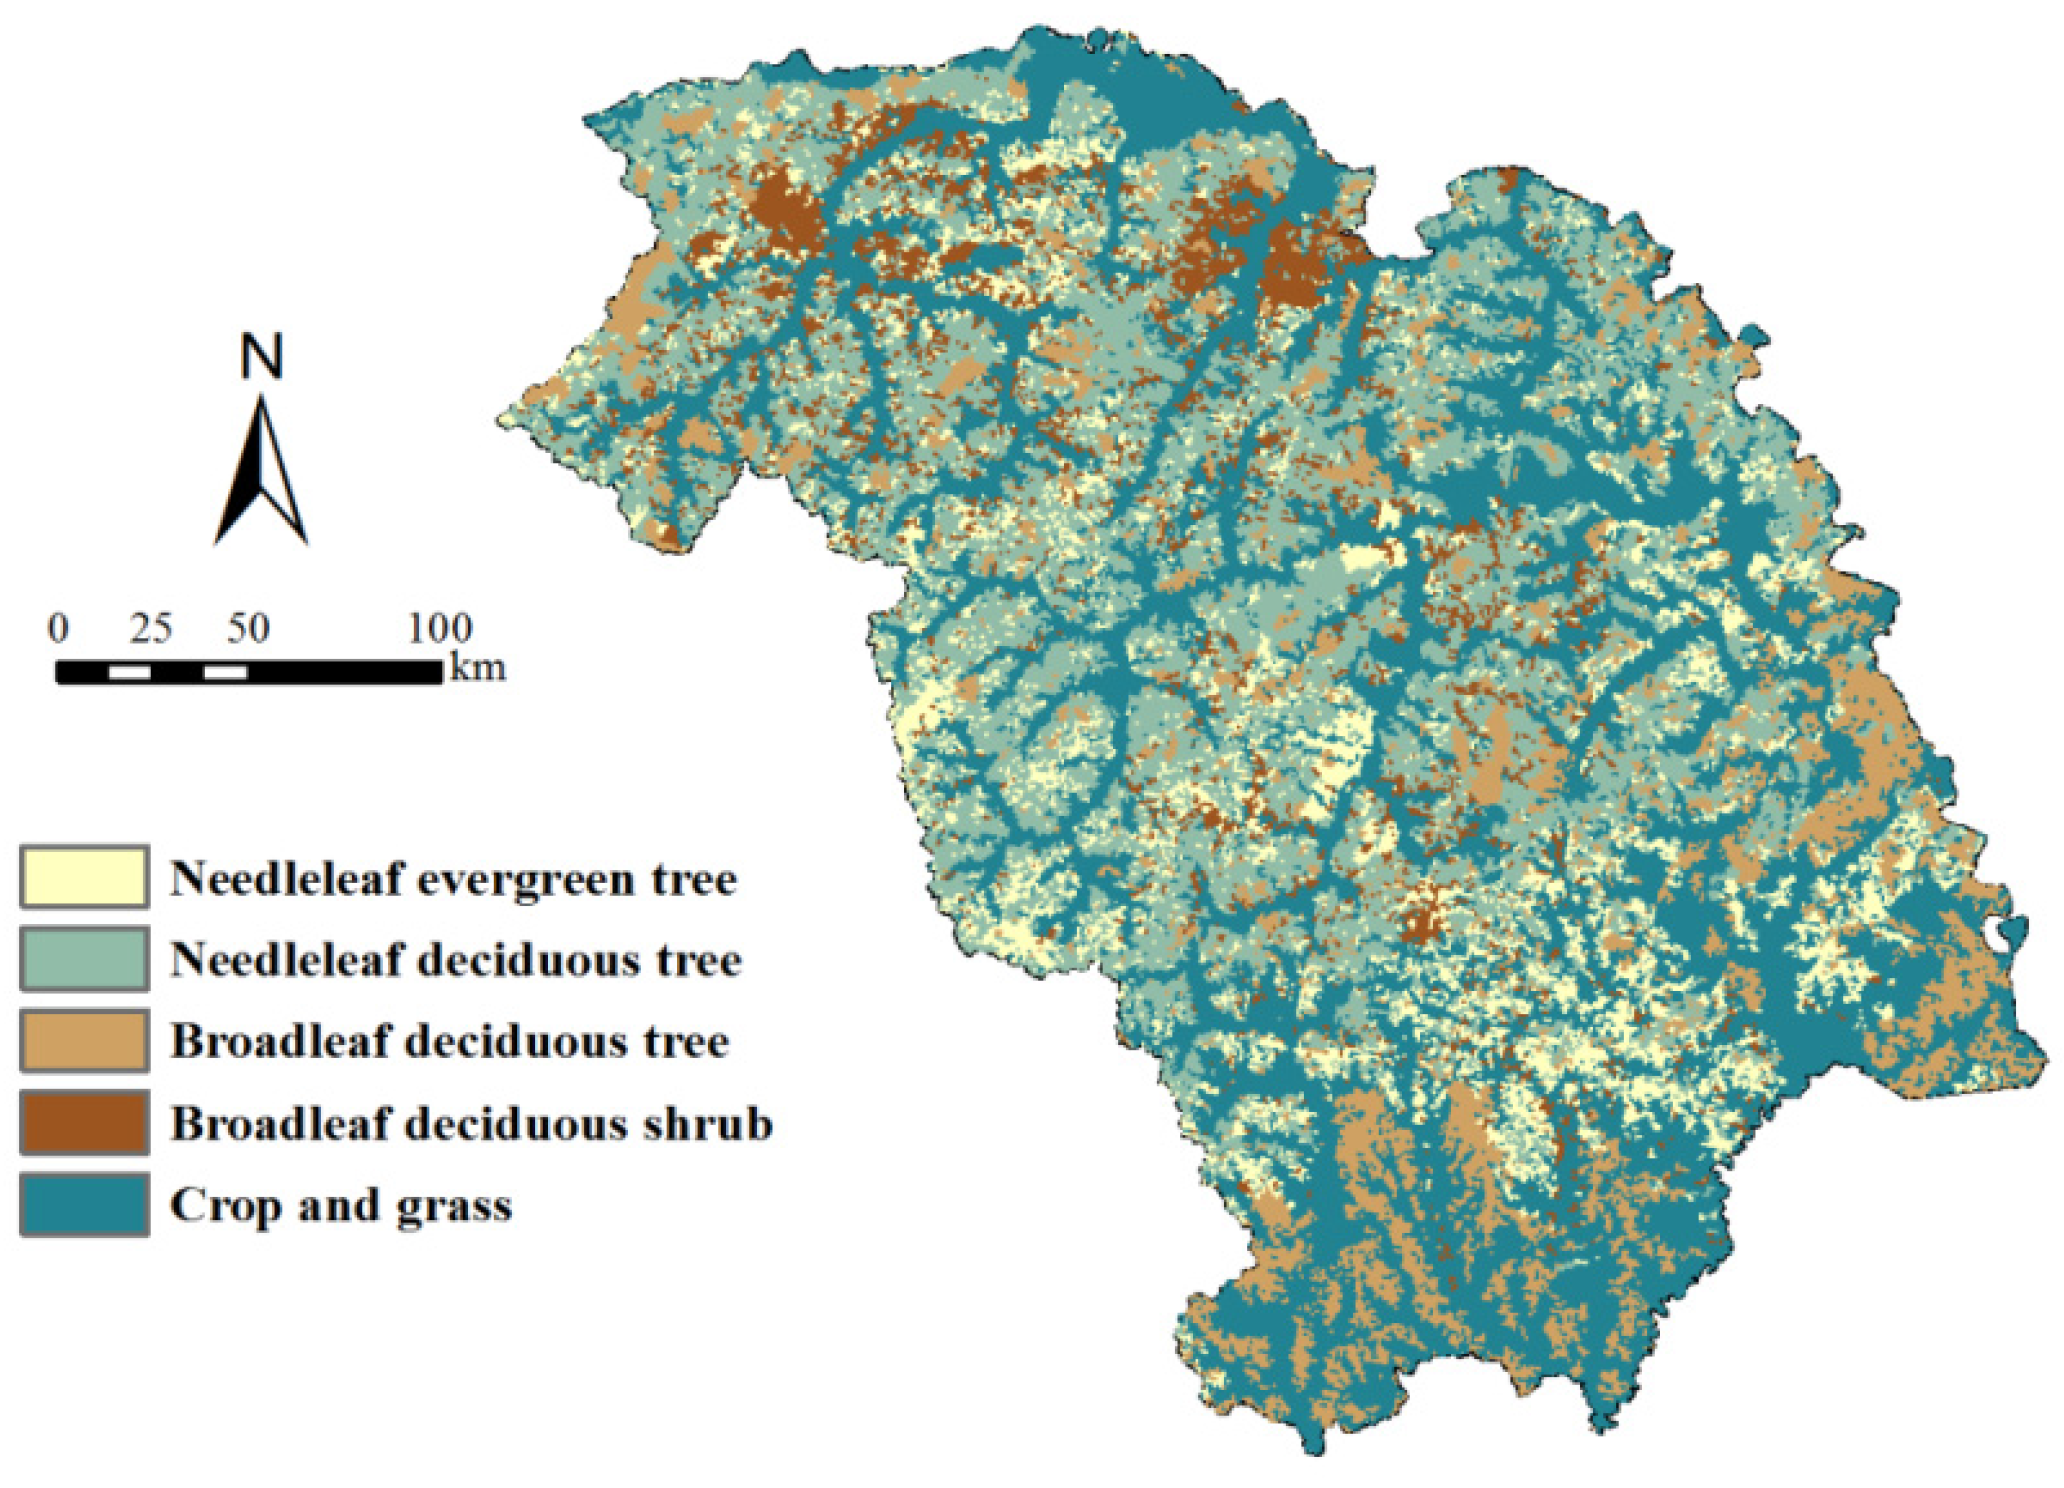
2.2.2. Vegetation
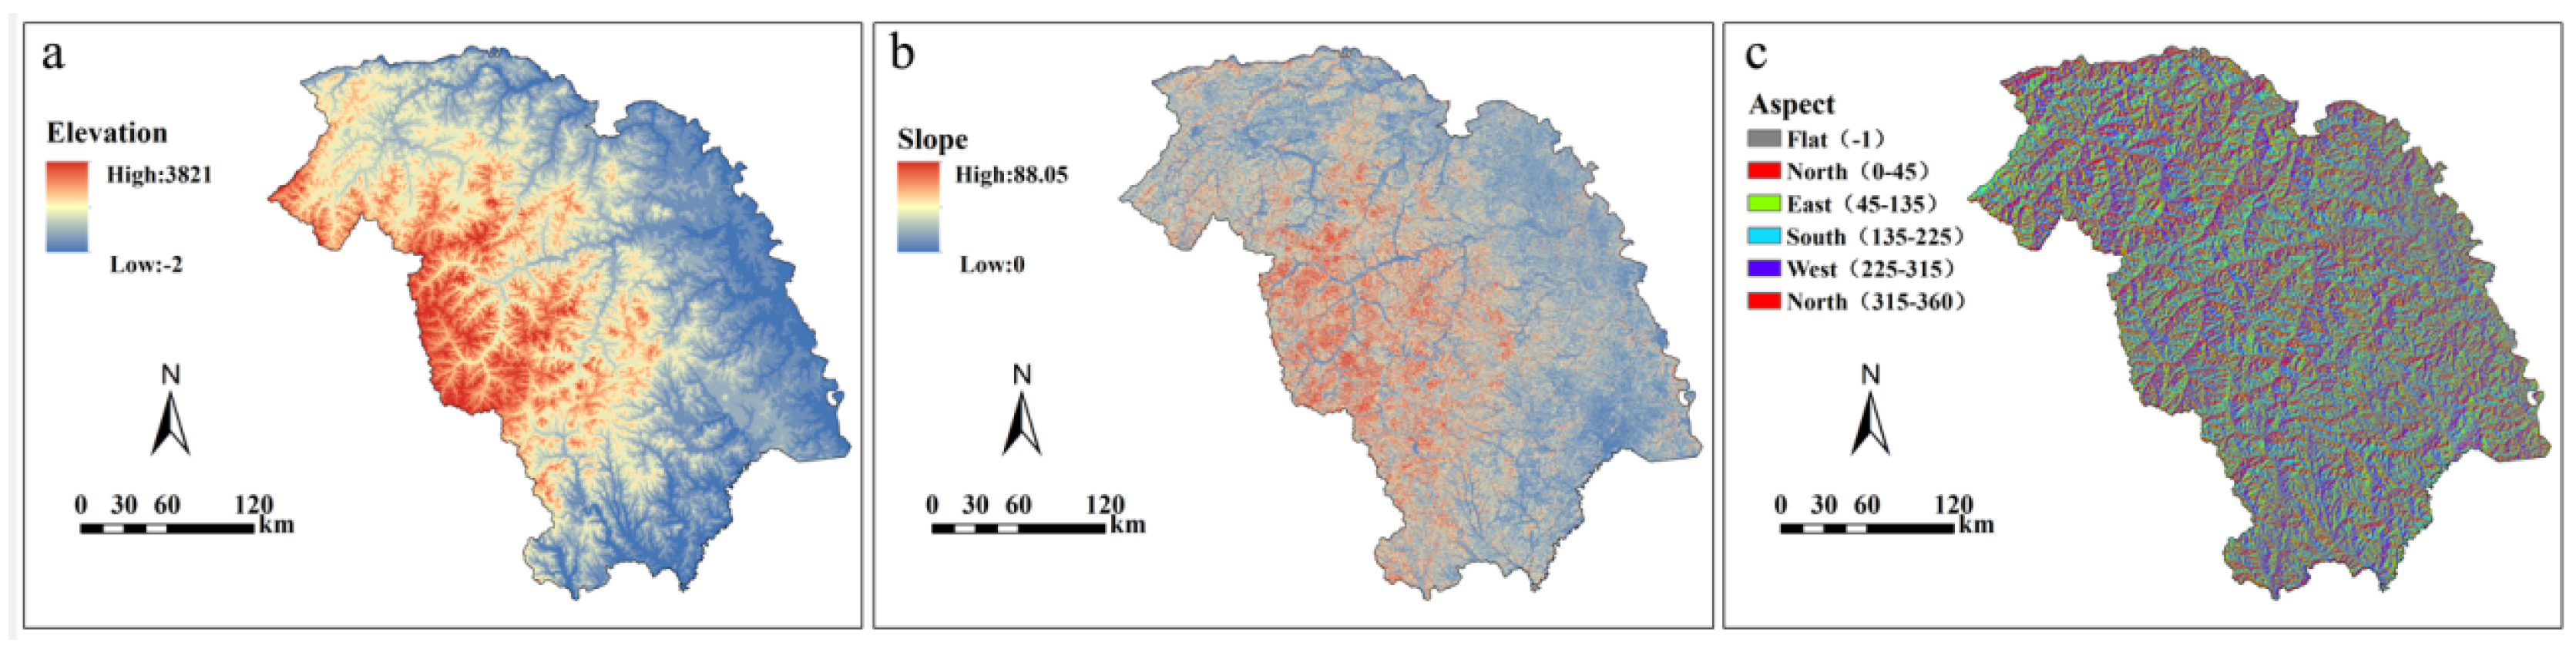
2.2.3. Topography
2.2.4. Infrastructure
2.2.5. Socio-Economic Factors
2.3. Models and Computing Procedures
2.3.1. Multicollinearity Test
2.3.2. Models
- (1)
- Logistic regression (LR). LR describes the relationship between a binary response variable (Y, coded as 0 (representing “No”) and 1 (representing “Yes”)) and one or more predictor variables (X) by means of a link function. It has been used for fire occurrence prediction and to examine the driving factors of fire occurrence in different regions of the world at various scales [19,40,41]. Logistic regression is commonly expressed as follows:
- (2)
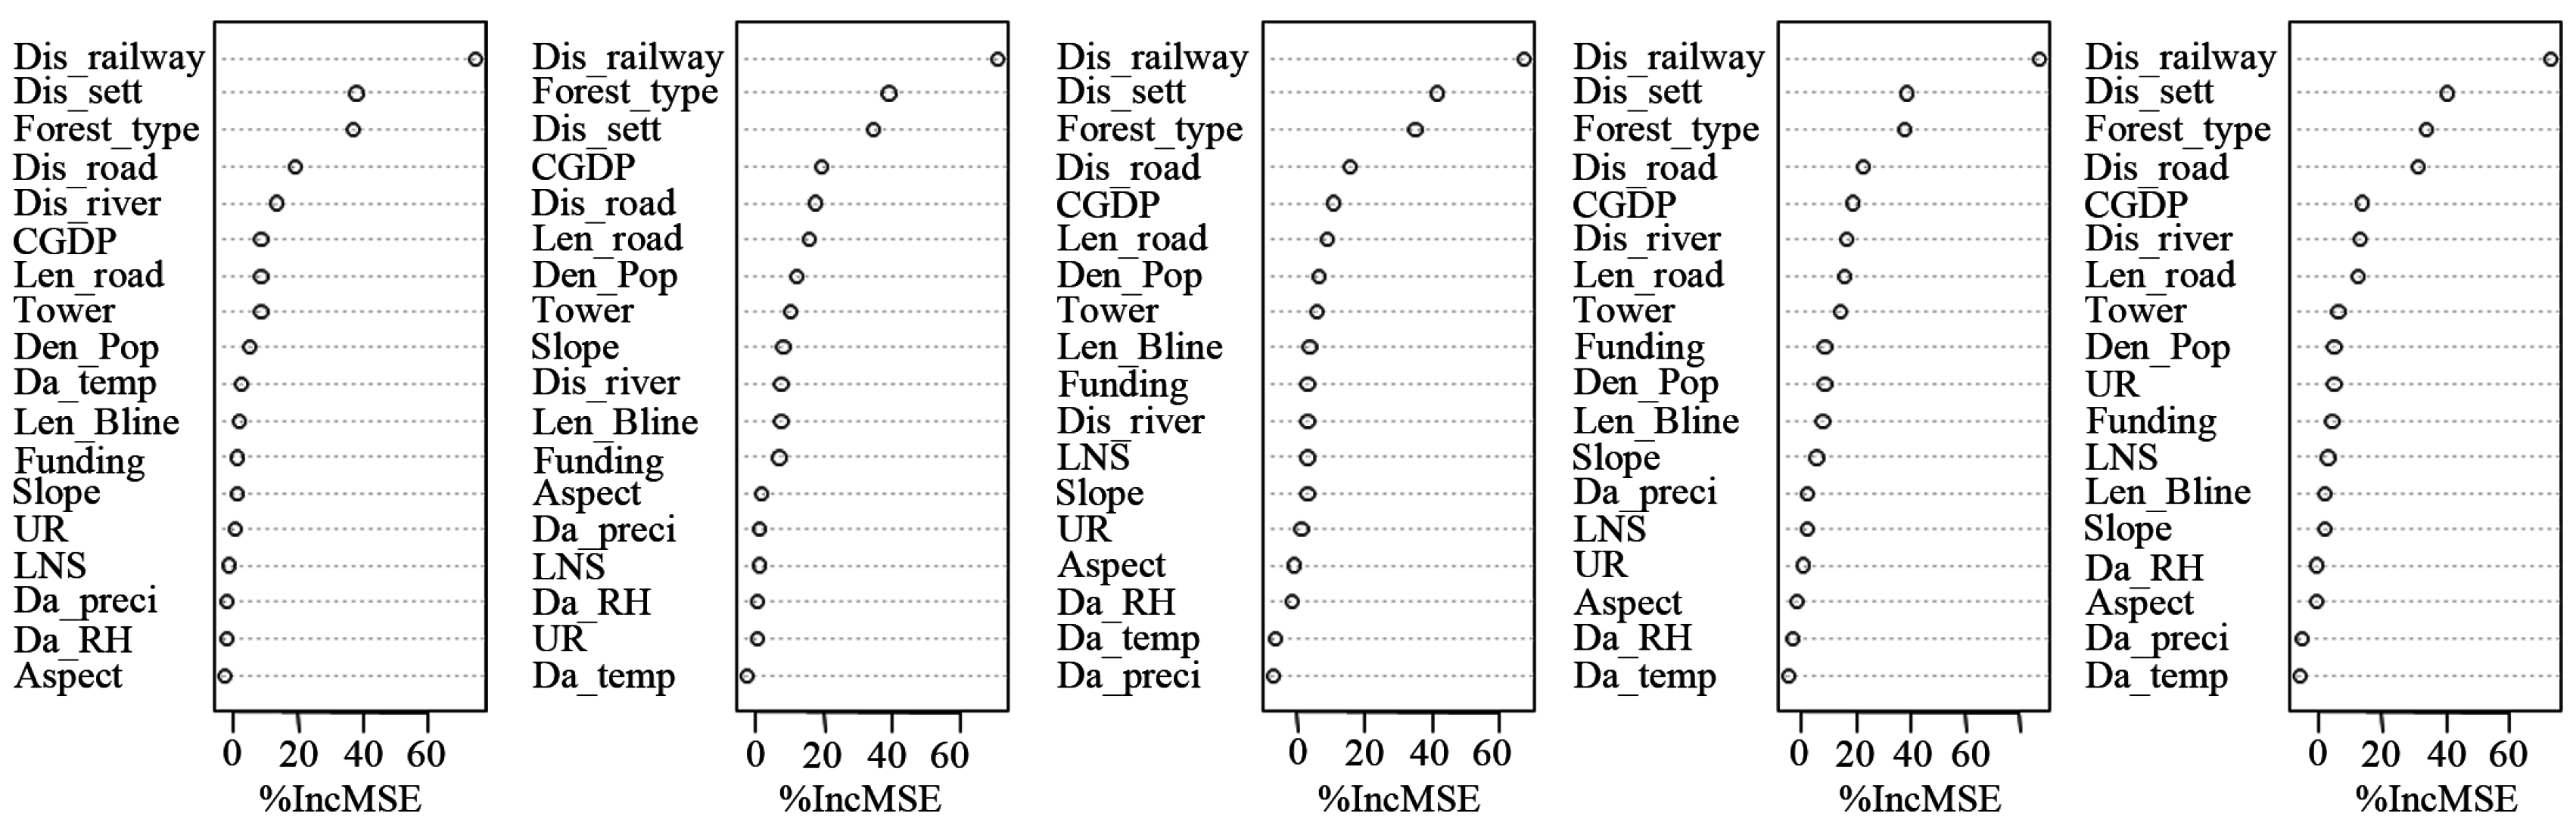
- Random Forests (RF). RF is an ensemble learning technique for classification, regression, and other tasks. It operates by constructing a number of decision trees, where each tree is generated by bootstrapping samples, and outputs the mode of the classes (classification) or mean prediction (regression) of the individual trees [30]. Each decision tree uses two-thirds of the data to train RF, while the remaining one-third of the data (namely out of bag samples (OOB)) are retained for model validation [42]. In the modeling process, RF generates variable importance measures by comparing increases in OOB error when that variable is randomly permuted, while keeping all others unchanged [43,44]. RF is a nonparametric modeling algorithm which is robust to outliers and over-fitting and it also enables variable importance measures to be computed and compared to other regression techniques [30,45,46].
3. Results
3.1. Test for Multicollinearity
3.2. Identification of Driving Factors by LR and RF Models
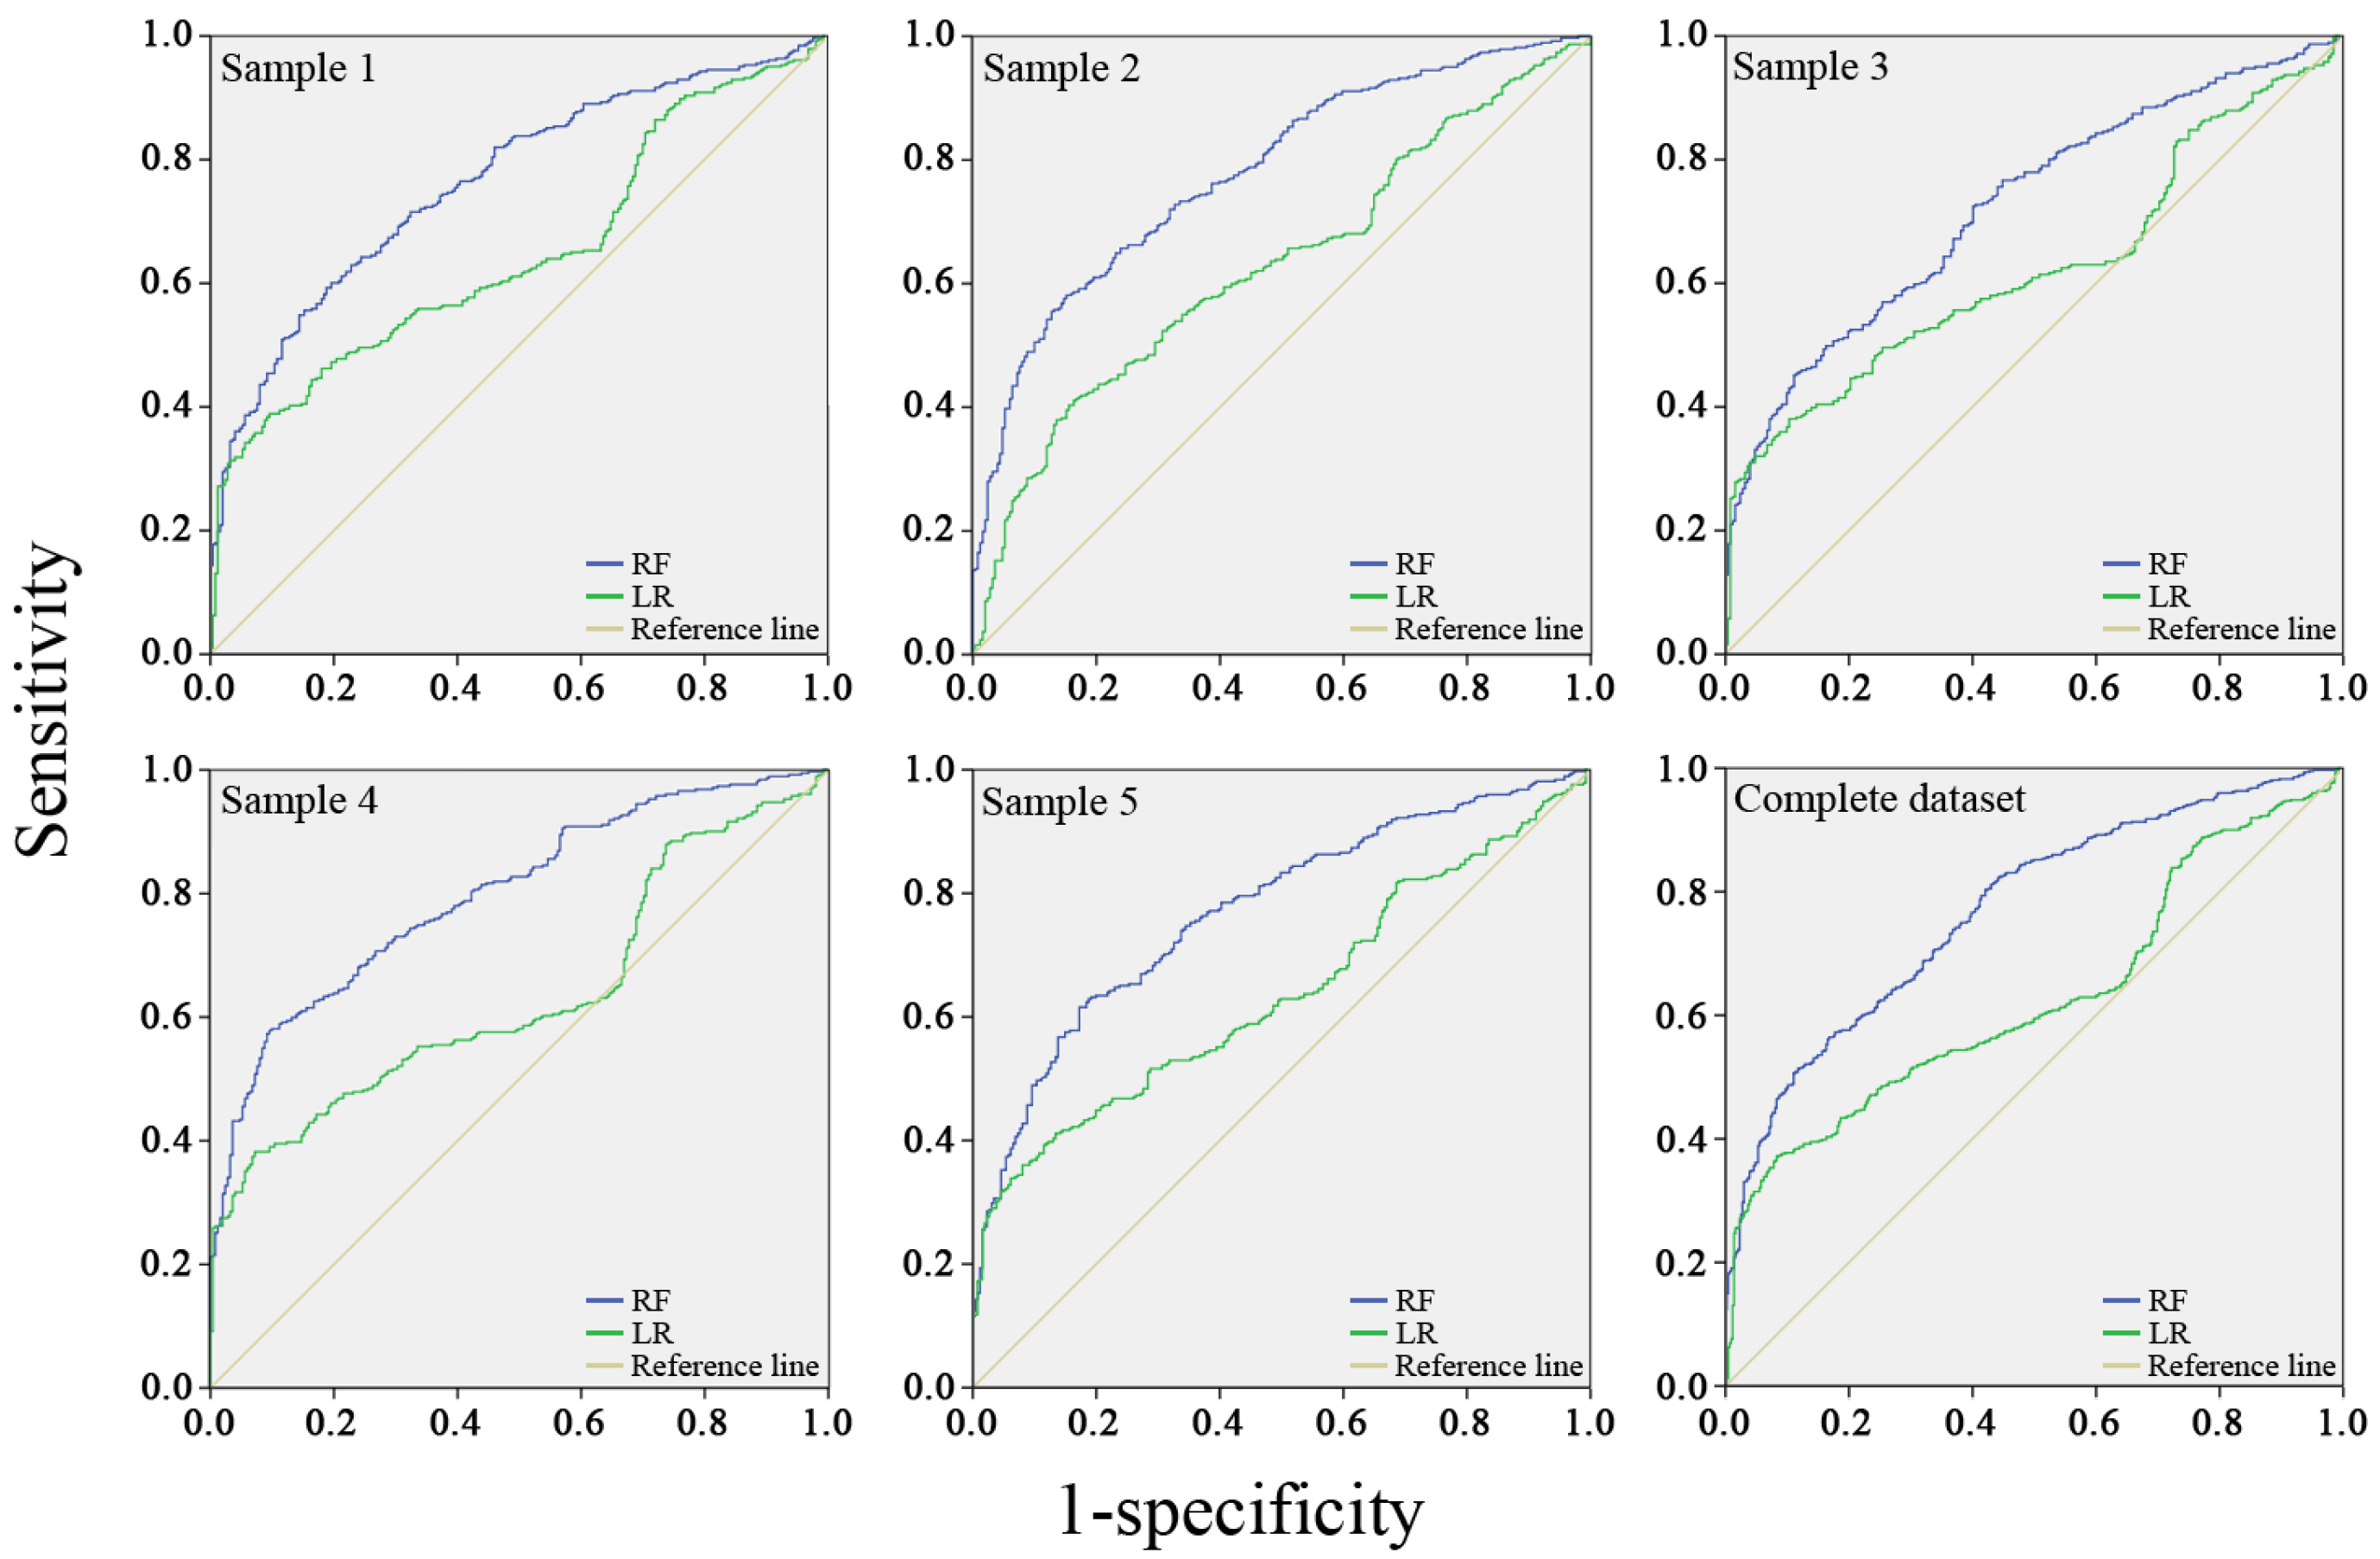
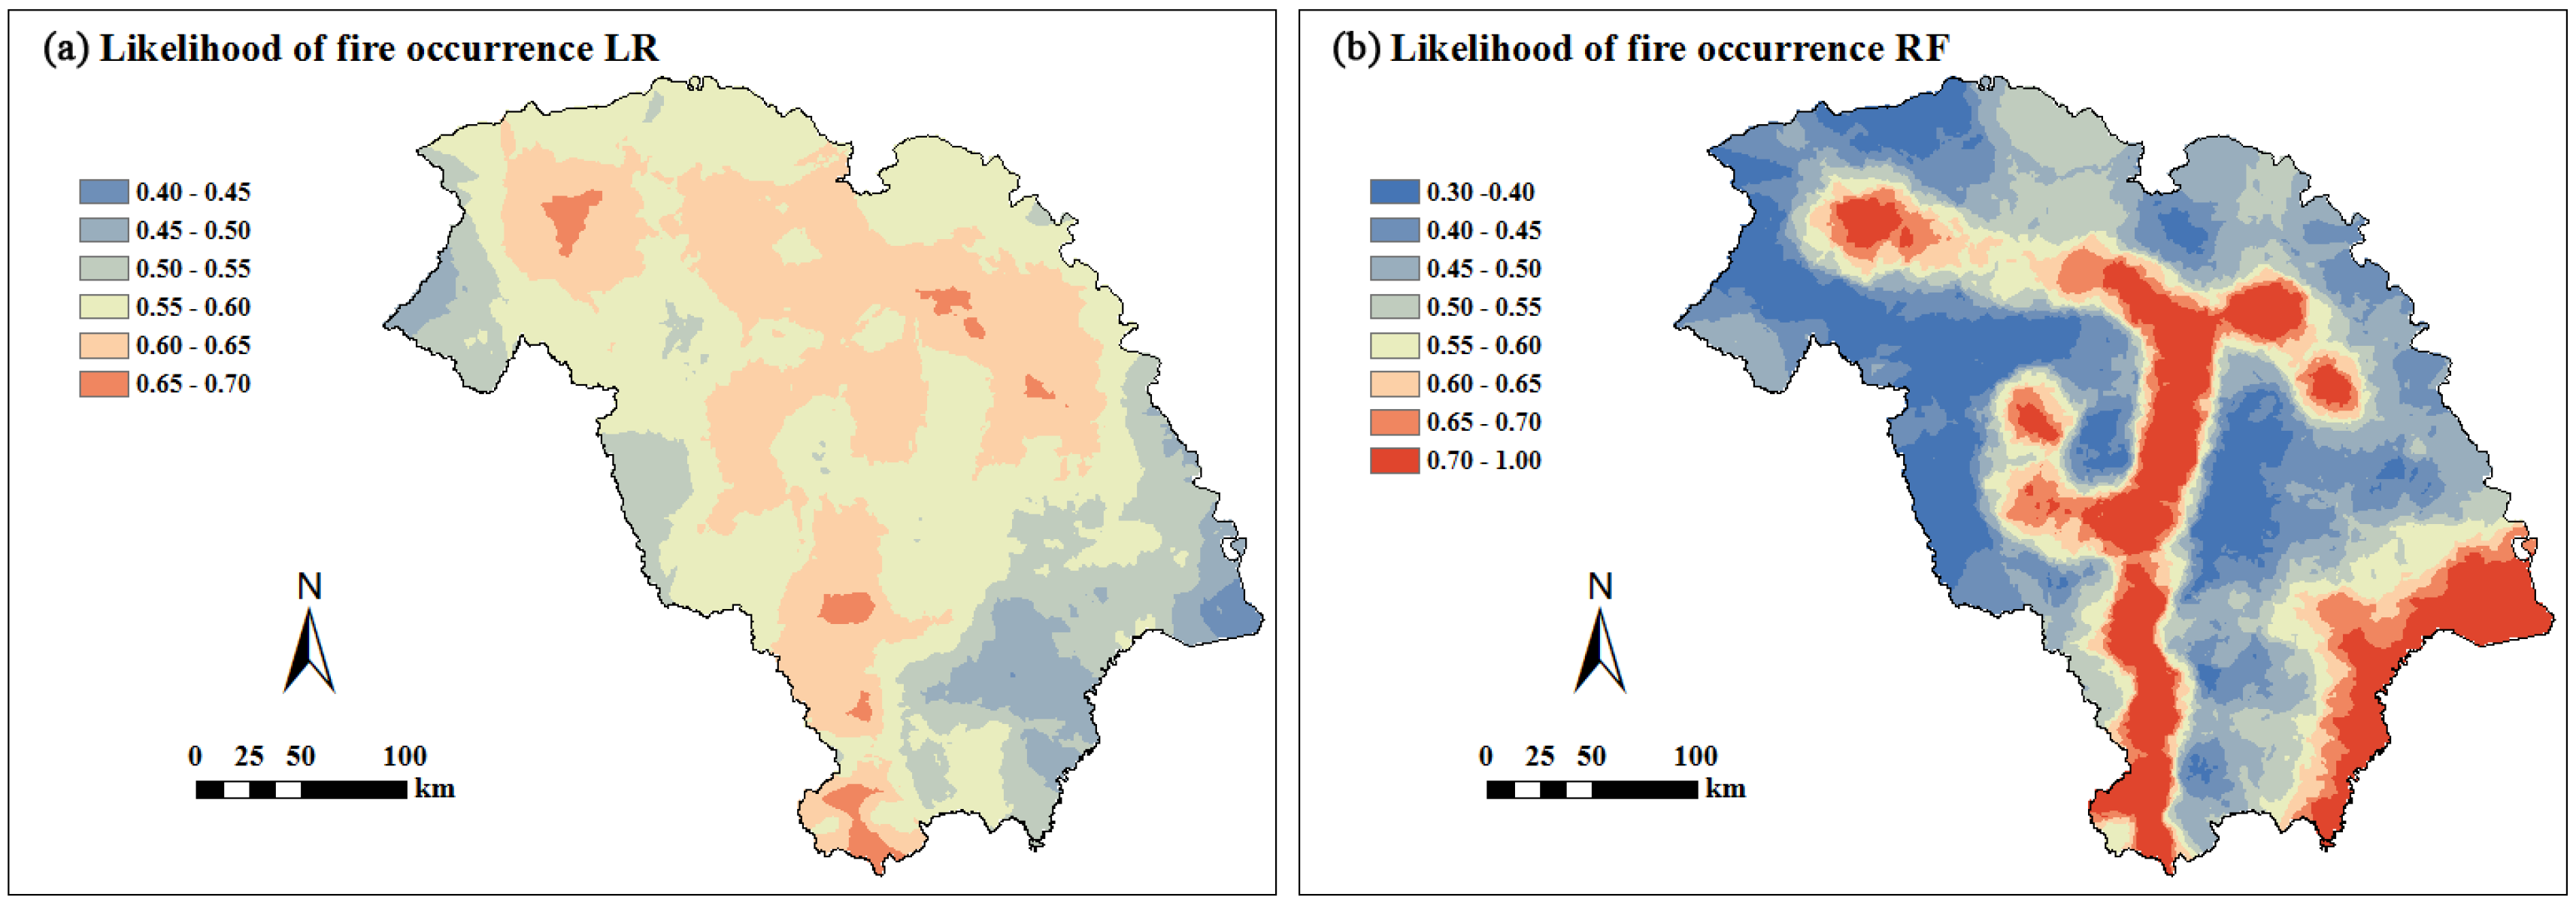
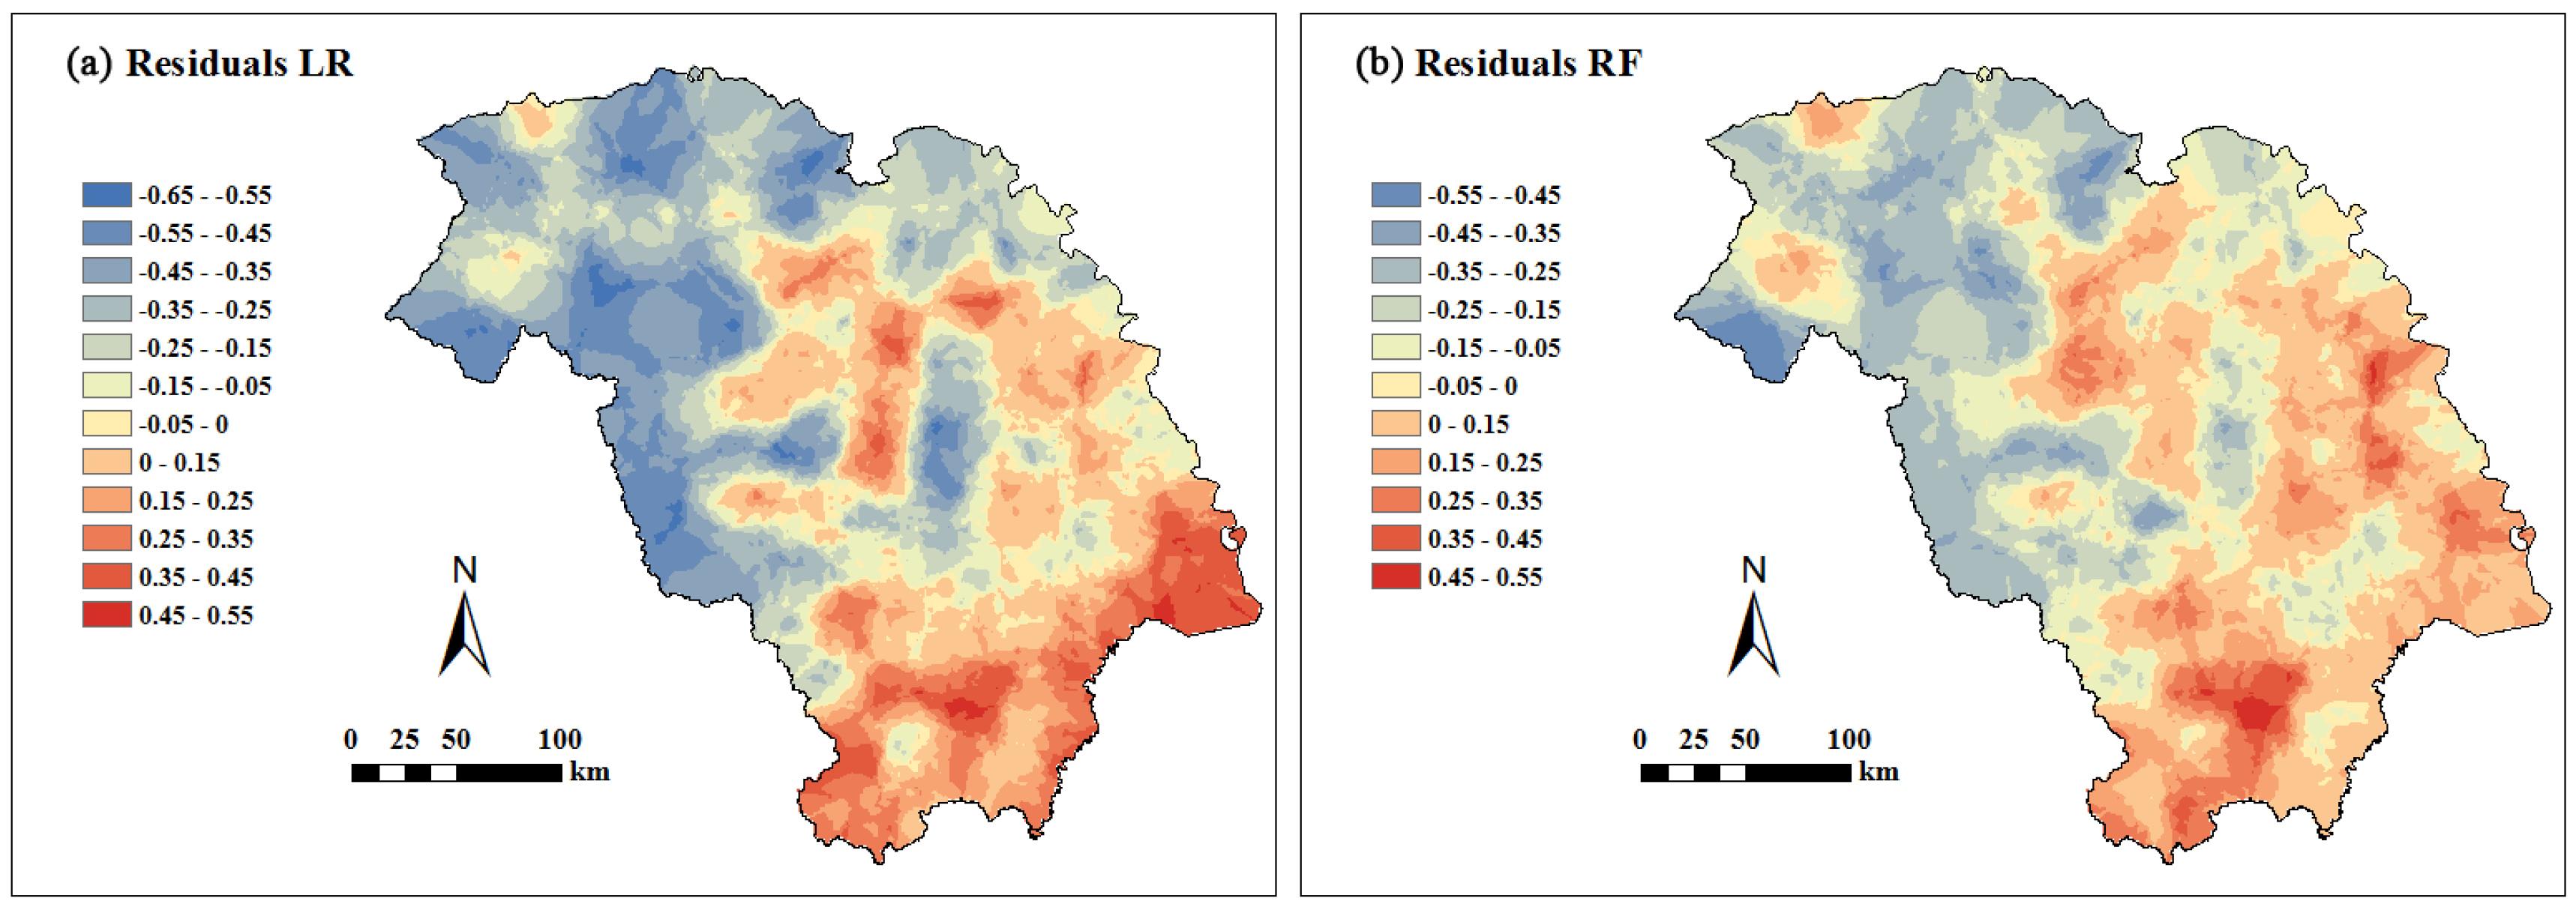
3.3. Comparison of LR and RF Performance

| Variable Type | Variable Name | Code | Resolution/Scale | Description | Source/Reference |
|---|---|---|---|---|---|
| Daily precipitation | Da_preci | ||||
| Climatic | Daily mean relative humidity | Da_RH | Daily/0.01 | The corresponding daily climate factors of each fire point and control point based on five national weather stations | [52] |
| Daily mean temperature | Da_temp | ||||
| Topographic | Slope | Slope | Raster/25 m | The slope of each fire point and control extracted from a raster map of study area | [53] |
| Aspect | Aspect | Generate aspect from ArcGIS as a continuous variable and transform. Aspect was transformed into cosine aspect (Cos_as) by using a trigonometric function | |||
| Vegetation | Forest type | Forest_type | Raster/1 km | Proportion of each forest type in the study area | [54] |
| Infrastructure | Distance to nearest railway | Dis_railway | Vector/1:250,000 | The straight distance between a fire point or a control point and the nearest railway | [53] |
| Distance to nearest river | Dis_river | The straight distance between a fire point or a control point and the nearest river | |||
| Distance to nearest road | Dis_road | The straight distance between a fire point or a control point and the nearest road | |||
| Distance to nearest settlement | Dis_sett | The straight distance between a fire point or a control point and the nearest settlement | |||
| Number of fire towers | Tower | Yearly/0.1 | The number of fire towers that were used to monitor fire occurrence | [55] | |
| Number of inspection stations | LNS | The number of inspection stations that were used to inspect the potential fire source with people who will enter the mountains during the fire season | |||
| Length of burned line | Len_Bline | The length of burned line for fire prevention | |||
| Length of road construction | Len_road | The length of road for fire prevention | |||
| Socio-economic | Per Capita GDP | CGDP | Yearly/0.01 | Per capita GDP of the study area | [56] |
| Unemployment rate | UR | The unemployment rate of the study area | |||
| Population density | Den_Pop | The annual population density of the study area | |||
| Funding | Funding | Annual funding for forest fire prevention | [55] |
4. Discussion
5. Conclusions
Acknowledgments
Author Contributions
Conflicts of Interest
References
- Intergovernmental Panel on Climate Change (IPCC). Land Use, Land-Use Change, and Forestry; Cambridge University Press: Cambridge, UK, 2000; p. 4. [Google Scholar]
- Gorham, E. Northern peatlands: Role in the carbon cycle and probable responses to climate warming. Ecol. Appl. 1991, 1, 182–195. [Google Scholar] [CrossRef] [PubMed]
- Zimov, S.A.; Davidov, S.P.; Zimova, G.M.; Davidova, A.I.; Chapin, F.S.; Chapin, M.C.; Reynolds, J.F. Contribution of disturbance to increasing seasonal amplitude of atmospheric CO2. Science 1999, 284, 1973–1976. [Google Scholar] [CrossRef] [PubMed]
- Weber, M.G.; Flannigan, M.D. Canadian boreal forest ecosystem structure and function in a changing climate: Impacts on fire regimes. Environ. Rev. 1997, 5, 145–166. [Google Scholar] [CrossRef]
- Stocks, B.J. Global warming and forest-fires in Canada. For. Chron. 1993, 69, 290–293. [Google Scholar] [CrossRef]
- Shvidenko, A.Z.; Goldammer, J.G. Fire situation in Russia. Int. For. Fire News 2001, 24, 41–59. [Google Scholar]
- Wotto, B.M.; Martell, D.L.; Logan, K.A. Climate change and people-caused forest fire occurrence in Ontario. Clim. Chang. 2003, 60, 275–295. [Google Scholar] [CrossRef]
- Shvidenko, A.Z.; Nilsson, S. Fire and the carbon budget of Russian forests. In Fire, Climate Change, and Carbon Cycling in the Boreal Forest; Kasischke, E.S., Stocks, B.J., Eds.; Springer: New York, NY, USA, 2000; pp. 289–311. [Google Scholar]
- Mollicone, D.; Eva, H.D.; Achard, F. Human role in Russian wild fires. Nature 2006, 440, 436–437. [Google Scholar] [CrossRef] [PubMed]
- Guo, F.; Innes, L.J.; Wang, G.; Ma, X.; Sun, L.; Hu, H.; Su, Z. Historic distribution and driving factors of human-caused fires in the Chinese boreal forest between 1972 and 2005. J. Plant Ecol. 2015, 8, 480–490. [Google Scholar] [CrossRef]
- Korovin, G.N. Analysis of the distribution of forest fires in Russia. In Fire in Ecosystems of Boreal Eurasia; Goldammer, J.G., Furyaev, V.V., Eds.; Kluwer Academic Publishers: Dordrecht, The Netherlands, 1996; pp. 112–128. [Google Scholar]
- Cardoso, M.F.; Hurtt, G.C.; Moore, B.; Nobre, C.A.; Prins, E.M. Projecting future fire activity in Amazonia. Glob. Chang. Biol. 2003, 9, 656–669. [Google Scholar] [CrossRef]
- Niklasson, M.; Granström, A. Numbers and sizes of fires: Long-term spatially explicit fire history in a Swedish boreal landscape. Ecology 2000, 81, 1484–1499. [Google Scholar] [CrossRef]
- Wallenius, T.H.; Kuuluvainen, T.; Vanha-Majamaa, I. Fire history in relation to site type and vegetation in Vienansalo wilderness in eastern Fennoscandia, Russia. Can. J. For. Res. 2004, 34, 1400–1409. [Google Scholar] [CrossRef]
- Zumbrunnen, T.; Pezzatti, G.B.; Mene’ndezd, P.; Bugmann, H.; Bürgi, M.; Conedera, M. Weather and human impacts on forest fires: 100 years of fire history in two climatic regions of Switzerland. For. Ecol. Manag. 2011, 261, 2188–2199. [Google Scholar] [CrossRef]
- Turco, M.; Llasat, M.C.; Hardenberg, J.; Provenzale, A. Impact of climate variability on summer fires in a Mediterranean environment (northeastern Iberian Peninsula). Clim. Chang. 2013, 116, 665–678. [Google Scholar] [CrossRef]
- Syphard, A.D.; Radeloff, V.C.; Keely, J.E.; Hawbaker, R.J.; Clayton, M.K.; Stewart, S.I.; Hammer, R.B. Human influence on California Fire Regimes. Ecol. Appl. 2007, 17, 1388–1402. [Google Scholar] [CrossRef] [PubMed]
- Romero-Calcerrada, R.; Barrio-Parra, F.J.; Millington, D.A.; Novillo, C.J. Spatial modelling of socioeconomic data to understand patterns of human-caused wildfire ignition risk in the SW of Madrid (central Spain). Ecol. Model. 2010, 221, 34–45. [Google Scholar] [CrossRef]
- Martínez, J.; Vega-García, C.; Chuvieco, E. Human-caused wildfire risk rating for prevention planning in Spain. J. Environ. Manag. 2009, 90, 1241–1252. [Google Scholar] [CrossRef] [PubMed]
- Romero-Calcerrada, R.; Novillo, C.J.; Millington, J.D.A.; Gomez-Jimenez, I. GIS analysis of spatial patterns of human-caused wildfire ignition risk in the SW of Madrid (Central Spain). Landsc. Ecol. 2008, 23, 341–354. [Google Scholar] [CrossRef]
- Catry, F.X.; Rego, F.C.; Bacao, F.L.; Moreira, F. Modeling and mapping wildfire ignition risk in Portugal. Int. J. Wildland Fire 2009, 18, 921–931. [Google Scholar] [CrossRef]
- Chuvieco, E.; Aguado, I.; Yebra, M.; Nieto, H.; Salas, P.J.; Martín, M.P. Development of a framework for fire risk assessment using remote sensing and geographic information system technologies. Ecol. Model. 2010, 221, 46–58. [Google Scholar] [CrossRef]
- Liu, Z.; Yang, J.; Chang, Y.; Weisberg, P.J.; He, H.S. Spatial patterns and drivers of fire occurrence and its future trend under climate change in a boreal forest of Northeast China. Glob. Chang. Biol. 2012, 18, 2041–2056. [Google Scholar] [CrossRef]
- Chang, Y.; Zhu, Z.L.; Bu, R.C.; Chen, H.G.; Feng, Y.T.; Li, Y.H.; Hu, Y.M.; Wang, Z.C. Predicting fire occurrence patterns with logistic regression in Heilongjiang Province, China. Landsc. Ecol. 2013, 28, 1989–2004. [Google Scholar] [CrossRef]
- Wu, Z.E.; He, H.S.; Yang, J.; Liu, Z.H.; Liang, Y. Relative effects of climatic and local factors on fire occurrence in boreal forest landscapes of northeastern China. Sci. Total Environ. 2014, 493, 472–480. [Google Scholar] [CrossRef] [PubMed]
- Cardille, J.A.; Ventura, S.J.; Turner, M.G. Environmental and social factors influencing wildfires in the Upper Midwest, United States. Ecol. Appl. 2001, 11, 111–127. [Google Scholar] [CrossRef]
- Prasad, V.K.; Badarinathb, K.V.S.; Eaturu, A. Biophysical and anthropogenic controls of forest fires in the Deccan Plateau, India. J. Environ. Manag. 2008, 86, 1–13. [Google Scholar] [CrossRef] [PubMed]
- Schoenberg, F.P.; Peng, R.; Huang, Z.J.; Rundel, P. Detection of non-linearities in the dependence of burn area on fuel age and climatic variables. Int. J. Wildland Fire 2003, 12, 1–6. [Google Scholar] [CrossRef]
- Cutler, D.R.; Edwards, T.C.; Beard, K.H.; Cutler, A.; Hess, K.T.; Gibson, J.; Lawler, J.J. Random forests for classification in ecology. Ecology 2007, 88, 2783–2792. [Google Scholar] [CrossRef] [PubMed]
- Breiman, L. Random forests. Mach. Learn. 2001, 45, 5–32. [Google Scholar] [CrossRef]
- Archibald, S.; Roy, D.P.; van Wilgen, B.W.; Scholes, R.J. What limits fire? An examination of drivers of burnt area in Southern Africa. Glob. Chang. Biol. 2009, 15, 613–630. [Google Scholar] [CrossRef]
- Oliveira, S.; Oehler, F.; San-Miguel-Ayanz, J.; Camia, A.; Pereira, J.M.C. Modeling spatial patterns of fire occurrence in Mediterranean Europe using Multiple Regression and Random Forest. For. Ecol. Manag. 2012, 275, 117–129. [Google Scholar] [CrossRef]
- Xu, H.C.; Li, Z.D.; Qiu, Y. Fire disturbance history in virgin forest in northern region of Daxinganling Mountatins. Acta Ecol. Sin. 1997, 17, 337–343. [Google Scholar]
- Chang, Y.; He, H.S.; Bishop, I.; Hu, Y.M.; Bu, R.C.; Xu, C.G.; Li, X. Long-term forest landscape responses to fire exclusion in the Great Xing’an Mountains, China. Int. J. Wildland Fire 2007, 16, 34–44. [Google Scholar] [CrossRef]
- Zhang, H.J.; Qi, P.C.; Guo, G.M. Improvement of fire danger modelling with geographically weighted logistic model. Int. J. Wildland Fire 2014, 23, 1130–1146. [Google Scholar] [CrossRef]
- Oliveira, S.; Pereira, J.M.C.; San-Miguel-Ayanz, J.; Lourenço, L. Exploring the spatial patterns of fire density in Southern Europe using Geographically Weighted Regression. Appl. Geogr. 2014, 51, 143–157. [Google Scholar] [CrossRef]
- Mundo, I.A.; Thorsten, W.; Rajapandian, K.; Thomas, K. Environmental drivers and spatial dependency in wildfire ignition patterns of northwestern Patagonia. J. Environ. Manag. 2013, 123, 77–87. [Google Scholar] [CrossRef] [PubMed]
- Heilongjiang Statistics Bureau. The Road of Revitalization: Thirty Years of Reform, Heilongjiang, 2009; China Statistics Press: Beijing, China, 2009.
- Maingi, J.K.; Henry, M.C. Factors influencing wildfire occurrence and distribution in eastern Kentucky, USA. Int. J. Wildland Fire 2007, 16, 23–33. [Google Scholar] [CrossRef]
- Martell, D.L.; Otukol, S.; Stocks, B.J. A logistic model for predicting daily people-caused forest fire occurrence in Ontario. Can. J. For. Res. 1987, 17, 394–401. [Google Scholar] [CrossRef]
- Vega-Garcia, C.; Woodard, T.; Adamowicz, W.L.; Lee, B. A logit model for predicting the daily occurence of human caused forest fires. Int. J. Wildland Fire 1995, 5, 101–111. [Google Scholar] [CrossRef]
- Duro, D.C.; Franklin, S.E.; Dube, M.G. Multi-scale object-based image analysis and feature selection of multi-sensor earth observation imagery using random forests. Int. J. Remote Sens. 2012, 33, 4502–4526. [Google Scholar] [CrossRef]
- Marston, C.G.; Danson, F.M.; Armitage, R.P.; Giraudoux, P.P.; Pleydell, D.R.J.; Wang, Q.; Qui, J.M.; Craig, P.S. A random forest approach for predicting the presence of Echinococcus multilocularis intermediate host Ochotona spp. presence in relation to landscape characteristics in western China. Appl. Geogr. 2014, 55, 176–183. [Google Scholar] [CrossRef] [PubMed]
- Abdel-Rahman, E.M.; Ahmed, F.B.; Ismail, R. Random forest regression and spectral band selection for estimating sugarcane leaf nitrogen concentration using EO-1Hyperion hyperspectral data. Int. J. Remote Sens. 2013, 34, 712–728. [Google Scholar] [CrossRef]
- Perdiguero-Alonso, D.; Montero, F.E.; Kostadinova, A.; Raga, J.A.; Barrett, J. Random forests, a novel approach for discrimination of fish populations using parasites as biological tags. Int. J. Parasitol. 2008, 38, 1425–1434. [Google Scholar] [CrossRef] [PubMed]
- Gromping, U. Variable importance assessment in regression: Linear regression versus random forest. Am. Stat. 2009, 63, 308–319. [Google Scholar] [CrossRef]
- Genuer, R.; Poggi, J.M.; Tuleau-Malot, C. Variable selection using random forests. Pattern Recognit. Lett. 2010, 31, 2225–2236. [Google Scholar] [CrossRef]
- Swets, J.A. Measuring the accuracy of diagnostic systems. Science 1988, 240, 1285–1293. [Google Scholar] [CrossRef] [PubMed]
- Jimenez-Valverde, A. Insights into the area under the receiver operating characteristic curve (AUC) as a discrimination measure in species distribution modeling. Glob. Ecol. Biogeogr. 2012, 21, 498–507. [Google Scholar] [CrossRef]
- Del Hoyo, V.L.; Isabel, M.P.M.; Vega, F.J.M. Logistic regression models for human-caused wildfire risk estimation: Analyzing the effect of the spatial accuracy in fire occurrence data. Eur. J. For. Res. 2011, 130, 983–996. [Google Scholar] [CrossRef]
- Stephens, S.L. Forest fire causes and extent on United States Forest Service lands. Int. J. Wildland Fire 2005, 14, 213–222. [Google Scholar] [CrossRef]
- Daily Climate Data Set of China International Exchange Station, China Meteorological Data and Sharing Network. Available online: http://data.cma.cn/site/index.html (accessed on 15 May 2016).
- Geographic Information Resources Service. National Administration of Surveying, Mapping and Geo-information of China. 2002. Available online: http://www.webmap.cn/main.do?method=index (accessed on 15 May 2016).
- Ran, Y.H.; Li, X. Plant Functional Types Map in China. Cold and Arid Regions Science Data Center at Lanzhou, 2011. Available online: http://westdc.westgis.ac.cn/ (accessed on 15 May 2016).
- Anonymous. The Local Chronicles of Forest Fire Prevention of Daxing’an Mountains; Heilongjiang People’s Press: Haerbin, China, 2005. [Google Scholar]
- Anonymous. The Road of Revitalization-Thirty Years of Reform; Statistics Press: Beijing, China, 2009. [Google Scholar]


| Sample | Model Type | Cut-off | Prediction Accuracy (%) | |
|---|---|---|---|---|
| Training Data | Validation | |||
| Sample1 | LR/RF | 0.61/0.59 | 63.5/71.0 | 53.8/69.6 |
| Sample2 | LR/RF | 0.61/0.59 | 60.8/68.3 | 64.5/66.8 |
| Sample3 | LR/RF | 0.58/0.65 | 60.3/69.4 | 59.2/68.5 |
| Sample4 | LR/RF | 0.62/0.62 | 61.5/72.6 | 53.6/71.3 |
| Sample5 | LR/RF | 0.59/0.57 | 58.8/70.3 | 58.1/67.4 |
| Complete dataset | LR/RF | 0.60/0.59 | 60.8/70.1 | |
| Variable | Mean Decrease in Accuracy (%IncMSE) |
|---|---|
| Dis_railway | 87.6660 |
| Dis_sett | 66.2240 |
| Forest_type | 61.3847 |
| Dis_road | 36.4337 |
| Variables Identified by Intermediate Models | Parameter Estimation | ||||||
|---|---|---|---|---|---|---|---|
| Variable | p-Value (min) | p-Value (max) | Significant Samples | Coefficients | Standard Error | Wald Test | p-Value |
| Forest_type | <0.0001 | 0.007 | 5 | 2.419 | 0.550 | 19.357 | <0.0001 |
| Dis_railway | 0.008 | 0.073 | 3 | −0.00005 | 0.00002 | 21.563 | 0.008 |
| Dis_road | 0.005 | 0.005 | 1 | -- | -- | -- | -- |
| Dis_sett | 0.003 | 0.003 | 1 | -- | -- | -- | - |
© 2016 by the authors; licensee MDPI, Basel, Switzerland. This article is an open access article distributed under the terms and conditions of the Creative Commons Attribution (CC-BY) license (http://creativecommons.org/licenses/by/4.0/).
Share and Cite
Guo, F.; Zhang, L.; Jin, S.; Tigabu, M.; Su, Z.; Wang, W. Modeling Anthropogenic Fire Occurrence in the Boreal Forest of China Using Logistic Regression and Random Forests. Forests 2016, 7, 250. https://doi.org/10.3390/f7110250
Guo F, Zhang L, Jin S, Tigabu M, Su Z, Wang W. Modeling Anthropogenic Fire Occurrence in the Boreal Forest of China Using Logistic Regression and Random Forests. Forests. 2016; 7(11):250. https://doi.org/10.3390/f7110250
Chicago/Turabian StyleGuo, Futao, Lianjun Zhang, Sen Jin, Mulualem Tigabu, Zhangwen Su, and Wenhui Wang. 2016. "Modeling Anthropogenic Fire Occurrence in the Boreal Forest of China Using Logistic Regression and Random Forests" Forests 7, no. 11: 250. https://doi.org/10.3390/f7110250